Adipose Tissue from Lean and Obese Mice Induces a Mesenchymal to Epithelial Transition-Like Effect in Triple Negative Breast Cancers Cells Grown in 3-Dimensional Culture


Abstract
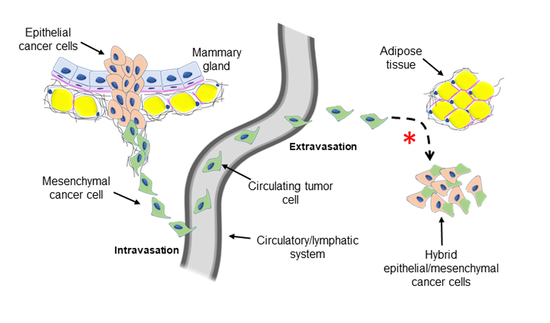
1. Introduction
2. Results
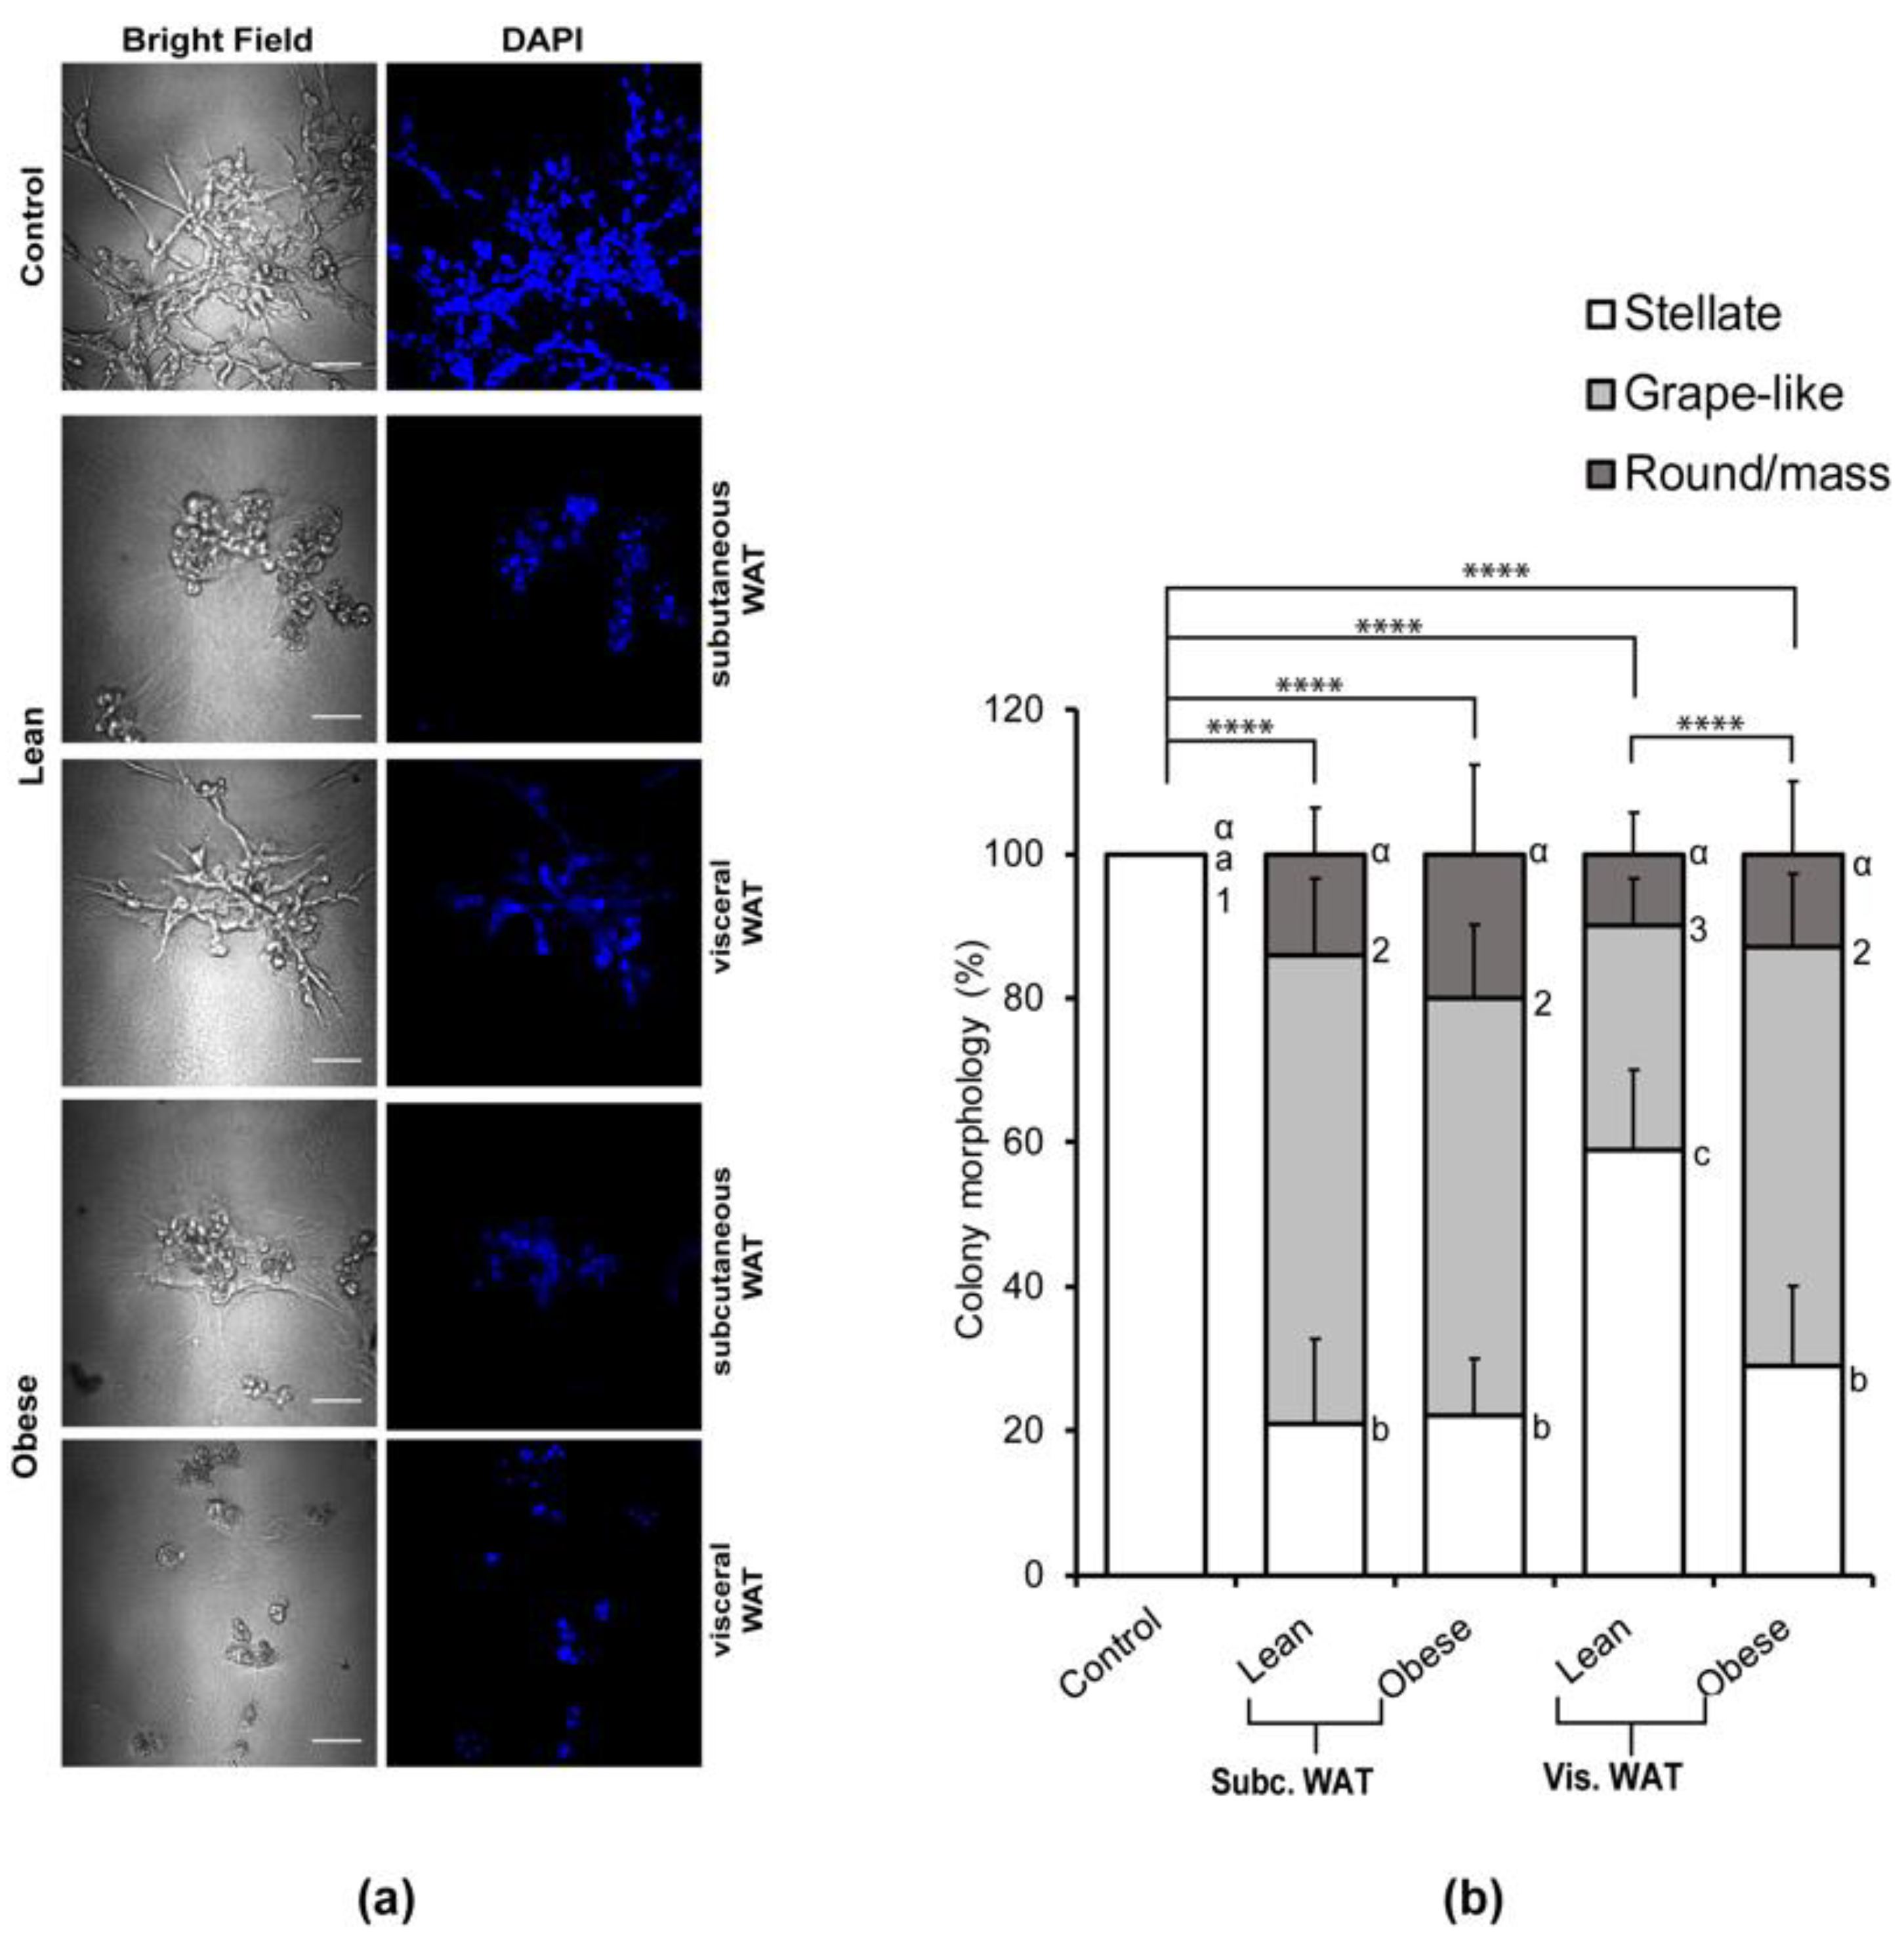
2.1. Lean and Obese White Adipose Tissue Causes Mesenchymal MDA-MB-231 TNBC Cells Grown in 3D Culture to Acquire an Epithelial-Like Morphology
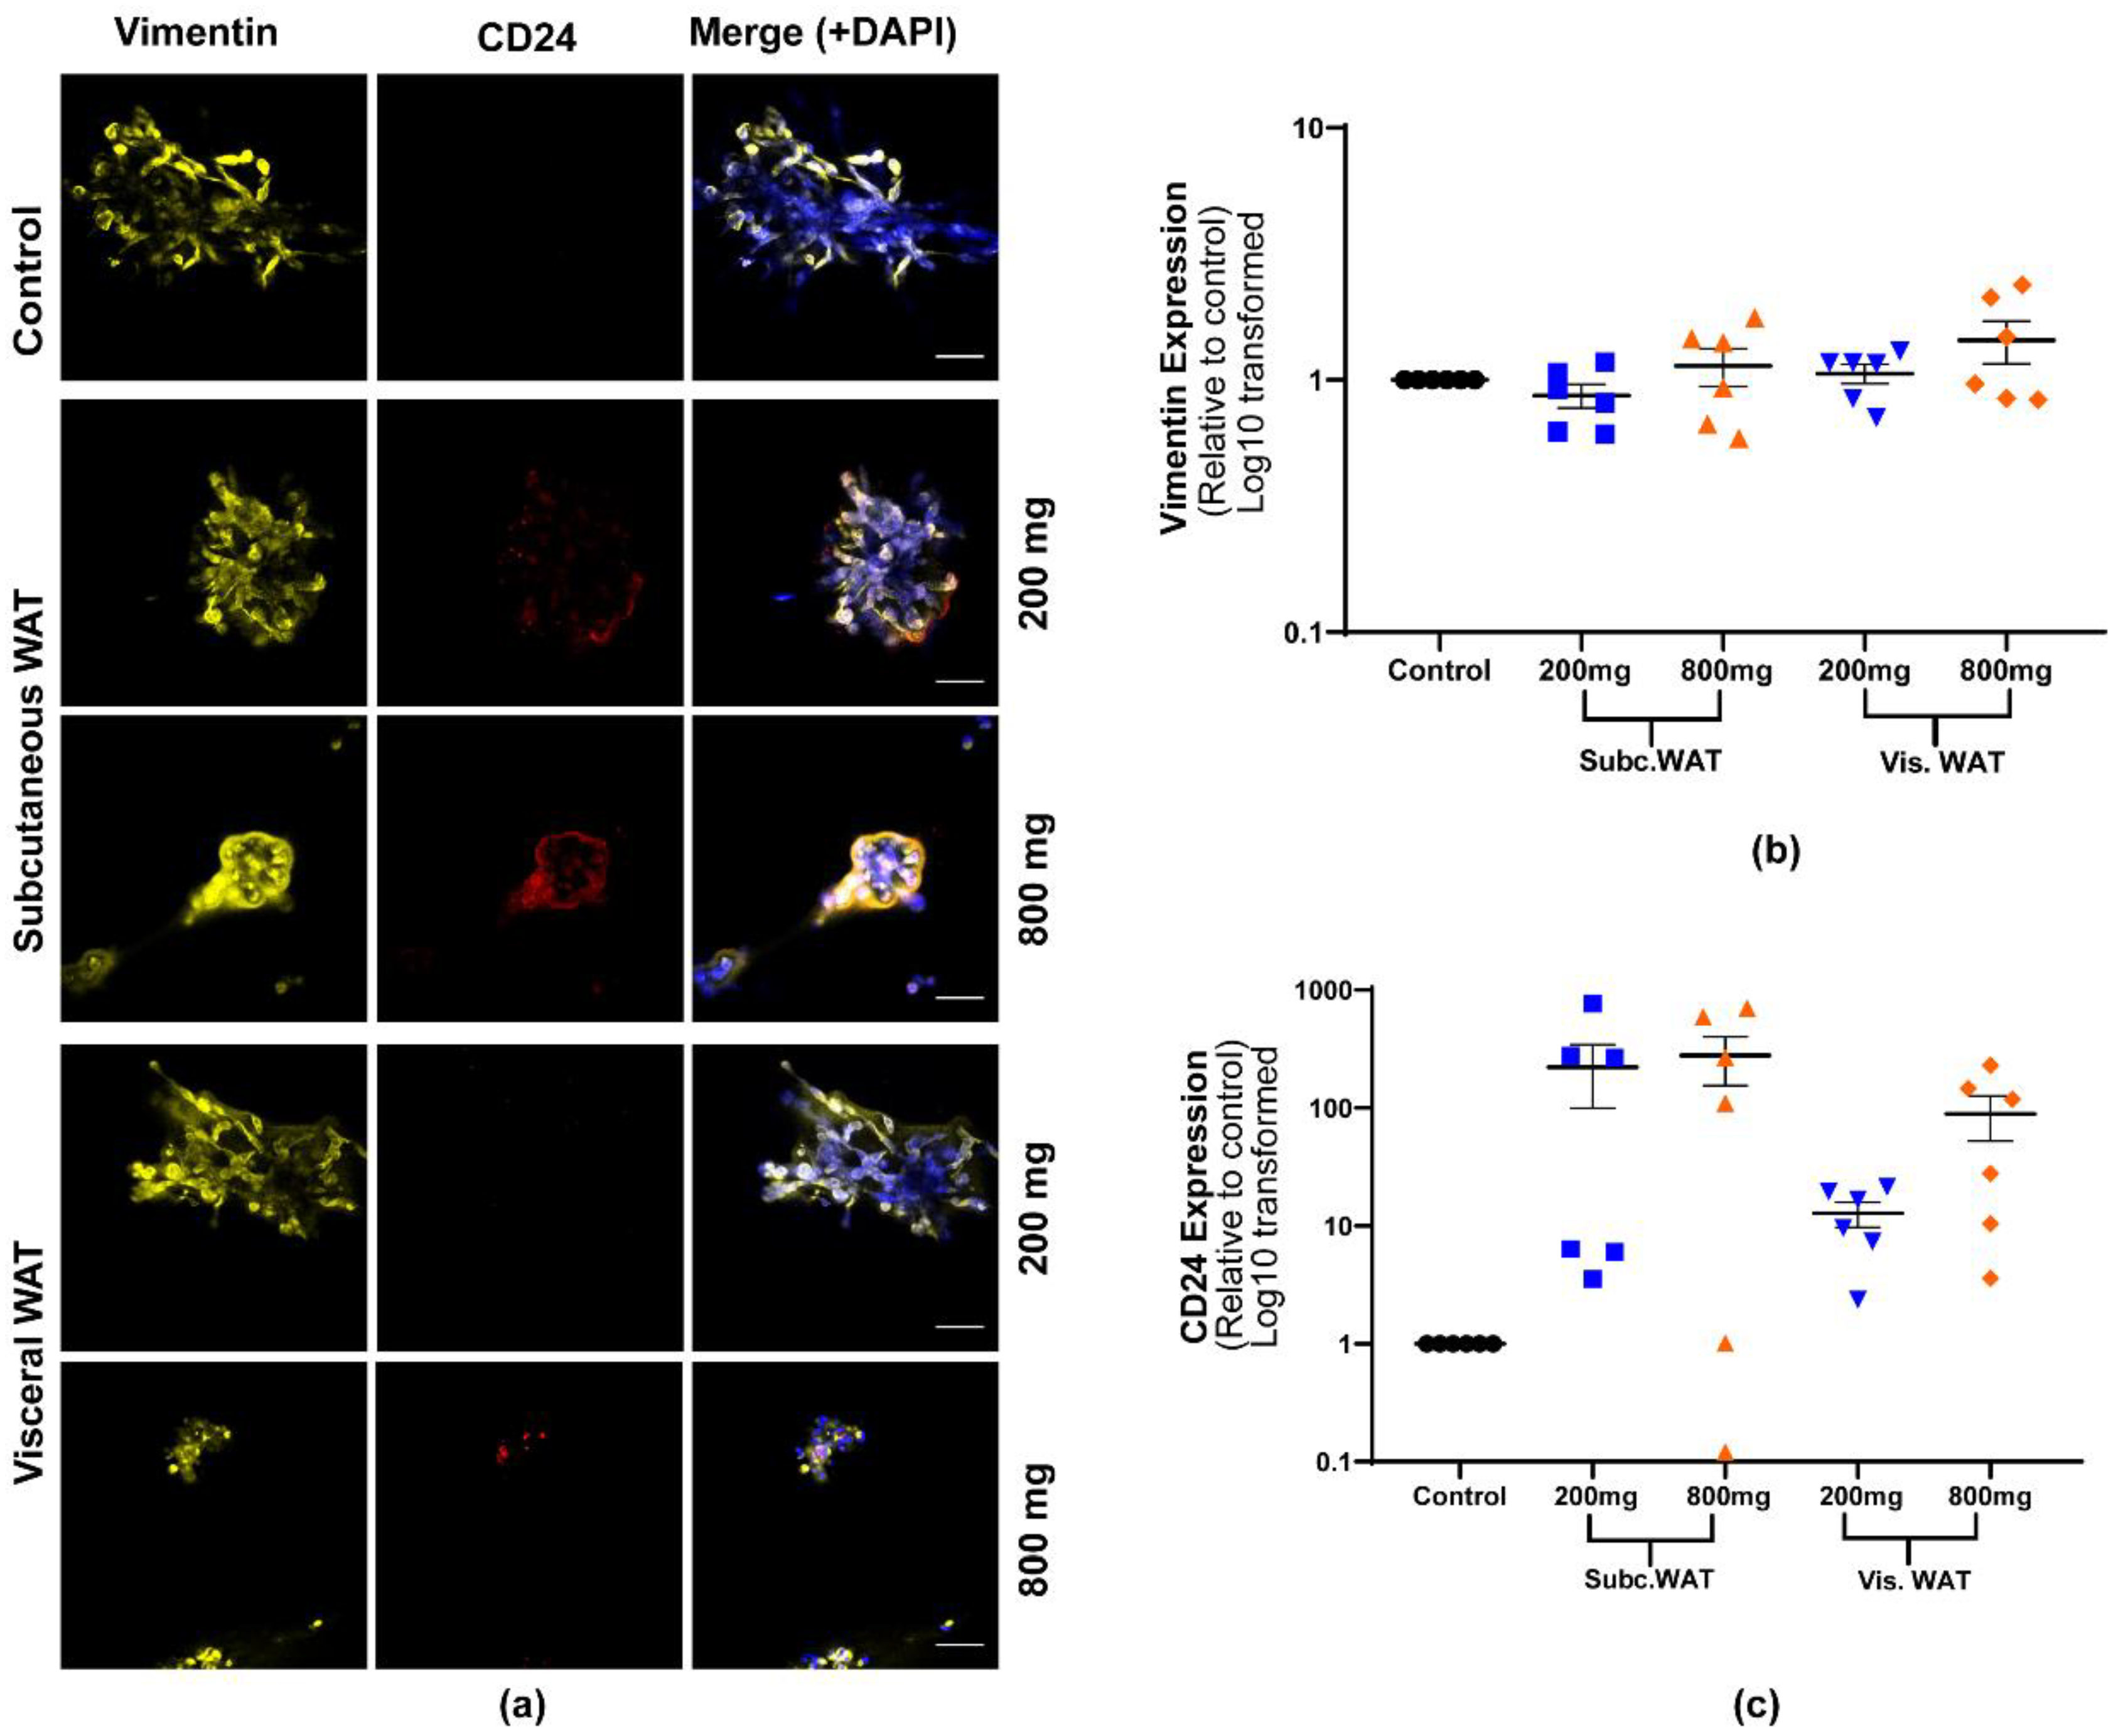
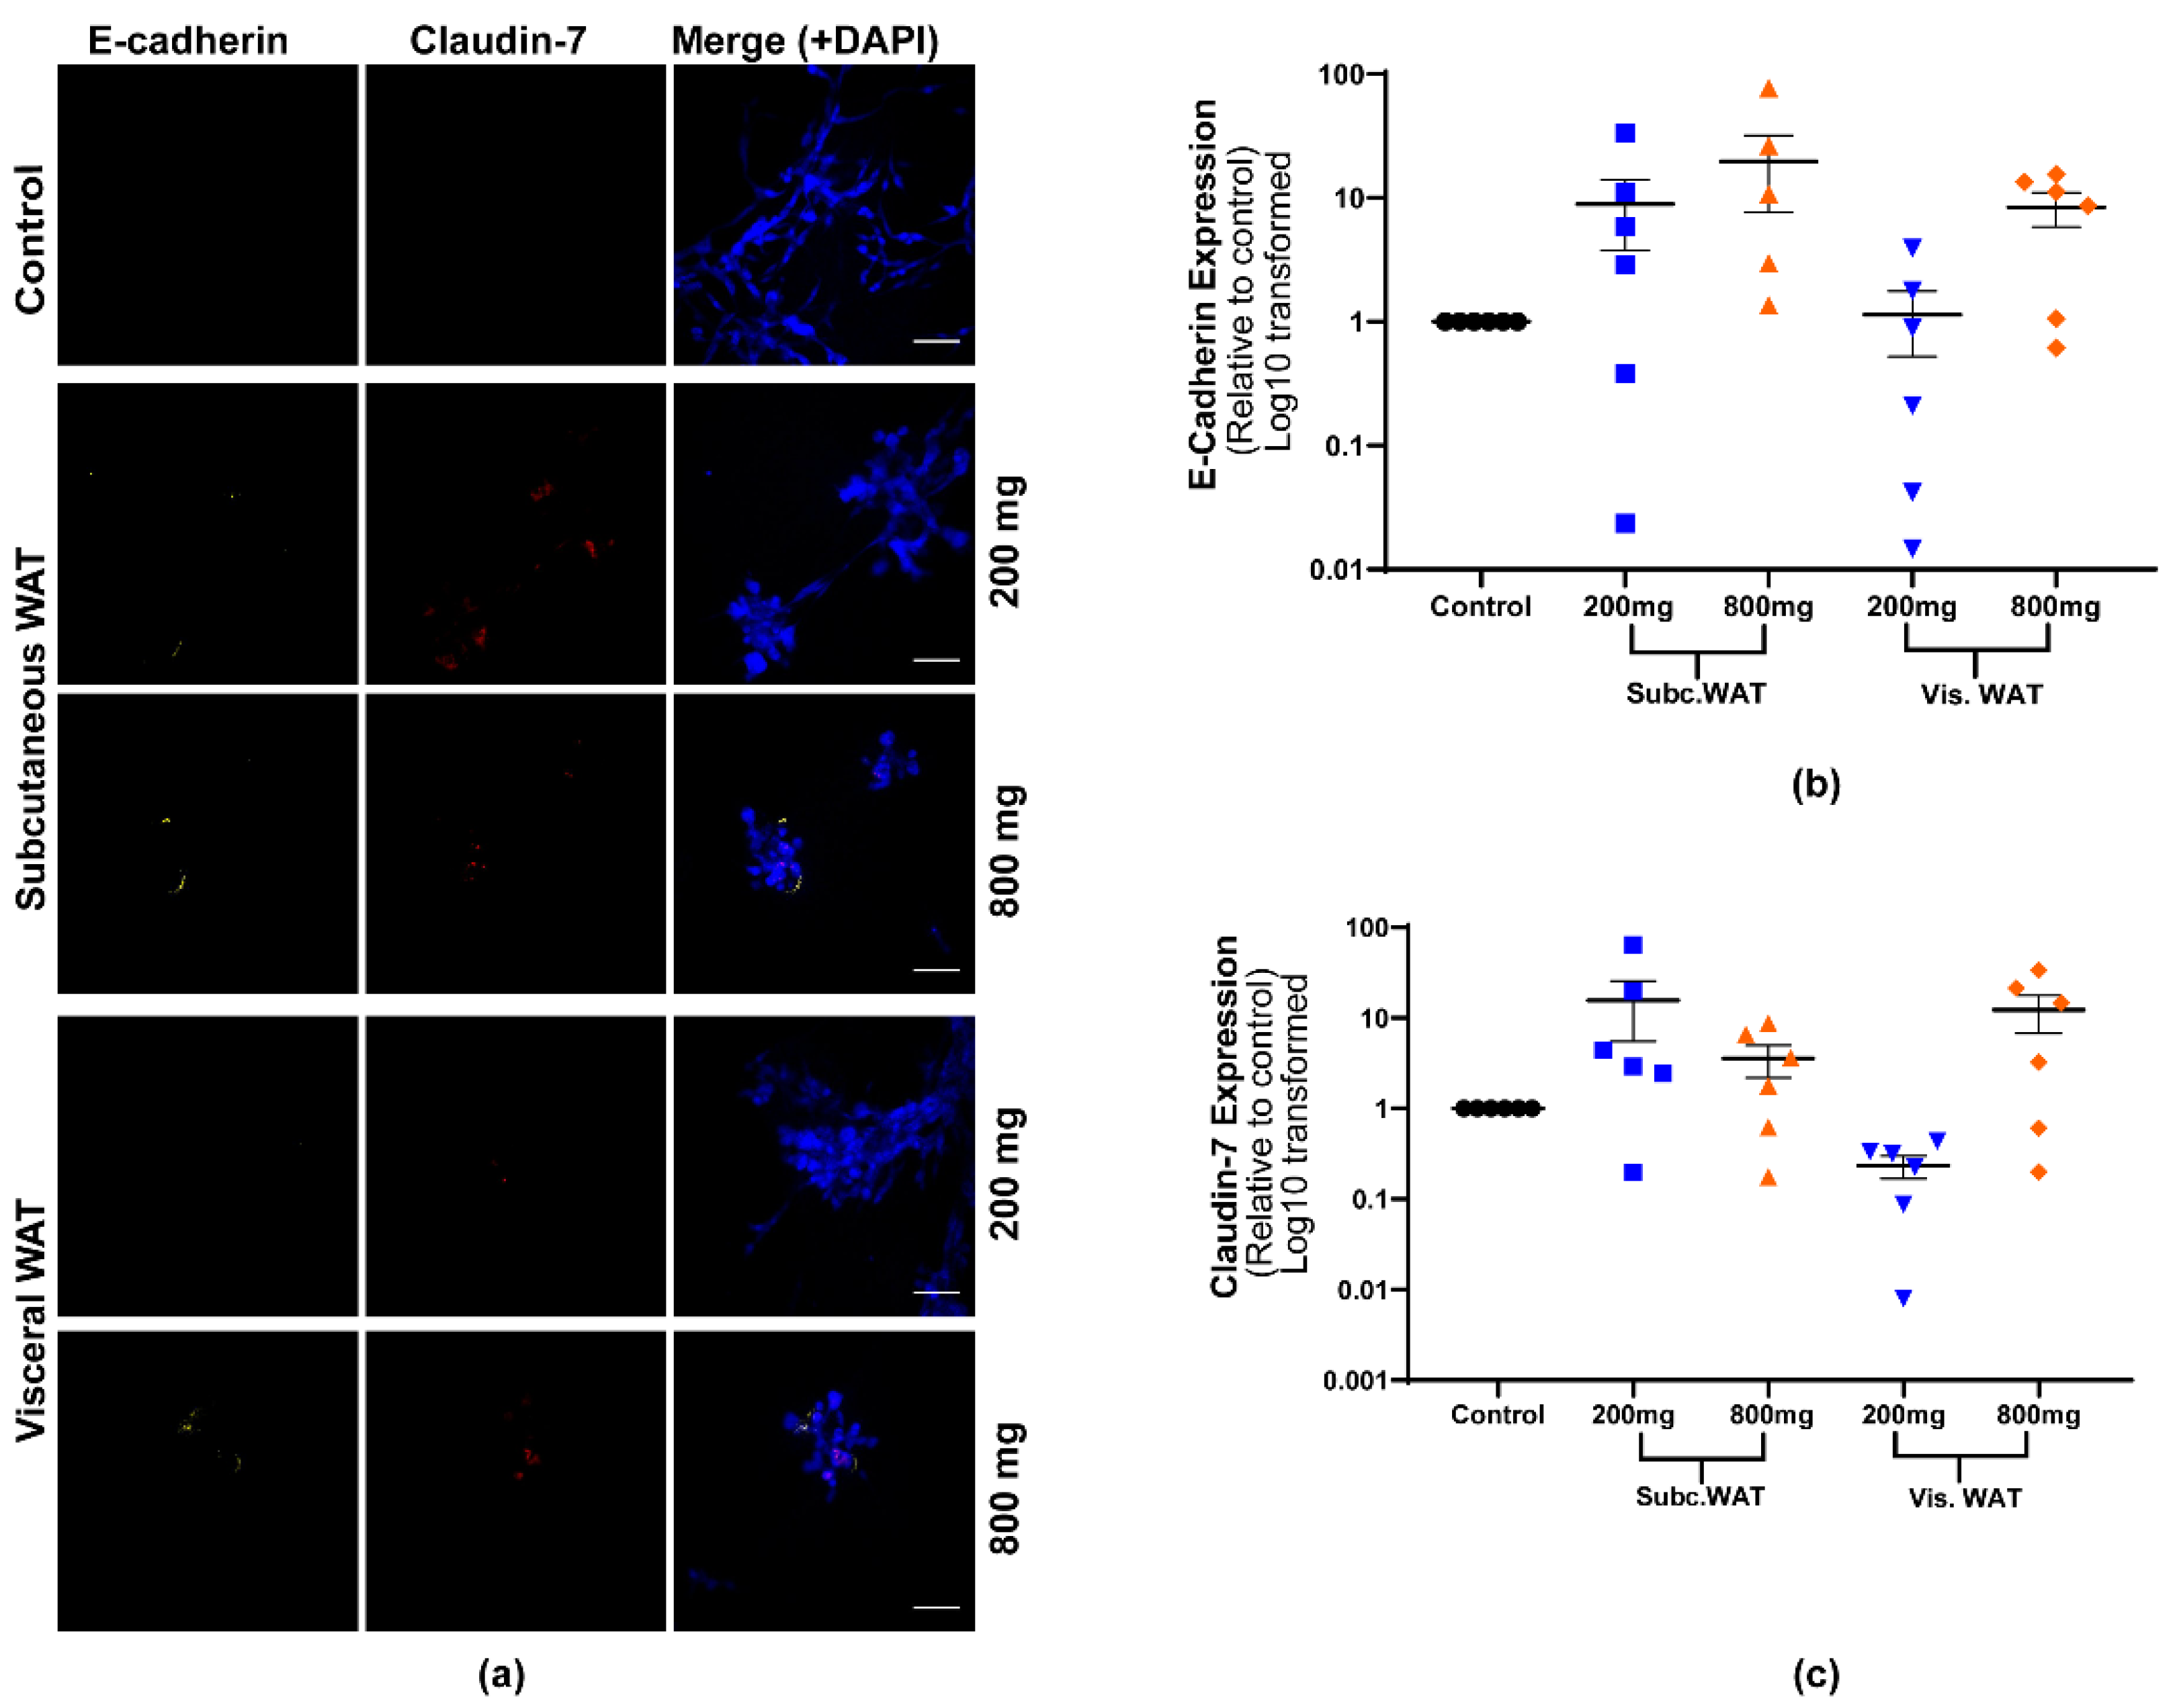
2.2. Lean and Obese White Adipose Tissue Induces Epithelial Biomarker Expression and Maintenance of Mesenchymal Biomarker Expression
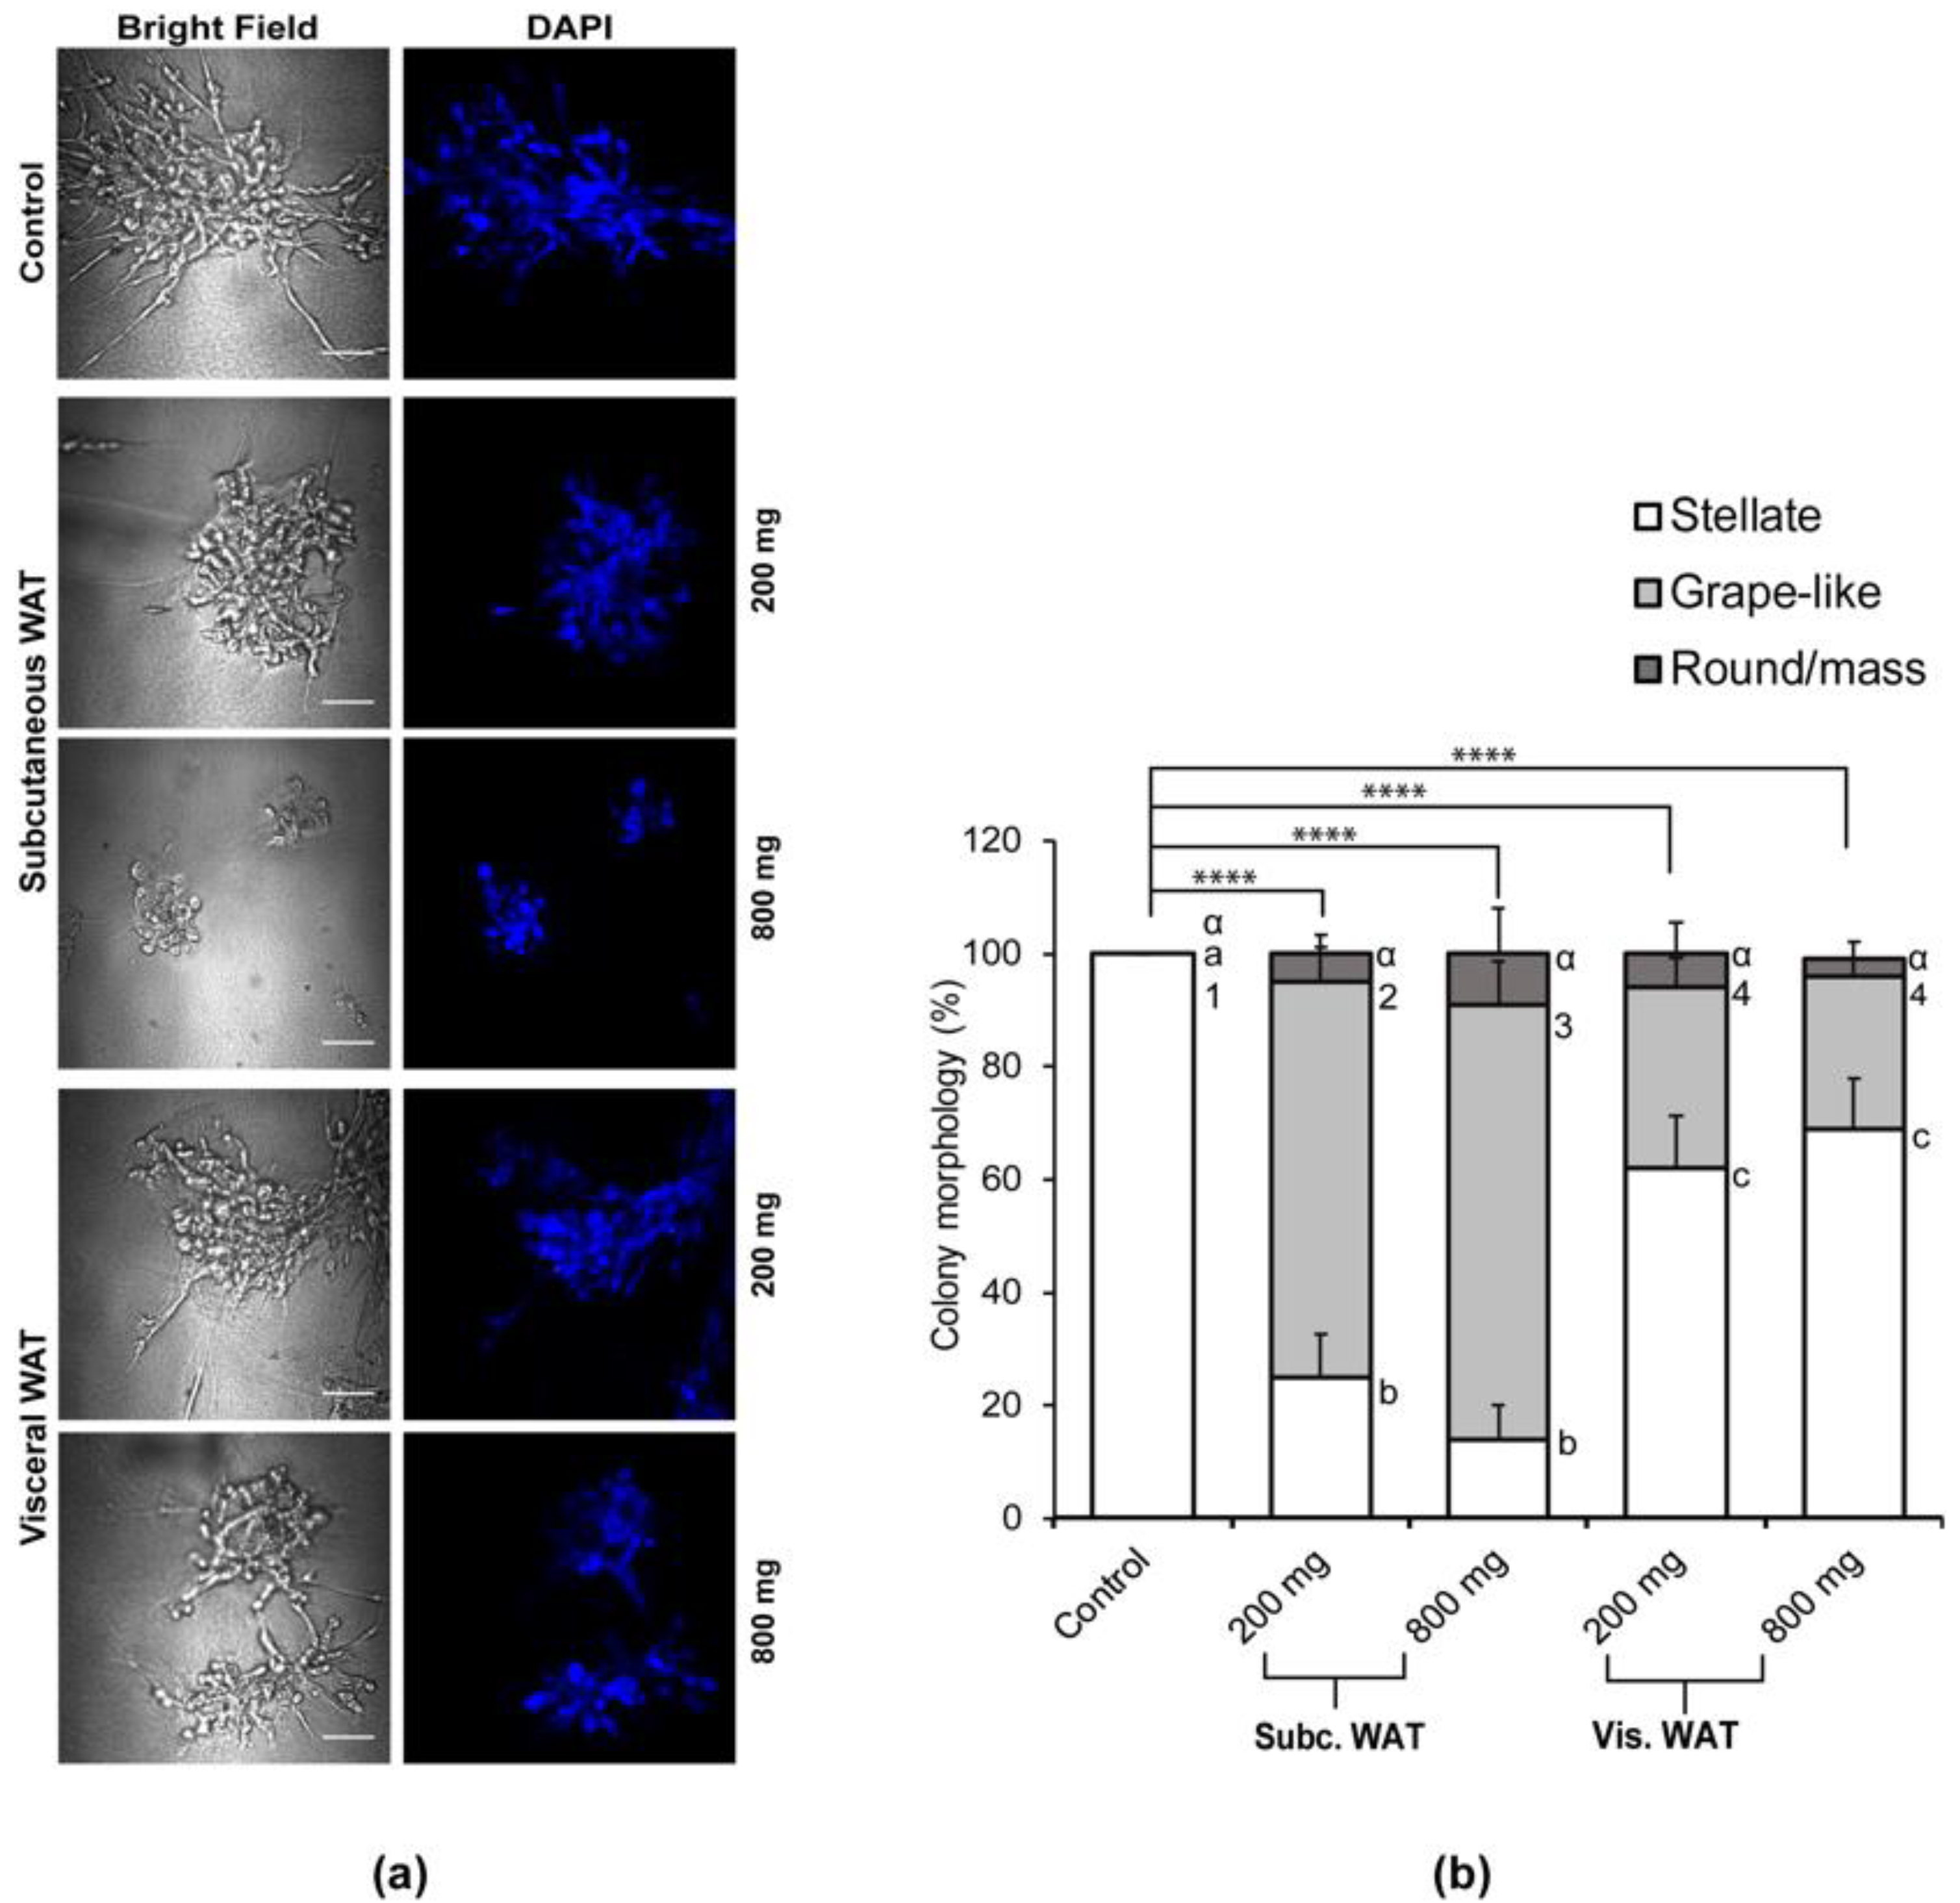
2.3. MET-Like Changes Induced by WAT-CM from Obese Mice in MDA-MB-231 Cells Is Not Dependent on the Quantity of Adipose Tissue
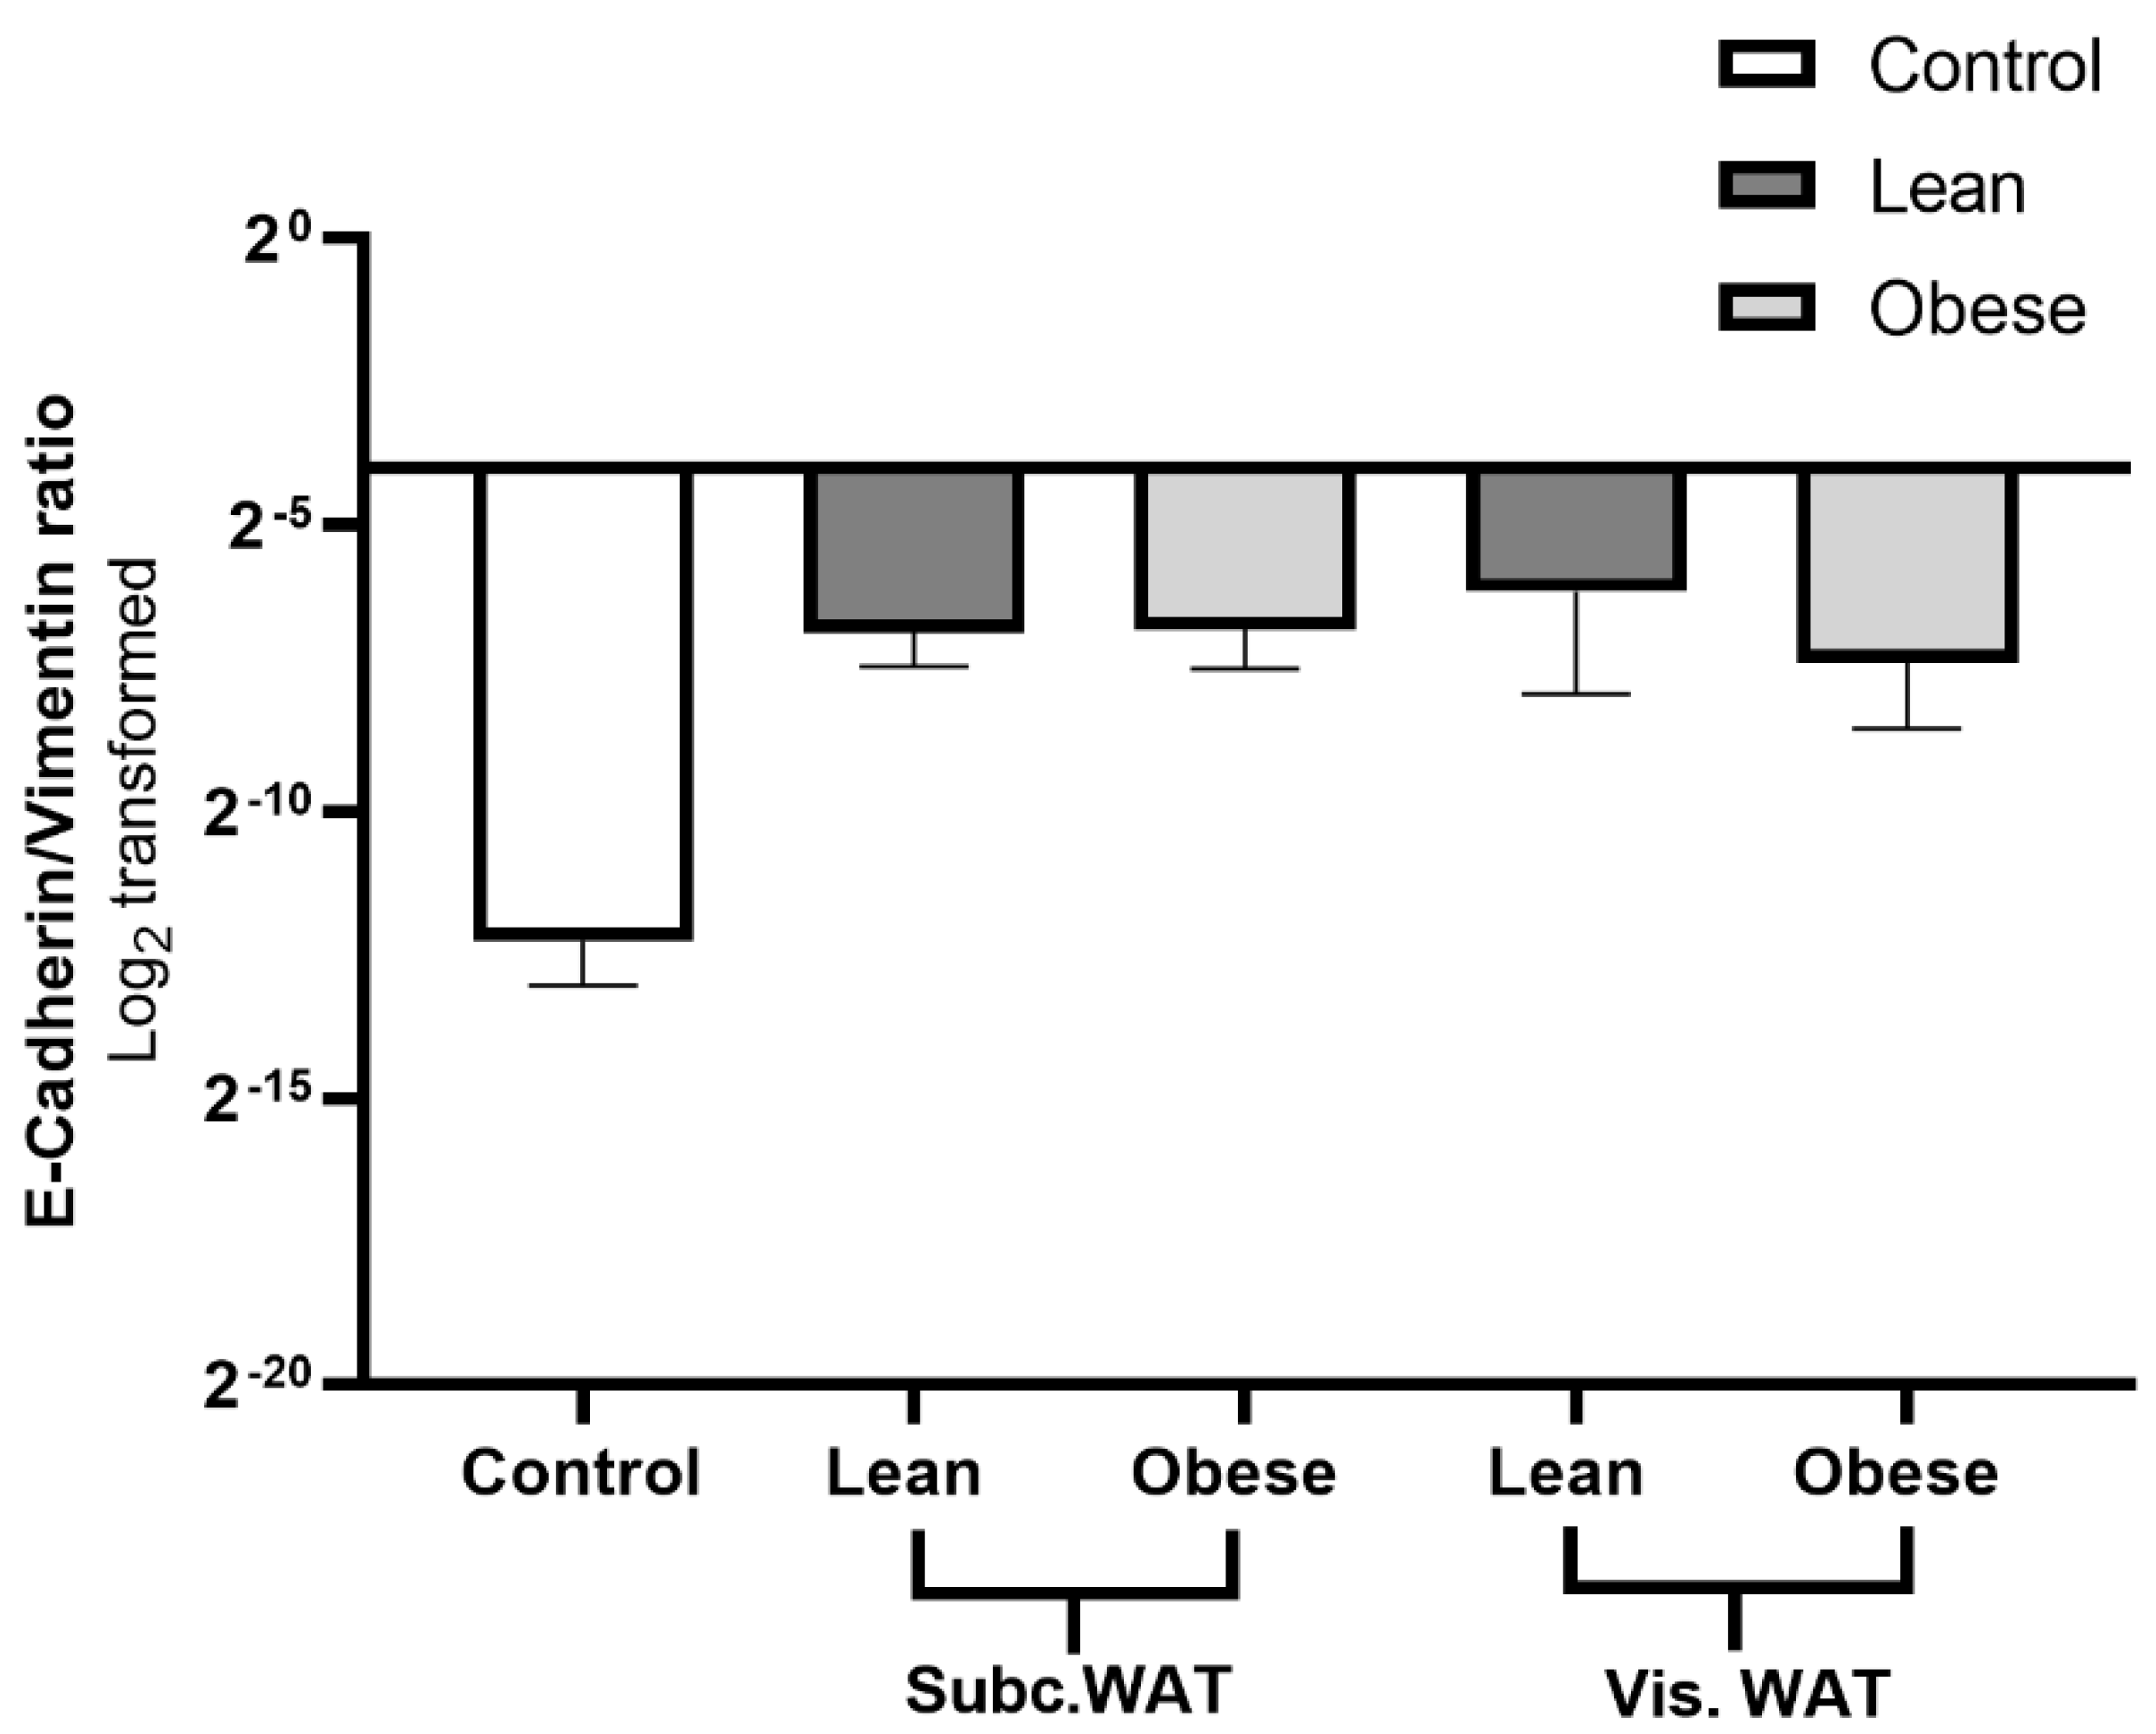
2.4. Assessment of Hybrid Mesenchymal/Epithelial Phenotype Status of WAT-CM Treated MDA-MB-231 Cells
3. Discussion
4. Materials and Methods
4.1. Cell Line
4.2. Animal Care and Experimentation
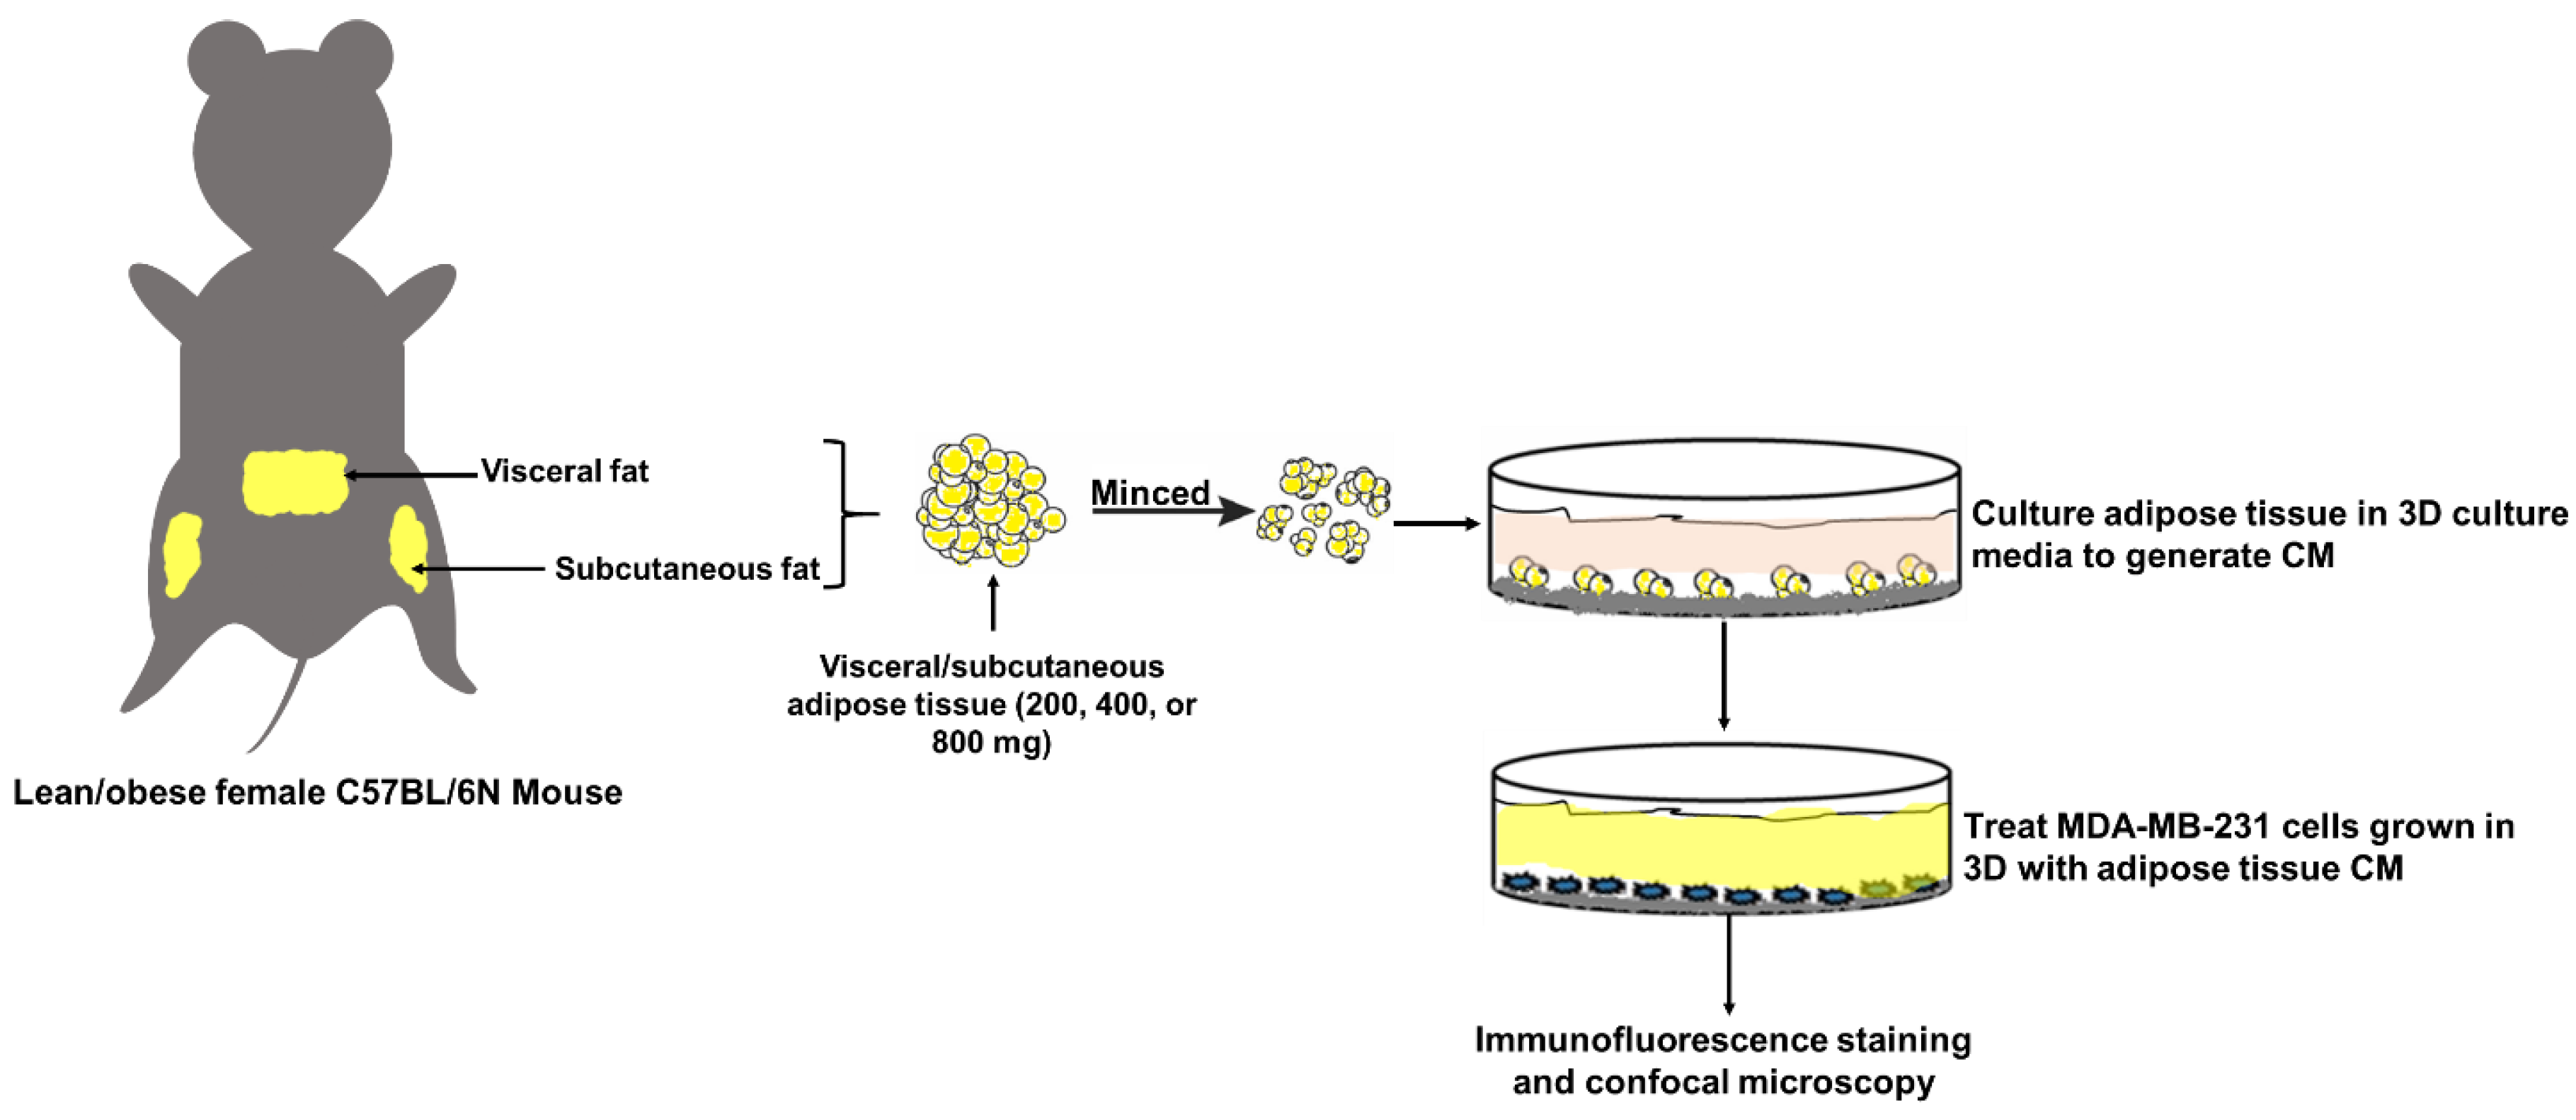
4.3. Organotypic Culture of White Adipose Tissue
4.4. Three-Dimensional (3D) Culture
4.5. Immunofluorescence (IF) Staining
4.6. Image Analysis
4.7. Determination of the E-Cadherin/Vimentin Ratio of WAT-CM Treated MDA-MB-231 Cells
4.8. Statistical Analysis
5. Conclusions
Supplementary Materials
Author Contributions
Funding
Acknowledgments
Conflicts of Interest
Abbreviations
| 3D | 3-dimensional |
| BC | Breast cancer |
| CM | Conditioned media |
| DIO | Diet-induced obesity |
| EMT | Epithelial-to-mesenchymal transition |
| HFD | High-fat diet |
| IntDen | Integrated density |
| LFD | Low-fat diet |
| MET | Mesenchymal-to-Epithelial transition |
| TNBC | Triple negative breast cancer |
| WAT | White adipose tissue |
References
- Bray, F.; Ferlay, J.; Soerjomataram, I.; Siegel, R.L.; Torre, L.A.; Jemal, A. Global cancer statistics 2018: GLOBOCAN estimates of incidence and mortality worldwide for 36 cancers in 185 countries. CA Cancer J. Clin. 2018, 68, 394–424. [Google Scholar] [CrossRef]
- Torre, L.A.; Bray, F.; Siegel, R.L.; Ferlay, J.; Lortet-Tieulent, J.; Jemal, A. Global cancer statistics, 2012. CA Cancer J. Clin. 2015, 65, 87–108. [Google Scholar] [CrossRef]
- Protani, M.M.; Coory, M.; Martin, J.H. Effect of obesity on survival of women with breast cancer: Systematic review and meta-analysis. Breast Cancer Res. Treat. 2010, 123, 627–635. [Google Scholar] [CrossRef]
- Chan, D.S.M.; Norat, T. Obesity and Breast Cancer: Not Only a Risk Factor of the Disease. Curr. Treat. Options Oncol. 2015, 16, 22. [Google Scholar] [CrossRef]
- Haakinson, D.J.; Leeds, S.G.; Dueck, A.C.; Gray, R.J.; Wasif, N.; Stucky, C.-C.H.; Northfelt, D.W.; Apsey, H.A.; Pockaj, B.A. The Impact of Obesity on Breast Cancer: A Retrospective Review. Ann. Surg. Oncol. 2012, 19, 3012–3018. [Google Scholar] [CrossRef]
- Pierobon, M.; Frankenfeld, C.L. Obesity as a risk factor for triple-negative breast cancers: A systematic review and meta-analysis. Breast Cancer Res. Treat. 2012, 137, 307–314. [Google Scholar] [CrossRef]
- James, F.; Wootton, S.; Jackson, A.; Wiseman, M.; Copson, E.; Cutress, R. Obesity in breast cancer—What is the risk factor? Eur. J. Cancer 2015, 51, 705–720. [Google Scholar] [CrossRef]
- Horowitz, N.S.; Wright, A.A. Impact of obesity on chemotherapy management and outcomes in women with gynecologic malignancies. Gynecol. Oncol. 2015, 138, 201–206. [Google Scholar] [CrossRef]
- Studebaker, A.W.; Storci, G.; Werbeck, J.L.; Sansone, P.; Kate, S.A.; Tavolari, S.; Huang, T.; Chan, M.; Marini, F.C.; Rosol, T.J.; et al. Fibroblasts Isolated from Common Sites of Breast Cancer Metastasis Enhance Cancer Cell Growth Rates and Invasiveness in an Interleukin-6-Dependent Manner. Cancer Res. 2008, 68, 9087–9095. [Google Scholar] [CrossRef]
- Patanaphan, V.; Salazar, O.M.; Risco, R. Breast cancer: Metastatic patterns and their prognosis. South. Med. J. 1988, 81, 1109–1112. [Google Scholar] [CrossRef]
- Malatesta, M.F.D.; Chiarito, A.; Bianciardi, F.; Fiorelli, M.; Ligato, A.; Naso, G.; Pecorella, I. Metastases to extraocular muscles from breast cancer: Case report and up-to-date review of the literature. BMC Cancer 2019, 19, 36. [Google Scholar] [CrossRef]
- Gilbert, B.; Cordova, L.Z.; Eaton, A. Metastatic breast cancer masquerading as a renal malignancy: A literature review and case report. Urol. Case Rep. 2019, 24, 100859. [Google Scholar] [CrossRef] [PubMed]
- Rocha, M.; Azevedo, D.; Teira, A.L.; Barbosa, M. Not everything is as it seems: A rare form of metastatic breast cancer. Autops. Case Rep. 2019, 9, e2018085. [Google Scholar] [CrossRef]
- Al-Zawi, A.S.A.; Lazarevska, A.; Omer, M.M.; Tan, E.; Asaad, A.; Sathananthan, S. Metastatic Breast Cancer to the Cervix Presenting with Abnormal Vaginal Bleeding During Chemotherapy: A Case Report and Literature Review. Chirurgia 2018, 113, 564–570. [Google Scholar] [CrossRef]
- Chaffer, C.L.; Weinberg, R.A. A Perspective on Cancer Cell Metastasis. Science 2011, 331, 1559–1564. [Google Scholar] [CrossRef]
- Li, W.; Kang, Y. Probing the Fifty Shades of EMT in Metastasis. Trends Cancer 2016, 2, 65–67. [Google Scholar] [CrossRef]
- Kennecke, H.; Yerushalmi, R.; Woods, R.; Cheang, M.C.U.; Voduc, D.; Speers, C.H.; Nielsen, T.O.; Gelmon, K. Metastatic Behavior of Breast Cancer Subtypes. J. Clin. Oncol. 2010, 28, 3271–3277. [Google Scholar] [CrossRef]
- Jolly, M.K.; Boareto, M.; Huang, B.; Jia, D.; Lu, M.; Ben-Jacob, E.; Onuchic, J.N.; Levine, H. Implications of the Hybrid Epithelial/Mesenchymal Phenotype in Metastasis. Front. Oncol. 2015, 5, 155. [Google Scholar] [CrossRef]
- Baranwal, S.; Alahari, S.K. Molecular mechanisms controlling E-cadherin expression in breast cancer. Biochem. Biophys. Res. Commun. 2009, 384, 6–11. [Google Scholar] [CrossRef]
- Akhtari, M.; Mansuri, J.; Newman, K.A.; Guise, T.M.; Seth, P. Biology of breast cancer bone metastasis. Cancer Boil. Ther. 2007, 7, 3–9. [Google Scholar] [CrossRef]
- Cecchini, M.G.; Wetterwald, A.; Van Der Pluijm, G.; Thalmann, G.N. Molecular and Biological Mechanisms of Bone Metastasis. EAU Updat. Ser. 2005, 3, 214–226. [Google Scholar] [CrossRef]
- Cheung, K.J.; Ewald, A.J. A collective route to metastasis: Seeding by tumor cell clusters. Science 2016, 352, 167–169. [Google Scholar] [CrossRef] [PubMed]
- Yang, Y.; Zheng, H.; Zhan, Y.; Fan, S. An emerging tumor invasion mechanism about the collective cell migration. Am. J. Transl. Res. 2019, 11, 5301–5312. [Google Scholar] [PubMed]
- Huang, R.Y.-J.; Wong, M.K.; Tan, T.Z.; Kuay, K.T.; Ng, A.H.C.; Chung, V.Y.; Chu, Y.-S.; Matsumura, N.; Lai, H.-C.; Lee, Y.F.; et al. An EMT spectrum defines an anoikis-resistant and spheroidogenic intermediate mesenchymal state that is sensitive to e-cadherin restoration by a src-kinase inhibitor, saracatinib (AZD0530). Cell Death Dis. 2013, 4, e915. [Google Scholar] [CrossRef]
- Jie, X.-X.; Zhang, X.; Xu, C.-J. Epithelial-to-mesenchymal transition, circulating tumor cells and cancer metastasis: Mechanisms and clinical applications. Oncotarget 2017, 8, 81558–81571. [Google Scholar] [CrossRef]
- Nieman, K.M.; Romero, I.L.; Van Houten, B.; Lengyel, E. Adipose tissue and adipocytes support tumorigenesis and metastasis. Biochim. Biophys. Acta (BBA) Bioenerg. 2013, 1831, 1533–1541. [Google Scholar] [CrossRef]
- Cleary, M.; Grossmann, M.E. Minireview: Obesity and breast cancer: The estrogen connection. Endocrinology 2009, 150, 2537–2542. [Google Scholar] [CrossRef]
- Pavelka, M.; Roth, J. White Adipose Tissue. In Functional Ultrastructure; Springer: Berlin/Heidelberg, Germany, 2010; pp. 290–291. [Google Scholar]
- Tornatore, L.; Thotakura, A.K.; Bennett, J.; Moretti, M.; Franzoso, G. The nuclear factor kappa B signaling pathway: Integrating metabolism with inflammation. Trends Cell Boil. 2012, 22, 557–566. [Google Scholar] [CrossRef]
- Picon-Ruiz, M.; Morata-Tarifa, C.; Valle-Goffin, J.J.; Friedman, E.R.; Slingerland, J. Obesity and adverse breast cancer risk and outcome: Mechanistic insights and strategies for intervention. CA Cancer J. Clin. 2017, 67, 378–397. [Google Scholar] [CrossRef]
- Pallegar, N.K.; Garland, C.J.; Mahendralingam, M.; Viloria-Petit, A.M.; Christian, S.L. A Novel 3-Dimensional Co-culture Method Reveals a Partial Mesenchymal to Epithelial Transition in Breast Cancer Cells Induced by Adipocytes. J. Mammary Gland. Boil. Neoplasia 2018, 24, 85–97. [Google Scholar] [CrossRef]
- Kenny, P.A.; Lee, G.Y.; Myers, C.A.; Neve, R.M.; Semeiks, J.R.; Spellman, P.T.; Lorenz, K.; Lee, E.H.; Barcellos-Hoff, M.H.; Petersen, O.W.; et al. The morphologies of breast cancer cell lines in three-dimensional assays correlate with their profiles of gene expression. Mol. Oncol. 2007, 1, 84–96. [Google Scholar] [CrossRef] [PubMed]
- Lamouille, S.; Xu, J.; Derynck, R. Molecular mechanisms of epithelial–mesenchymal transition. Nat. Rev. Mol. Cell Boil. 2014, 15, 178–196. [Google Scholar] [CrossRef] [PubMed]
- Goossens, G.H. The Metabolic Phenotype in Obesity: Fat Mass, Body Fat Distribution, and Adipose Tissue Function. Obes. Facts 2017, 10, 207–215. [Google Scholar] [CrossRef]
- Gong, Z.; Agalliu, I.; Lin, D.W.; Stanford, J.L.; Kristal, A.R. Obesity is associated with increased risks of prostate cancer metastasis and death after initial cancer diagnosis in middle-aged men. Cancer 2007, 109, 1192–1202. [Google Scholar] [CrossRef] [PubMed]
- Sohrabi, A. Recurrence of breast cancer. Obesity, tumor size, and axillary lymph node metastases. JAMA 1980, 244, 264–265. [Google Scholar] [CrossRef]
- Kaviani, A.; Neishaboury, M.; Mohammadzadeh, N.; Ansari-Damavandi, M.; Jamei, K. Effects of obesity on presentation of breast cancer, lymph node metastasis and patient survival: A retrospective review. Asian Pac. J. Cancer Prev. 2013, 14, 2225–2229. [Google Scholar] [CrossRef][Green Version]
- Bousquenaud, M.; Fico, F.; Solinas, G.; Rüegg, C.; Santamaria-Martínez, A. Obesity promotes the expansion of metastasis-initiating cells in breast cancer. Breast Cancer Res. 2018, 20, 104. [Google Scholar] [CrossRef]
- Park, S.-M.; Gaur, A.B.; Lengyel, E.; Peter, M.E. The miR-200 family determines the epithelial phenotype of cancer cells by targeting the E-cadherin repressors ZEB1 and ZEB2. Genes Dev. 2008, 22, 894–907. [Google Scholar] [CrossRef]
- Schliekelman, M.J.; Taguchi, A.; Zhu, J.; Dai, X.; Rodriguez, J.; Celiktas, M.; Zhang, Q.; Chin, A.; Wong, C.-H.; Wang, H.; et al. Molecular portraits of epithelial, mesenchymal, and hybrid States in lung adenocarcinoma and their relevance to survival. Cancer Res. 2015, 75, 1789–1800. [Google Scholar] [CrossRef]
- George, J.T.; Jolly, M.K.; Xu, S.; Somarelli, J.A.; Levine, H. Survival Outcomes in Cancer Patients Predicted by a Partial EMT Gene Expression Scoring Metric. Cancer Res. 2017, 77, 6415–6428. [Google Scholar] [CrossRef]
- Schoettl, T.; Fischer, I.P.; Ussar, S. Heterogeneity of adipose tissue in development and metabolic function. J. Exp. Boil. 2018, 221, jeb162958. [Google Scholar] [CrossRef] [PubMed]
- Wang, Q.A.; Scherer, P.E.; Gupta, R.K. Improved methodologies for the study of adipose biology: Insights gained and opportunities ahead. J. Lipid Res. 2014, 55, 605–624. [Google Scholar] [CrossRef] [PubMed]
- Peinado, J.R.; Pardo, M.; De La Rosa, O.; Malagon, M.M. Proteomic characterization of adipose tissue constituents, a necessary step for understanding adipose tissue complexity. Proteomics 2012, 12, 607–620. [Google Scholar] [CrossRef] [PubMed]
- Zha, J.-M.; Di, W.J.; Zhu, T.; Xie, Y.; Yu, J.; Liu, J.; Chen, P.; Ding, G. Comparison of gene transcription between subcutaneous and visceral adipose tissue in Chinese adults. Endocr. J. 2009, 56, 935–944. [Google Scholar] [CrossRef]
- Gil, Á.; Olza, J.; Gil-Campos, M.; Gomez-Llorente, C.; Aguilera, C.M. Is adipose tissue metabolically different at different sites? Pediatr. Obes. 2011, 6, 13–20. [Google Scholar] [CrossRef]
- Billon, N.; Dani, C. Developmental Origins of the Adipocyte Lineage: New Insights from Genetics and Genomics Studies. Stem Cell Rev. Rep. 2011, 8, 55–66. [Google Scholar] [CrossRef]
- Spaderna, S.; Schmalhofer, O.; Hlubek, F.; Jung, A.; Kirchner, T.; Brabletz, T. Epithelial-mesenchymal and mesenchymal-epithelial transitions during cancer progression. Verh. Dtsch. Ges. Pathol. 2007, 91, 21–28. [Google Scholar]
- Gunasinghe, N.P.A.D.; Wells, A.; Thompson, E.W.; Hugo, H. Mesenchymal–epithelial transition (MET) as a mechanism for metastatic colonisation in breast cancer. Cancer Metastasis Rev. 2012, 31, 469–478. [Google Scholar] [CrossRef]
- Ràfols, M.E. Adipose tissue: Cell heterogeneity and functional diversity. Endocrinol. Nutr. (Engl. Ed.) 2014, 61, 100–112. [Google Scholar] [CrossRef]
- Palen, K.; Weber, J.; Dwinell, M.B.; Johnson, B.D.; Ramchandran, R.; Gershan, J.A. E-cadherin re-expression shows in vivo evidence for mesenchymal to epithelial transition in clonal metastatic breast tumor cells. Oncotarget 2016, 7, 43363–43375. [Google Scholar] [CrossRef]
- Yao, D.; Dai, C.; Peng, S. Mechanism of the Mesenchymal-Epithelial Transition and Its Relationship with Metastatic Tumor Formation. Mol. Cancer Res. 2011, 9, 1608–1620. [Google Scholar] [CrossRef] [PubMed]
- Wells, A.; Yates, C.; Shepard, C.R. E-cadherin as an indicator of mesenchymal to epithelial reverting transitions during the metastatic seeding of disseminated carcinomas. Clin. Exp. Metastasis 2008, 25, 621–628. [Google Scholar] [CrossRef]
- Martin, T.A.; Ye, L.; Sanders, A.J.; Lane, J.; Jiang, W.G. Cancer invasion and metastasis: Molecular and cellular perspective. In Madame Curie Bioscience Database [Internet]; Landes Bioscience: Austin, TX, USA, 2013. [Google Scholar]
- Kanai, Y.; Ushijima, S.; Hui, A.M.; Ochiai, A.H.; Tsuda, H.; Sakamoto, M.; Hirohashi, S. The E-cadherin gene is silenced by CpG methylation in human hepatocellular carcinomas. Int. J. Cancer 1997, 71, 355–359. [Google Scholar] [CrossRef]
- Hiraguri, S.; Godfrey, T.; Nakamura, H.; Graff, J.; Collins, C.; Shayesteh, L.; Doggett, N.; Johnson, K.; Wheelock, M.; Herman, J.; et al. Mechanisms of inactivation of E-cadherin in breast cancer cell lines. Cancer Res. 1998, 58, 1972–1977. [Google Scholar] [PubMed]
- Lester, R.D.; Jo, M.; Montel, V.; Takimoto, S.; Gonias, S.L. uPAR induces epithelial–mesenchymal transition in hypoxic breast cancer cells. J. Cell Boil. 2007, 178, 425–436. [Google Scholar] [CrossRef] [PubMed]
- Tahara, R.K.; Brewer, T.M.; Theriault, R.L.; Ueno, N.T. Bone Metastasis of Breast Cancer. In Breast Cancer Metastasis and Drug Resistance; Springer: Berlin/Heidelberg, Germany, 2019; pp. 105–129. [Google Scholar]
- Li, Y.; Meng, Y.; Yu, X. The Unique Metabolic Characteristics of Bone Marrow Adipose Tissue. Front. Endocrinol. 2019, 10, 69. [Google Scholar] [CrossRef]
- Craft, C.S.; Scheller, E.L. Evolution of the Marrow Adipose Tissue Microenvironment. Calcif. Tissue Int. 2016, 100, 461–475. [Google Scholar] [CrossRef]
- Schneider, C.A.; Rasband, W.S.; Eliceiri, K.W. NIH Image to ImageJ: 25 years of image analysis. Nat. Methods 2012, 9, 671–675. [Google Scholar] [CrossRef]


© 2020 by the authors. Licensee MDPI, Basel, Switzerland. This article is an open access article distributed under the terms and conditions of the Creative Commons Attribution (CC BY) license (http://creativecommons.org/licenses/by/4.0/).
Share and Cite
Asante, E.C.; Pallegar, N.K.; Hoffmann, A.J.; Viloria-Petit, A.M.; Christian, S.L. Adipose Tissue from Lean and Obese Mice Induces a Mesenchymal to Epithelial Transition-Like Effect in Triple Negative Breast Cancers Cells Grown in 3-Dimensional Culture. Int. J. Mol. Sci. 2020, 21, 6439. https://doi.org/10.3390/ijms21176439
Asante EC, Pallegar NK, Hoffmann AJ, Viloria-Petit AM, Christian SL. Adipose Tissue from Lean and Obese Mice Induces a Mesenchymal to Epithelial Transition-Like Effect in Triple Negative Breast Cancers Cells Grown in 3-Dimensional Culture. International Journal of Molecular Sciences. 2020; 21(17):6439. https://doi.org/10.3390/ijms21176439
Chicago/Turabian StyleAsante, Emmanuel C., Nikitha K. Pallegar, Alica J. Hoffmann, Alicia M. Viloria-Petit, and Sherri L. Christian. 2020. "Adipose Tissue from Lean and Obese Mice Induces a Mesenchymal to Epithelial Transition-Like Effect in Triple Negative Breast Cancers Cells Grown in 3-Dimensional Culture" International Journal of Molecular Sciences 21, no. 17: 6439. https://doi.org/10.3390/ijms21176439
APA StyleAsante, E. C., Pallegar, N. K., Hoffmann, A. J., Viloria-Petit, A. M., & Christian, S. L. (2020). Adipose Tissue from Lean and Obese Mice Induces a Mesenchymal to Epithelial Transition-Like Effect in Triple Negative Breast Cancers Cells Grown in 3-Dimensional Culture. International Journal of Molecular Sciences, 21(17), 6439. https://doi.org/10.3390/ijms21176439