Article

Downregulation of TAP1 in Tumor-Free Tongue Contralateral to Squamous Cell Carcinoma of the Oral Tongue, an Indicator of Better Survival

1
Department of Clinical Sciences/ENT, Umeå University, SE-901 85 Umeå, Sweden
2
Department of Medical Biosciences, Umeå University, SE-901 85 Umeå, Sweden
3
RECAMO, Masaryk Memorial Cancer Institute, Zluty kopec 7, 656 53 Brno, Czech Republic
4
Institut de Génétique Moléculaire, Université Paris 7, Inserm UMR 1162, 750 13 Paris, France
*
Author to whom correspondence should be addressed.
Int. J. Mol. Sci. 2020, 21(17), 6220; https://doi.org/10.3390/ijms21176220
Submission received: 1 July 2020 / Revised: 25 August 2020 / Accepted: 26 August 2020 / Published: 27 August 2020

Abstract

:
Oral cancers are surrounded by epithelium that histologically might seem normal, but genetically has aberrations. In patients with squamous cell carcinoma of the oral tongue (SCCOT), it is therefore important to study not only the tumor but also the clinically tumor-free contralateral tongue tissue that remains in the patient after treatment to map changes of prognostic and/or diagnostic value. The transporter associated with antigen processing (TAP) dimer is a key factor in the process of activating cytotoxic T cells. By downregulating the expression of TAP, tumor cells can escape cytotoxic T cell recognition. Biopsies from tumor and clinically tumor-free contralateral tongue tissue in 21 patients with SCCOT were analyzed together with tongue biopsies from 14 healthy individuals, which served as the control group. Dividing patients into TAP1-high and TAP1-low groups according to the median TAP1 level in tumor-free samples showed that patients with lower TAP1 mRNA levels in tumor-free samples had better overall (p = 0.003) and disease-free survival (p = 0.002). The results showing that TAP1 levels in tumor-free tongue tissue contralateral to the SCCOT correlate with survival is an important contribution to early diagnosis and follow up of SCCOT.

1. Introduction

In Sweden, approximately 160 new cases of squamous cell carcinoma of the tongue (SCCOT) are detected annually, making it the most frequent tumor in the oral cavity. Despite advances in various treatment modalities resulting in improved local control, the long-term survival rates of patients with SCCOT has only marginally improved [1]. More than one-third of these tumors have regional lymph node metastasis already at diagnosis, significantly reducing the survival [2]. There is thus a great need to explore novel biomarkers enabling detection of tumors prior to clinical manifestation.
In 1953 Slaughter et al. introduced the field cancerization model, showing that oral cancers are surrounded by epithelium that is not unaffected by the cancerous development. When surgically removing an oral cancer, seemingly benign epithelium preconditioned to develop into cancer is accordingly left behind [3]. This could help explain the high incidence of local recurrence and multiple second primary tumors seen in patients with SCCOT and other types of squamous cell carcinoma of the head and neck (SCCHN). Fifty years later, genetically altered fields in the case of intraoral SCC can be detected as far as 7 cm from the tumor, implying that, although clinically normal, the main part of the oral cavity is affected by genetic alterations [4]. Recently, it has been suggested to consider field cancerization as representing an altered microenvironment rather than purely genetic alterations [5]. In the case of SCCOT, it can thus be of value to study not only the tumor itself but also the clinically tumor-free adjacent tongue tissue in order to map changes indicative of a tumor, novel or relapse, before any clinical signs are present.
Our own recent studies of clinically tumor-free tongue tissue contralateral to the SCCOT showed increased cytolytic T cell activity compared to normal tongue from volunteers with no evidence of SCCOT [6]. This cytolytic activity is a measure of cytotoxic proteins released by CD8+ T cells and NK cells, important players in the adaptive and innate immune responses, respectively [7].
A key factor in the process of cytotoxic T cell activation is the TAP1/TAP2 peptide transporter complex that brings antigen peptide substrates into the endoplasmic reticulum, where they are processed and loaded onto major histocompatibility class I (MHC-I) for export to the cell surface via the Golgi apparatus [8,9,10]. By downregulating the expression of transporter associated with antigen processing, TAP, causing loss of MHC I complexes on the surface, tumor cells can escape cytotoxic T cell recognition [11]. Mutations affecting TAP1 are frequently seen in human tumors and metastatic tumors more often show loss of function of TAP than primary tumors [11,12]. In addition, viruses such as human papilloma virus, HPV, cytomegalovirus, CMV, and Epstein Barr virus, EBV, downregulate TAP1 to avoid immune surveillance [11].
Based on our previous findings of an increased cytolytic activity in tumor-free tongue tissue contralateral to an SCCOT [6] remaining in the patient after treatment, we focused on TAP expression in these tissues.

2. Results

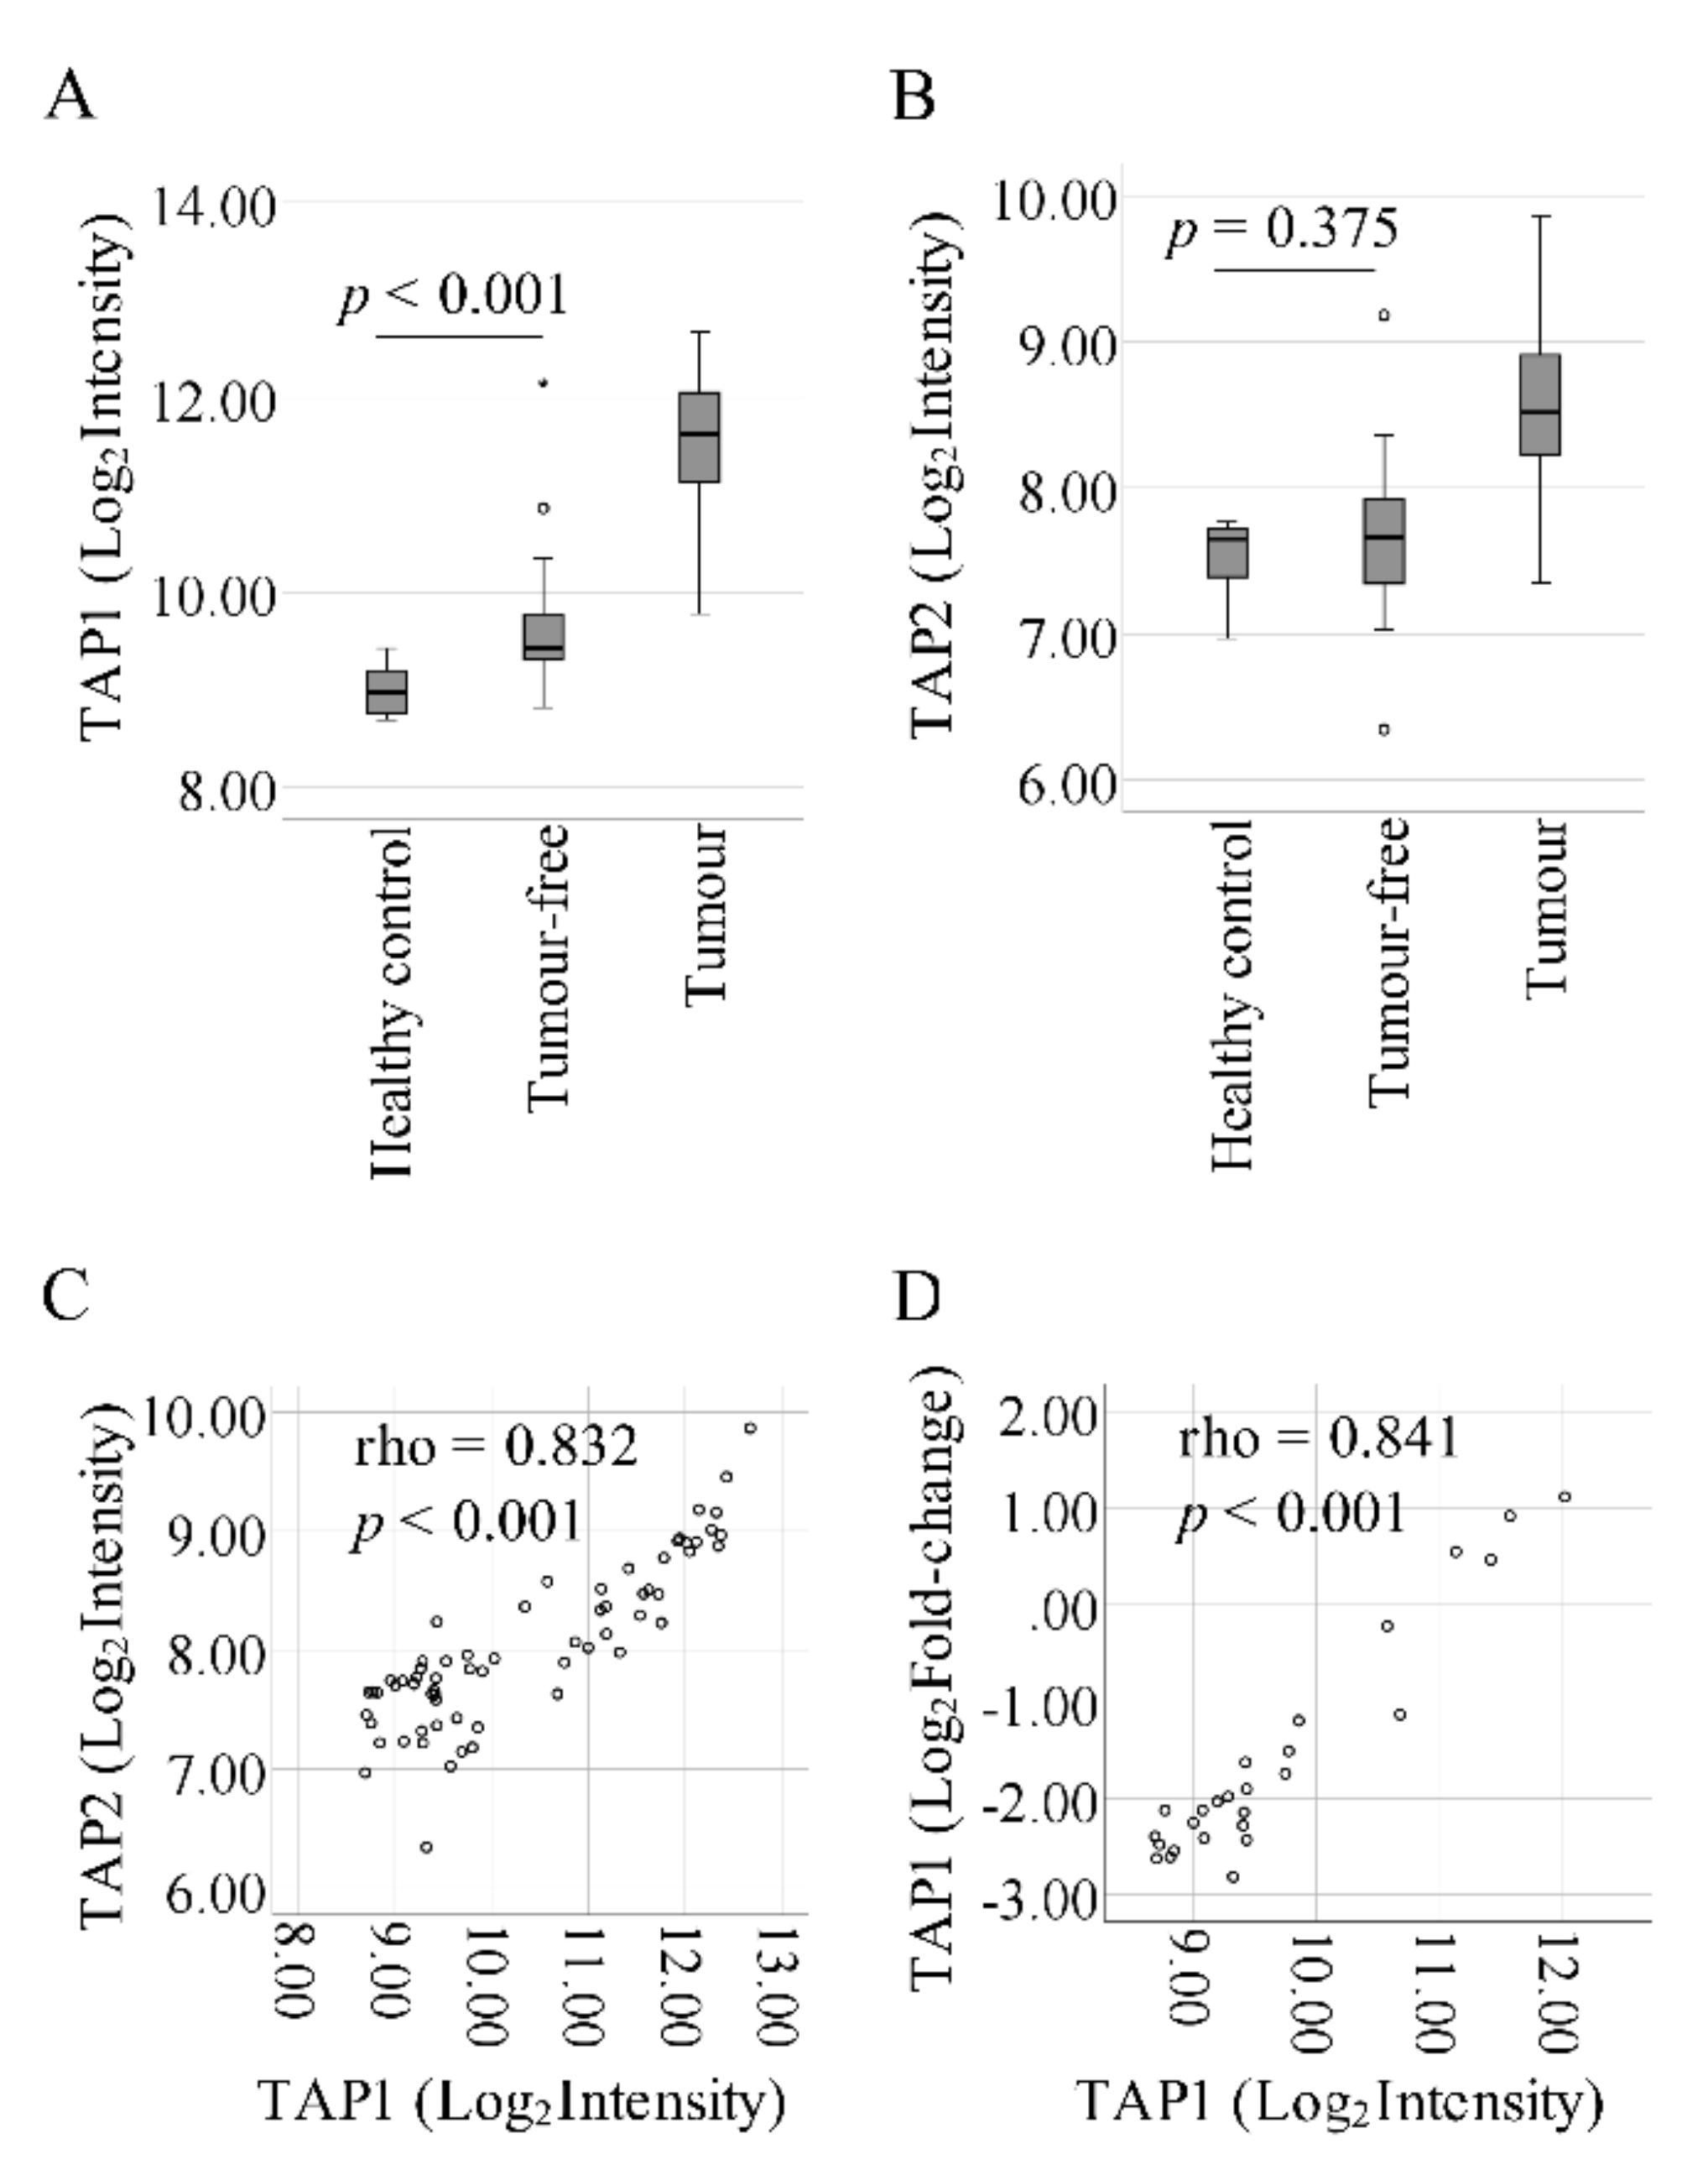
2.1. Progressive Upregulation of TAP1 from Control to Tumor-Free to Tumor

Analysis of previously published microarray results [6,13] showed that TAP1 mRNA is significantly upregulated in tumor-free tongue compared to healthy controls (fold change = 1.65), and further upregulated in tumor samples (Figure 1A). For TAP2, there was no significant difference in mRNA between tumor-free and healthy controls (Figure 1B), whereas a significant correlation between TAP1 and TAP2 levels was seen (Figure 1C). To confirm the microarray data, RT-qPCR was used for measuring TAP1 levels in 10 of the healthy tongue controls and 8 paired tumor-free and SCCOT samples. There was a significant correlation between microarray and RT-qPCR results for TAP1 (spearman correlation coefficient: 0.841, p < 0.001; Figure 1D).

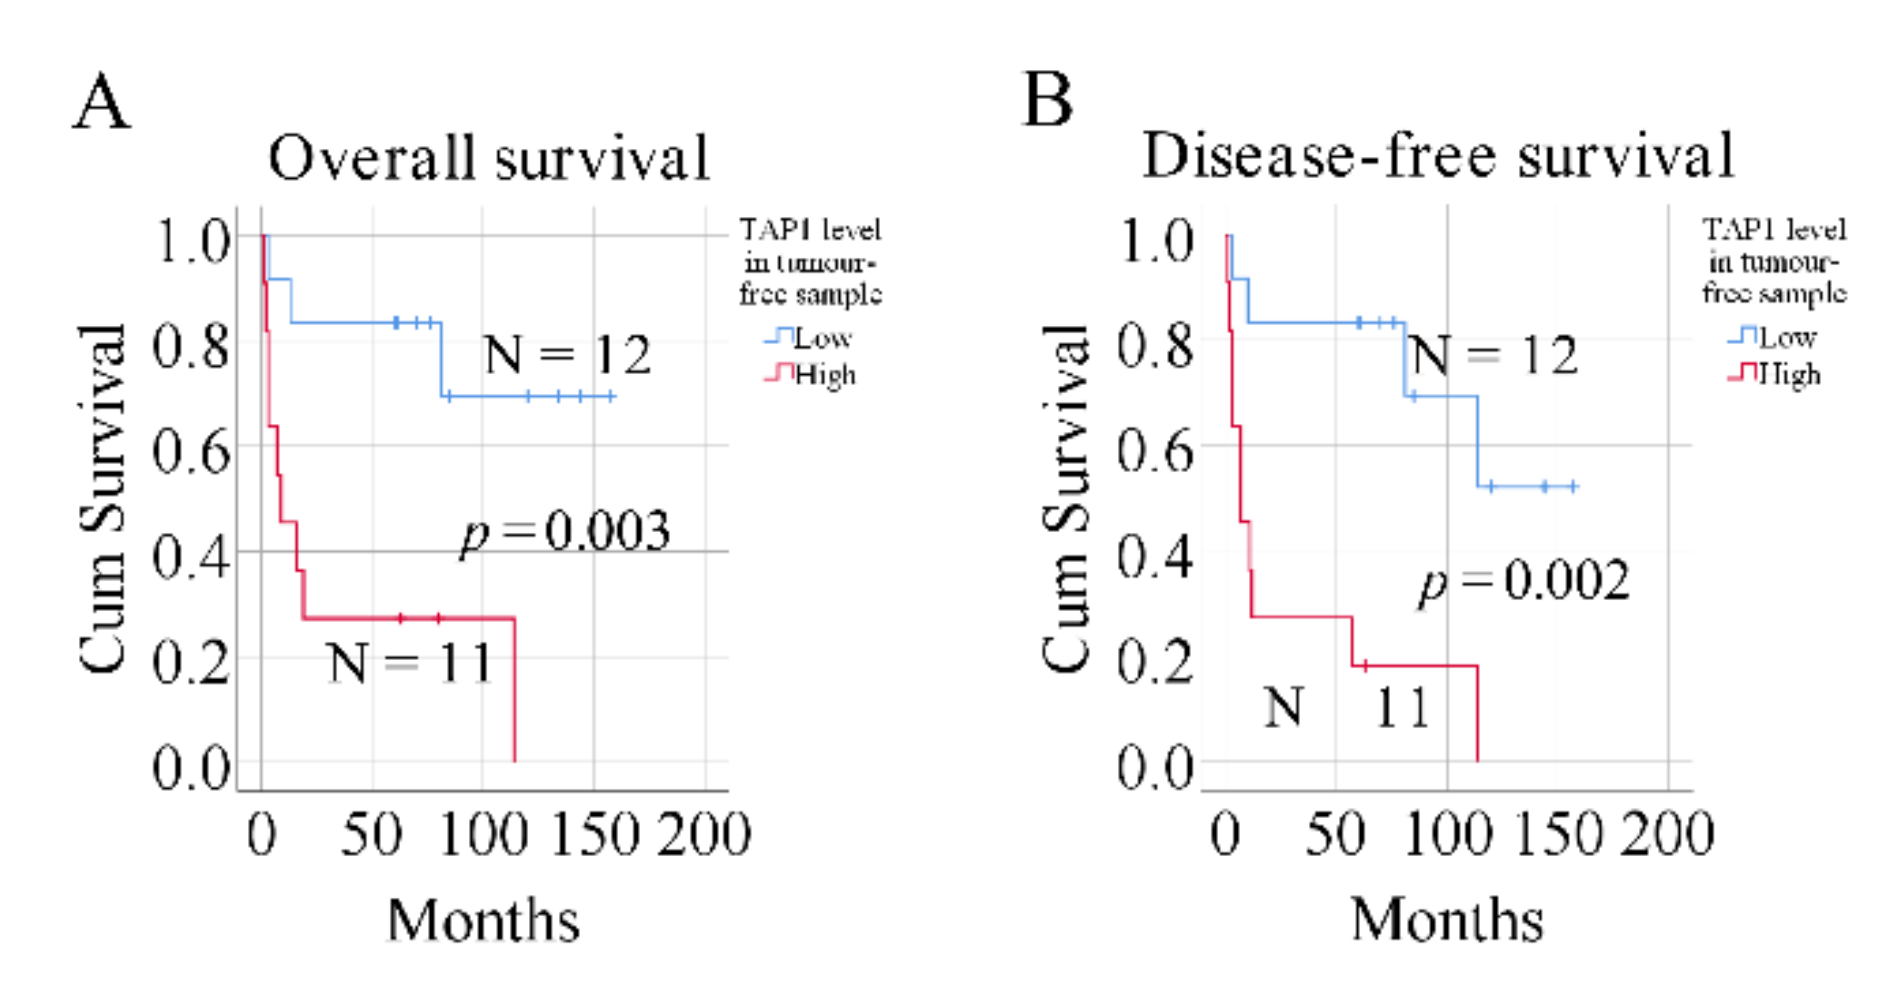
2.2. Expression of TAP1 in Tumor-Free Samples Confers Prognostic Information

Using univariate Cox regression survival analysis, we found that low expression of the TAP1 gene in tumor-free samples was significantly associated with better patient survival (p < 0.05 for both overall and disease-free survival; Table 1). However, regarding TAP1 expression levels in tumor samples, no correlation to survival was found (Table 1). Previously, using the same samples, we reported that cytolytic activity in the tumor-free tongue is a useful prognostic factor [6]. Therefore, in the subsequent multivariate Cox regression analysis, we considered cytolytic activity, age at diagnosis, sex, clinical stage, T stage, and N stage as covariates. The results showed that TAP1 levels in tumor-free samples remained significant as an independent prognostic factor for overall (p = 0.031) and disease-free survival (p = 0.005) (Table 2). Finally, dividing patients into TAP1-high and TAP1-low groups according to the median TAP1 level in tumor-free samples demonstrated that patients with lower TAP1 mRNA levels in tumor-free samples had better overall (p = 0.003, Figure 2A) and disease-free survival (p = 0.002, Figure 2B). As shown in Table 3, Fisher’s exact test indicated that there was no significant correlation between TAP1 levels and different clinical factors (p > 0.05).
To independently evaluate the prognostic value of TAP1, we downloaded gene expression and clinical data from The Cancer Genome Atlas, TCGA,-head and neck squamous cell carcinoma (HNSC) cohort. In this database, TAP1 levels (achieved from RNA sequencing) were available for 480 tumors and 42 tumor-free samples, showing significantly higher TAP1 levels in tumors (p < 0.001, Figure 3A). TAP1 levels were also higher in SCCOT (N = 121) compared to tumor-free controls (N = 12, p < 0.001, Figure 3B). However, samples from different subsites of the head and neck were included in the external dataset as tumor-free controls, rather than tumor-free tongue contralateral to the SCCOT. Thus, no relevant comparison between TAP1 in tumor-free samples of SCCOT and the clinical outcome was possible using TCGA patient samples. Therefore, we used the median TAP1 mRNA level to divide the mixed group of 42 tumor-free samples into TAP1-low and TAP1-high groups. There was no significant association between TAP1 levels and different clinical factors (Fisher’s exact test, p > 0.05, Table 4). Kaplan–Meier survival analysis showed that low TAP1 in tumor-free tissues was significantly associated with better overall survival (log-rank test, p-value = 0.024, Figure 4A). Cox regression also showed that TAP1-low patients had better overall survival than TAP1-high patients (p = 0.028), also when considering cytolytic activity, age at diagnosis, sex, stage, and T and N values as covariates (p = 0.011, Table 5). Using Kaplan–Meier analysis on TAP1 levels in 41 out of 42 matched SCCOT samples with follow up data available, no difference in overall survival was found between TAP1-low and TAP1-high patients (Figure 4B). Nor was there a difference in overall survival between TAP1-low and TAP1-high patients when considering the 479 out of 480 tumor samples with follow-up data available from the TCGA dataset (Figure 4C).

3. Discussion

Early detection of SCCOT improves its prognosis as well as diminishes the need for extensive surgical treatment. In the search for valuable prognostic factors, the clinically normal tissue adjacent to a tumor that remains in the patient after treatment has attracted attention. Field cancerization is a well-known phenomenon for tumors within the head and neck area [4] and we recently showed that increased cytolytic activity in clinically normal tongue contralateral to an SCCOT correlates to better survival [6]. Cytolytic activity is measured as levels of factors (perforin and granzymes) released by cytotoxic CD8+ T cells and NK cells, and high cytolytic activity is thus indicative of an immunologically active tissue.
The heterodimer TAP is an important factor in formation of the MHC I antigen, acting as a complex and important factor in CD8+ T cell immune surveillance [8]. The TAP proteins, TAP1 and TAP2, are essential for antigen processing [8]. Whereas levels of TAP2 were almost unchanged in the 21 tumor-free samples studied here, the group with TAP1 mRNA levels below the median showed significantly better overall and disease-free survival when considering age, sex, cytolytic activity, and tumor stage.
The results showed an inverse correlation between TAP1 and the previous results on cytolytic activity in clinically tumor-free tongue contralateral to the SCCOT in relation to prognosis. Whereas increased cytolytic activity could be part of the inflammatory response in the tumor vicinity and thus play a protective role, the importance of decreased levels of TAP1 is harder to explain as it is not well known how its expression is regulated under normal conditions. Whereas low levels of TAP1 are an indicator of better survival, increased levels could serve as a sign of malignancy in tumor-free tissue contralateral to a treated SCCOT. This is, however, debatable due to the difficulty of defining “high” levels in tumor-free samples. Importantly, downregulation of TAP1 in SCCHN has been reported previously [14,15,16]. A higher frequency of TAP down regulation has also been reported in metastatic compared to primary SCCHN [12]. By down regulating TAP causing loss of MHC class I antigen on the surface, tumors can escape cytotoxic T cell recognition [11]. Unexpectedly in our study, we found a gradual increase in TAP1 levels from healthy control to tumor-free to tumor samples. Conflicting results regarding the prognostic value of tumor TAP1 were also observed. When analyzing TAP1 in SCCOT, we did not find any correlation between expression levels and survival. In accordance with our mRNA data, TAP1 protein did not shown any correlation to survival in SCCHN tumors [14]. However, in esophageal cancer, upregulation of TAP1 protein in cancer tissues was found to be an unfavorable prognostic factor [17]. Differences between studies in terms of cancer subtypes and research methods, such as different assays and various scoring strategies, may be responsible for some of the discrepancies. In our group of SCCOTs, it could thus be interesting to map the expression of the TAP1 protein and its potential clinical relevance in comparison to the RNA-data shown here.
Overexpression of the TAP1 protein has been suggested as an indicator of aggressiveness in breast cancers, which is thought to be due either to a lower capacity of more advanced tumors to downregulate TAP, or to a higher concentration of immune infiltrates in the microenvironment producing IFN-γ, which causes upregulation of the TAP subunits [18]. In colorectal cancer, decreased levels of TAP1 were seen in tumors with perineural invasion, making downregulation of TAP1 a prognostic factor for patients with stage I and II disease [19].
As TAP plays a key role in CD8+ T cell immune surveillance, it would be interesting to see if the levels of TAP influence the therapeutic outcome in SCCOT patients treated with immune checkpoint inhibitors such as PD-1 or PD-L1 antibodies.
In summary, the present findings illustrate the importance of studying the clinically tumor-free tongue contralateral to SCCOT in the search for relevant field changes that could be of diagnostic and/or prognostic importance. This tissue, remaining in the patient after treatment, is of utmost importance as it is easily accessible for different kinds of analyses at regular follow up. Our results, which show that TAP1 levels in tumor-free tongue contralateral to the SCCOT correlate with survival, are an important contribution to early diagnostics and follow up of SCCOT, improving our overall understanding of this complicated and severe disease.

4. Materials and Methods

4.1. Patient Material and Ethical Approval

The study comprised a total of 31 patients (15 men and 16 women) with a median age of 64 years (range 19–87 years) treated surgically and/or with radiotherapy for SCCOT at the Department of Otorhinolaryngology and Head & Neck Surgery, Norrland’s University Hospital, Umeå, Sweden. Approval for the study was obtained by the local Ethical Committee at Umeå University (Dnr 08-003M). Written informed consent was obtained from each participant. All samples were collected before treatment. For patients with status “alive disease-free”, the minimum follow up time was 5 years.
Biopsies had been taken from the tumor in 29 of the patients and from the clinically tumor-free tongue on the contralateral side of the tumor in 21 of these. From the remaining two patients with SCCOT, only tumor-free samples were available. Tongue biopsies from 14 healthy individuals served as the control group. Clinical information for patients and controls is shown in Table 6.

4.2. RNA Isolation and Gene Expression Profiling

As previously reported, RNA isolation and gene expression profiling were performed on 29 tumors, 23 tumor-free samples, and 14 healthy controls [6,13]. Briefly, biopsies were fresh-frozen in liquid nitrogen for further storage until RNA extraction. A total of 200 ng RNA was used for gene expression profiling with Illumina HumanHT-12 v4 Expression BeadChip (Illumina Inc., San Digo, CA, USA). Raw data are available at ArrayExpress under accession numbers E-MTAB-4678 and E-MTAB-5534.

4.3. Prognostic Factor Analysis

Cox’s regression model was performed for survival analysis. Multivariate Cox regression analysis was also performed, with cytolytic activity, sex, age at diagnosis, and TNM stage as covariates. Patients were divided into high or low expression groups according to the median gene expression value in the tumor-free samples. Kaplan–Meier with log-rank tests were used to compare survival curves between groups. Fisher’s exact test was used to investigate the correlation between gene expression and clinical factors. All tests were conducted in IBM SPSS Statistics 26 (IBM Corp., Armonk, NY, USA). A two-sided p-value < 0.05 was considered significant.

4.4. Confirmation of Microarray Data Using RT-qPCR

Microarray data were confirmed using reverse transcription quantitative PCR (RT-qPCR) of tongue tissue from 10 of the healthy controls and 8 of the paired tumor/tumor-free samples from patients with SCCOT, using the QuantStudio 6 Flex real-time PCR system (Thermo Fisher Scientific, Waltham, MA, USA). Custom primers used were TAP1 (forward: CTGGACTCCCTCAGGGCTAT, reverse: GGTTTCCGGATCAATGCTCG). As reference genes, RPL13A (forward: CACGAGGTTGGCTGGAAGTA, reverse: ACGTTCTTCTCGGCCTGTTT) and GAPDH (forward: GCCCTCAACGACCACTTTGT, reverse: TTACTCCTTGGAGGCCATGTG) were used. All primers were obtained from Thermo Fisher Scientific. Gene expression was quantified using the relative standard curve method. Spearman correlation coefficient (rho) was calculated to evaluate correlation strength between microarray and RT-qPCR results.

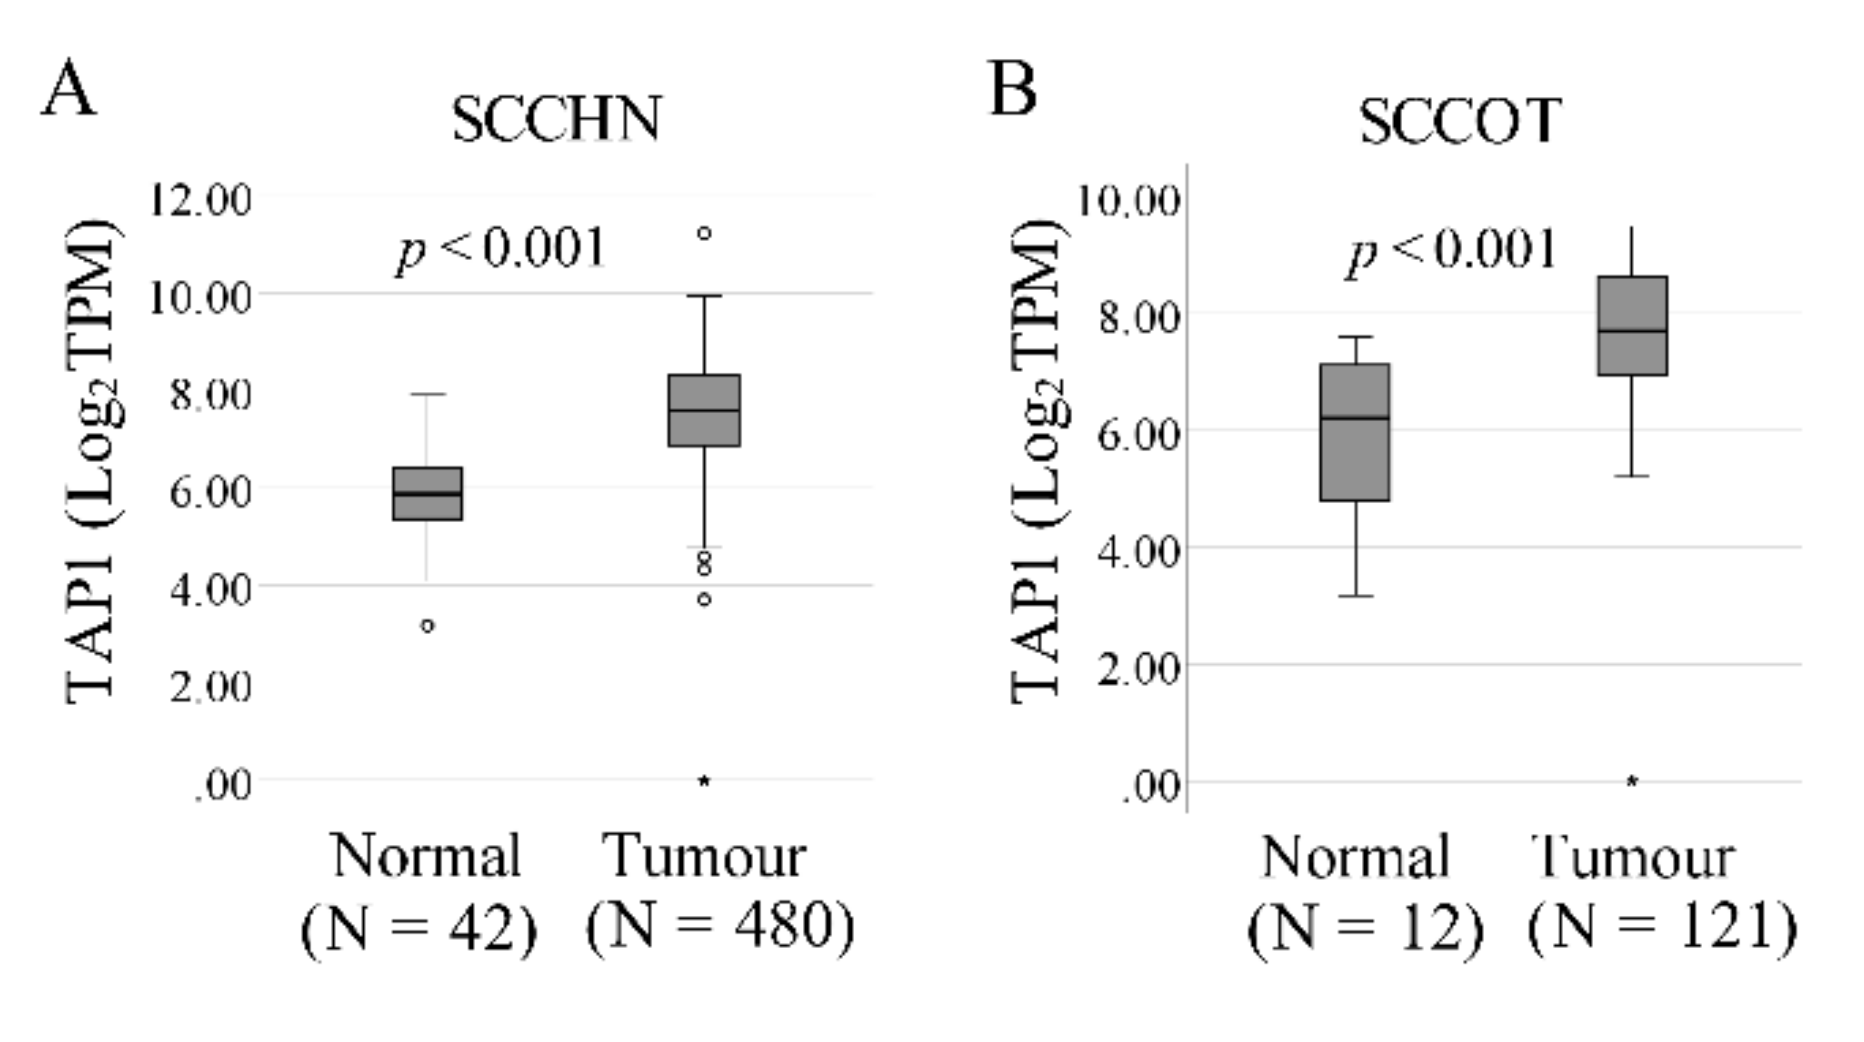
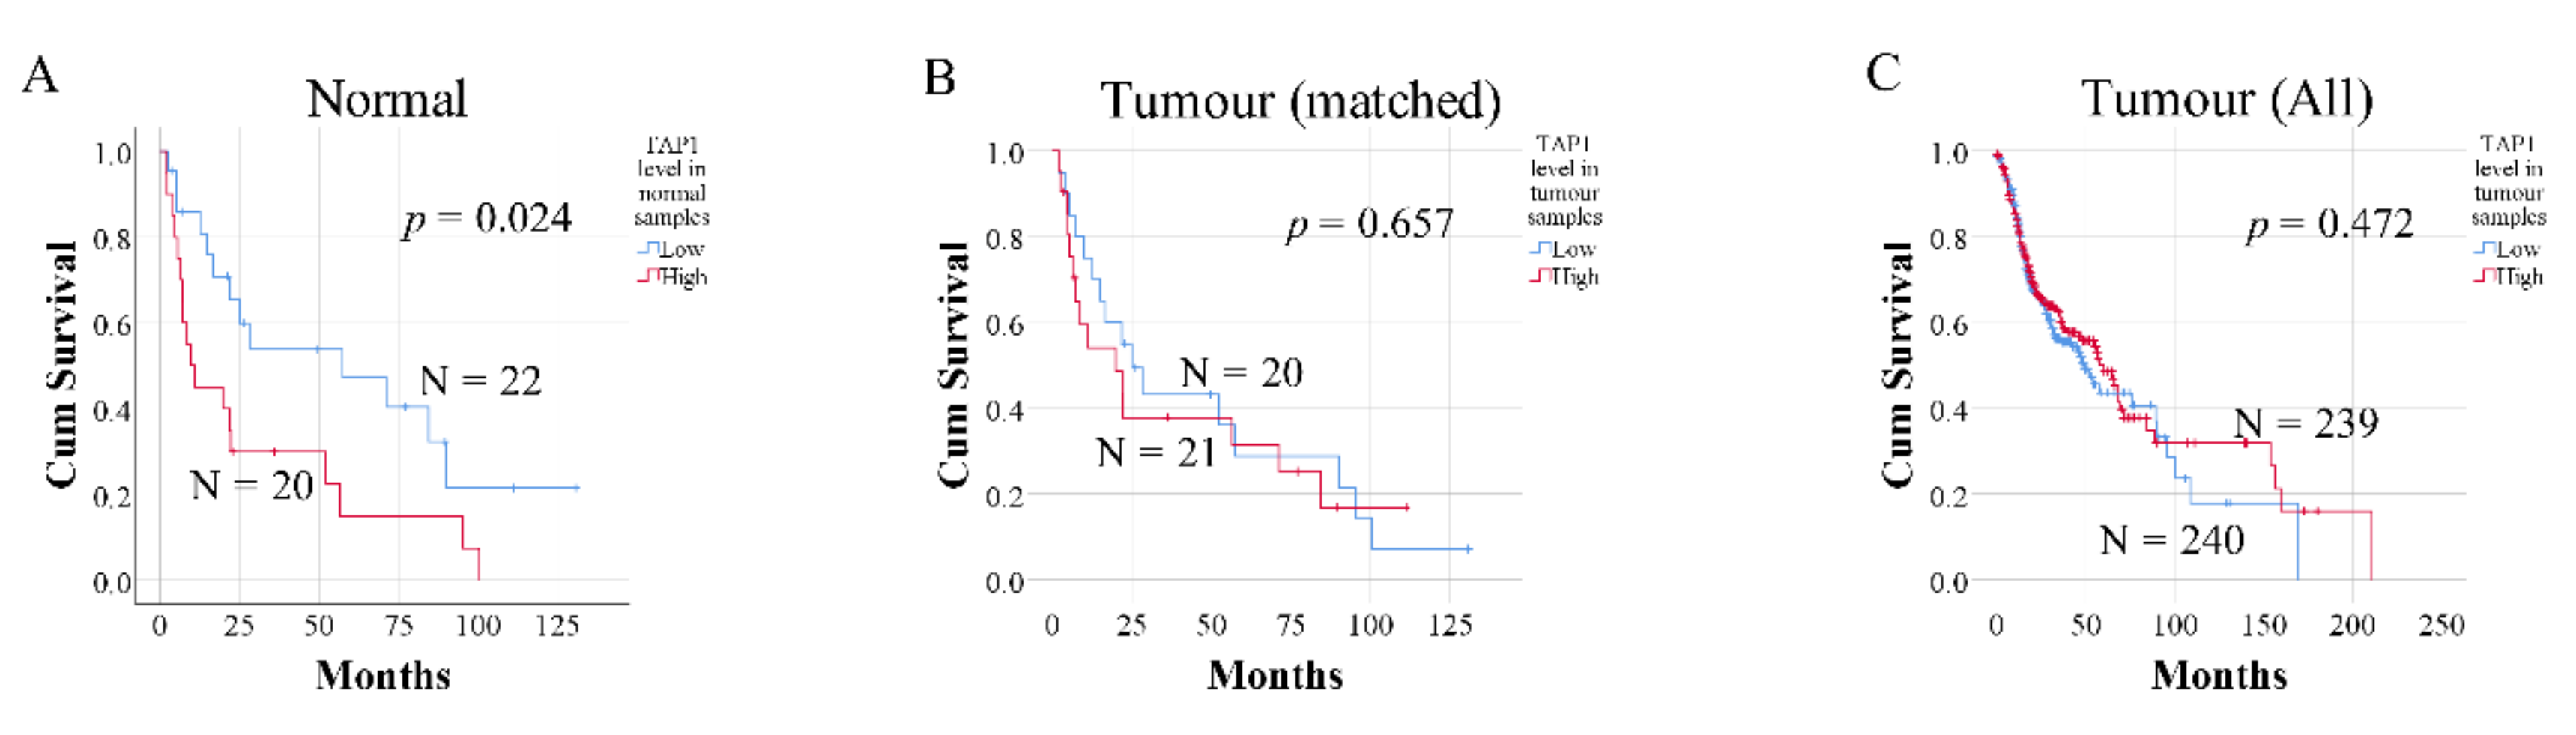
4.5. The Cancer Genome Atlas (TCGA) Data Collection and Analysis

Gene expression data from the TCGA head and neck cancer cohort was downloaded using the International Cancer Genome Consortium (ICGC) data portal (https://dcc.icgc.org/). Clinical data were downloaded from TCGA’s data portal (https://portal.gdc.cancer.gov). A prognostic factor analysis, as above, was performed to study the impact of gene expression on clinical outcome.

Author Contributions

Conceptualization, X.G., P.J.C., R.F., and K.N.; Formal analysis, X.G., N.A., L.B., T.W., L.W., N.S., and K.Z.; Investigation, X.G. and L.W.: Writing—Original draft preparation, X.G. and N.A., wrote the manuscript; Writing—Review & Editing, P.J.C., R.F., K.N., L.B., T.W., N.S., and K.Z.; Supervision, X.G. and K.N.; Funding Acquisition, K.N. and P.J.C. All authors have read and commented on the manuscript and approved of the submitted version.

Funding

This study was supported by Lion’s Cancer Research Foundation, Umeå University; The Swedish Cancer Society (contract number 18 0542); Umeå University; Region Västerbotten; Ministry of Health Czech Republic, conceptual development of research organization (MMCI, 00209805).

Conflicts of Interest

The authors declare no conflict of interest.

References

  1. Sgaramella, N.; Gu, X.; Boldrup, L.; Coates, P.J.; Fåhraeus, R.; Califano, L.; Tartaro, G.; Colella, G.; Spaak, L.N.; Strom, A.; et al. Searching for New Targets and Treatments in the Battle Against Squamous Cell Carcinoma of the Head and Neck, with Specific Focus on Tumours of the Tongue. Curr. Top. Med. Chem. 2018, 18, 214–218. [Google Scholar] [CrossRef] [PubMed]
  2. Sano, D.; Myers, J.N. Metastasis of squamous cell carcinoma of the oral tongue. Cancer Metastasis Rev. 2007, 26, 645–662. [Google Scholar] [CrossRef] [PubMed]
  3. Slaughter, D.P.; Southwick, H.W.; Smejkal, W. Field cancerization in oral stratified squamous epithelium; clinical implications of multicentric origin. Cancer 1953, 6, 963–968. [Google Scholar] [CrossRef]
  4. Braakhuis, B.J.; Tabor, M.P.; Kummer, J.A.; Leemans, C.R.; Brakenhoff, R.H. A genetic explanation of Slaughter’s concept of field cancerization: Evidence and clinical implications. Cancer Res. 2003, 63, 1727–1730. [Google Scholar] [PubMed]
  5. Lochhead, P.; Chan, A.T.; Nishihara, R.; Fuchs, C.S.; Beck, A.H.; Giovannucci, E.; Ogino, S. Etiologic field effect: Reappraisal of the field effect concept in cancer predisposition and progression. Mod. Pathol. 2015, 28, 14–29. [Google Scholar] [CrossRef] [PubMed] [Green Version]
  6. Gu, X.; Boldrup, L.; Coates, P.J.; Fahraeus, R.; Wang, L.; Wilms, T.; Norberg-Spaak, L.; Sgaramella, N.; Nylander, K. High immune cytolytic activity in tumor-free tongue tissue confers better prognosis in patients with squamous cell carcinoma of the oral tongue. J. Pathol. Clin. Res. 2019, 5, 240–247. [Google Scholar] [CrossRef] [PubMed]
  7. Rosenberg, J.; Huang, J. CD8+ T cells and NK cells: Parallel and complementary soldiers of immunotherapy. Curr. Opin. Chem. Eng. 2018, 19, 9–20. [Google Scholar] [CrossRef] [PubMed]
  8. Abele, R.; Tampe, R. The ABCs of Immunology: Structure and Function of TAP, the Transporter Associated with Antigen Processing. Physiology 2004, 19, 216–224. [Google Scholar] [CrossRef] [PubMed]
  9. Ritz, U.; Seliger, B. The Transporter Associated With Antigen Processing (TAP): Structural Integrity, Expression, Function, and Its Clinical Relevance. Mol. Med. 2001, 7, 149–158. [Google Scholar] [CrossRef] [PubMed] [Green Version]
  10. Eggensperger, S.; Tampe, R. The transporter associated with antigen processing: A key player in adaptive immunity. Biol. Chem. 2015, 396, 1059–1072. [Google Scholar] [CrossRef] [PubMed]
  11. Lankat-Buttgereit, B.; Tampe, R. The Transporter Associated With Antigen Processing: Function and Implications in Human Diseases. Physiol. Rev. 2002, 82, 187–204. [Google Scholar] [CrossRef] [PubMed] [Green Version]
  12. Bandoh, N.; Ogino, T.; Katayama, A.; Takahara, M.; Katada, A.; Hayashi, T.; Harabuchi, Y. HLA class I antigen and transporter associated with antigen processing downregulation in metastatic lesions of head and neck squamous cell carcinoma as a marker of poor prognosis. Oncol. Rep. 2010, 23, 933–939. [Google Scholar] [CrossRef] [PubMed] [Green Version]
  13. Boldrup, L.; Gu, X.; Coates, P.J.; Norberg-Spaak, L.; Fåhraeus, R.; Laurell, G.; Wilms, T.; Nylander, K. Gene expression changes in tumor free tongue tissue adjacent to tongue squamous cell carcinoma. Oncotarget 2017, 8, 19389–19402. [Google Scholar] [CrossRef] [PubMed]
  14. Meissner, M.; Reichert, T.E.; Kunkel, M.; Gooding, W.; Whiteside, T.L.; Ferrone, S.; Seliger, B. Defects in the Human Leukocyte Antigen Class I Antigen Processing Machinery in Head and Neck Squamous Cell Carcinoma: Association with Clinical Outcome. Clin. Cancer Res. 2005, 11, 2552–2560. [Google Scholar] [CrossRef] [PubMed] [Green Version]
  15. Han, W.; Pan, H.; Jiang, L.; Wei, K.; Zou, D.; Zhang, Z. A novel approach to rescue immune escape in oral squamous cell carcinoma: Combined use of interferon-γ and LY294002. Oncol. Rep. 2011, 25, 181–187. [Google Scholar] [PubMed]
  16. Wei, H.; Hongya, P.; Linlin, J.; Mujiang, A.; Kuijie, W.; Duohong, Z.; Qingang, H.; Zhiyuan, Z. IFN-γ enhances the anti-tumour immune response of dendritic cells against oral squamous cell carcinoma. Arch. Oral Biol. 2011, 56, 891–898. [Google Scholar] [CrossRef] [PubMed]
  17. Tanaka, K.; Tsuchikawa, T.; Miyamoto, M.; Maki, T.; Ichinokawa, M.; Kubota, K.C.; Shichinohe, T.; Hirano, S.; Ferrone, S.; Dosaka-Akita, H.; et al. Down-regulation of Human Leukocyte Antigen class I heavy chain in tumors is associated with a poor prognosis in advanced esophageal cancer patients. Int. J. Oncol. 2012, 40, 965–974. [Google Scholar] [CrossRef] [PubMed] [Green Version]
  18. Henle, A.M.; Nassar, A.; Puglisi-Knutson, D.; Youssef, B.; Knutson, K.L. Downregulation of TAP1 and TAP2 in early stage breast cancer. PLoS ONE 2017, 12, e0187323. [Google Scholar] [CrossRef] [PubMed]
  19. Ling, A.; Löfgren-Burström, A.; Larsson, P.; Li, X.; Wikberg, M.L.; Öberg, Å.; Stenling, R.; Edin, S.; Palmqvist, R. TAP1 down-regulation elicits immune escape and poor prognosis in colorectal cancer. OncoImmunology 2017, 6, e1356143. [Google Scholar] [CrossRef] [PubMed] [Green Version]
Figure 1. Microarray results of (A) TAP1 and (B) TAP2 mRNA levels in tongue from healthy volunteers, tumor-free samples and SCCOT samples. (C) Correlation between TAP1 and TAP2 levels (p < 0.001). (D) Real-time quantitative PCR (RT-qPCR) confirmation of microarray data for TAP1 (spearman correlation coefficient: 0.841, p < 0.001).
Ijms 21 06220 g001
Figure 2. The influence of TAP1 levels in tumor-free samples on patient survival. Kaplan–Meier curves of overall (A) and disease-free (B) survival. Blue lines represent patients with low TAP1 levels, and red lines patients with high TAP1 levels. Log-rank test for overall (p = 0.003) and disease-free survival (p = 0.002). N = number of samples.
Ijms 21 06220 g002
Figure 3. TCGA-HNSC (The Cancer Genome Atlas-head and neck squamous cell carcinoma) cohort data. Plots show TAP1 levels in tumors and tumor-free samples, the latter denominated “normal” in TCGA, for (A) the whole group of squamous cell carcinoma of the head and neck–SCCHN (p < 0.001) and (B) for squamous cell carcinoma of the tongue (SCCOT) only (p < 0.001).
Ijms 21 06220 g003
Figure 4. The influence of TAP1 levels in tumor-free samples from the TCGA-HNSC cohort on patient survival. Kaplan–Meier curves of overall survival for (A) tumor-free samples (denominated “normal” by TCGA), (B) matched tumor samples, and (C) all SCCHN tumors available in the TCGA database. Blue lines represent patients with low TAP1 levels, and red lines indicate patients with high TAP1 levels. N = number of samples
Ijms 21 06220 g004
Table 1. Univariate Cox regression analysis of TAP1 and TAP2.
SampleGene p-Value (Cox-Regression Overall Survival Analysis)p-value (Cox-Regression Disease-Free Survival Analysis)
Tumor-freeTAP10.0420.026
TAP20.8280.987
TumorTAP10.7720.892
TAP20.1580.315
Table 2. Univariate and multivariate Cox regression analysis of risk factors for survival.
UnivariateMultivariate
p-valueHazard Ratio95% Confidence Intervalp-ValueHazard Ratio95% Confidence Interval
LowerUpperLowerUpper
Overall survivalTAP10.0421.8361.0233.2940.03112.6501.267126.283
Cytolytic activity0.0822.9310.8719.8610.1763.2710.58818.212
Age0.6071.0100.9721.0490.7991.0070.9541.063
Sex0.1242.5310.7758.2710.2172.8770.53815.394
Stage0.0131.9521.1493.3180.0640.0460.0021.201
T0.0121.9121.1523.1720.03433.9821.308882.785
N0.0112.4821.2334.9960.3641.8190.5006.622
Disease-free survivalTAP10.0291.8441.0663.1890.00519.8862.480159.446
Cytolytic activity0.1012.6570.8268.5490.0924.9030.77331.087
Age0.4151.0160.9781.0550.4141.0230.9681.081
Sex0.0992.5090.8417.4860.2362.3990.56510.188
Stage0.0331.6591.0422.6410.0130.0240.0010.460
T0.0281.6741.0572.6500.01052.5612.5811070.378
N0.0162.2851.1634.4900.1762.3730.6798.285
Table 3. Clinical variables and their associations with TAP1.
TAP1 Levelp-Value
LowHigh
Age (years)≤65740.414
>6557
SexFemale470.220
Male84
StageI, II960.400
III, IV35
TT1, T21070.371
T3, T424
NN = 01080.640
N > 023
Table 4. Clinical variables and their associations with TAP1 (TCGA data).
TAP1 Levelp-Value
LowHigh
Age (years)≤6515100.346
>65710
SexFemale580.320
Male1712
StageI, II17170.700
III, IV53
TT1, T2991.000
T3, T41311
NN = 016151.000
N > 055
Table 5. Survival analysis with Cox regression on tumor-free samples in the TCGA HNSC cohort.
UnivariateMultivariate
p-valueHazard Ratio95% Confidence Intervalp-ValueHazard Ratio95% Confidence Interval
LowerUpperLowerUpper
TAP1 (high vs. low)0.0282.2531.0934.6440.0114.4051.40113.847
Cytolytic activity0.4471.3180.6472.6830.2170.4760.1461.547
Age0.3111.0170.9841.0510.3661.0180.9791.060
Sex0.5540.7860.3551.7430.9941.0030.4212.388
Clinical stage0.1251.3400.9221.9500.6321.2750.4723.445
T stage0.1941.3100.8711.9710.8011.1050.5092.397
N stage0.0741.7110.9493.0860.4081.4410.6063.426
Table 6. Clinicopathological data on SCCOT patients and healthy controls.
NoIDSample¤AgeSexTNMStageLocalization #StatusFollow-up MonthsMonths to Recurrence
1p40180FemaleT4N2bM0IV3DWD1
2p42168FemaleT2N0M0II1DWD97
3p14277FemaleT2N1M0III2DDF189
4p24264MaleT1N0M0I1ADF195
5p29264FemaleT2N0M0II2DWD2920
6p68262MaleT2N0M0II1DOD96
7p70271MaleT1N0M0I2ADF134
8p82219FemaleT4N0M0IV2DOD1812
9p83264FemaleT1N0M0I2ADF119
10p92263FemaleT2N0M0II2DOD206
11p11378MaleT2N0M0II2DWD3
12p35324FemaleT2N0M0II1DOD1310
13p49352FemaleT4N2cM0IV3DWD3
14p51374MaleT2N0M0II1ADF157
15p56340FemaleT2N2bM0IV3DOD1612
16p58361MaleT1N0M0I1ADF144
17p59368FemaleT2N0M0II1DOD7
18p61369MaleT4aN0M0IV3DDF81
19p65381FemaleT2N0M0II3ADF134114
20p73380MaleT4aN0M0IV3DOD1911
21p76358MaleT4aN0M0IV3DDF114
22p79360MaleT1N0M0I2ADF120
23p85387FemaleT2N0M0II1DOD22
24p98331MaleT2N0M0II3ADF85
25p105363MaleT1N0M0I2ADF8057
26p111331FemaleT1N0M0I2ADF76
27p119366MaleT2N0M0II2ADF70
28p124354MaleT4aN2bM0IV3DOD3
29p131374FemaleT2N0M0II2ADF63
30p137371FemaleT2N0M0II2ADF61
31p138350MaleT2N1M0III2ADF60
32NT1432Female
33NT2449Female
34NT3425Female
35NT4430Male
36NT5427Male
37NT6442Female
38NT7432Female
39NT8441Female
40NT9435Female
41NT10457Male
42NT11445Male
43NT12437Male
44NT13448Female
45NT14459Female
Note: 1, only tumor-free sample; 2, only tumor sample; 3, tumor-free and tumor samples were collected, 4, healthy controls; # 1, tongue; 2, lateral border of the tongue; 3, tongue with overgrowth outside the mobile tongue; Status: DWD, dead with disease; DDF, dead disease-free; ADF, alive disease-free; DOD, dead of disease.

