Article

Collagen 24 α1 Is Increased in Insulin-Resistant Skeletal Muscle and Adipose Tissue

1
Division of Systems Medicine, School of Medicine, University of Dundee, Dundee, Scotland DD1 9SY, UK
2
Drug Discovery Unit, University of Dundee, Dundee, Scotland DD1 9SY, UK
3
Centre for Cardiovascular Science, University of Edinburgh, Edinburgh, Scotland EH16 4TJ, UK
4
Department of Molecular Physiology and Biophysics and Mouse Metabolic Phenotyping Centre, Vanderbilt University, Nashville, TN 37232, USA
*
Author to whom correspondence should be addressed.
Int. J. Mol. Sci. 2020, 21(16), 5738; https://doi.org/10.3390/ijms21165738
Submission received: 29 June 2020 / Revised: 29 July 2020 / Accepted: 2 August 2020 / Published: 10 August 2020

Abstract

:
Aberrant extracellular matrix (ECM) remodelling in muscle, liver and adipose tissue is a key characteristic of obesity and insulin resistance. Despite its emerging importance, the effective ECM targets remain largely undefined due to limitations of current approaches. Here, we developed a novel ECM-specific mass spectrometry-based proteomics technique to characterise the global view of the ECM changes in the skeletal muscle and liver of mice after high fat (HF) diet feeding. We identified distinct signatures of HF-induced protein changes between skeletal muscle and liver where the ECM remodelling was more prominent in the muscle than liver. In particular, most muscle collagen isoforms were increased by HF diet feeding whereas the liver collagens were differentially but moderately affected highlighting a different role of the ECM remodelling in different tissues of obesity. Moreover, we identified a novel association between collagen 24α1 and insulin resistance in the skeletal muscle. Using quantitative gene expression analysis, we extended this association to the white adipose tissue. Importantly, collagen 24α1 mRNA was increased in the visceral adipose tissue, but not the subcutaneous adipose tissue of obese diabetic subjects compared to lean controls, implying a potential pathogenic role of collagen 24α1 in obesity and type 2 diabetes.

1. Introduction

Insulin resistance is a hallmark of many metabolic conditions including obesity, Type 2 diabetes, cardiovascular disease and cancers, therefore representing a potential therapeutic target. A growing body of evidence suggests a link between the extracellular matrix (ECM) remodelling and insulin resistance [1,2]. The ECM is composed of the interstitial matrix (e.g., fibrillar collagens, fibronectin, hyaluronan) and the basement membrane (e.g., collagen IV and laminin), which provide the structural support for tissues and are required for cell adhesion and migration during growth, differentiation, morphogenesis and wound healing [3]. Increased deposition of various ECM components (e.g., collagens, hyaluronan and osteopontin) and their binding to the ECM receptors (e.g., integrins and CD44) have been linked to the development of obesity-associated insulin resistance in skeletal muscle [4,5,6], adipose tissue [7,8] and the liver [9].
Despite the emerging importance of ECM remodelling in insulin resistance, the effective ECM targets remain largely undefined. Thus, studies identifying targets in a large scale is immediately necessary. Several groups have used approaches that give a more global view of changes such as oligonucleotide microarray analysis and two-dimensional gel electrophoresis based tandem mass spectrometry analysis (2-DE/MS-MS) [10,11]. These global analyses have yielded a view of patterns of changes in pathways and generated new hypotheses. However, changes in mRNA levels generated from the transcriptomics analysis may not be mirrored by changes in protein abundance [12]. The 2-DE/MS-MS analysis revealed only a few differences in protein abundance and none of those were ECM proteins [10]. These challenges are addressed in the current study through the use of an initial decellularisation technique [13]. The decellularisation process greatly removes the cellular components of the tissue without disrupting the tissue architecture, therefore enriching the ECM proteins and allowing a comparative proteomic analysis.
Collagens are the most abundant components of the ECM, consisting of three α-helical chains made of the repetitious amino acid sequence glycine-X-Y, where X and Y are frequently proline or hydroxyproline. It was previously shown that collagen isoforms I (1), III (3), IV (4), V (5), VI (6) and XVIII (18) were increased in insulin-resistant tissues [1,14]. Collagen XXIV (24) was discovered as a new member of the fibril-forming family of collagen molecules and has been demonstrated to be crucial for osteoblastic differentiation and mineralisation [15,16]. Collagen 24 has not been previously studied in the context of metabolic regulation or insulin resistance. In the current study, we applied an ECM-specific mass spectrometry-based proteomics in decellularised tissues to characterise the complete view of ECM collagen protein changes associated with high fat (HF) diet-induced obesity and insulin resistance in both skeletal muscle and liver. We found dramatic differences in collagen signature in muscle and liver and identified collagen 24 α1 as a new collagen isoform, which was associated with skeletal muscle insulin resistance.

2. Results

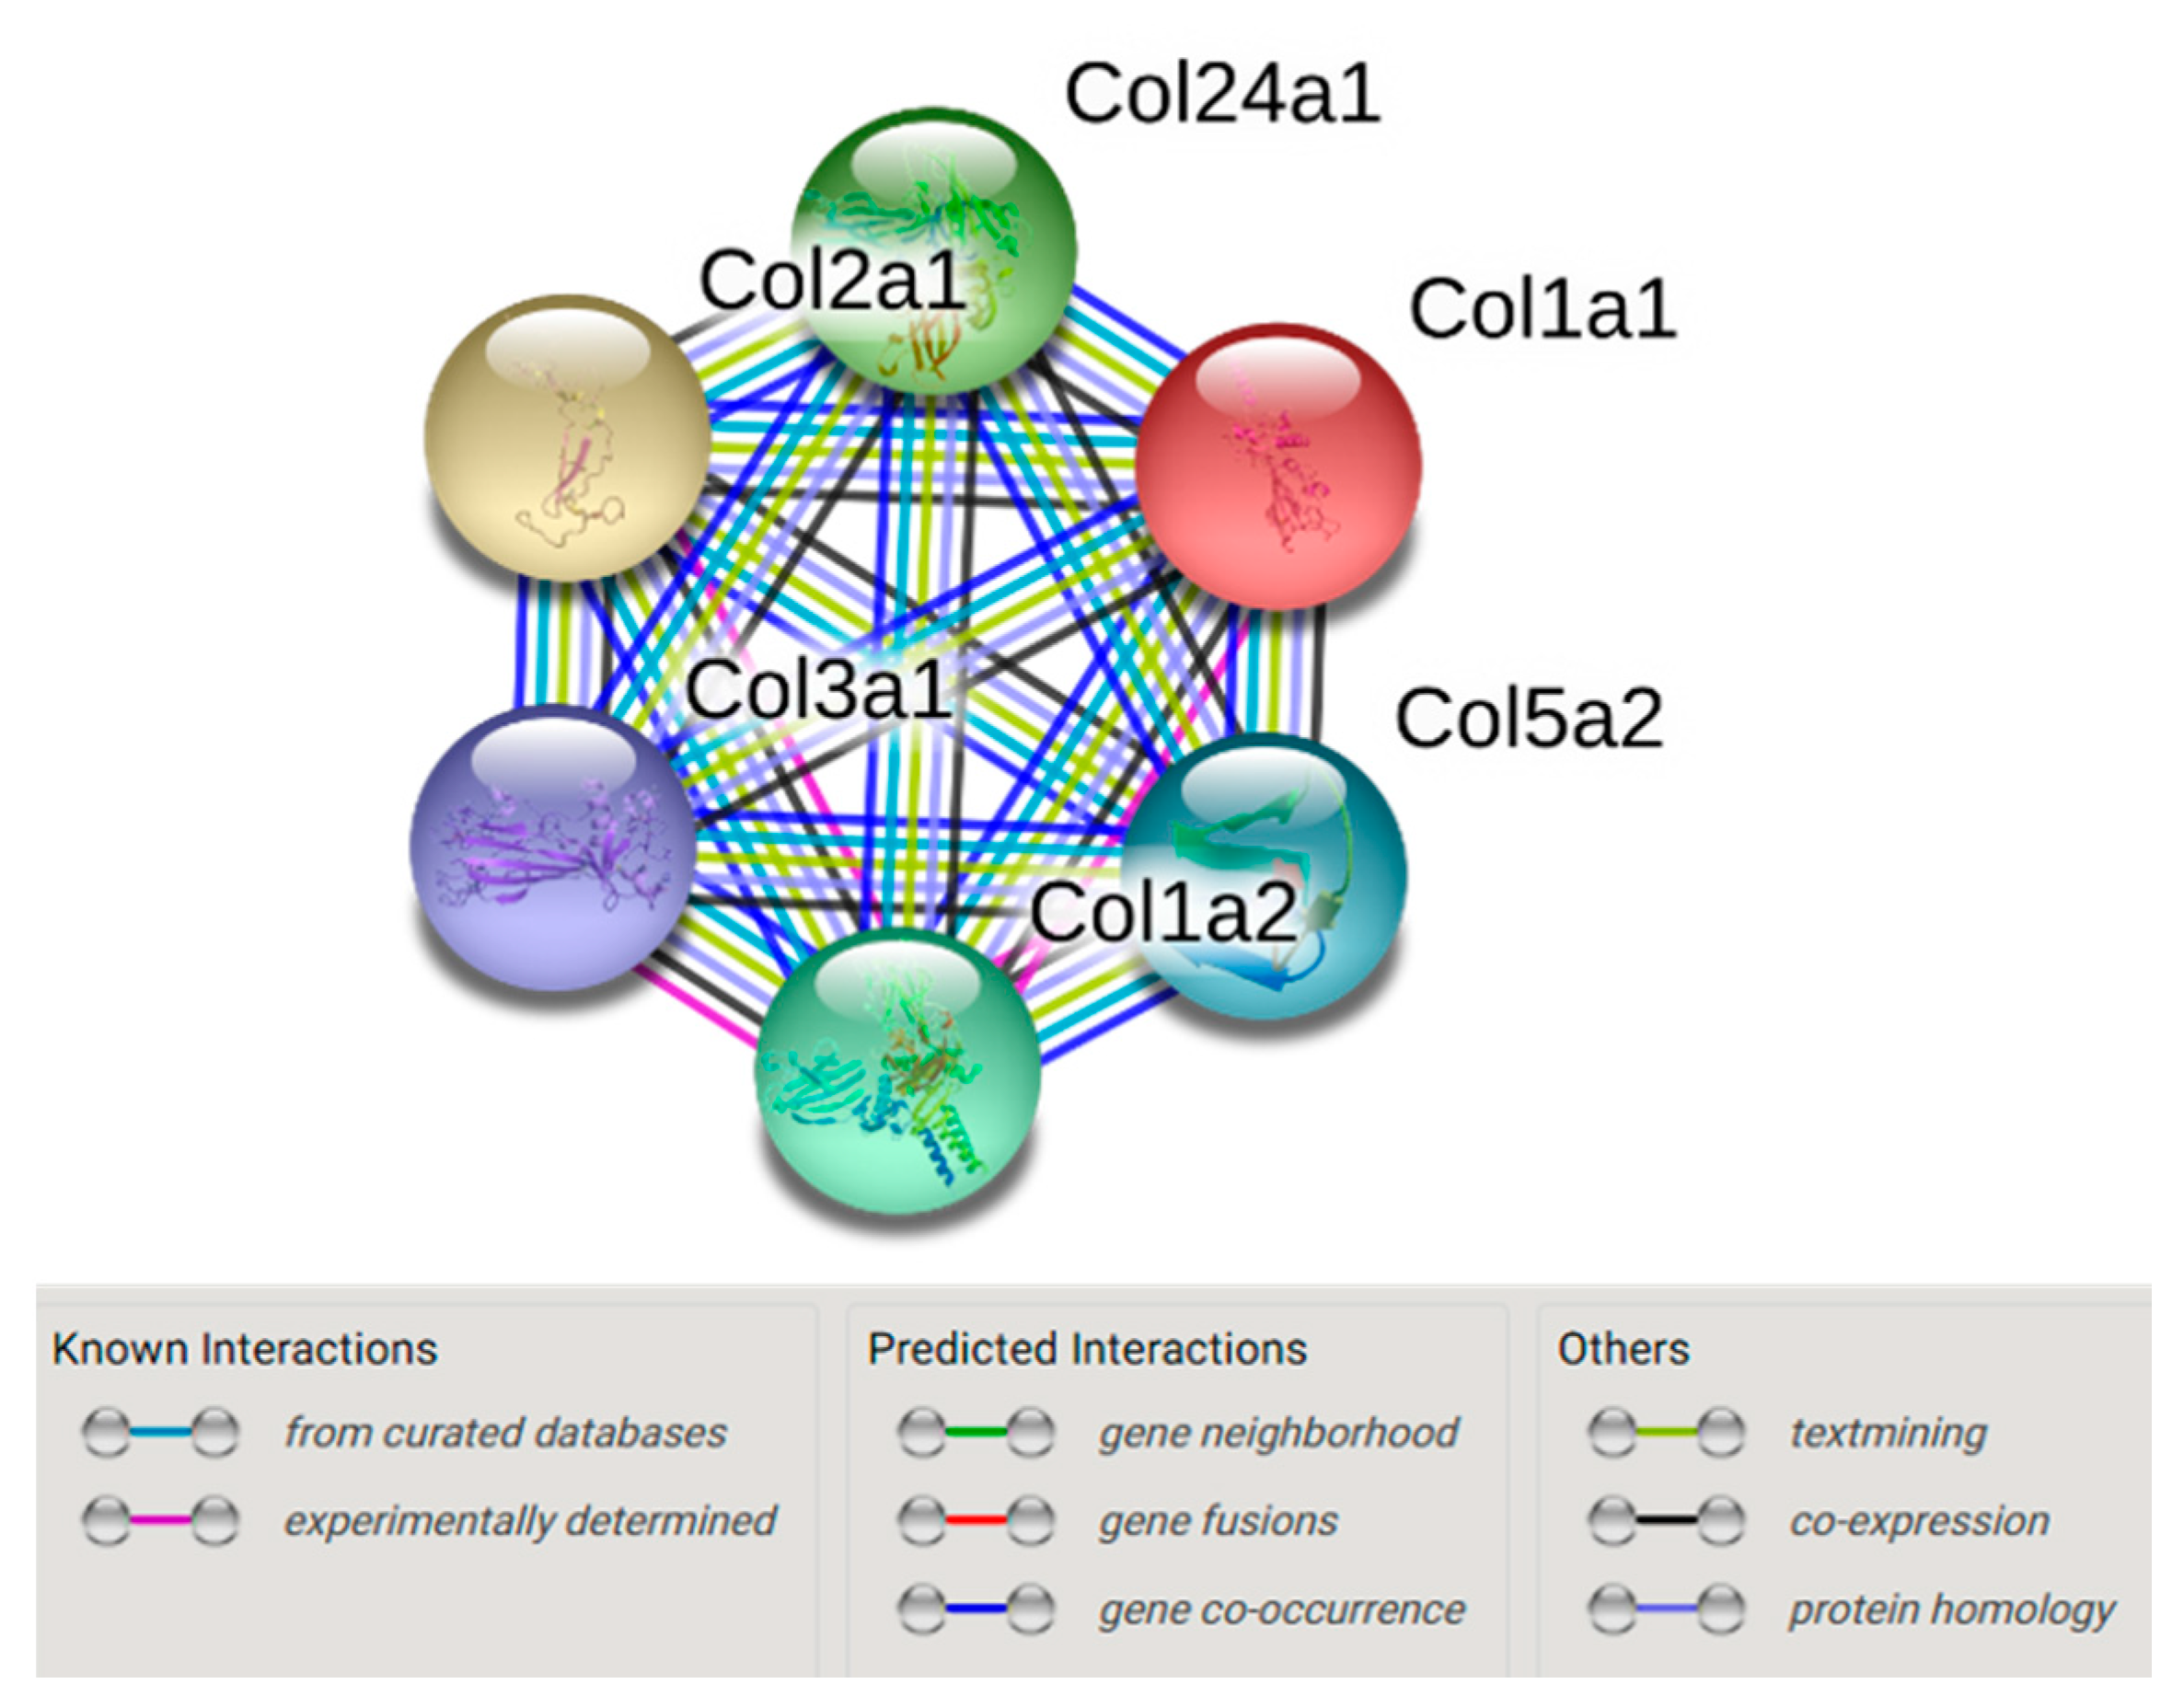
2.1. In Vivo Quantitative Proteomics of the ECM Compartment

HF diet (60% fat) feeding in mice for 20 weeks causes obesity, insulin resistance and hepatic steatosis [9]. The fasting blood glucose was also elevated in HF-fed mice (11.14 ± 0.36 mM, n = 36) when compared to those in chow-fed control mice (8.55 ± 0.51 mM, n =11) (p < 0.001). To investigate tissue-specific ECM remodelling in obese mice, gastrocnemius muscle and liver samples were analysed from mice fed a HF or chow control diet for 20 weeks. The ECM-specific mass spectrometry-based proteomics detected 78 proteins in muscle, of which 39 (50%) proteins were ECM proteins or contained ECM regions (full list in Supplemental Table S1). In contrast, 265 proteins were detected in the liver, of which 181 (68%) proteins were ECM proteins or contained ECM regions (full list in Supplemental Table S2). These data reveal that the initial decellularisation procedure successfully removed the majority of abundant cytosolic proteins to improve detection of the lower abundance ECM proteins (in non-cellularised liver tissues: 92% were cellular proteins; 8% cytoskeletal proteins; 0% ECM proteins). To test the initial hypothesis that the ECM-related pathways were increased in muscle and liver of HF-fed obese mice, we performed gene-annotation enrichment analysis and KEGG (Kyoto Encyclopaedia of Genes and Genomes) pathway mapping using the proteins with a ratio of HF/Chow >2-fold. Our results showed that in skeletal muscle, differentially increased proteins were mainly collagen isoform clusters, which were highly involved in pathways including protein digestion and absorption, ECM–receptor interaction, amoebiasis, platelet activation, focal adhesion and PI3K (Phosphoinositide 3-kinase)-Akt (Protein kinase B) signalling pathway (Table 1). In contrast, in the liver 2-fold increased proteins were mainly involved in metabolic pathways such as glycolysis and gluconeogenesis, metabolism of butanoate, fructose, mannose, pyruvate, carbon, fatty acids and amino acids (Table 1). In contrast to skeletal muscle, none of the collagen isoforms were mapped to the enriched pathways in liver. These results highlight a dramatic difference in protein and pathway changes between muscle and liver, where the ECM remodelling was more prominent in the muscle but not in the liver.
Collagens are the most abundant structural components of the ECM. We further examined the changes of collagen isoforms. The protein abundance ratio of HF/Chow was >1 in 12 out of the 13 collagen isoforms detected in the skeletal muscle, while Col24α1, Col1α1, Col1α2, Col3α1, Col2α1 and Col5α2 were increased by >2-fold in the HF-fed mice relative to chow-fed control mice (Figure 1A). In contrast, in the liver out of the 23 collagen isoforms detected, 11 collagens were shown with a ratio of HF/Chow >1 (Figure 1B). Moreover, the changes were moderate in liver with exception of a 2.36-fold increase in Col25α1 in the HF-fed mice relative to chow-fed control mice. These results suggest a very different signature of collagen changes between insulin-resistant muscle and liver. Unlike in the skeletal muscle, ECM collagens were not consistently increased by HF diet in liver.
As Col24α1 was increased by >10-fold in the muscle of insulin-resistant mice, we further examined its association with diet-induced insulin resistance. Collagen 24α1 is a fibril-forming collagen and it was not previously known to be associated with insulin resistance. Using a mouse protein–protein interaction database (STRING, www.string-db.org) [17], we showed that collagen 24α1 interacts with Col1α1, Col1α2, Col2α1, Col3α1 and Col5α2 (Figure 2), therefore providing evidence for how collagen 24α1 may be associated with insulin resistance.

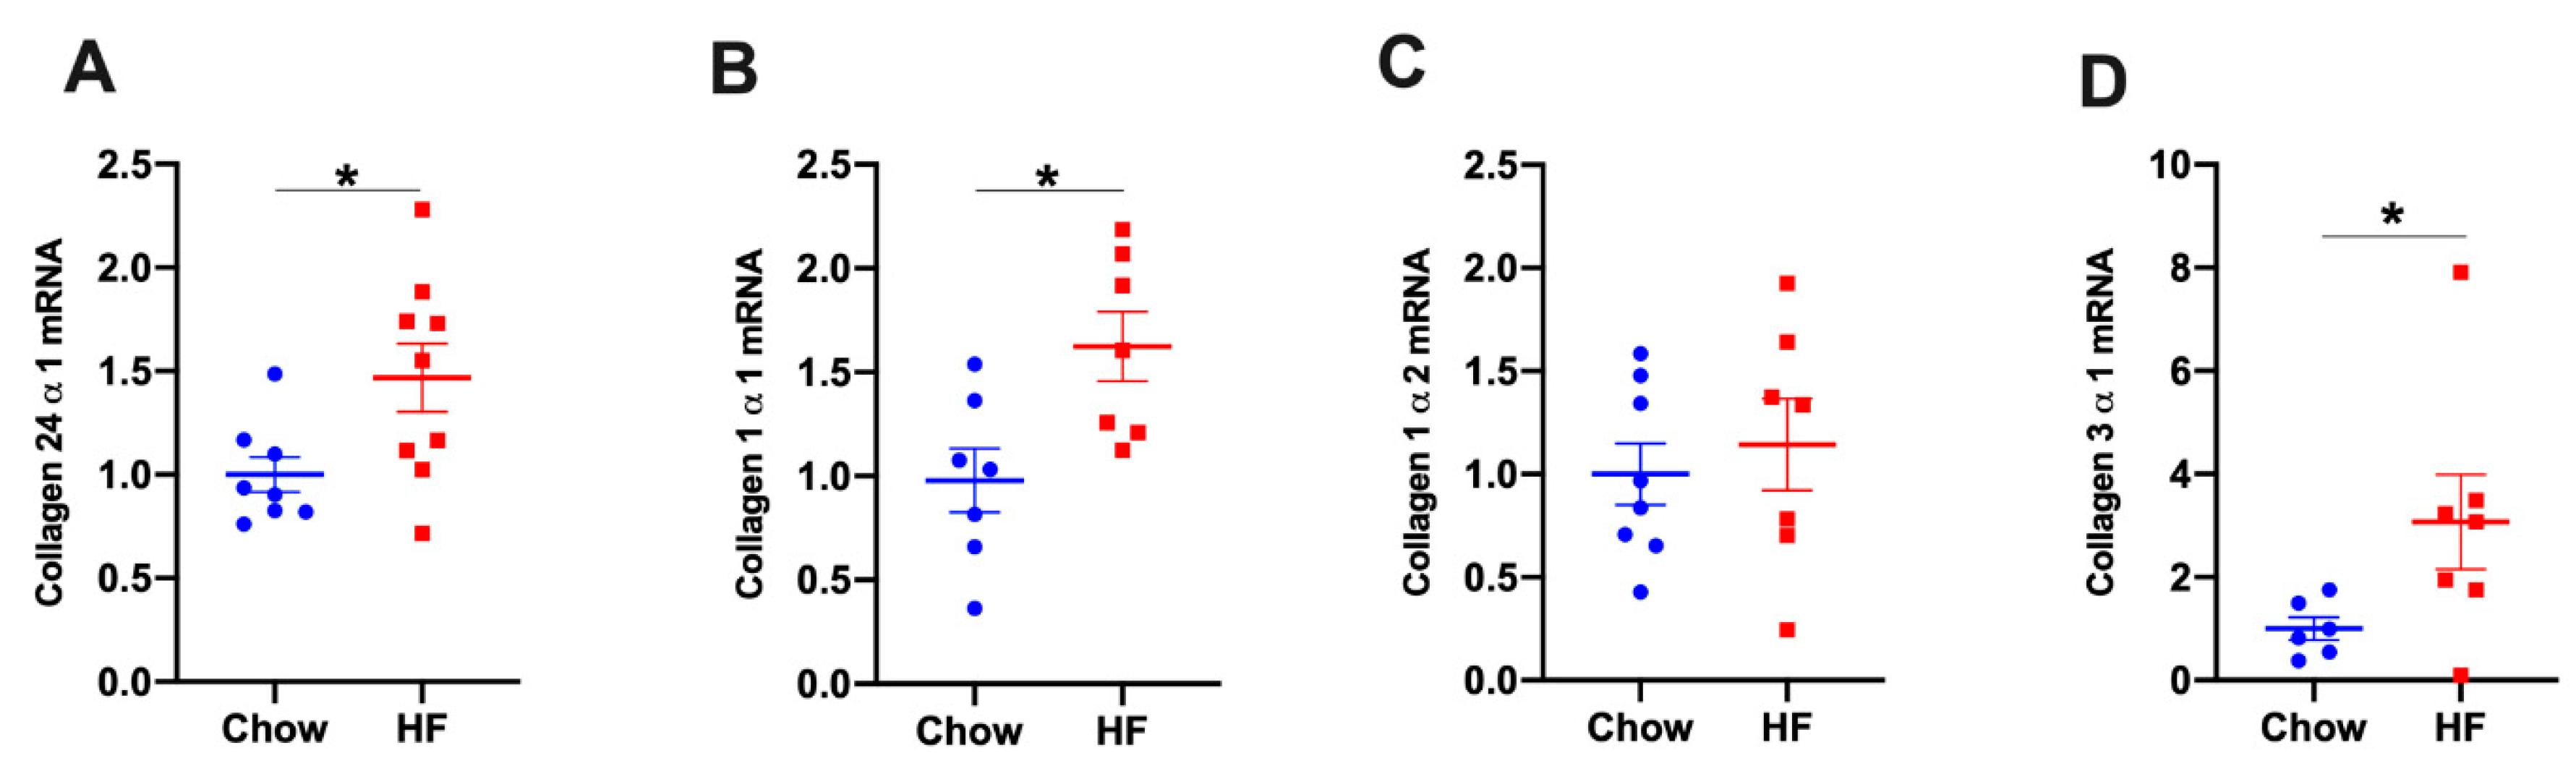
2.2. Col24α1 mRNA Was Increased in Skeletal Muscle of HF-Fed Mice

To investigate the mechanism by which collagens were increased in the skeletal muscle of HF-fed mice, we measured the gene expression of various collagen isoforms. In gastrocnemius muscle, mRNA levels of Col24α1, Col1α1 and Col3α1 (but not Col1α2) were increased in HF-fed mice relative to chow-fed mice, suggesting increased Col24α1, Col1α1 and Col3α1 proteins were due to increased transcripts (Figure 3).

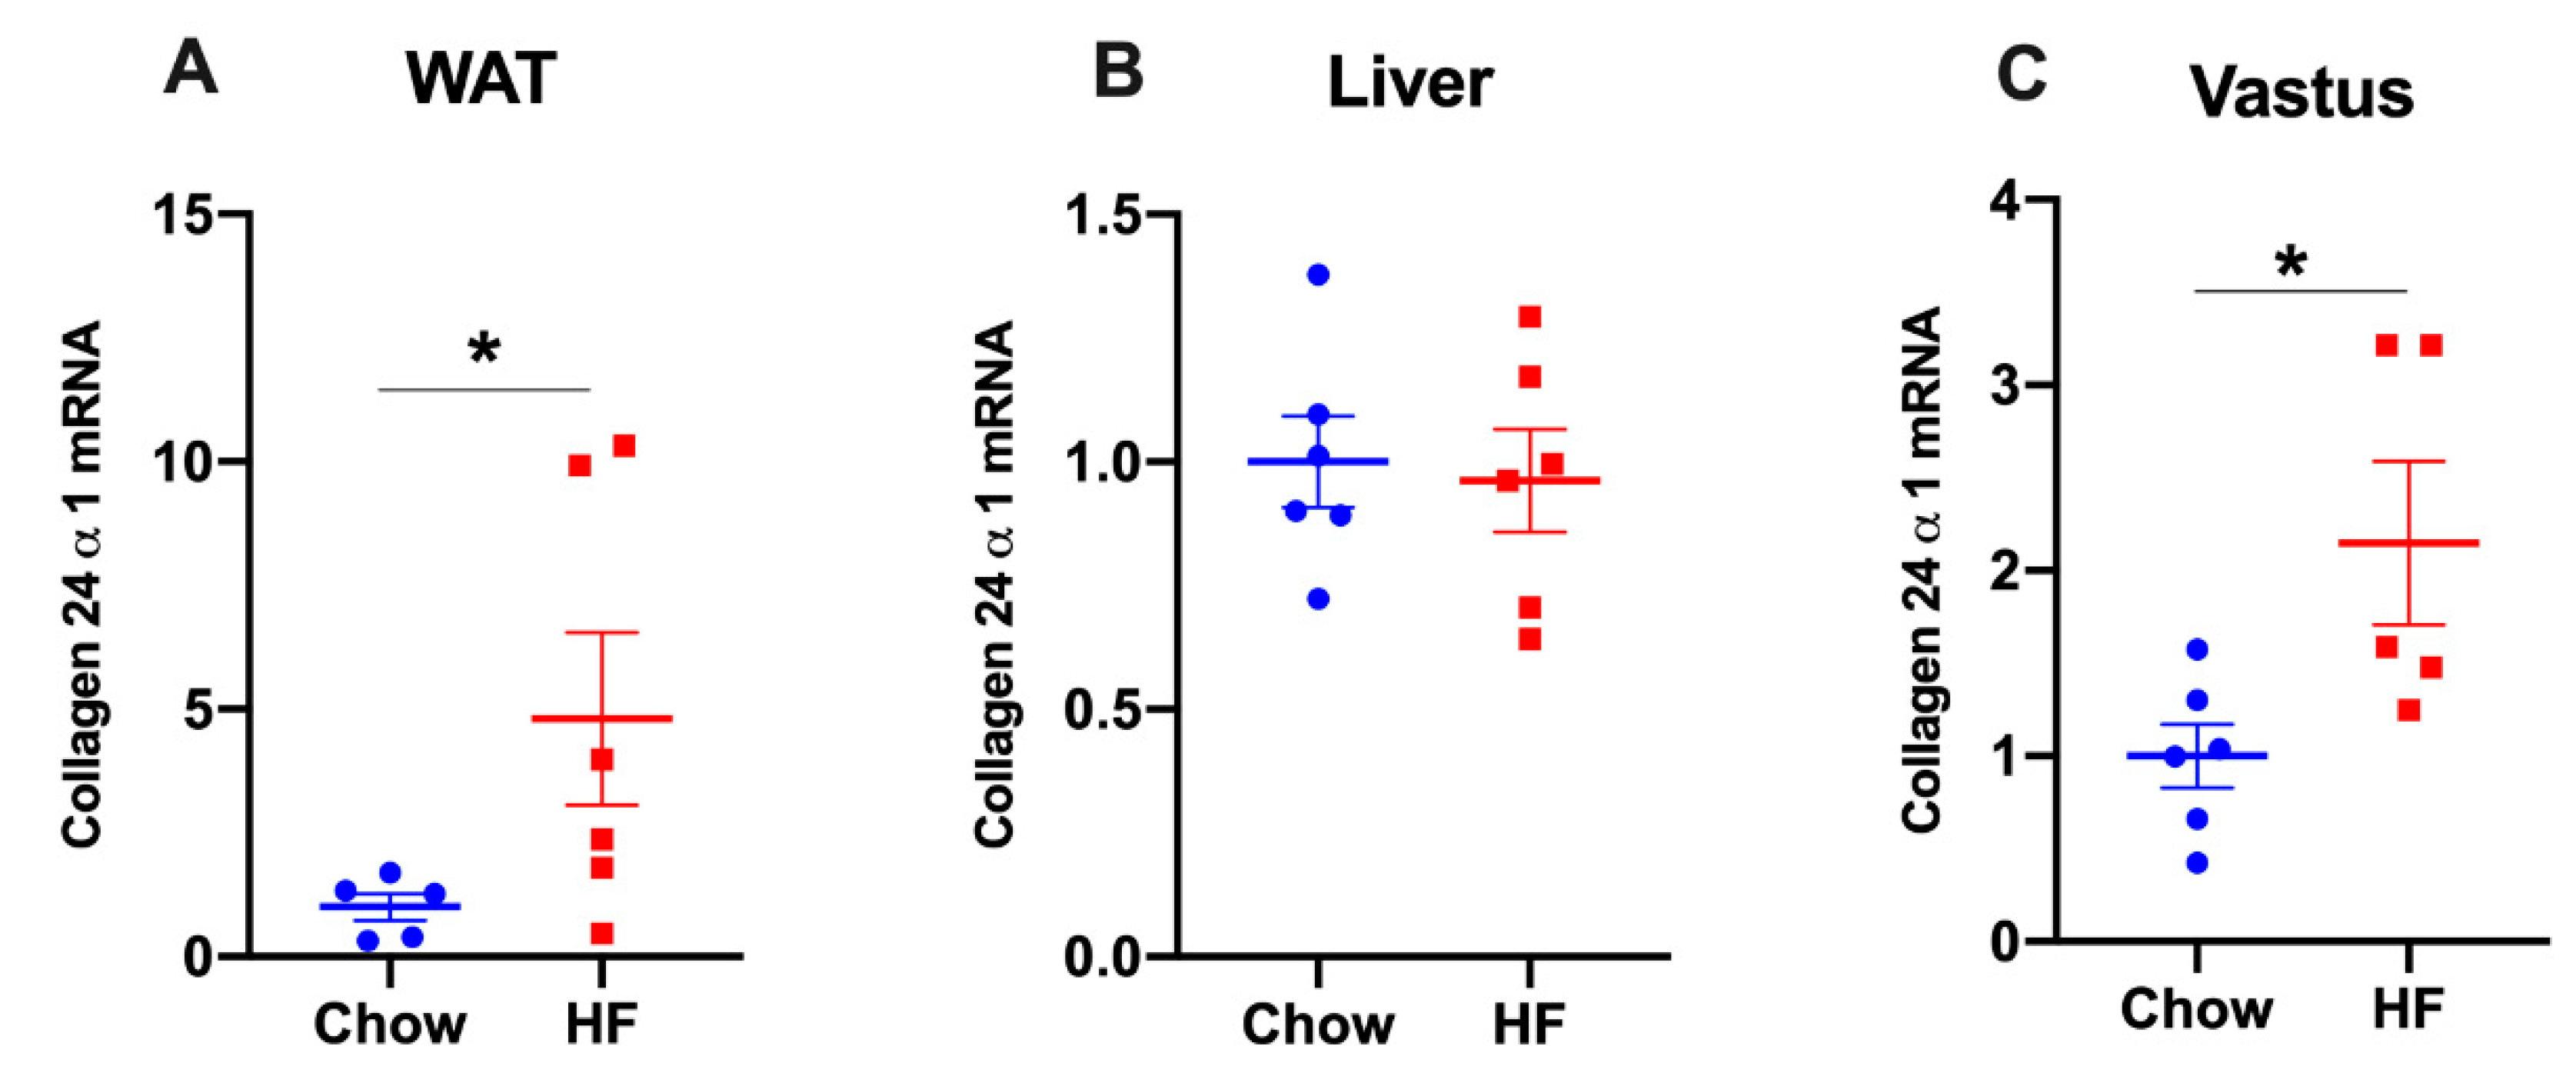
2.3. Col24α1 mRNA Was Increased in White Adipose Tissue, but Not in Liver of HF-Fed Mice

We further examined whether the Col24α1 gene was correspondingly increased in other metabolic tissues of HF-fed mice and found that Col24α1 mRNAs were increased in epididymal white adipose tissue (WAT) and superficial vastus lateralis, but not in the liver (Figure 4). In epididymal adipose tissue, Col24α1 was increased by 5-fold (Figure 4A), relative to a 1.5–2-fold increase in skeletal muscle including gastrocnemius (Figure 3A) and the superficial vastus lateralis (Figure 4C).

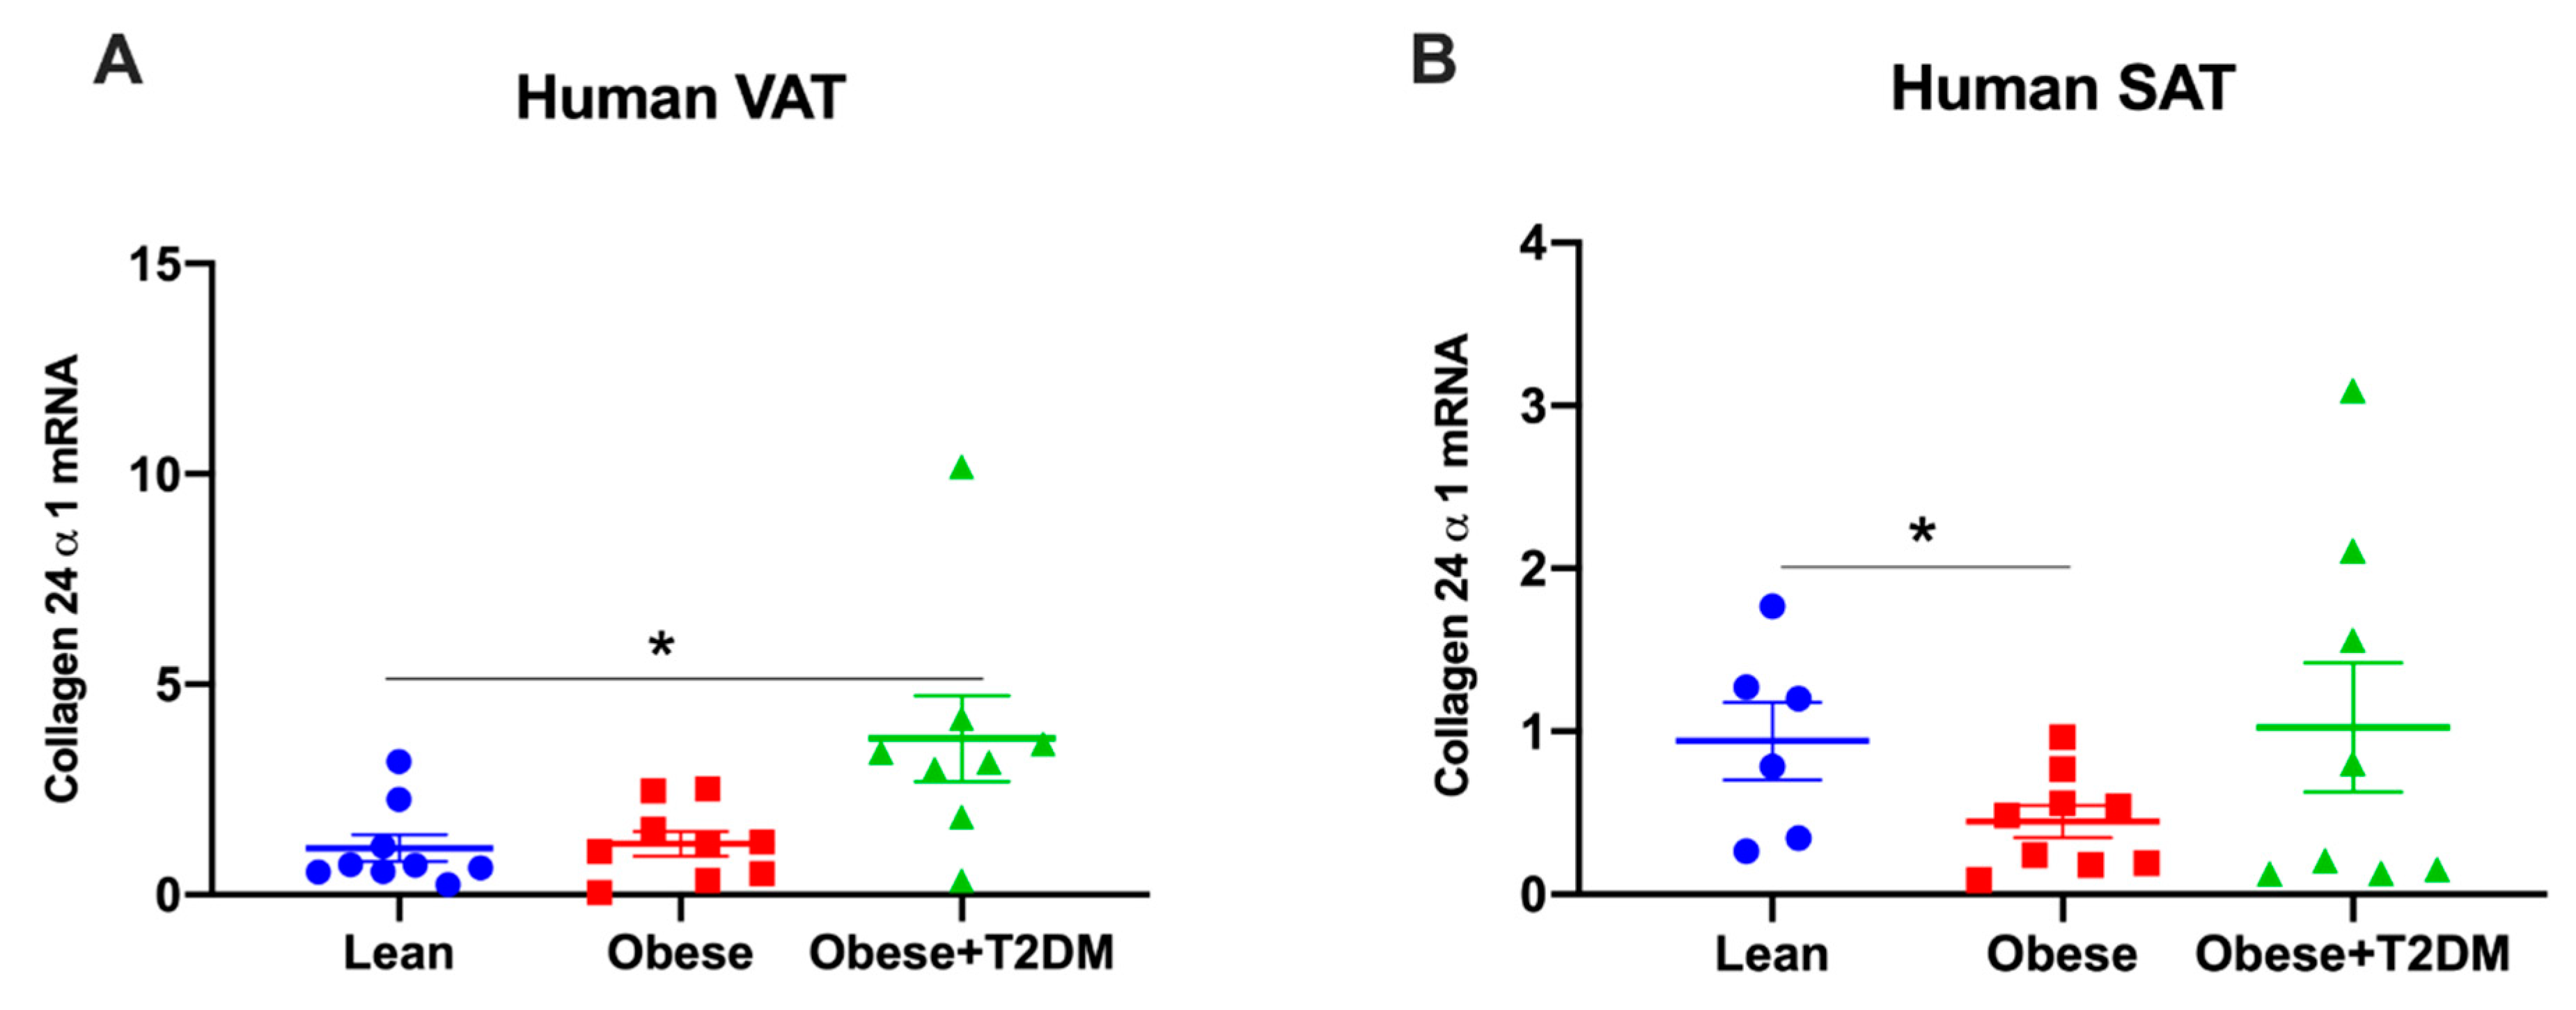
2.4. Col24α1 mRNA Was Increased in Visceral Adipose Tissue of Obese Diabetic Human Subjects

As Col24α1 gene expression was most differentially upregulated in the adipose tissue of obese mice by HF diet, we assessed its expression in human adipose tissue (anthropometric data of human subjects shown in Supplemental Table S3). Col24α1 mRNA was increased in the visceral adipose tissue, but not the subcutaneous adipose tissue of obese diabetic subjects compared to lean subjects (Figure 5). In contrast, Col24α1 mRNA was decreased in the subcutaneous adipose tissue, but was unchanged in the visceral adipose tissue of obese subjects compared to lean subjects (Figure 5).

3. Discussion

Our current study applied an ECM-specific mass spectrometry-based proteomics to characterise the complete view of ECM protein changes associated with high fat (HF) diet feeding in mice. We identified, for the first time, significant differences in protein and pathway changes between muscle and liver. In the skeletal muscle, the ECM-related pathways were shown to be increased. Yet in the liver HF diet-associated changes were mainly pathways involved in metabolism. In particular, the ECM collagen changes were distinct between the insulin-resistant skeletal muscle and liver, where the majority of muscle collagen isoforms were increased whereas the liver collagens were differentially but moderately affected. Moreover, we identified a novel association between collagen 24α1 and insulin resistance in the skeletal muscle and adipose tissue. Increased collagen 24α1 was further seen in the visceral adipose tissue of obese diabetic subjects relative to lean controls, suggesting a potential role of collagen 24α1 in the pathogenesis of insulin resistance, obesity and Type 2 diabetes in mice and human.
Studies of the role of specific ECM components in insulin resistance are pivotal but incomplete. This is mainly due to limitations of current approaches that give a more global view of changes such as oligonucleotide microarray analysis and two-dimensional gel electrophoresis based tandem MS analysis (2-DE/MS-MS) [10,11], where oligonucleotide microarray analysis only detects changes in mRNA levels. Due to the low abundance of ECM proteins relative to most of the cytosolic proteins, detections of ECM proteins by 2-DE/MS-MS were difficult and insufficient. The key step in proteomic analysis of the ECM is their isolation. One traditional method is to homogenise the whole tissue then to separate the ECM by centrifugation [18]. The challenges with this method are contamination with proteins from damaged cells and the disruption of the ECM architecture. We refined methods to minimise contamination and disruption of the ECM using an in situ isolation approach by detergent, SDS [13], which leaves the ECM protein enriched and structure intact. Although preliminary due to the low sample size, our proteomics data are consistent with findings from other biochemical approaches specifically in skeletal muscle [19,20], therefore provide evidence for the ECM-based proteomics as a powerful tool in ECM-related research.
It is significant to see the different pathway changes between the insulin-resistant skeletal muscle and liver of obese mice. We detected less ECM proteins in muscle relative to liver, indeed fewer overall proteins (78 proteins in muscle relative to 265 proteins in liver, Supplemental Tables S1 and S2). This could be due to a more complex cellular components of the liver consisting of multiple cell types, primarily parenchymal cells (hepatocytes) and non-parenchymal cells (kupffer cells, hepatic stellate cells and liver sinusoidal endothelial cells). However, the skeletal muscle is primarily made of muscle fibres from myocytes surrounded by connective tissues. The majority of the ECM collagens were increased in muscle of obese mice suggesting a remodelling towards a more fibrotic state. This is consistent with various previous studies both in mice and human [19,21,22]. However, the liver of obese mice had a balanced and moderate remodelling which may result from more dynamic changes of cell types during obesity [23]. Indeed, the gene-annotation enrichment analysis suggests that the ECM-related pathways were only enriched in the muscle, but not in the liver, suggesting that the ECM remodelling may be more prominent and influential in the muscle. It is worth noting that various isoforms of keratin were also found to be increased in muscle of HF-fed mice by proteomics (Supplemental Table S1). Since no indication of a role of keratin in obesity and insulin resistance, future in-depth investigations will be important and are needed.
Increased collagen protein in insulin-resistant skeletal muscle was shown to be associated with increased mRNA levels. In gastrocnemius muscle, the mRNAs of Col24α1, Col1α1 and Col3α1 were increased by HF diet feeding. These results were consistent with previous results by us [4] and others [22]. The increased protein expression of Col1 and Col3 has also been shown in insulin-resistant skeletal muscle in human [22,24] and mice [4]. Increased collagen protein expression could also be due to decreased degradation by matrix metalloproteinases or MMPs. It has been shown that in skeletal muscle increased collagen protein was due to decreased enzymatic activity of MMP9 [4]. Moreover, genetic deletion of mmp9 gene resulting in increased protein expression of Col3 and Col4 in the muscle, exacerbated HF diet-induced insulin resistance in muscle [25]. Taken together, these results suggest that our data are consistent with previous findings, yet identified a novel association between increased Col24α1 and muscle insulin resistance.
To further establish how Col24α1 may be associated with insulin resistance, we showed that Col24α1 interacts with Col1α1, Col1α2, Col2α1, Col3α1 and Col5α2 from a string networking analysis of the collagens [17]. These results suggest that Col24α1 may regulate or interact with other collagen isoforms that have been shown to be remodelled during muscle insulin resistance, therefore influencing metabolism during excess caloric intake such as HF feeding. Unfortunately, due to the unavailability of a functional collagen 24 antibody, we were unable to further investigate its regulation and interactome.
Although Col24α1 protein was increased by >10-fold in the muscle, its mRNA level was most increased in the white adipose tissue of mice (5-fold) when compared with gastrocnemius muscle (1.5-fold) and superficial vastus lateralis (2-fold). Increased Col24α1 mRNAs in the white adipose tissue of obese mice were consistent with previously reported increases in mRNAs of other collagen isoforms including Col5α2, Col6α2, Col6α3 and Col18α1 [7,26,27,28]. While these studies identified crucial roles of collagens 6 and 18 in the pathogenesis of insulin resistance in obese mice, our studies imply a potential role of collagen 24 in diet-induced insulin resistance. Collagen 24 knockout mice will provide a valuable tool for future investigations.
It has been previously shown that increased collagen deposition is also manifested in human adipose tissue where Col6α3 mRNA was increased in the subcutaneous abdominal and gluteal adipose tissue of metabolically obese subjects [29]. Here we showed that Col24α1 mRNA was not changed in the visceral adipose tissue but decreased in the subcutaneous adipose tissue of obese subjects. These disparities could be due to differences in the study populations, where Khan et al. studied obese Asian Indians relative to Caucasian controls whereas our study compared obese subjects and lean controls of all Caucasian European descendants [29]. Interestingly, the mRNA levels of Col24α1 were indeed increased in the visceral adipose tissue, but not in the subcutaneous adipose tissue of obese and diabetic subjects relative to lean controls. In humans, visceral adipose tissue is associated with insulin resistance, dyslipidaemia and Type 2 diabetes, while subcutaneous adipose tissue is associated with preserved insulin sensitivity and mitigates risk of metabolic disorders [30,31,32]. Moreover, in vitro study revealed that adipocytes from visceral adipose tissue rather than subcutaneous adipose tissue of obese mice showed impaired insulin-stimulated glucose uptake, adipogenesis ability and ECM remodelling representing dysfunctional adipocytes [33]. Thus, our result that Col24α1 mRNA expression was increased in the visceral adipose tissue of obese and diabetic subjects but not in the subcutaneous adipose tissue implied a potential pathogenic role of Col24α1 in obesity and Type 2 diabetes. Col24α1 was previously identified as a minor type V collagen [34] and mice with genetic deletion of Col24α1 were fertile, suggesting that it is not an essential structural protein of the ECM. Therefore, Col24α1 may represent a novel therapeutic target of obesity-related metabolic disorders.
In conclusion, using extracellular compartment-specific proteomics technique we characterised the complete view of ECM changes that were associated with HF diet feeding in skeletal muscle and liver of mice. The distinct signatures of collagen changes between muscle and liver highlight a different role of the ECM remodelling in different tissues of obesity. Furthermore, we identified a novel association between collagen 24α1 and insulin resistance in muscle and white adipose tissue, providing evidence for a potential role of collagen 24α1 in the pathogenesis of diet-induced insulin resistance in these tissues.

4. Materials and Methods

4.1. Animal Models

Male C57BL/6J mice were housed in a temperature (22 ± 1 °C) and humidity-controlled room with a 12 h light/dark cycle. Mice were fed either a chow control diet (D/811004; Special Diets Services, Essex, UK) containing around 13% total proteins, 84% carbohydrates and 3% fat or a 60% high fat (HF, primarily lard-based) diet (824054; Special Diets Services, Essex, UK) for 20 weeks starting at 6 weeks of age. Mice had free access to food and water. Only male mice were used in this study due to their high susceptibility to a robust insulin resistant phenotype after HF feeding. To confirm the hyperglycaemia phenotype, mice were fasted for 5 h in the morning before a blood glucose measurement from the tail vein. All procedures were performed under the UK Home Office Project Licence (P05F71E15; Date of issue 3 May 2019) following the ARRIVE guidelines and were approved by the Welfare and Ethical Use of Animals Committee at the University of Dundee.

4.2. ECM-Specific Mass Spectrometry-Based Proteomics

4.2.1. Isolation of the ECM

Gastrocnemius muscle and liver were collected from 5 h fasted mice (morning fasting). Three or four mice were used for each dietary group. The ECM compartments of the tissues were isolated using an in situ approach by detergent SDS [13]. Gastrocnemius from one leg and ≈500 mg liver were incubated with 1% SDS at 4 °C for 5–7 days. The 1% SDS was changed daily. At the end of the incubation, tissue remains were weighed, frozen and grinded in liquid nitrogen. For proteomics studies, frozen samples were dissolved in 8 M guanidine with 100 mM dithiothreitol and heated. Iodoacetamide (200 mM) was then added and incubated for 45 min at room temperature in the dark. Samples were diluted to achieve a final concentration of 1M guanidine for trypsin digestion. In vivo quantitative proteomics of the ECM compartment in chow- and HF-fed mice were performed using iTRAQ (Isobaric tags for relative and absolute quantitation) labelling.

4.2.2. iTRAQ Labelling Peptide Analysis by LC-MS/MS

Peptide concentration was determined by the bicinchoninic acid (BCA) assay and 100 μg peptides from each sample were used for the assay. Peptides were labelled with iTRAQ four-plex (AB Sciex, Warrington, UK) as previously described [35] and analysed by the LC-MS (Liquid chromatography-mass spectrometry) /MS [36]. Peptides were separated by an Easy nLC-1000 pump connected to an autosampler system (ThermoFisher Scientific, Bremen, Germany) and analysed by a Q-Exactive mass spectrometer (ThermoFisher Scientific, Bremen, Germany) equipped with nanoelectrospray. All resulting MS/MS spectra were assigned to peptides using the IPI (International Protein Index) mouse database version 3.83 by the PEAKS software v.8.5 (Bioinformatics solutions Inc, Waterloo, ON, Canada). Mass tolerance for precursor ions and fragment ions was set to 7 and 10 ppm, respectively. Searches of the MS/MS spectra incorporated fixed modifications of carbamidomethylation of cysteines and iTRAQ four-plex modification of lysines and peptide N termini, as well as the variable modifications of oxidation of methionine, and phosphorylation of serine, threonine and tyrosine residues. Samples (n = 3–4 mice per group) were run on two separate iTRAQ four-plex assays. All data were normalised to one sample from the chow-fed group that was run on both assays as inter-assay control for each protein. Changes of protein abundance caused by HF feeding was presented as the ratio of the mean of samples from HF-fed mice over the mean of samples from chow-fed mice.

4.3. Gene-Annotation Enrichment Analysis and KEGG Pathway Mapping

The Database for Annotation, Visualisation and Integrated Discovery (DAVID) v6.8 (https://david.ncifcrf.gov/home.jsp) was used for the pathway enrichment analysis [37,38]. Proteins that were shown with a ratio of HF/Chow > 2 from the proteomics study were converted to their corresponding gene IDs. The gene list was uploaded, and the functional annotation analysis was run using Mus musculus selected as the species and background. The KEGG pathway was mapped using count threshold of 3 and EASE (modified Fisher exact p value) threshold of 0.05.

4.4. String Network Analysis

Protein–protein associations were determined using the STRING (v.11.0) database (www.string-db.org; ELIXIR, Cambridgeshire, UK) [17], which collect, score and integrate all publicly available sources of protein–protein interaction information, and to complement these with computational predictions. The corresponding gene IDs were used as identifiers.

4.5. Mouse Tissue Collection and Preparation

Mouse tissues were collected from 5 h fasted mice (morning fasting). RNA was isolated from epididymal adipose tissue, gastrocnemius, superficial vastus lateralis or liver samples. Briefly, 30–100 mg tissues were weighed into 1 mL Trizol (93289; Sigma Aldrich, Dorset, UK), lysed by bullet blender and centrifuged at 13,000 rpm for 15 min. The lysates were then treated with chloroform, isopropanol and 75% ethanol to extract RNAs and the total RNAs were dissolved in 30 μL nuclease free water and concentration determined by nanodrop. Then, 1 μg total RNAs were transcribed to cDNAs by SuperScript TM Reverse Transciptase (18064022; ThermoFisher, Perth, UK), according to the manufacturer’s protocol. cDNAs were diluted 20 times before running real-time PCR.

4.6. Human Sample Collection and Preparation

Paired human subcutaneous and visceral adipose tissue samples were obtained from subjects undergoing elective abdominal surgery at the Royal Infirmary of Edinburgh. Superficial subcutaneous tissue was obtained at the incision between the overlying skin and the muscles of the anterior abdominal wall. Visceral tissue was obtained from either omental or mesenteric depot. Samples were obtained from the Edinburgh adipose tissue bank (part of the Lothian NRS Human Annotated Bioresource). Ethical approval was obtained from the East of Scotland Research Ethics Service (15/ES/0094, approved 15 July 2015) and informed consent was obtained from each participant. Samples were immediately frozen at −80 °C until analysis. Then, 30–50 mg tissues were used for total RNA extraction and 2 μg total RNAs were transcribed to cDNAs as described above.

4.7. Measurement of Gene Expression by Real-Time PCR

Quantitative PCR were performed using the TaqMan® Gene Expression assay (ThermoFisher, Perth, UK) for mouse collagen24α1 (Mm013237744_m1), human collagen24α1 (Hs00537706_m1), mouse collagen1α1 (Mm00801666_g1), mouse collagen1α2 (Mm00483888_m1), mouse collagen3α1 (Mm00802331_m1). 18s (Hs99999901_s1) was used as reference controls in human and mouse adipose tissue. Mouse GAPDH (Mm99999915_g1) was used as reference control in the other tissues.

4.8. Statistical Analyses

Data were expressed as mean ± SEM. Proteomics data were presented as HF/Chow ratios. Real-time PCR data were calculated by 2−ΔΔCt using 18 s or GAPDH as reference genes. Statistical analyses were performed using either unpaired Student’s t-test or one-way ANOVA as appropriate and figures were generated by GraphPad Prism software of v.8.4.2 (GraphPad Software, San Diego, CA, USA).The significance level was at p < 0.05.

Supplementary Materials

Supplementary Materials can be found at https://www.mdpi.com/1422-0067/21/16/5738/s1.

Author Contributions

Conceptualisation, D.H.W. and L.K.; Data curation, X.W., D.L., J.T.J.H. and L.K.; Formal analysis, X.W., D.L. and L.K.; Funding acquisition, L.K.; Investigation, X.W., D.L., J.T.J.H. and L.K.; Methodology, X.W., D.L., J.T.J.H. and L.K.; Project administration, L.K.; Resources, R.H.S.; Supervision, L.K.; Writing—original draft, X.W. and L.K.; Writing—review and editing D.L., J.T.J.H., R.H.S. and D.H.W. All authors have read and agreed to the published version of the manuscript.

Funding

This work was supported by Diabetes UK 15/0005256 (L.K.), FP7 People: Marie Curie International Incoming Fellowship 625119 (L.K.), Diabetes Research and Wellness Foundation Pump Priming 2017 (L.K.) and TENOVUS Scotland T14/46 (L.K.). This work was supported by the Vanderbilt Mouse Metabolic Phenotyping Center (DK059637 and DK054902; D.W.). X.W. is supported by a PhD scholarship from Chinese Scholarship Council. Human adipose tissue collections were supported by grants from the Medical Research Council MR/K010271/1 (R.H.S) and Chief Scientist Office SCAF/17/02 (R.H.S.) and the authors acknowledge the financial support of NHS Research Scotland (NRS), through the Edinburgh Clinical Research Facility.

Conflicts of Interest

The authors declare no conflict of interest.

Abbreviations

AktProtein kinase B
BCABicinchoninic acid
ECMExtracellular matrix
HFHigh fat
iTRAQIsobaric tags for relative and absolute quantitation
KEGGKyoto Encyclopaedia of Genes and Genomes
LC-MSLiquid chromatography-mass spectrometry
MMPsMatrix metalloproteinases
MMP9Matrix metalloproteinases 9
MSPI3KMass spectrometry
PI3KPhosphoinositide 3-kinase
SATSubcutaneous adipose tissue
SDSSodium dodecyl sulfate
2-DETwo-dimensional gel electrophoresis
VATVisceral adipose tissue
WATWhite adipose tissue

References

  1. Williams, A.S.; Kang, L.; Wasserman, D.H. The extracellular matrix and insulin resistance. Trends Endocrinol. Metab. 2015, 26, 357–366. [Google Scholar] [CrossRef] [PubMed] [Green Version]
  2. Ahmad, K.; Choi, I.; Lee, Y.H. Implications of Skeletal Muscle Extracellular Matrix Remodeling in Metabolic Disorders: Diabetes Perspective. Int. J. Mol. Sci. 2020, 21, 3845. [Google Scholar] [CrossRef] [PubMed]
  3. Aumailley, M.; Gayraud, B. Structure and biological activity of the extracellular matrix. J. Mol. Med. 1998, 76, 253–265. [Google Scholar] [CrossRef] [PubMed]
  4. Kang, L.; Ayala, J.E.; Lee-Young, R.S.; Zhang, Z.; James, F.D.; Neufer, P.D.; Pozzi, A.; Zutter, M.M.; Wasserman, D.H. Diet-induced muscle insulin resistance is associated with extracellular matrix remodeling and interaction with integrin alpha2beta1 in mice. Diabetes 2011, 60, 416–426. [Google Scholar] [CrossRef] [Green Version]
  5. Kang, L.; Lantier, L.; Kennedy, A.; Bonner, J.S.; Mayes, W.H.; Bracy, D.P.; Bookbinder, L.H.; Hasty, A.H.; Thompson, C.B.; Wasserman, D.H. Hyaluronan accumulates with high-fat feeding and contributes to insulin resistance. Diabetes 2013, 62, 1888–1896. [Google Scholar] [CrossRef] [Green Version]
  6. Hasib, A.; Hennayake, C.K.; Bracy, D.P.; Bugler-Lamb, A.R.; Lantier, L.; Khan, F.; Ashford, M.L.J.; McCrimmon, R.J.; Wasserman, D.H.; Kang, L. CD44 contributes to hyaluronan-mediated insulin resistance in skeletal muscle of high-fat-fed C57BL/6 mice. Am. J. Physiol. Endocrinol. Metab. 2019, 317, E973–E983. [Google Scholar] [CrossRef]
  7. Pasarica, M.; Gowronska-Kozak, B.; Burk, D.; Remedios, I.; Hymel, D.; Gimble, J.; Ravussin, E.; Bray, G.A.; Smith, S.R. Adipose tissue collagen VI in obesity. J. Clin. Endocrinol. Metab. 2009, 94, 5155–5162. [Google Scholar] [CrossRef] [Green Version]
  8. Nomiyama, T.; Perez-Tilve, D.; Ogawa, D.; Gizard, F.; Zhao, Y.; Heywood, E.B.; Jones, K.L.; Kawamori, R.; Cassis, L.A.; Tschöp, M.H.; et al. Osteopontin mediates obesity-induced adipose tissue macrophage infiltration and insulin resistance in mice. J. Clin. Investig. 2007, 117, 2877–2888. [Google Scholar] [CrossRef]
  9. Williams, A.S.; Trefts, E.; Lantier, L.; Grueter, C.A.; Bracy, D.P.; James, F.D.; Pozzi, A.; Zent, R.; Wasserman, D.H. Integrin-Linked Kinase Is Necessary for the Development of Diet-Induced Hepatic Insulin Resistance. Diabetes 2017, 66, 325–334. [Google Scholar] [CrossRef] [Green Version]
  10. Schmid, G.M.; Converset, V.; Walter, N.; Sennitt, M.V.; Leung, K.Y.; Byers, H.; Ward, M.; Hochstrasser, D.F.; Cawthorne, M.A.; Sanchez, J.C. Effect of high-fat diet on the expression of proteins in muscle, adipose tissues, and liver of C57BL/6 mice. Proteomics 2004, 4, 2270–2282. [Google Scholar] [CrossRef]
  11. Szalowska, E.; Dijkstra, M.; Elferink, M.G.; Weening, D.; de Vries, M.; Bruinenberg, M.; Hoek, A.; Roelofsen, H.; Groothuis, G.M.; Vonk, R.J. Comparative analysis of the human hepatic and adipose tissue transcriptomes during LPS-induced inflammation leads to the identification of differential biological pathways and candidate biomarkers. BMC Med. Genom. 2011, 4, 71. [Google Scholar] [CrossRef] [PubMed] [Green Version]
  12. Wang, D.; Eraslan, B.; Wieland, T.; Hallström, B.; Hopf, T.; Zolg, D.P.; Zecha, J.; Asplund, A.; Li, L.H.; Meng, C.; et al. A deep proteome and transcriptome abundance atlas of 29 healthy human tissues. Mol. Syst. Biol. 2019, 15, e8503. [Google Scholar] [CrossRef] [PubMed]
  13. Nakayama, K.H.; Batchelder, C.A.; Lee, C.I.; Tarantal, A.F. Decellularized rhesus monkey kidney as a three-dimensional scaffold for renal tissue engineering. Tissue Eng. Part A 2010, 16, 2207–2216. [Google Scholar] [CrossRef] [PubMed] [Green Version]
  14. Lin, D.; Chun, T.H.; Kang, L. Adipose extracellular matrix remodelling in obesity and insulin resistance. Biochem. Pharmacol. 2016, 119, 8–16. [Google Scholar] [CrossRef] [Green Version]
  15. Wang, W.; Olson, D.; Liang, G.; Franceschi, R.T.; Li, C.; Wang, B.; Wang, S.S.; Yang, S. Collagen XXIV (Col24α1) promotes osteoblastic differentiation and mineralization through TGF-β/Smads signaling pathway. Int. J. Biol. Sci. 2012, 8, 1310–1322. [Google Scholar] [CrossRef] [Green Version]
  16. Matsuo, N.; Tanaka, S.; Yoshioka, H.; Koch, M.; Gordon, M.K.; Ramirez, F. Collagen XXIV (Col24a1) gene expression is a specific marker of osteoblast differentiation and bone formation. Connect. Tissue Res. 2008, 49, 68–75. [Google Scholar] [CrossRef]
  17. Szklarczyk, D.; Gable, A.L.; Lyon, D.; Junge, A.; Wyder, S.; Huerta-Cepas, J.; Simonovic, M.; Doncheva, N.T.; Morris, J.H.; Bork, P.; et al. STRING v11: Protein-protein association networks with increased coverage, supporting functional discovery in genome-wide experimental datasets. Nucleic Acids Res 2019, 47, D607–D613. [Google Scholar] [CrossRef] [Green Version]
  18. Xiao, Z.; Blonder, J.; Zhou, M.; Veenstra, T.D. Proteomic analysis of extracellular matrix and vesicles. J. Proteom. 2009, 72, 34–45. [Google Scholar] [CrossRef]
  19. Inoue, M.; Jiang, Y.; Barnes, R.H., 2nd; Tokunaga, M.; Martinez-Santibañez, G.; Geletka, L.; Lumeng, C.N.; Buchner, D.A.; Chun, T.H. Thrombospondin 1 mediates high-fat diet-induced muscle fibrosis and insulin resistance in male mice. Endocrinology 2013, 154, 4548–4559. [Google Scholar] [CrossRef] [Green Version]
  20. Pincu, Y.; Linden, M.A.; Zou, K.; Baynard, T.; Boppart, M.D. The effects of high fat diet and moderate exercise on TGFβ1 and collagen deposition in mouse skeletal muscle. Cytokine 2015, 73, 23–29. [Google Scholar] [CrossRef]
  21. Sabatelli, P.; Gualandi, F.; Gara, S.K.; Grumati, P.; Zamparelli, A.; Martoni, E.; Pellegrini, C.; Merlini, L.; Ferlini, A.; Bonaldo, P.; et al. Expression of collagen VI α5 and α6 chains in human muscle and in Duchenne muscular dystrophy-related muscle fibrosis. Matrix. Biol. 2012, 31, 187–196. [Google Scholar] [CrossRef] [PubMed] [Green Version]
  22. Berria, R.; Wang, L.; Richardson, D.K.; Finlayson, J.; Belfort, R.; Pratipanawatr, T.; De Filippis, E.A.; Kashyap, S.; Mandarino, L.J. Increased collagen content in insulin-resistant skeletal muscle. Am. J. Physiol. Endocrinol. Metab. 2006, 290, E560–E565. [Google Scholar] [CrossRef] [PubMed]
  23. Arriazu, E.; Ruiz de Galarreta, M.; Cubero, F.J.; Varela-Rey, M.; Pérez de Obanos, M.P.; Leung, T.M.; Lopategi, A.; Benedicto, A.; Abraham-Enachescu, I.; Nieto, N. Extracellular matrix and liver disease. Antioxid. Redox Signal. 2014, 21, 1078–1097. [Google Scholar] [CrossRef] [PubMed] [Green Version]
  24. Richardson, D.K.; Kashyap, S.; Bajaj, M.; Cusi, K.; Mandarino, S.J.; Finlayson, J.; DeFronzo, R.A.; Jenkinson, C.P.; Mandarino, L.J. Lipid infusion decreases the expression of nuclear encoded mitochondrial genes and increases the expression of extracellular matrix genes in human skeletal muscle. J. Biol. Chem. 2005, 280, 10290–10297. [Google Scholar] [CrossRef] [PubMed] [Green Version]
  25. Kang, L.; Mayes, W.H.; James, F.D.; Bracy, D.P.; Wasserman, D.H. Matrix metalloproteinase 9 opposes diet-induced muscle insulin resistance in mice. Diabetologia 2014, 57, 603–613. [Google Scholar] [CrossRef] [PubMed] [Green Version]
  26. Choi, M.S.; Kim, Y.J.; Kwon, E.Y.; Ryoo, J.Y.; Kim, S.R.; Jung, U.J. High-fat diet decreases energy expenditure and expression of genes controlling lipid metabolism, mitochondrial function and skeletal system development in the adipose tissue, along with increased expression of extracellular matrix remodelling- and inflammation-related genes. Br. J. Nutr. 2015, 113, 867–877. [Google Scholar] [PubMed] [Green Version]
  27. Spencer, M.; Yao-Borengasser, A.; Unal, R.; Rasouli, N.; Gurley, C.M.; Zhu, B.; Peterson, C.A.; Kern, P.A. Adipose tissue macrophages in insulin-resistant subjects are associated with collagen VI and fibrosis and demonstrate alternative activation. Am. J. Physiol. Endocrinol. Metab. 2010, 299, E1016–E1027. [Google Scholar] [CrossRef]
  28. Petäistö, T.; Vicente, D.; Mäkelä, K.A.; Finnilä, M.A.; Miinalainen, I.; Koivunen, J.; Izzi, V.; Aikio, M.; Karppinen, S.M.; Devarajan, R.; et al. Lack of collagen XVIII leads to lipodystrophy and perturbs hepatic glucose and lipid homeostasis. J. Physiol. 2020. [Google Scholar] [CrossRef]
  29. Khan, T.; Muise, E.S.; Iyengar, P.; Wang, Z.V.; Chandalia, M.; Abate, N.; Zhang, B.B.; Bonaldo, P.; Chua, S.; Scherer, P.E. Metabolic dysregulation and adipose tissue fibrosis: Role of collagen VI. Mol. Cell Biol. 2009, 29, 1575–1591. [Google Scholar] [CrossRef] [Green Version]
  30. Mori, S.; Kiuchi, S.; Ouchi, A.; Hase, T.; Murase, T. Characteristic expression of extracellular matrix in subcutaneous adipose tissue development and adipogenesis; comparison with visceral adipose tissue. Int. J. Biol. Sci. 2014, 10, 825–833. [Google Scholar] [CrossRef] [Green Version]
  31. Jeffery, E.; Wing, A.; Holtrup, B.; Sebo, Z.; Kaplan, J.L.; Saavedra-Peña, R.; Church, C.D.; Colman, L.; Berry, R.; Rodeheffer, M.S. The Adipose Tissue Microenvironment Regulates Depot-Specific Adipogenesis in Obesity. Cell Metab. 2016, 24, 142–150. [Google Scholar] [CrossRef] [PubMed] [Green Version]
  32. White, U.A.; Tchoukalova, Y.D. Sex dimorphism and depot differences in adipose tissue function. Biochim. Biophys. Acta 2014, 1842, 377–392. [Google Scholar] [CrossRef] [PubMed] [Green Version]
  33. Strieder-Barboza, C.; Baker, N.A.; Flesher, C.G.; Karmakar, M.; Patel, A.; Lumeng, C.N.; O’Rourke, R.W. Depot-specific adipocyte-extracellular matrix metabolic crosstalk in murine obesity. Adipocyte 2020, 9, 189–196. [Google Scholar] [CrossRef] [PubMed] [Green Version]
  34. Gordon, M.K.; Hahn, R.A. Collagens. Cell Tissue Res. 2010, 339, 247–257. [Google Scholar] [CrossRef] [PubMed]
  35. Zhang, Y.; Askenazi, M.; Jiang, J.; Luckey, C.J.; Griffin, J.D.; Marto, J.A. A robust error model for iTRAQ quantification reveals divergent signaling between oncogenic FLT3 mutants in acute myeloid leukemia. Mol. Cell Proteom. 2010, 9, 780–790. [Google Scholar] [CrossRef] [Green Version]
  36. Kim, H.J.; Lin, D.; Lee, H.J.; Li, M.; Liebler, D.C. Quantitative Profiling of Protein Tyrosine Kinases in Human Cancer Cell Lines by Multiplexed Parallel Reaction Monitoring Assays. Mol. Cell Proteom. 2016, 15, 682–691. [Google Scholar] [CrossRef] [Green Version]
  37. Huang da, W.; Sherman, B.T.; Lempicki, R.A. Systematic and integrative analysis of large gene lists using DAVID bioinformatics resources. Nat. Protoc. 2009, 4, 44–57. [Google Scholar] [CrossRef]
  38. da Huang, W.; Sherman, B.T.; Lempicki, R.A. Bioinformatics enrichment tools: Paths toward the comprehensive functional analysis of large gene lists. Nucleic Acids Res. 2009, 37, 1–13. [Google Scholar] [CrossRef] [Green Version]
Figure 1. Proteomic detection of collagens in the extracellular matrix (ECM) of skeletal muscle and liver of chow- and high fat (HF)-fed mice. Gastrocnemius muscle and liver from chow- and HF-fed mice were decellularised by 1% SDS for 5–7 days before subjected to quantitative proteomics using iTRAQ (isobaric tags for relative and absolute quantitation) labelling peptide analysis. Data were presented as the ratio of the mean of samples from HF-fed mice over the mean of samples from chow-fed mice. (A) Collagen protein changes in the gastrocnemius muscle. n = 3:3. (B) Collagen protein changes in the liver. n = 3:4 (Chow:HF).
Ijms 21 05738 g001
Figure 2. String network of the collagens that were increased by >2-fold in the muscle of HF-fed mice. Data was analysed using a mouse protein–protein interaction database (STRING, www.string-db.org) [17]. Coloured lines represent known or predicted interactions, or other associations as indicated.
Ijms 21 05738 g002
Figure 3. The mRNA levels of Col24α1, Col1α1, Col1α2, and Col3α1 in gastrocnemius muscle of chow- and high fat (HF)-fed mice. (A) Col24α1 mRNA expression, n = 8:9 (Chow:HF); (B) Col1α1 mRNA expression, n = 7:7; (C) Col1α2 mRNA expression, n = 8:7; (D) Col3α1 mRNA expression, n = 6:7. Relative mRNA expressions were normalised to GAPDH. Data were presented as means ± SEM, * p < 0.05. HF: high fat.
Ijms 21 05738 g003
Figure 4. The mRNA levels of Col24α1 in other metabolic tissues of chow- and high fat (HF)-fed mice. Col24α1 mRNA expression was measured in epididymal adipose tissue ((A), n = 5:6), liver ((B), n = 6:6), and the superficial vastus lateralis ((C), n = 6:5). Relative mRNA expression was normalised to 18s in epididymal adipose tissue and GAPDH in liver and vastus. Data were presented as means ± SEM, * = p < 0.05. HF: high fat. WAT: white adipose tissue.
Ijms 21 05738 g004
Figure 5. The mRNA levels of Col24α1 in white adipose tissue of lean, obese, obese and diabetic subjects. Col24α1 mRNA expression was measured in human visceral adipose tissue (VAT) ((A), n = 9:9:8) and subcutaneous adipose tissues (SAT) ((B), n = 6:9:8). Relative mRNA expressions were normalised to 18s. Data were presented as means ± SEM, * = p < 0.05. VAT: visceral adipose tissue; SAT: subcutaneous adipose tissue; T2DM: Type 2 diabetes mellitus.
Ijms 21 05738 g005
Table 1. Gene-annotation enrichment analysis and KEGG (Kyoto Encyclopaedia of Genes and Genomes) pathway mapping were performed on proteins that were increased by >2-fold in the skeletal muscle and liver of high fat (HF)-fed mice. The Database for Annotation, Visualisation and Integrated Discovery (DAVID) v6.8 was used for the analysis and modified Fisher exact p value < 0.05 was used as the threshold for significance. Count: numbers of genes involved in the term; %: % coverage of involved genes over total genes in the term; p value: modified Fisher exact p value, the smaller, the more enriched. Benjamini: FDR (false discovery rate) corrected p values.
Skeletal Muscle
CategoryTermCount%GenespValueBenjamini
KEGG_PATHWAYProtein digestion and absorption654.5COL3A1, COL1A2, COL2A1, COL1A1, COL24A1, COL5A21.75 × 10−101.22 × 10⁻⁹
KEGG_PATHWAYECM–receptor interaction654.5COL3A1, COL1A2, COL2A1, COL1A1, COL24A1, COL5A21.75 × 10−101.22 × 10⁻⁹
KEGG_PATHWAYAmoebiasis654.5COL3A1, COL1A2, COL2A1, COL1A1, COL24A1, COL5A27.48 × 10−102.62 × 10⁻⁹
KEGG_PATHWAYPlatelet activation654.5COL3A1, COL1A2, COL2A1, COL1A1, COL24A1, COL5A21.33 × 10−93.10 × 10⁻⁹
KEGG_PATHWAYFocal adhesion654.5COL3A1, COL1A2, COL2A1, COL1A1, COL24A1, COL5A21.35 × 10−82.36 × 10⁻⁸
KEGG_PATHWAYPI3K-Akt signalling pathway654.5COL3A1, COL1A2, COL2A1, COL1A1, COL24A1, COL5A21.93 × 10−72.70 × 10⁻⁷
Liver
CategoryTermCount%GenespValueBenjamini
KEGG_PATHWAYAfrican trypanosomias-is47.0HBA-A1, HBA-A2, APOA1, HBB-B27.60 × 10−40.058
KEGG_PATHWAYBiosynthesis of antibiotics610.5LDHA, ALDOB, FBP1, ALDH2, HADH, ACAT10.0050.171
KEGG_PATHWAYGlycolysis/Gluconeogenesis47.0LDHA, ALDOB, FBP1, ALDH20.0050.118
KEGG_PATHWAYButanoate metabolism35.3HADH, ACAT1, BDH10.0090.156
KEGG_PATHWAYMetabolic pathways1424.6LDHA, SORD, GLUD1, ALDOB, FBP1, ACAT1, LAP3, ALDH1A1, PRDX6, BHMT, ALDH2, ATP5A1, HADH, BDH10.0100.141
KEGG_PATHWAYGap junction47.0TUBB5, TUBA4A, TUBA1A, TUBA1C0.0100.123
KEGG_PATHWAYFructose and mannose metabolism35.3SORD, ALDOB, FBP10.0130.140
KEGG_PATHWAYPyruvate metabolism35.3LDHA, ALDH2, ACAT10.0170.158
KEGG_PATHWAYCarbon metabolism47.0GLUD1, ALDOB, FBP1, ACAT10.0220.178
KEGG_PATHWAYTryptophan metabolism35.3ALDH2, HADH, ACAT10.0250.179
KEGG_PATHWAYMalaria35.3HBA-A1, HBA-A2, HBB-B20.0260.170
KEGG_PATHWAYFatty acid degradation35.3ALDH2, HADH, ACAT10.0270.163
KEGG_PATHWAYLysine degradation35.3ALDH2, HADH, ACAT10.0300.167
KEGG_PATHWAYValine, leucine and isoleucine degradation35.3ALDH2, HADH, ACAT10.0330.172

