In Vitro Comparison of Passive and Active Clinical Proton Beams

 ,
,  , and
, and
Abstract
1. Introduction
2. Results
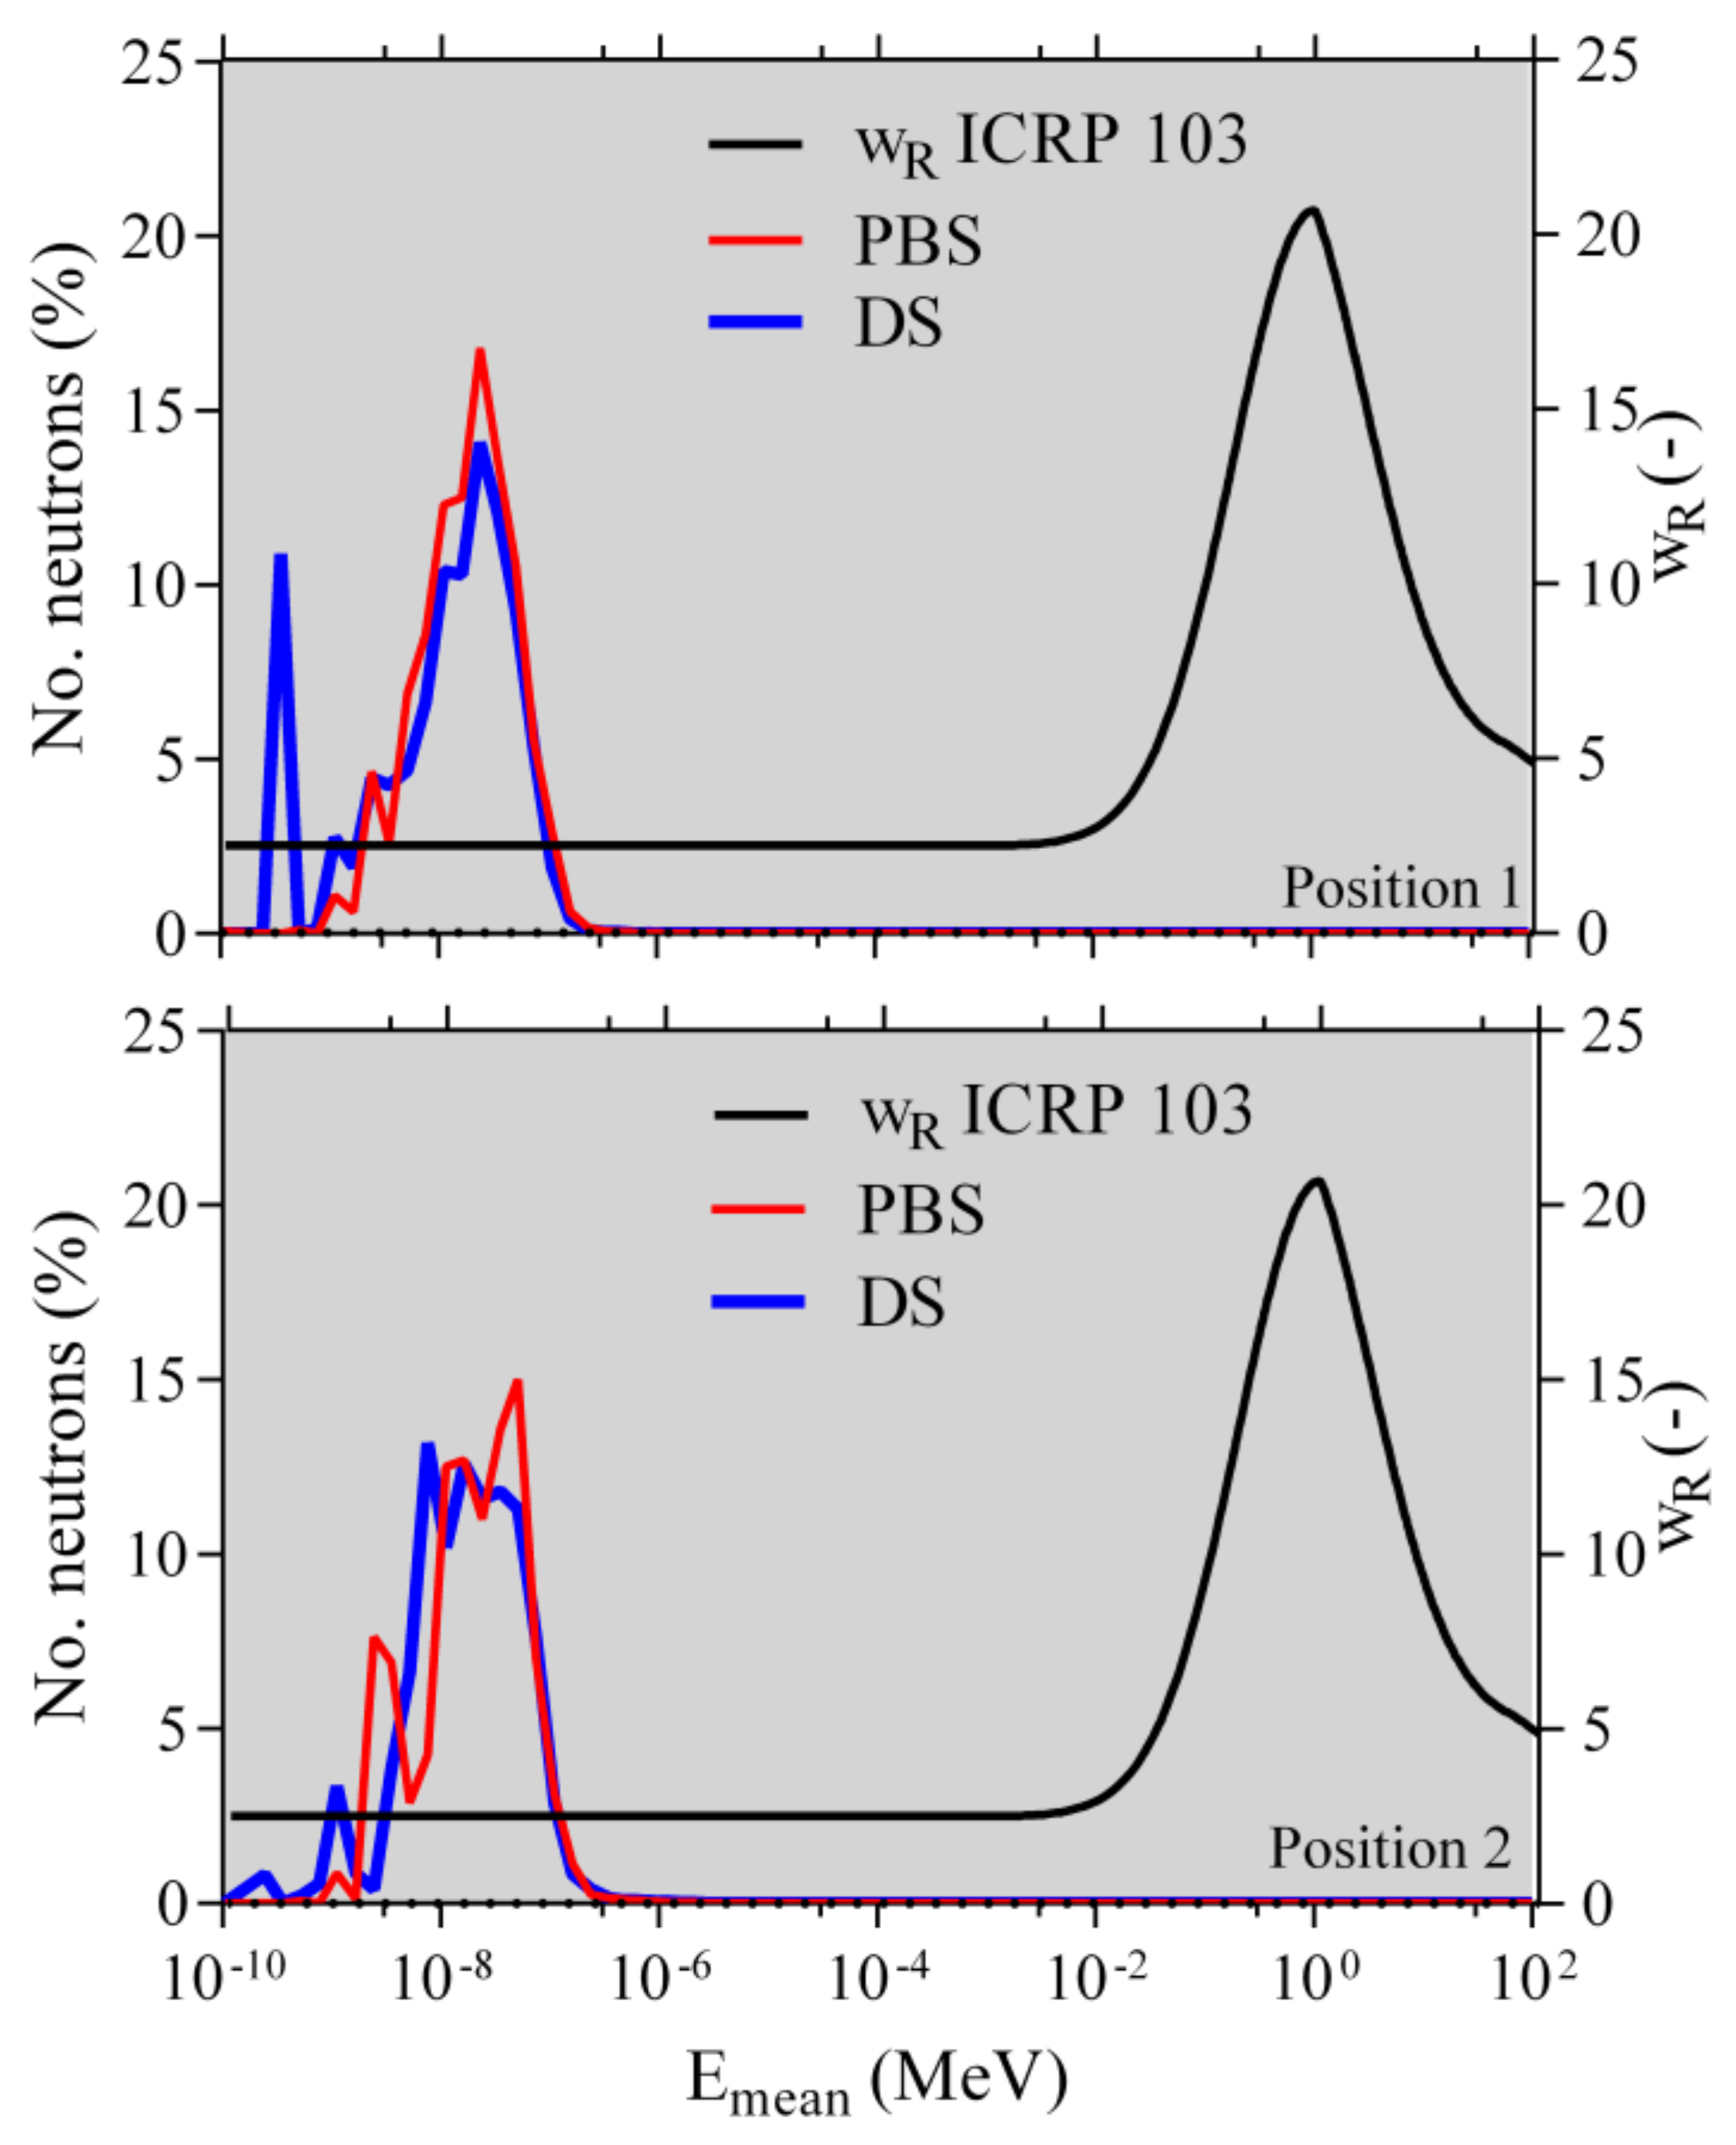
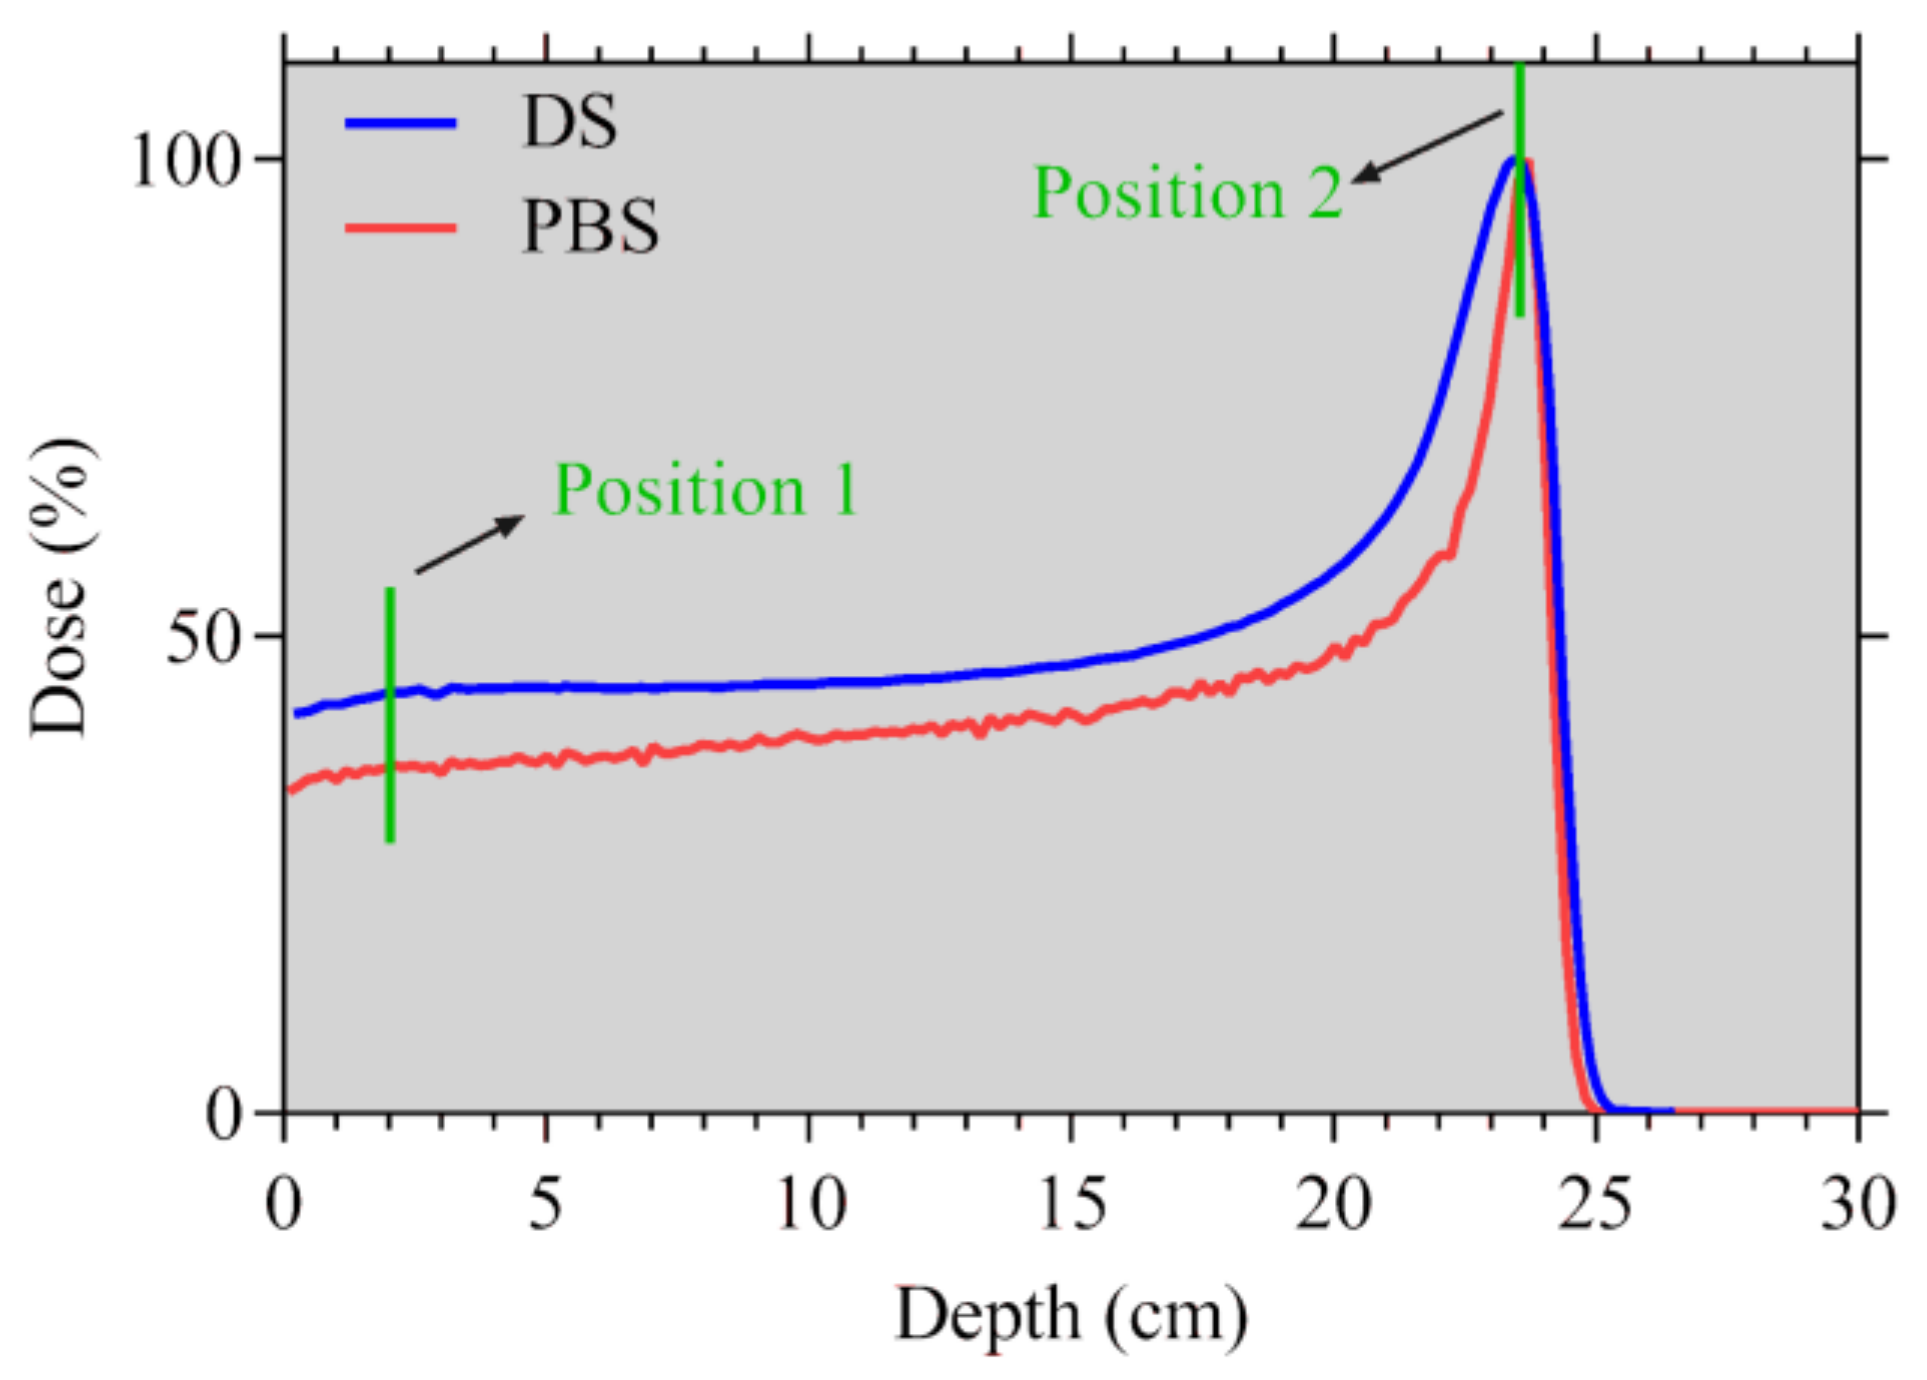
2.1. Monte Carlo Simulations
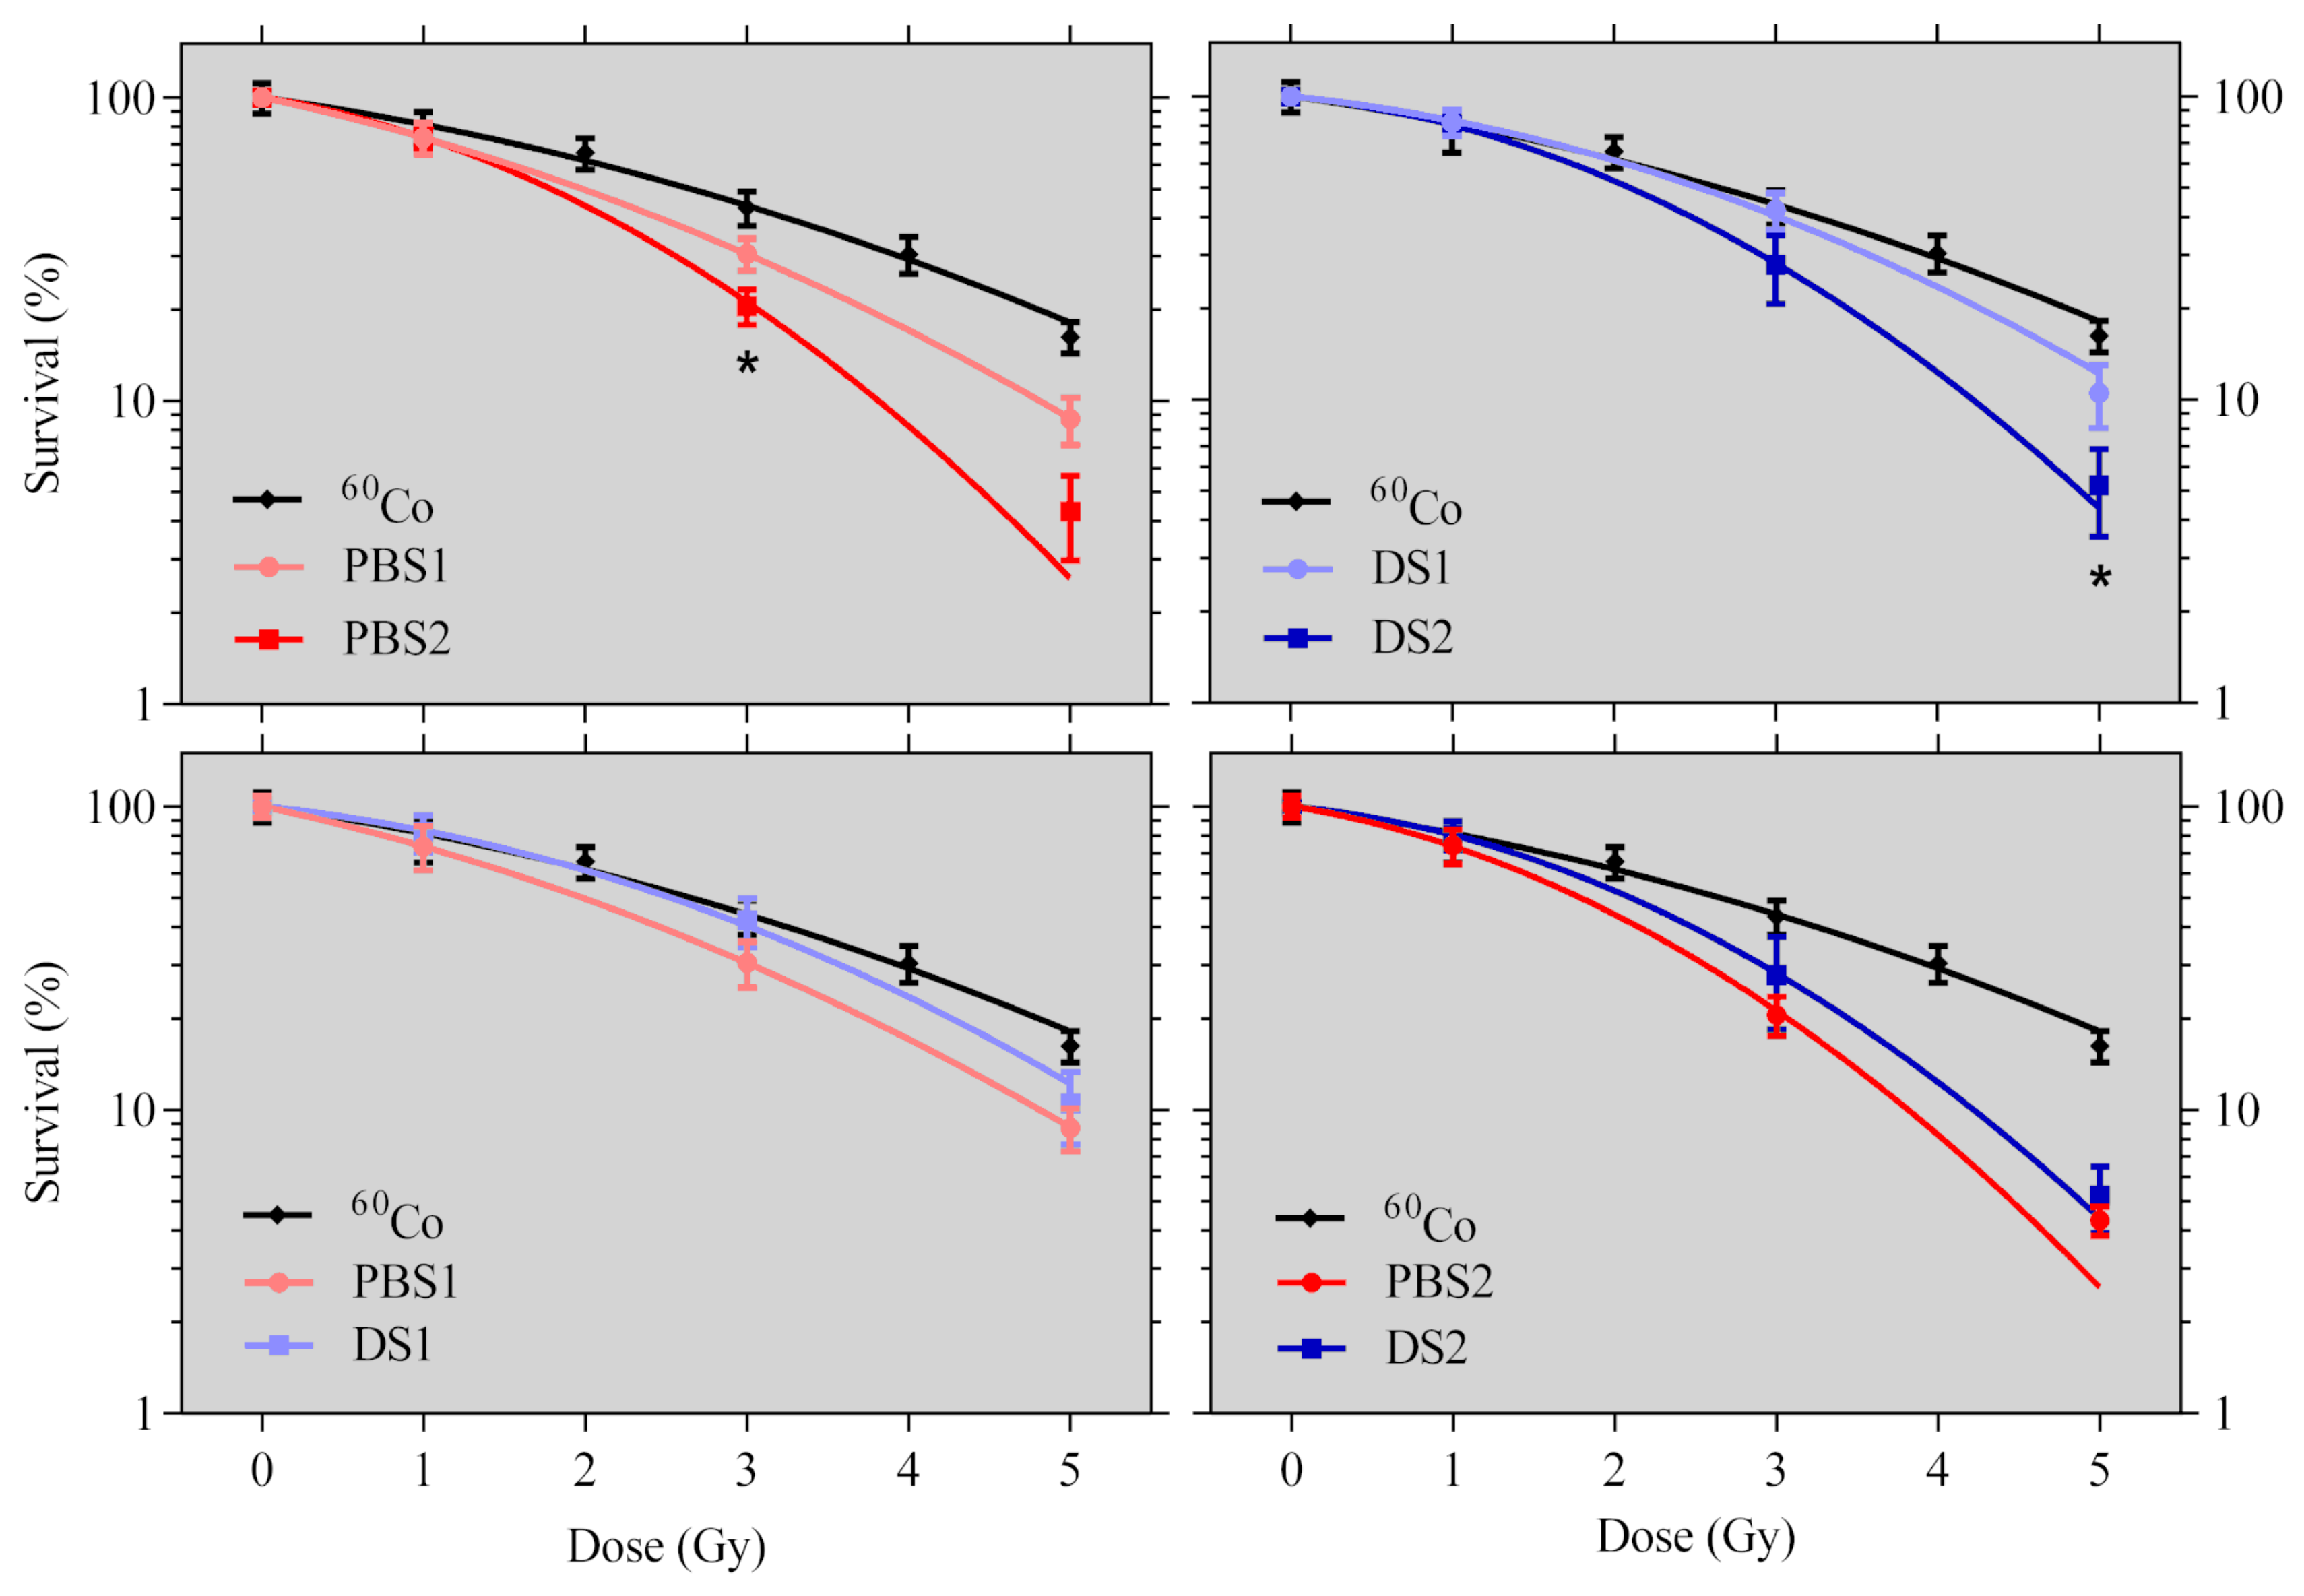
2.2. Cell Survival
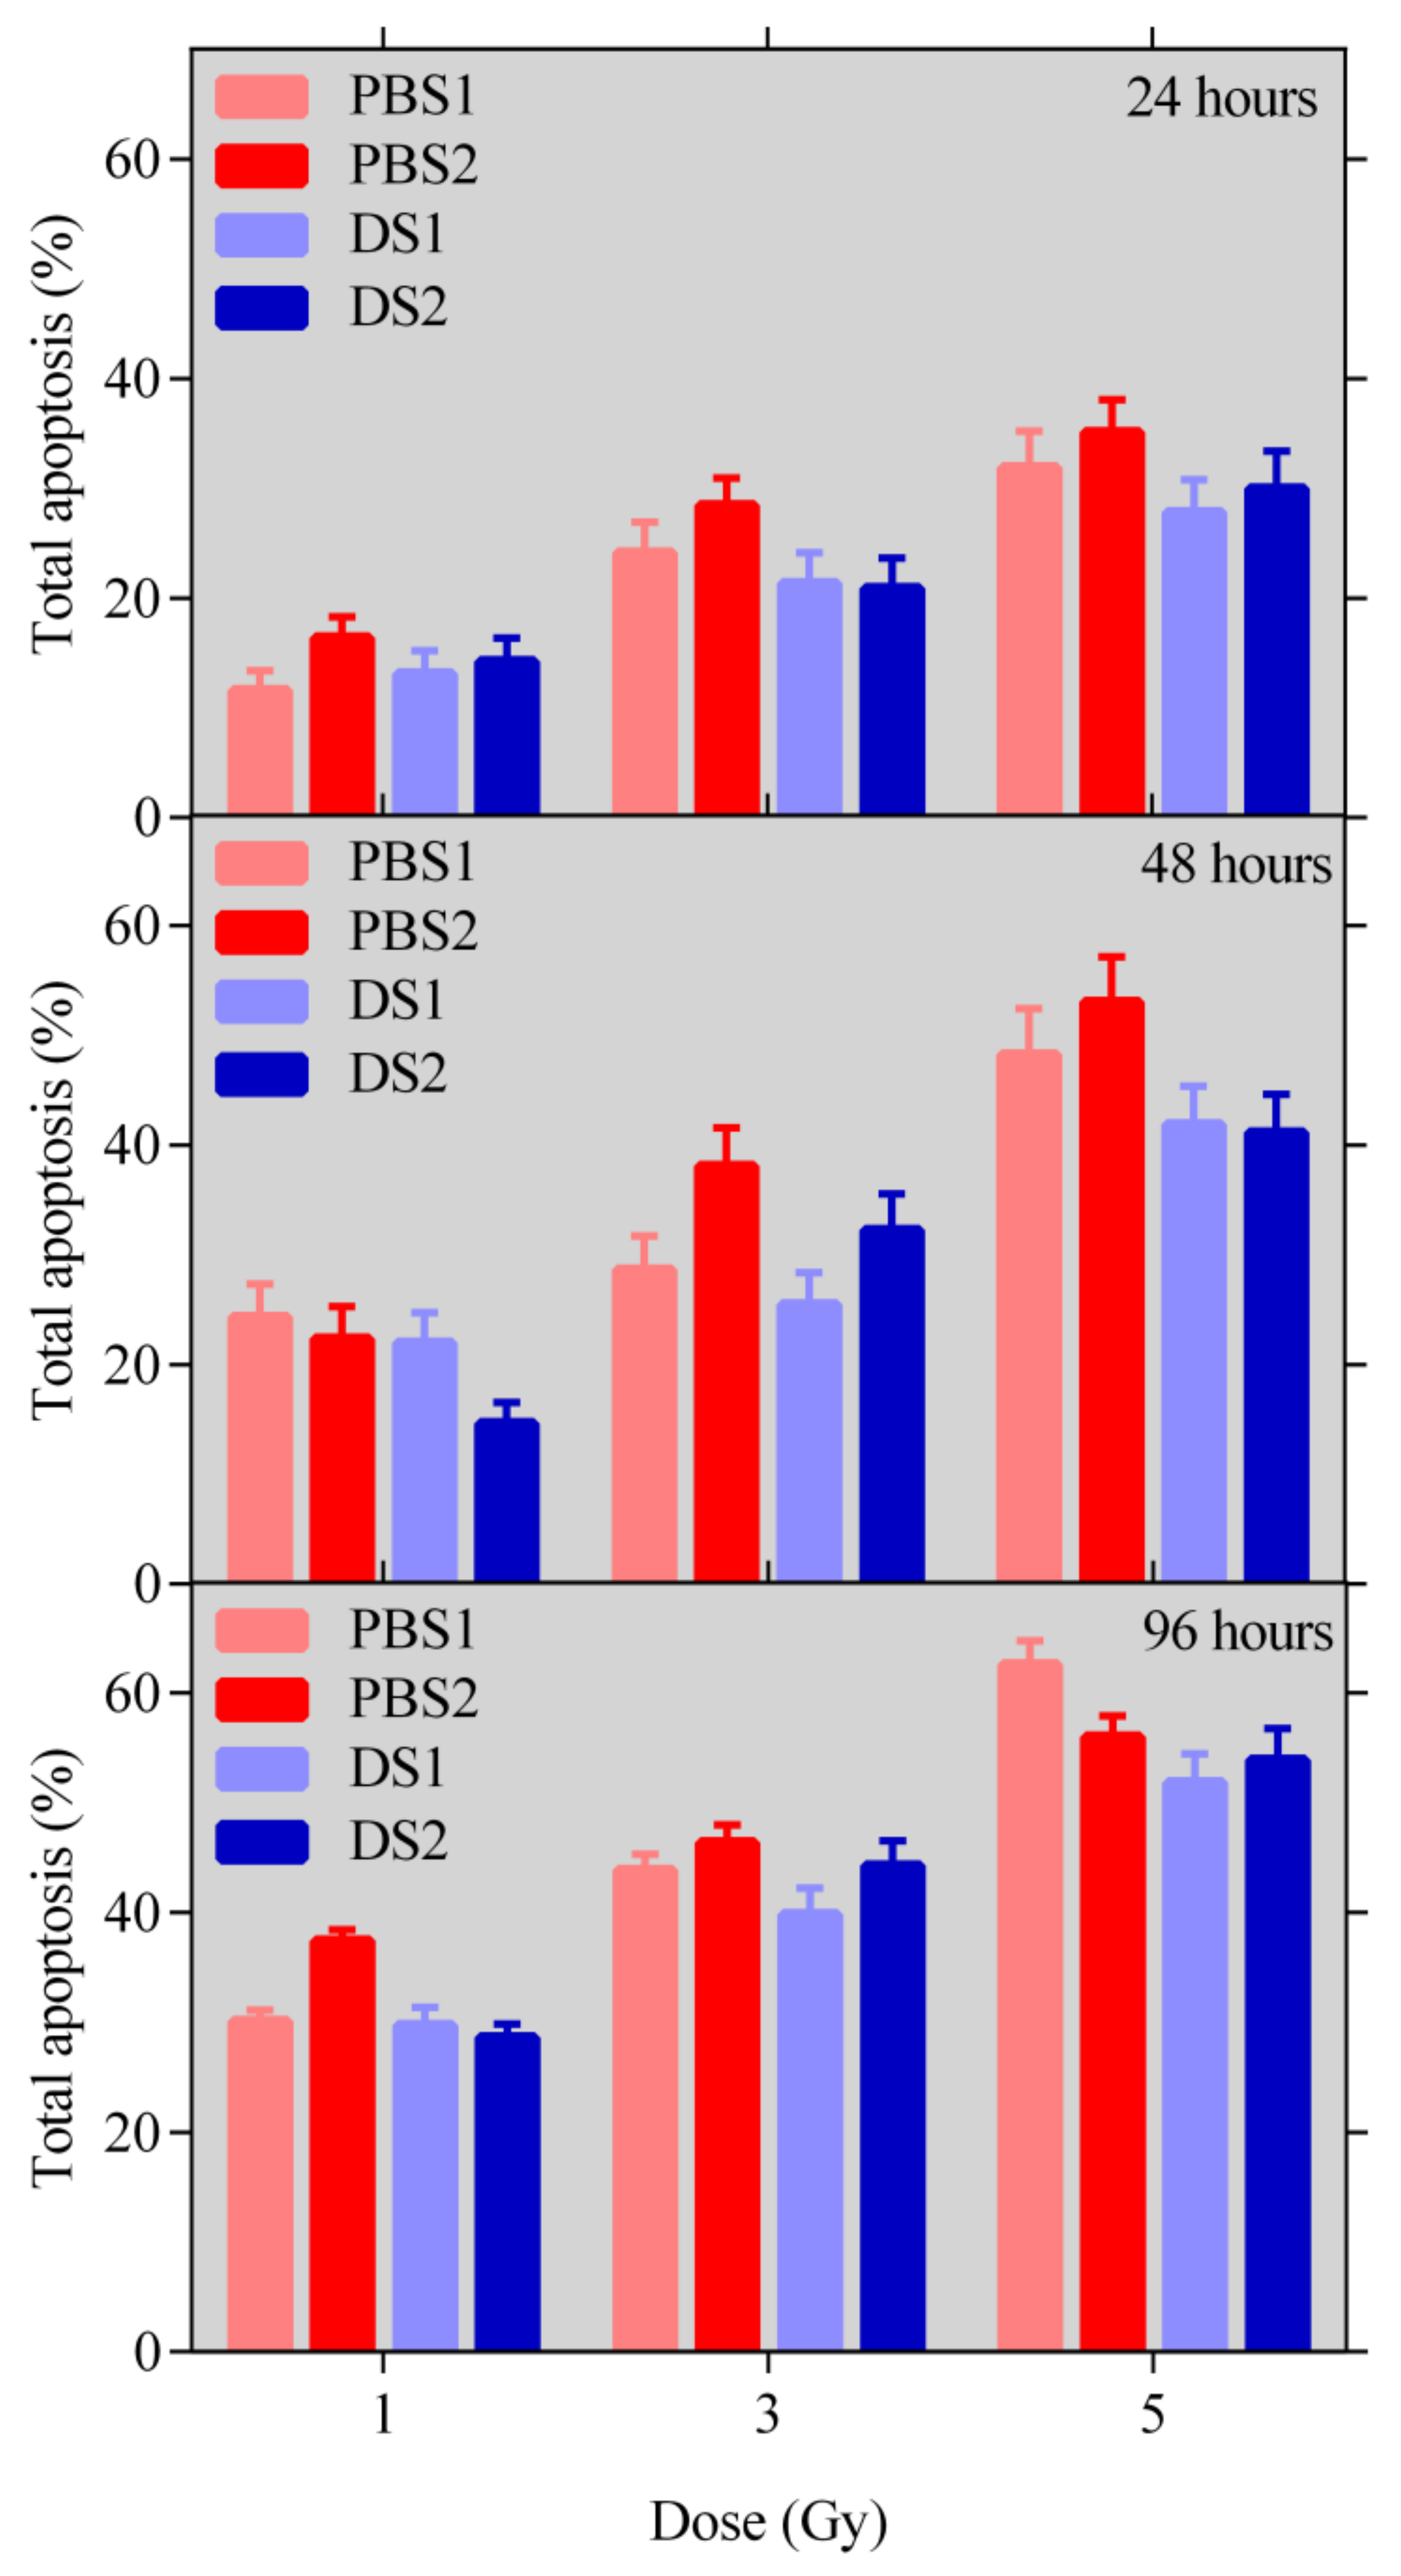
2.3. Apoptosis
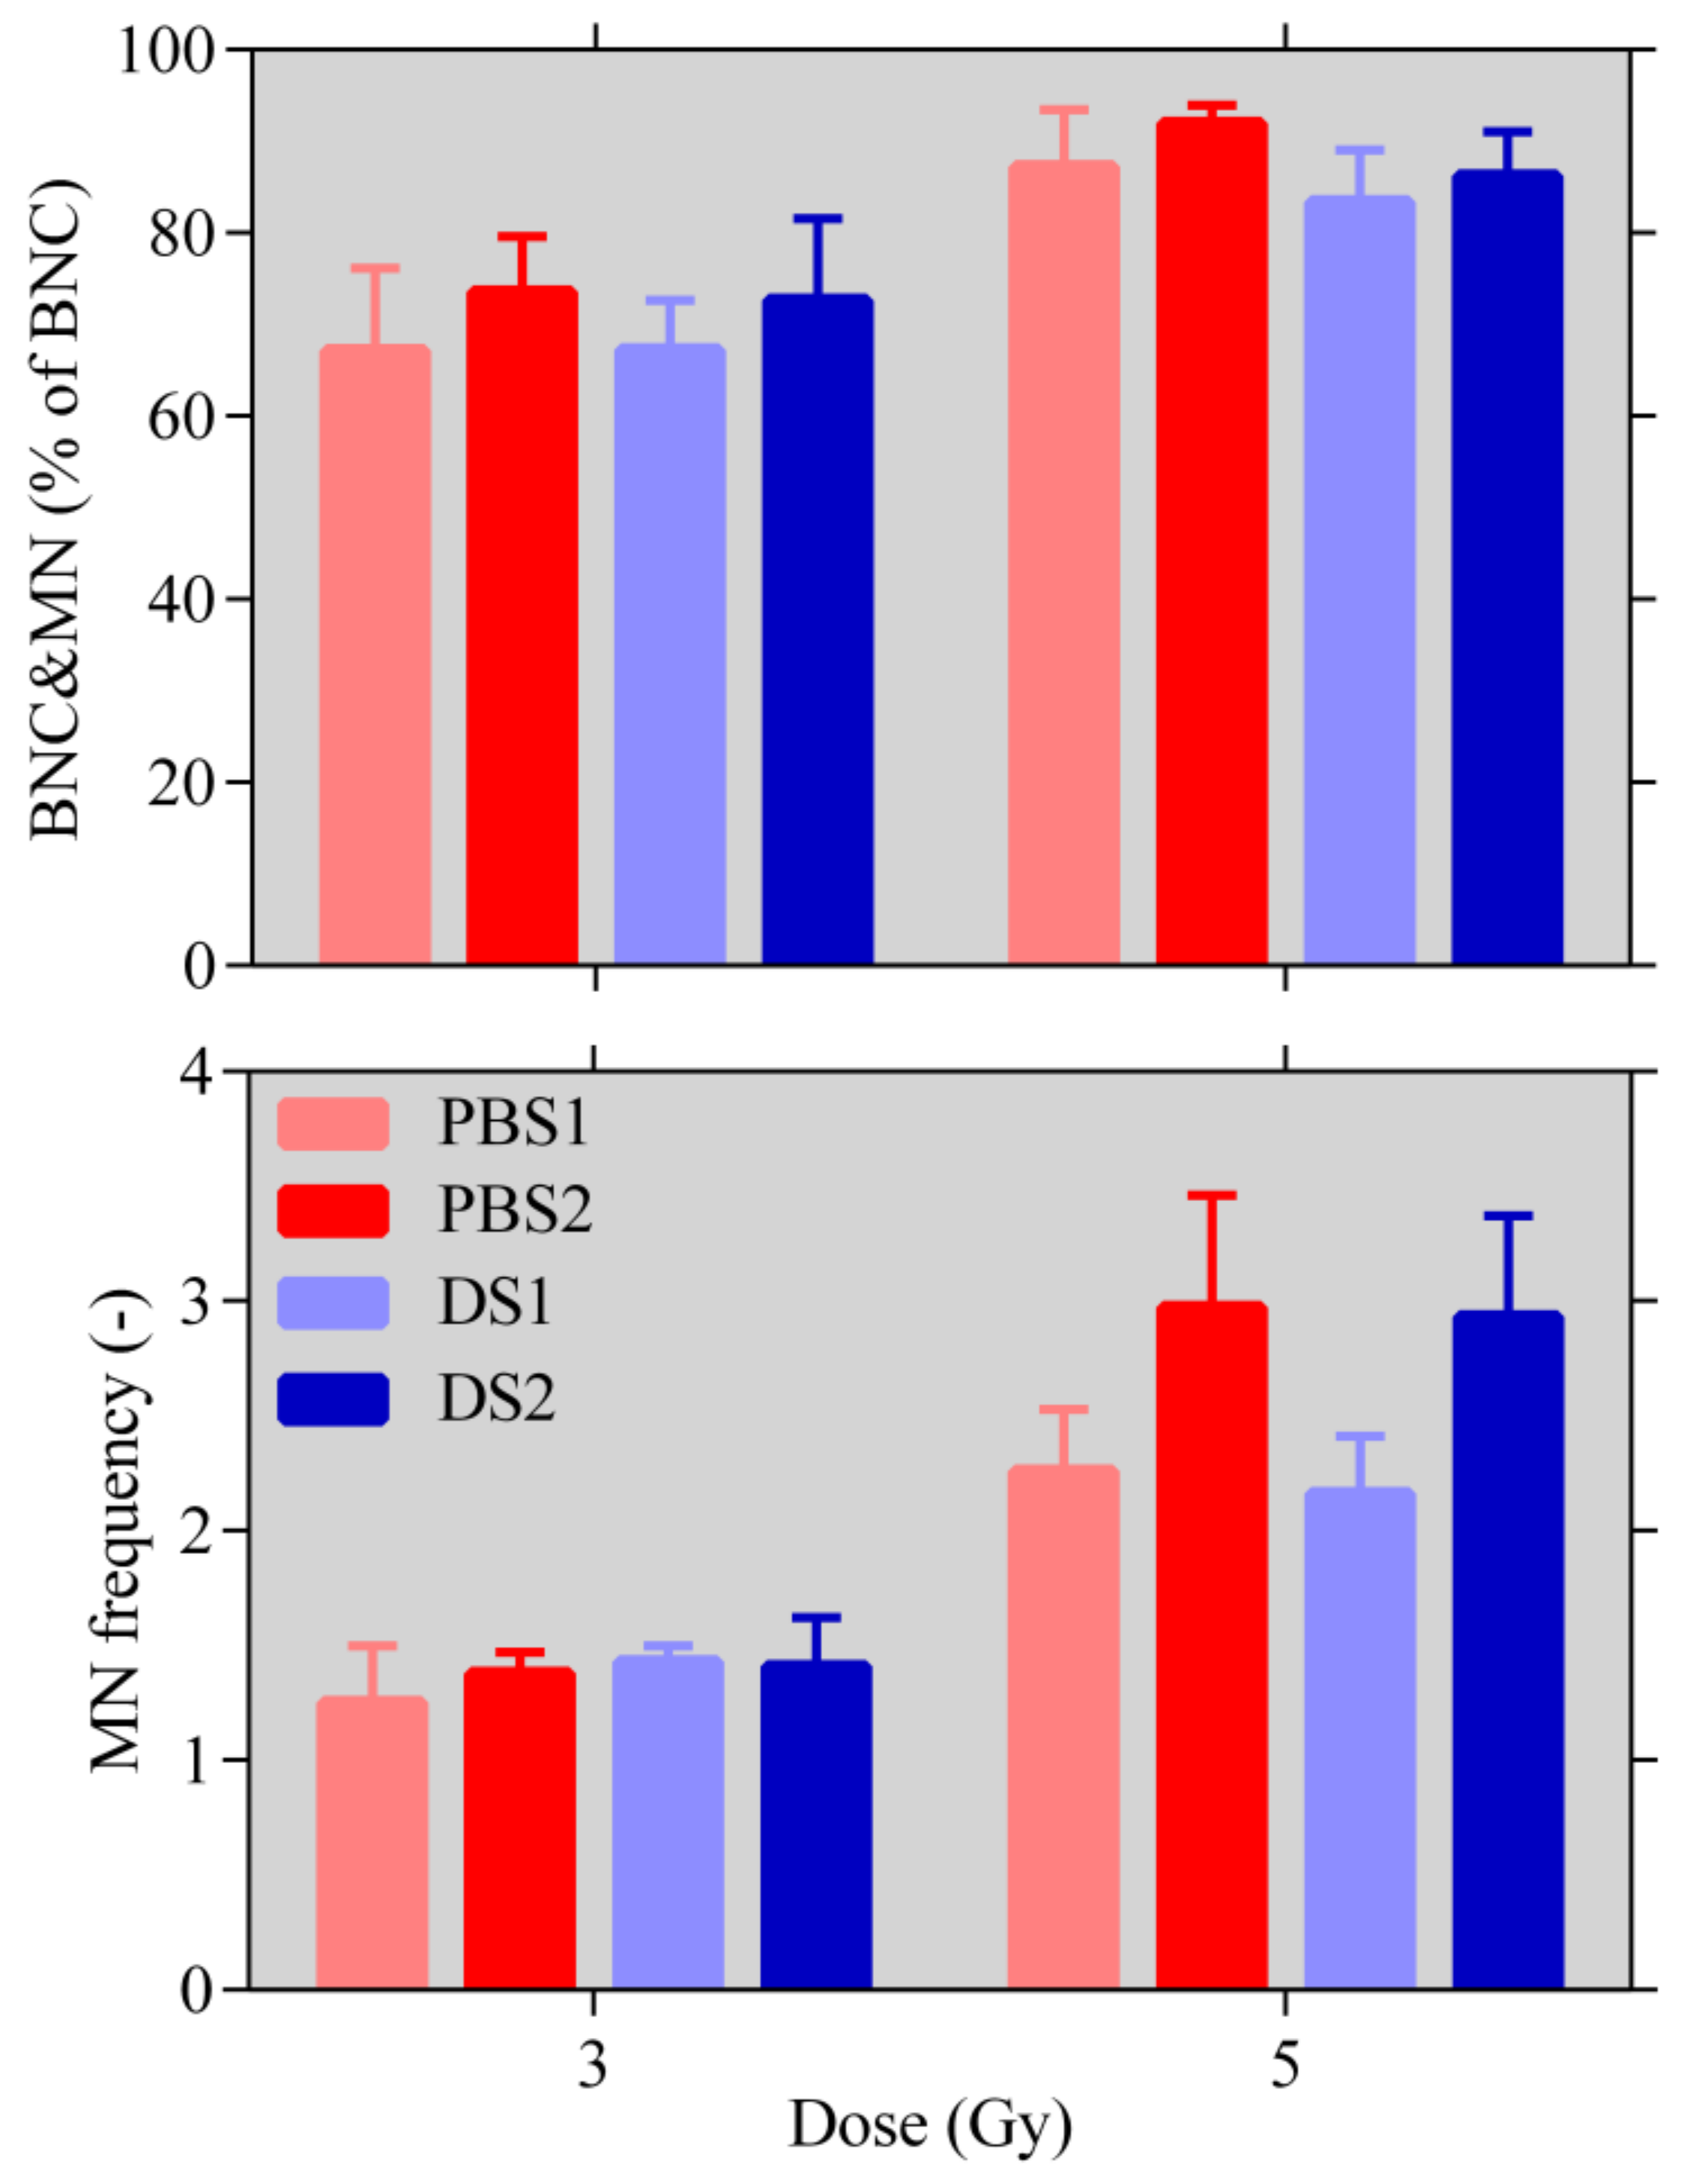
2.4. Micronuclei Assay
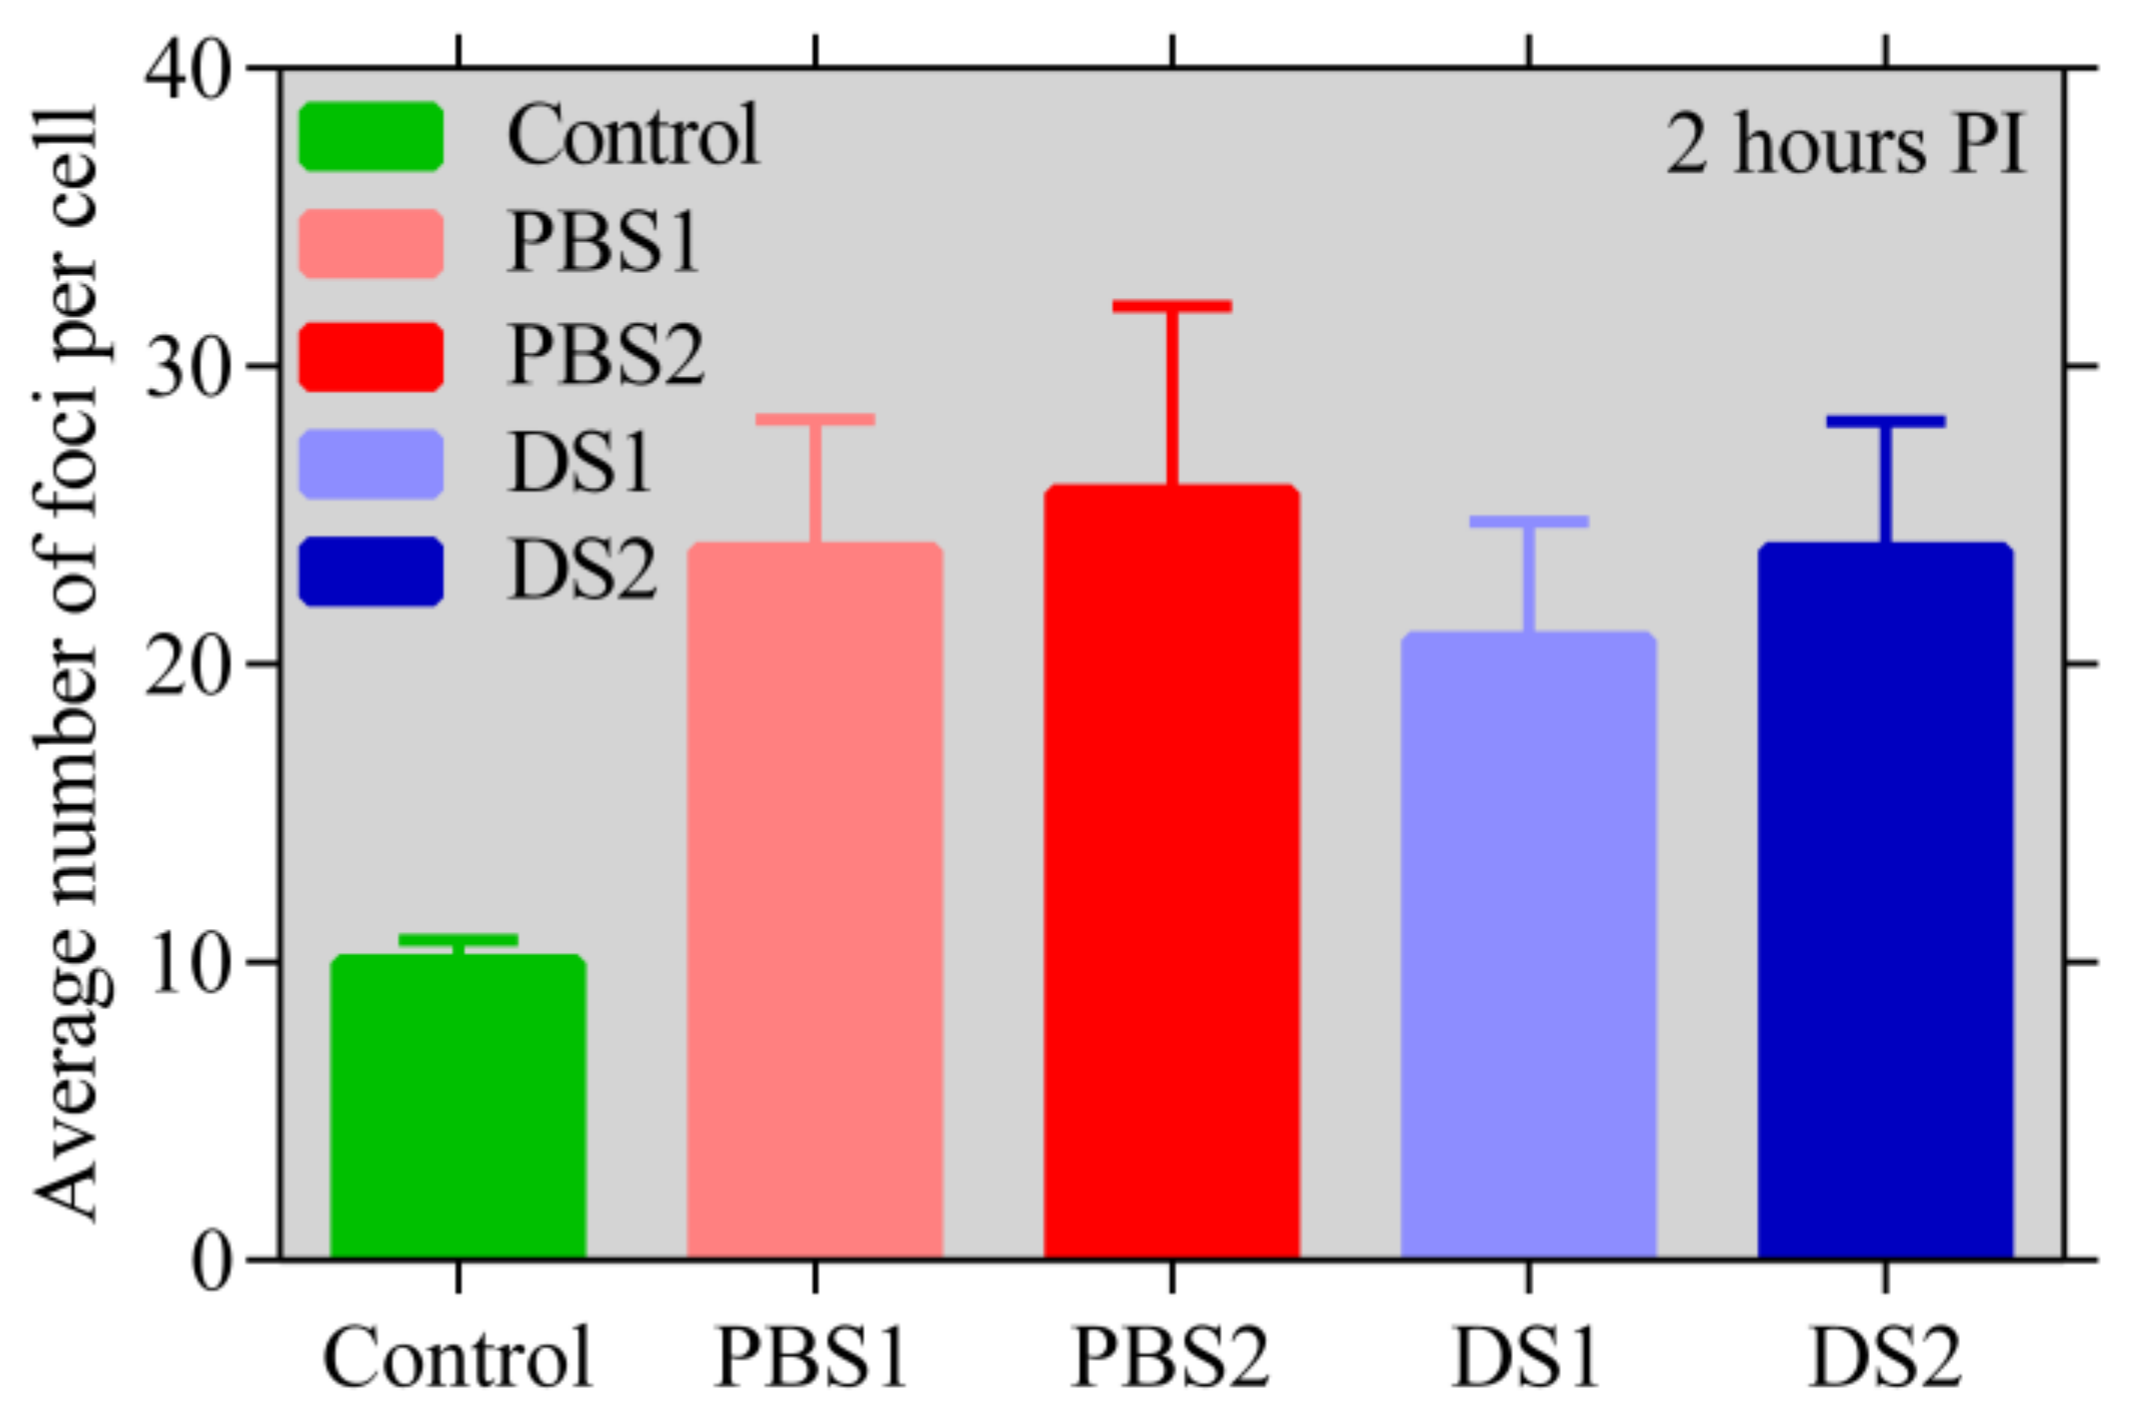
2.5. γ H2AX Assay
3. Discussion
4. Materials and Methods
4.1. Cell Culture
4.2. Proton Beam Description and Monte Carlo Simulations
4.3. Analysis of the Monte Carlo Simulations
4.4. Cell Sample Irradiations
4.5. Post-Irradiation Sample Processing and Data Analysis
4.5.1. Clonogenic Cell Survival Assay
4.5.2. Apoptosis Measurement
4.5.3. Micronuclei Assay
4.5.4. γ H2AX Assay
5. Conclusions
Author Contributions
Funding
Conflicts of Interest
References
- Wilson, R.R. Radiological Use of Fast Protons. Radiolgy 1946, 47, 487–491. [Google Scholar] [CrossRef] [PubMed]
- Lawrence, J.H. Proton irradiation of the pituitary. Cancer 1957, 10, 795–798. [Google Scholar] [CrossRef]
- Paganetti, H. Proton Therapy Physics (Series in Medical Physics and Biomedical Engineering); Taylor & Francis: London, UK, 2012. [Google Scholar]
- Schneider, U.; Agosteo, S.; Pedroni, E.; Besserer, J. Secondary neutron dose during proton therapy using spot scanning. Int. J. Radiat. Oncol. 2002, 53, 244–251. [Google Scholar] [CrossRef]
- Farah, J.; Mareš, V.; Romero-Exposito, M.; Trinkl, S.; Domingo, C.; Dufek, V.; Klodowska, M.; Kubancak, J.; Knežević, Z.; Liszka, M.; et al. Measurement of stray radiation within a scanning proton therapy facility: EURADOS WG9 intercomparison exercise of active dosimetry systems. Med. Phys. 2015, 42, 2572–2584. [Google Scholar] [CrossRef]
- Grassberger, C.; Paganetti, H. Elevated LET components in clinical proton beams. Phys. Med. Boil. 2011, 56, 6677–6691. [Google Scholar] [CrossRef]
- Berry, R.J. Effects of radiation dose-rate: From Protracted, Continuous Irradiation to Ultra-High Dose-Rates from Pulsed Accelerators. Br. Med. Bull. 1973, 29, 44–47. [Google Scholar] [CrossRef]
- Epp, E.R.; Weiss, H.; Ling, C.C. Irradiation of cells by single and double pulses of high intensity radiation: Oxygen sensitization and diffusion kinetics. Curr. Top. Radiat. Res. 1976, 11, 201–250. [Google Scholar]
- Durante, M.; Bräuer-Krisch, E.; Hill, M.A. Faster and safer? FLASH ultra-high dose rate in radiotherapy. Br. J. Radiol. 2017, 91, 20170628. [Google Scholar] [CrossRef]
- McGarry, C.K.; Butterworth, K.T.; Trainor, C.; O’Sullivan, J.M.; Prise, K.M.; Hounsell, A.R. Temporal characterization andin vitrocomparison of cell survival following the delivery of 3D-conformal, intensity-modulated radiation therapy (IMRT) and volumetric modulated arc therapy (VMAT). Phys. Med. Boil. 2011, 56, 2445–2457. [Google Scholar] [CrossRef]
- Lohse, I.; Tanadini-Lang, S.; Hrbacek, J.; Scheidegger, S.; Bodis, S.; Macedo, N.S.; Feng, J.; Lütolf, U.M.; Zaugg, K. Effect of high dose per pulse flattening filter-free beams on cancer cell survival. Radiother. Oncol. 2011, 101, 226–232. [Google Scholar] [CrossRef]
- Favaudon, V.; Caplier, L.; Monceau, V.; Pouzoulet, F.; Sayarath, M.; Fouillade, C.; Poupon, M.-F.; Brito, I.; Hupé, P.; Bourhis, J.; et al. Ultrahigh dose-rate FLASH irradiation increases the differential response between normal and tumor tissue in mice. Sci. Transl. Med. 2014, 6, 245ra93. [Google Scholar] [CrossRef]
- Vozenin, M.-C.; De Fornel, P.; Petersson, K.; Favaudon, V.; Jaccard, M.; Germond, J.-F.; Petit, B.; Burki, M.; Ferrand, G.; Patin, D.; et al. The Advantage of FLASH Radiotherapy Confirmed in Mini-pig and Cat-cancer Patients. Clin. Cancer Res. 2019, 25, 35–42. [Google Scholar] [CrossRef] [PubMed]
- Montay-Gruel, P.-G.; Petersson, K.; Jaccard, M.; Boivin, G.; Germond, J.-F.; Petit, B.; Doenlen, R.; Favaudon, V.; Bochud, F.; Bailat, C.; et al. Irradiation in a flash: Unique sparing of memory in mice after whole brain irradiation with dose rates above 100 Gy/s. Radiother. Oncol. 2017, 124, 365–369. [Google Scholar] [CrossRef] [PubMed]
- Iwata, H.; Ogino, H.; Hashimoto, S.; Yamada, M.; Shibata, H.; Yasui, K.; Toshito, T.; Omachi, C.; Tatekawa, K.; Manabe, Y.; et al. Spot Scanning and Passive Scattering Proton Therapy: Relative Biological Effectiveness and Oxygen Enhancement Ratio in Cultured Cells. Int. J. Radiat. Oncol. Biol. Phys. 2016, 95, 95–102. [Google Scholar] [CrossRef]
- Auer, S.; Hable, V.; Greubel, C.; Drexler, G.A.; Schmid, T.E.; Belka, C.; Dollinger, G.; Friedl, A.A. Survival of tumor cells after proton irradiation with ultra-high dose rates. Radiat. Oncol. 2011, 6, 139. [Google Scholar] [CrossRef] [PubMed]
- Gridley, D.S.; Pecaut, M.; Mao, X.W.; Wroe, A.J.; Luo-Owen, X. Biological Effects of Passive Versus Active Scanning Proton Beams on Human Lung Epithelial Cells. Technol. Cancer Res. Treat. 2015, 14, 81–98. [Google Scholar] [CrossRef]
- Steel, G.G. The ESTRO Breur lecture cellular sensitivity to low dose-rate irradiation focuses the problem of tumour radioresistance. Radiother. Oncol. 1991, 20, 71–83. [Google Scholar] [CrossRef]
- Hamilton, J.; Bernhard, E.J. Cell signalling and radiation survival: The impact of protein phosphatases. Int. J. Radiat. Boil. 2009, 85, 937–942. [Google Scholar] [CrossRef]
- Jeggo, P.A.; Lavin, M.F. Cellular radiosensitivity: How much better do we understand it? Int. J. Radiat. Boil. 2009, 85, 1061–1081. [Google Scholar] [CrossRef]
- Rodemann, H.P. Molecular radiation biology: Perspectives for radiation oncology. Radiother. Oncol. 2009, 92, 293–298. [Google Scholar] [CrossRef]
- ICRP. The 2007 Recommendations of the International Commission on Radiological Protection. ICRP Publication 103. Ann. ICRP 2007, 37. [Google Scholar] [CrossRef]
- Michaelidesová, A.; Vachelová, J.; Puchalska, M.; Brabcová, K.P.; Vondráček, V.; Sihver, L.; Davídková, M. Relative biological effectiveness in a proton spread-out Bragg peak formed by pencil beam scanning mode. Australas. Phys. Eng. Sci. Med. 2017, 47, 359–368. [Google Scholar] [CrossRef] [PubMed]
- Ferrari, A.; Sala, P.R.; Fasso, A.; Ranft, J. FLUKA: A Multi-Particle Transport Code (Program Version 2005); Stanford Linear Accelerator Center: Stanford, CA, USA, 2005. [Google Scholar]
- Böhlen, T.; Cerutti, F.; Chin, M.; Fassò, A.; Ferrari, A.; Ortega, P.G.; Mairani, A.; Sala, P.; Smirnov, G.; Vlachoudis, V. The FLUKA Code: Developments and Challenges for High Energy and Medical Applications. Nucl. Data Sheets 2014, 120, 211–214. [Google Scholar] [CrossRef]
- Falk, M.; Emilie, L.; Kozubek, S. Higher-order chromatin structure in DSB induction, repair and misrepair. Mutat. Res. Mutat. Res. 2010, 704, 88–100. [Google Scholar] [CrossRef] [PubMed]
- Dale, R.G. Use of the Linear-Quadratic Radiobiological Model for Quantifying Kidney Response in Targeted Radiotherapy. Cancer Biother. Radiopharm. 2004, 19, 363–370. [Google Scholar] [CrossRef]
- Fenech, M.; Chang, W.P.; Kirsch-Volders, M.; Holland, N.; Bonassi, S.; Zeiger, E. HUMN project: Detailed description of the scoring criteria for the cytokinesis-block micronucleus assay using isolated human lymphocyte cultures. Mutat. Res. Genet. Toxicol. Environ. Mutagen. 2003, 534, 65–75. [Google Scholar] [CrossRef]
- Falk, M.; Hausmann, M.; Lukášová, E.; Biswas, A.; Hildenbrand, G.; Davídková, M.; Krasavin, E.; Kleibl, Z.; Falková, I.; Ježková, L.; et al. Determining Omics spatiotemporal dimensions using exciting new nanoscopy techniques to assess complex cell responses to DNA damage: Part A--Radiomics. Crit. Rev. Eukaryot. Gene Expr. 2014, 24, 205–223. [Google Scholar] [CrossRef]
- Stefancikova, L.; Lacombe, S.; Salado, D.; Porcel, E.; Pagáčová, E.; Tillement, O.; Lux, F.; Depeš, D.; Kozubek, M.; Falk, M. Effect of gadolinium-based nanoparticles on nuclear DNA damage and repair in glioblastoma tumor cells. J. Nanobiotechnol. 2016, 14, 63. [Google Scholar] [CrossRef]
- Jezkova, L.; Falk, M.; Falkova, I.; Davidkova, M.; Bačíková, A.; Stefancikova, L.; Vachelová, J.; Michaelidesová, A.; Lukášová, E.; Boreyko, A.; et al. Function of chromatin structure and dynamics in DNA damage, repair and misrepair: γ-rays and protons in action. Appl. Radiat. Isot. 2014, 83, 128–136. [Google Scholar] [CrossRef]
- Sharma, N.K. Modulation of radiation-induced and mitomycin C-induced chromosome damage by apigenin in human lymphocytes in vitro. J. Radiat. Res. 2013, 54, 789–797. [Google Scholar] [CrossRef]


| LETd (keV/µm) | ||||
|---|---|---|---|---|
| Position 1 | Position 2 | |||
| PBS | DS | PBS | DS | |
| Protons | 0.45 | 0.45 | 3.17 | 3.43 |
| Electrons | 0.28 | 0.28 | 0.19 | 0.19 |
| Positrons | 0.19 | 0.19 | 0.18 | 0.18 |
| Deuterons | 5.74 | 5.57 | 8.68 | 7.40 |
| Tritons | 7.54 | 8.27 | 8.08 | 11.16 |
| Helions | 32.00 | 32.80 | 59.73 | 42.79 |
| Alphas | 51.79 | 51.76 | 102.58 | 103.00 |
| All particles | 0.44 | 0.44 | 3.11 | 3.34 |
| E (MeV) | No. PBS (-) | No. DS (-) | No. PBS (%) | No. DS (%) |
|---|---|---|---|---|
| ≤1 | 4.36 × 10⁸ | 6.20 × 10⁸ | 1.00 × 10² | 1.00 × 10² |
| 1–50 | 2.61 × 101 | 3.74 × 101 | 5.99 × 10⁻⁶ | 6.03 × 10⁻⁶ |
| ≥50 | 6.81 × 100 | 7.70 × 100 | 1.56 × 10⁻⁶ | 1.24 × 10⁻⁶ |
| All energies | 4.36 × 10⁸ | 6.20 × 10⁸ | 1.00 × 10² | 1.00 × 10² |
| E (MeV) | No. PBS (-) | No. DS (-) | No. PBS (%) | No. DS (%) |
|---|---|---|---|---|
| ≤1 | 2.94 × 10⁸ | 2.63 × 10⁸ | 1.00 × 10² | 1.00 × 10² |
| 1–50 | 1.33 × 10² | 1.21 × 10² | 4.52 × 10⁻⁵ | 4.61 × 10⁻⁵ |
| ≥50 | 2.67 × 101 | 2.44 × 101 | 9.09 × 10⁻⁶ | 9.27 × 10⁻⁶ |
| All energies | 2.94 × 10⁸ | 2.63 × 10⁸ | 1.00 × 10² | 1.00 × 10² |
| Data Set | α (Gy−1) | σα (Gy−1) | β (Gy−2) | σβ (Gy−2) | R2 |
|---|---|---|---|---|---|
| 60Co | 0.17 | 3.25 × 10⁻² | 0.03 | 9.99 × 10⁻³ | 0.99 |
| PBS1 | 0.26 | 1.13 × 10⁻³ | 0.05 | 2.77 × 10⁻² | 1.00 |
| PBS2 | 0.20 | 3.95 × 10⁻⁴ | 0.11 | 1.27 × 10⁻² | 1.00 |
| DS1 | 0.13 | 2.87 × 10⁻² | 0.06 | 9.49 × 10⁻³ | 1.00 |
| DS2 | 0.12 | 1.21 × 10⁻² | 0.10 | 4.99 × 10⁻³ | 1.00 |
© 2020 by the authors. Licensee MDPI, Basel, Switzerland. This article is an open access article distributed under the terms and conditions of the Creative Commons Attribution (CC BY) license (http://creativecommons.org/licenses/by/4.0/).
Share and Cite
Michaelidesová, A.; Vachelová, J.; Klementová, J.; Urban, T.; Pachnerová Brabcová, K.; Kaczor, S.; Falk, M.; Falková, I.; Depeš, D.; Vondráček, V.; et al. In Vitro Comparison of Passive and Active Clinical Proton Beams. Int. J. Mol. Sci. 2020, 21, 5650. https://doi.org/10.3390/ijms21165650
Michaelidesová A, Vachelová J, Klementová J, Urban T, Pachnerová Brabcová K, Kaczor S, Falk M, Falková I, Depeš D, Vondráček V, et al. In Vitro Comparison of Passive and Active Clinical Proton Beams. International Journal of Molecular Sciences. 2020; 21(16):5650. https://doi.org/10.3390/ijms21165650
Chicago/Turabian StyleMichaelidesová, Anna, Jana Vachelová, Jana Klementová, Tomáš Urban, Kateřina Pachnerová Brabcová, Stanislav Kaczor, Martin Falk, Iva Falková, Daniel Depeš, Vladimír Vondráček, and et al. 2020. "In Vitro Comparison of Passive and Active Clinical Proton Beams" International Journal of Molecular Sciences 21, no. 16: 5650. https://doi.org/10.3390/ijms21165650
APA StyleMichaelidesová, A., Vachelová, J., Klementová, J., Urban, T., Pachnerová Brabcová, K., Kaczor, S., Falk, M., Falková, I., Depeš, D., Vondráček, V., & Davídková, M. (2020). In Vitro Comparison of Passive and Active Clinical Proton Beams. International Journal of Molecular Sciences, 21(16), 5650. https://doi.org/10.3390/ijms21165650