Article

Upregulation of the MYB2 Transcription Factor is Associated with Increased Accumulation of Anthocyanin in the Leaves of Dendrobium bigibbum

1
Advanced Radiation Technology Institute, Korea Atomic Energy Research Institute (KAERI), Jeongeup 56212, Korea
2
National Institute of Agricultural Sciences, Rural Development Administration, Jeonju 54874, Korea
*
Author to whom correspondence should be addressed.
Int. J. Mol. Sci. 2020, 21(16), 5653; https://doi.org/10.3390/ijms21165653
Submission received: 27 July 2020 / Accepted: 31 July 2020 / Published: 6 August 2020
(This article belongs to the Special Issue Orchid Biochemistry 2.0)

Abstract

:
Orchids with colorful leaves and flowers have significant ornamental value. Here, we used γ-irradiation-based mutagenesis to produce a Dendrobium bigibbum mutant that developed purple instead of the normal green leaves. RNA sequencing of the mutant plant identified 2513 differentially expressed genes, including 1870 up- and 706 downregulated genes. The purple leaf color of mutant leaves was associated with increased expression of genes that encoded key biosynthetic enzymes in the anthocyanin biosynthetic pathway. In addition, the mutant leaves also showed increased expression of several families of transcription factors including the MYB2 gene. Transient overexpression of D. biggibum MYB2 in Nicotiana benthamiana was associated with increased expression of endogenous anthocyanin biosynthesis genes. Interestingly, transient overexpression of orthologous MYB2 genes from other orchids did not upregulate expression of endogenous anthocyanin biosynthesis genes. Together, these results suggest that the purple coloration of D. biggibum leaves is at least associated with increased expression of the MYB2 gene, and the MYB2 orthologs from orchids likely function differently, regardless of their high level of similarity.

1. Introduction

In Orchidaceae, Dendrobium species are one of the most popular orchids known for their medicinal and commercial value in potted and cut flower industries [1]. The Dendrobium genus contains approximately 1800 species and are mainly distributed throughout Asia and the South Pacific [2]. Dendrobium catenatum (also named Dendrobium officinale), Dendrobium nobile, and Dendrobium candidum are used in herbal medicines in many Asian countries [3]. Moreover, the Dendrobium genus is known for its valuable floral traits including colors, morphologies, and scent and Dendrobium species are regarded as some of the important commercial cut flowers. A variety of Dendrobium hybrids have been created that have improved flower colors. However, limitation of genetic resources in Dendrobium limits the extent to which flower color can be modified.
D. bigibbum is an epiphytic or lithophytic orchid that contains cylindrical pseudobulbs, each having between three and five green or purplish leaves and arching flowering stems with up to 20 usually lilac-purple flowers. The D. bigibbum plants containing purple spots on their leaves are very popular in the commercial market. Although colorful leaves and flowers add significant ornamental values to orchids, our understanding of the differential pigmentation in D. bigibbum remains limited. Natural agents extracted from various parts of Dendrobium contain bioactive substances, such as phenolic compounds, anthocyanins, and polysaccharides [4,5,6]. Many of these phenolic compounds and anthocyanins have well-known antioxidant activities [7] and contribute to leaf and flower coloration [8]. Anthocyanins are water-soluble, which are present in the vacuoles of plant epidermal cells and impart an orange, red, or blue color to flowers, fruits, stems, leaves, and roots [9]. Anthocyanin biosynthesis is a well-studied secondary metabolic pathway in plants that involves the conversion of phenylalanine into 4-coumaryl-CoA, followed by their conversions to flavonoid compounds. Studies in antirrhinum [10], petunia [11,12], maize [13,14], Brassica [15,16], and Arabidopsis [17,18] have identified genes that regulate anthocyanin production, and these can be broadly classified into two major groups. The first group consists of enzymes that participate in anthocyanin biosynthesis, including phenylalanine ammonia-lyase (PAL), chalcone synthetase (CHS), chalcone isomerase (CHI), flavanone 3-β-hydroxylase (F3H), dihydroflavonol 4-reductase (DFR), anthocyanin synthase (ANS), and UDP-glucose flavonoid 3-O-glucosyl transferase [19]. Loss-of-function mutations in CHS, CHI, F3H, DFR, or ANS abolish anthocyanin biosynthesis, and plants harboring these mutations often produce colorless tissues [20,21,22,23,24]. Anthocyanin accumulations in green and red leaves of Dendrobium officinale stems have been associated with ANS and UDP-glucose flavonoid 3-O-glucosyl transferase expression [25]. Moreover, Yu et al. suggested that among anthocyanins, delphinidin 3,5-O-diglucoside and cyanidin 3-O-glucoside may be responsible for the red peel color of D. officinale [25]. The second group contains MYBs, basic helix-loop-helixes (bHLHs), or WD40 repeat transcription factors (TFs) that regulate the expression levels of genes involved in anthocyanin biosynthesis [26,27]. Earlier studies on Arabidopsis and Medicago truncatula indicated that MYB2 acts as a transcriptional repressor of anthocyanin biosynthesis and that the overexpression of MYB2 abolishes anthocyanin biosynthesis [28,29]. However, the overexpression of orchid MYB2 in petunia results in increased petal pigmentation [11]. Likewise, the transient overexpression of Phalaenopsis equestris MYB2 positively regulates anthocyanin pigmentation and is associated with the increased expression of downstream genes PeF3H5, PeDFR1, and PeANS3 [30]. Conversely, silencing of PeMYB2 results in reduced anthocyanin accumulation [31]. Thus, depending on the plant system, MYB2 appears to serve as either a negative or positive regulator of anthocyanin biosynthesis.
In this study, we characterized an orchid mutant that was isolated on the basis of its unusual leaf color. The D. bigibbum mutant accumulated higher levels of anthocyanin, which in turn was associated with the increased expression of genes regulating anthocyanin biosynthesis. This also included the MYB2 gene, which, when transiently expressed in a heterologous system, led to induction of genes associated with anthocyanin biosynthesis.

2. Results

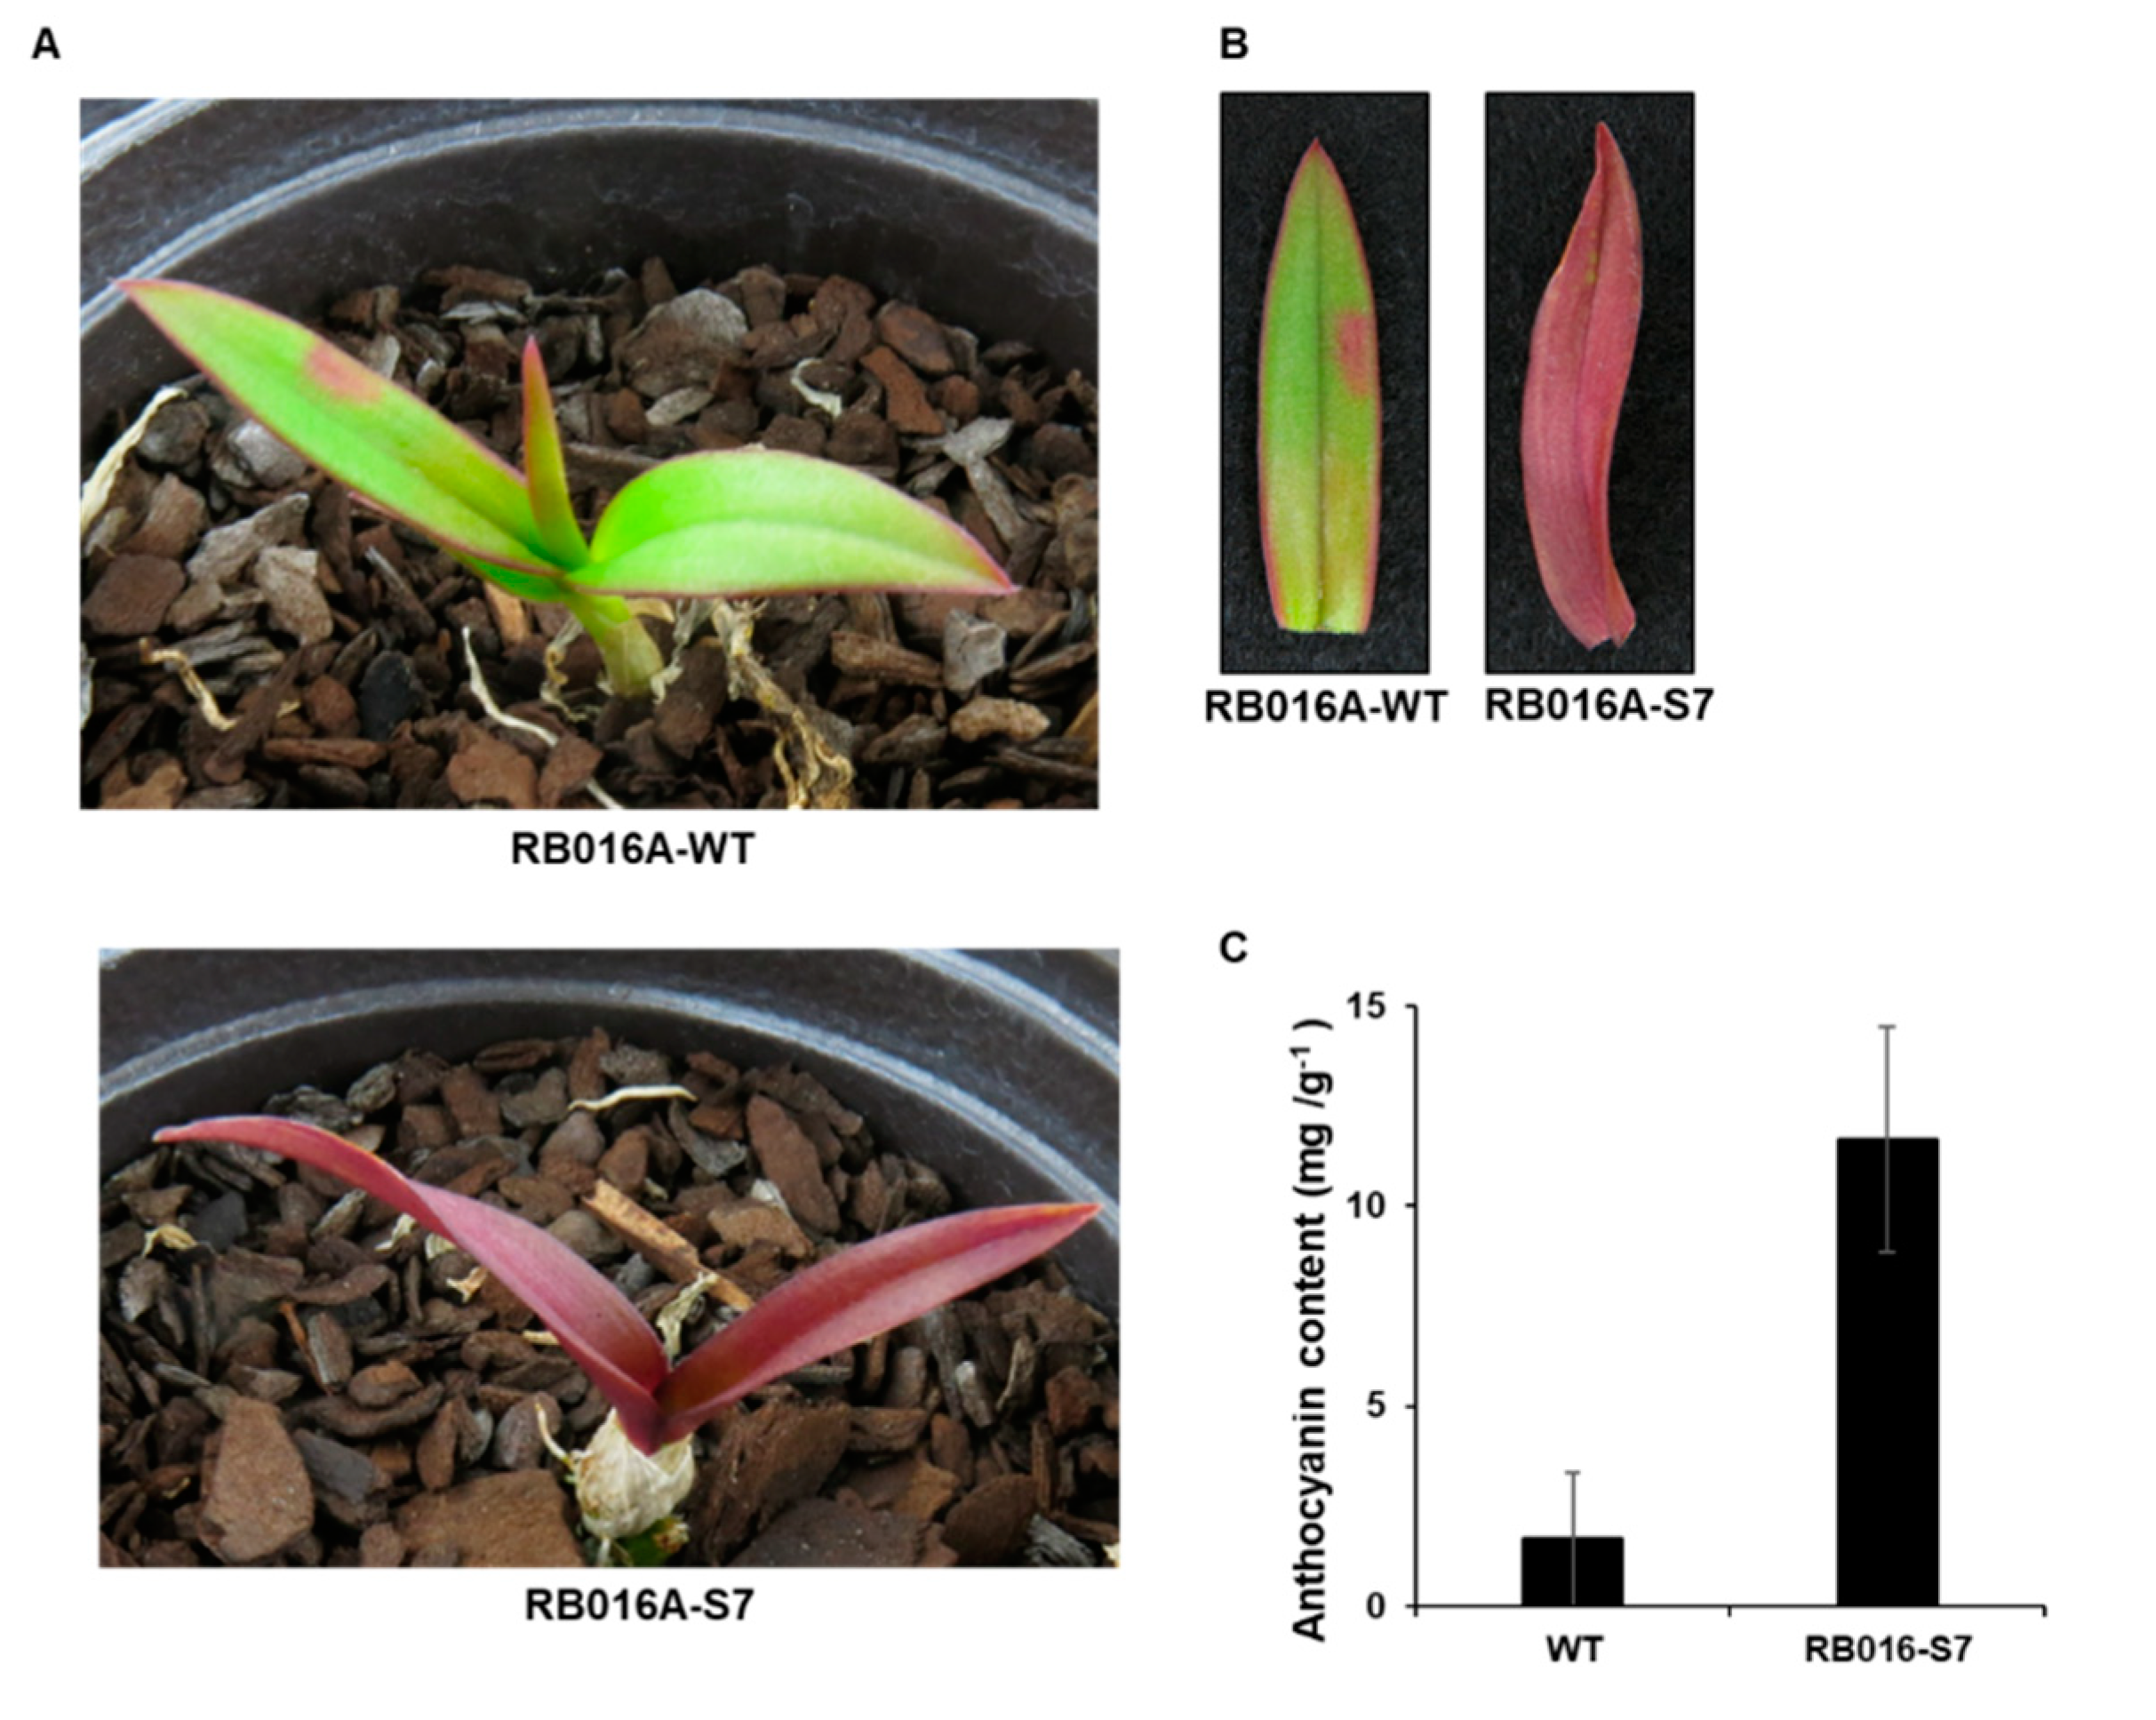
2.1. The Purple Mutant of D. Bigibbum Accumulates Higher Levels of Anthocyanin

We used γ-irradiated D. bigibbum rhizomes to produce a mutant that developed purple leaves in comparison to the green leaves seen on wild type (WT) plants (Figure 1A,B) (Figure S1). This mutant, designated as RB016-S7, was propagated through four generations of tissue culturing. To determine whether the purple coloration of the mutant’s leaves was associated with anthocyanin pigmentation, we used a pH-differential-based method to quantify the anthocyanin content. The anthocyanin content in the purple leaves (11.68 mg/g dry weight) was ~7.0-fold higher than in the green leaves (1.66 mg/g dry weight) (Figure 1C). Thus, the purple coloration of RB016-S7 leaves was likely associated with the increased biosynthesis of anthocyanins.
To understand the biochemical basis of the increased anthocyanin production in the RB16-S7 mutant, we analyzed genome-wide changes in gene expression. Total RNAs from WT and RB016-S7 leaves were used to construct six cDNA libraries that were sequenced using the Illumina HiSeq 2500 platform. After filtering and quality trimming the raw reads, we obtained 47–66 million high quality reads. Using Trinity, the clean reads from the six libraries were assembled into 110,104 transcripts, with an average length of 1116 bp, and these were then assembled into 32,575 unigenes, with an average length of 1048 bp (Table 1). The sequence length distribution of unigenes showed that 8373 unigenes (25.7%) ranged from 100 to 500 bp, 11,350 unigenes (34.8%) ranged from 501 to 1000 bp, and 6488 unigenes (19.91%) had lengths of more than 1500 bp (Figure 2). The 30,714 unigenes were matched with the non-redundant (nr) database, and among these, 26,851 unigenes matched sequences from Dendrobium catenatum, followed by Phalaenopsis equestris (2263) and Apostasia shenzhenica (209) (Figure 3A). Furthermore, this was consistent with the phylogenetic analysis carried out among native Dendrobium spp, Cymbidium spp, P. equestris and A. shenzhenica orchids, which, as expected, showed relatedness among Dendrobium spp (Figure 3B).

2.2. Functional Annotation and Classification

In the Gene Ontology (GO) analysis, 17,498 unigenes (53.71%) were assigned to three GO terms and were categorized into 41 functional groups (FDR < 0.05) (Table S1). The GO assignments were divided into three categories: biological process (BP), cellular component (CC), and molecular function (MF). Among these, 10,569 unigenes (32.4%), 9195 unigenes (28.2%), and 12,401 unigenes (38%), were assigned to BP, CC, and MF, respectively. In the BP category, the predicted proteins were mainly distributed in metabolic process (30.61%) and cellular process (28.36%), followed by biological regulation (7.34%), localization (6.87%), and regulation of biological process (6.09%). Predicted proteins assigned to the CC category were mainly associated with cellular anatomical entity (55.61%), intracellular (30.19%), and protein-containing complex (12.84%). Furthermore, in the MF category, the most heavily represented groups were linked to catalytic activity (47.13%), binding (40.78%), and transporter activity (5.04%) (Figure S2).
To predict and classify the gene functions, we queried all the unigenes against the evolutionary genealogy of genes: Non-supervised Orthologous Groups (eggNOG) (v4.5) database. This database contains the functional descriptions and classifications of the orthologous proteins, including Clusters of Orthologous Groups and euKaryotic Orthologous Groups. This analysis allowed us to allocate 27,963 unigenes to 25 eggNOG classifications. Among them, the eggNOG category of functional unknown (S, 27.88%) represented the largest group, followed by signal transduction mechanisms (T, 8.58%), posttranslational modification, protein turnover, chaperones (O, 8.13%), transcription (K, 8.09%), and carbohydrate transport and metabolism (G, 5.70%) (Figure S3).
Next, we mapped the assembled unigenes to the reference anthocyanin pathways, including metabolism, genetic information processing, environmental information processing, and cellular processes, in the KEGG (http://www.kegg.jp/kegg/pathway.html). The 6314 unigenes were assigned to 394 KEGG sub-pathways (Table S2). These pathways included KEGG orthology (KO) entries for metabolism (3503 KOs), genetic information processing (950 KOs), environmental information processing (488 KOs), cellular processes (702 KOs), and organismal systems (671 KOs) (Figure S4).

2.3. Analysis of Differentially Expressed Genes (DEGs) Associated with Anthocyanin Biosynthesis

A total of 2513 DEGs (FDR < 0.05) were identified between the WT and RB016-S7 mutant. Compared with WT, 1870 and 706 genes were up- and downregulated in the RB016-S7 mutant, respectively (Figure 3C; Table S3). The top 20 significant pathways for the up- and downregulated genes were selected for further analysis. The upregulated genes were mainly enriched in ribosome biogenesis, MAPK signaling pathway, plant–pathogen interaction, plant hormone signal transduction, phenylpropanoid biosynthesis, starch and sucrose metabolism, and flavonoid biosynthesis (Table 2). The 20 significant pathways for the downregulated genes are listed in Table 3. The downregulated genes were mainly enriched in folate biosynthesis, starch and sucrose metabolism, plant hormone signal transduction, and phenylpropanoid biosynthesis.

2.4. Analysis of Anthocyanin Biosynthetic Genes in Identified DEGs

The mutant showed an increased accumulation of anthocyanin; therefore, we used a KEGG functional enrichment to search for genes associated with anthocyanin biosynthesis among the 2513 DEGs. A total of 17 DEGs, encoding eight key enzymes, were identified, and they were three PAL genes (PAL1: denphalae05809, PAL2: denphalae05806, and PAL4: denphalae05808), two cinnamic acid 4-hydroxylase genes (C4H: denphalae10925 and denphalae10926), four 4-coumarate CoA-ligase genes (4CL: denphalae18583, denphalae22607, denphalae27156, and denphalae27157), four CHS genes (denphalae02657, denphalae02658, denphalae05188, and denphalae11910), and one gene each of F3H (denphalae02991), flavonoid 3′-monooxygenase (F3′H: denphalae11915), DFR (denphalae11241), and ANS (denphalae18276). All these DEGs were significantly upregulated in the RB016-S7 mutant compared with WT (Table 4). Among other notable genes that were upregulated in RB016-S7 were TFs that belonged to WRKY (33 genes), MYB (20 genes), bHLH (23 genes), and WD40 (1 gene) groups. Among these, DbMYB2, -4, -30, and -44, as well as DbbHLH1, -62, -96, -114, and -148, were highly expressed in the RB016-S7 mutant (Table S4). The expression patterns of the anthocyanin biosynthetic genes were consistent with the increased anthocyanin levels in the RB16-S7 mutant (Figure 4A,B).

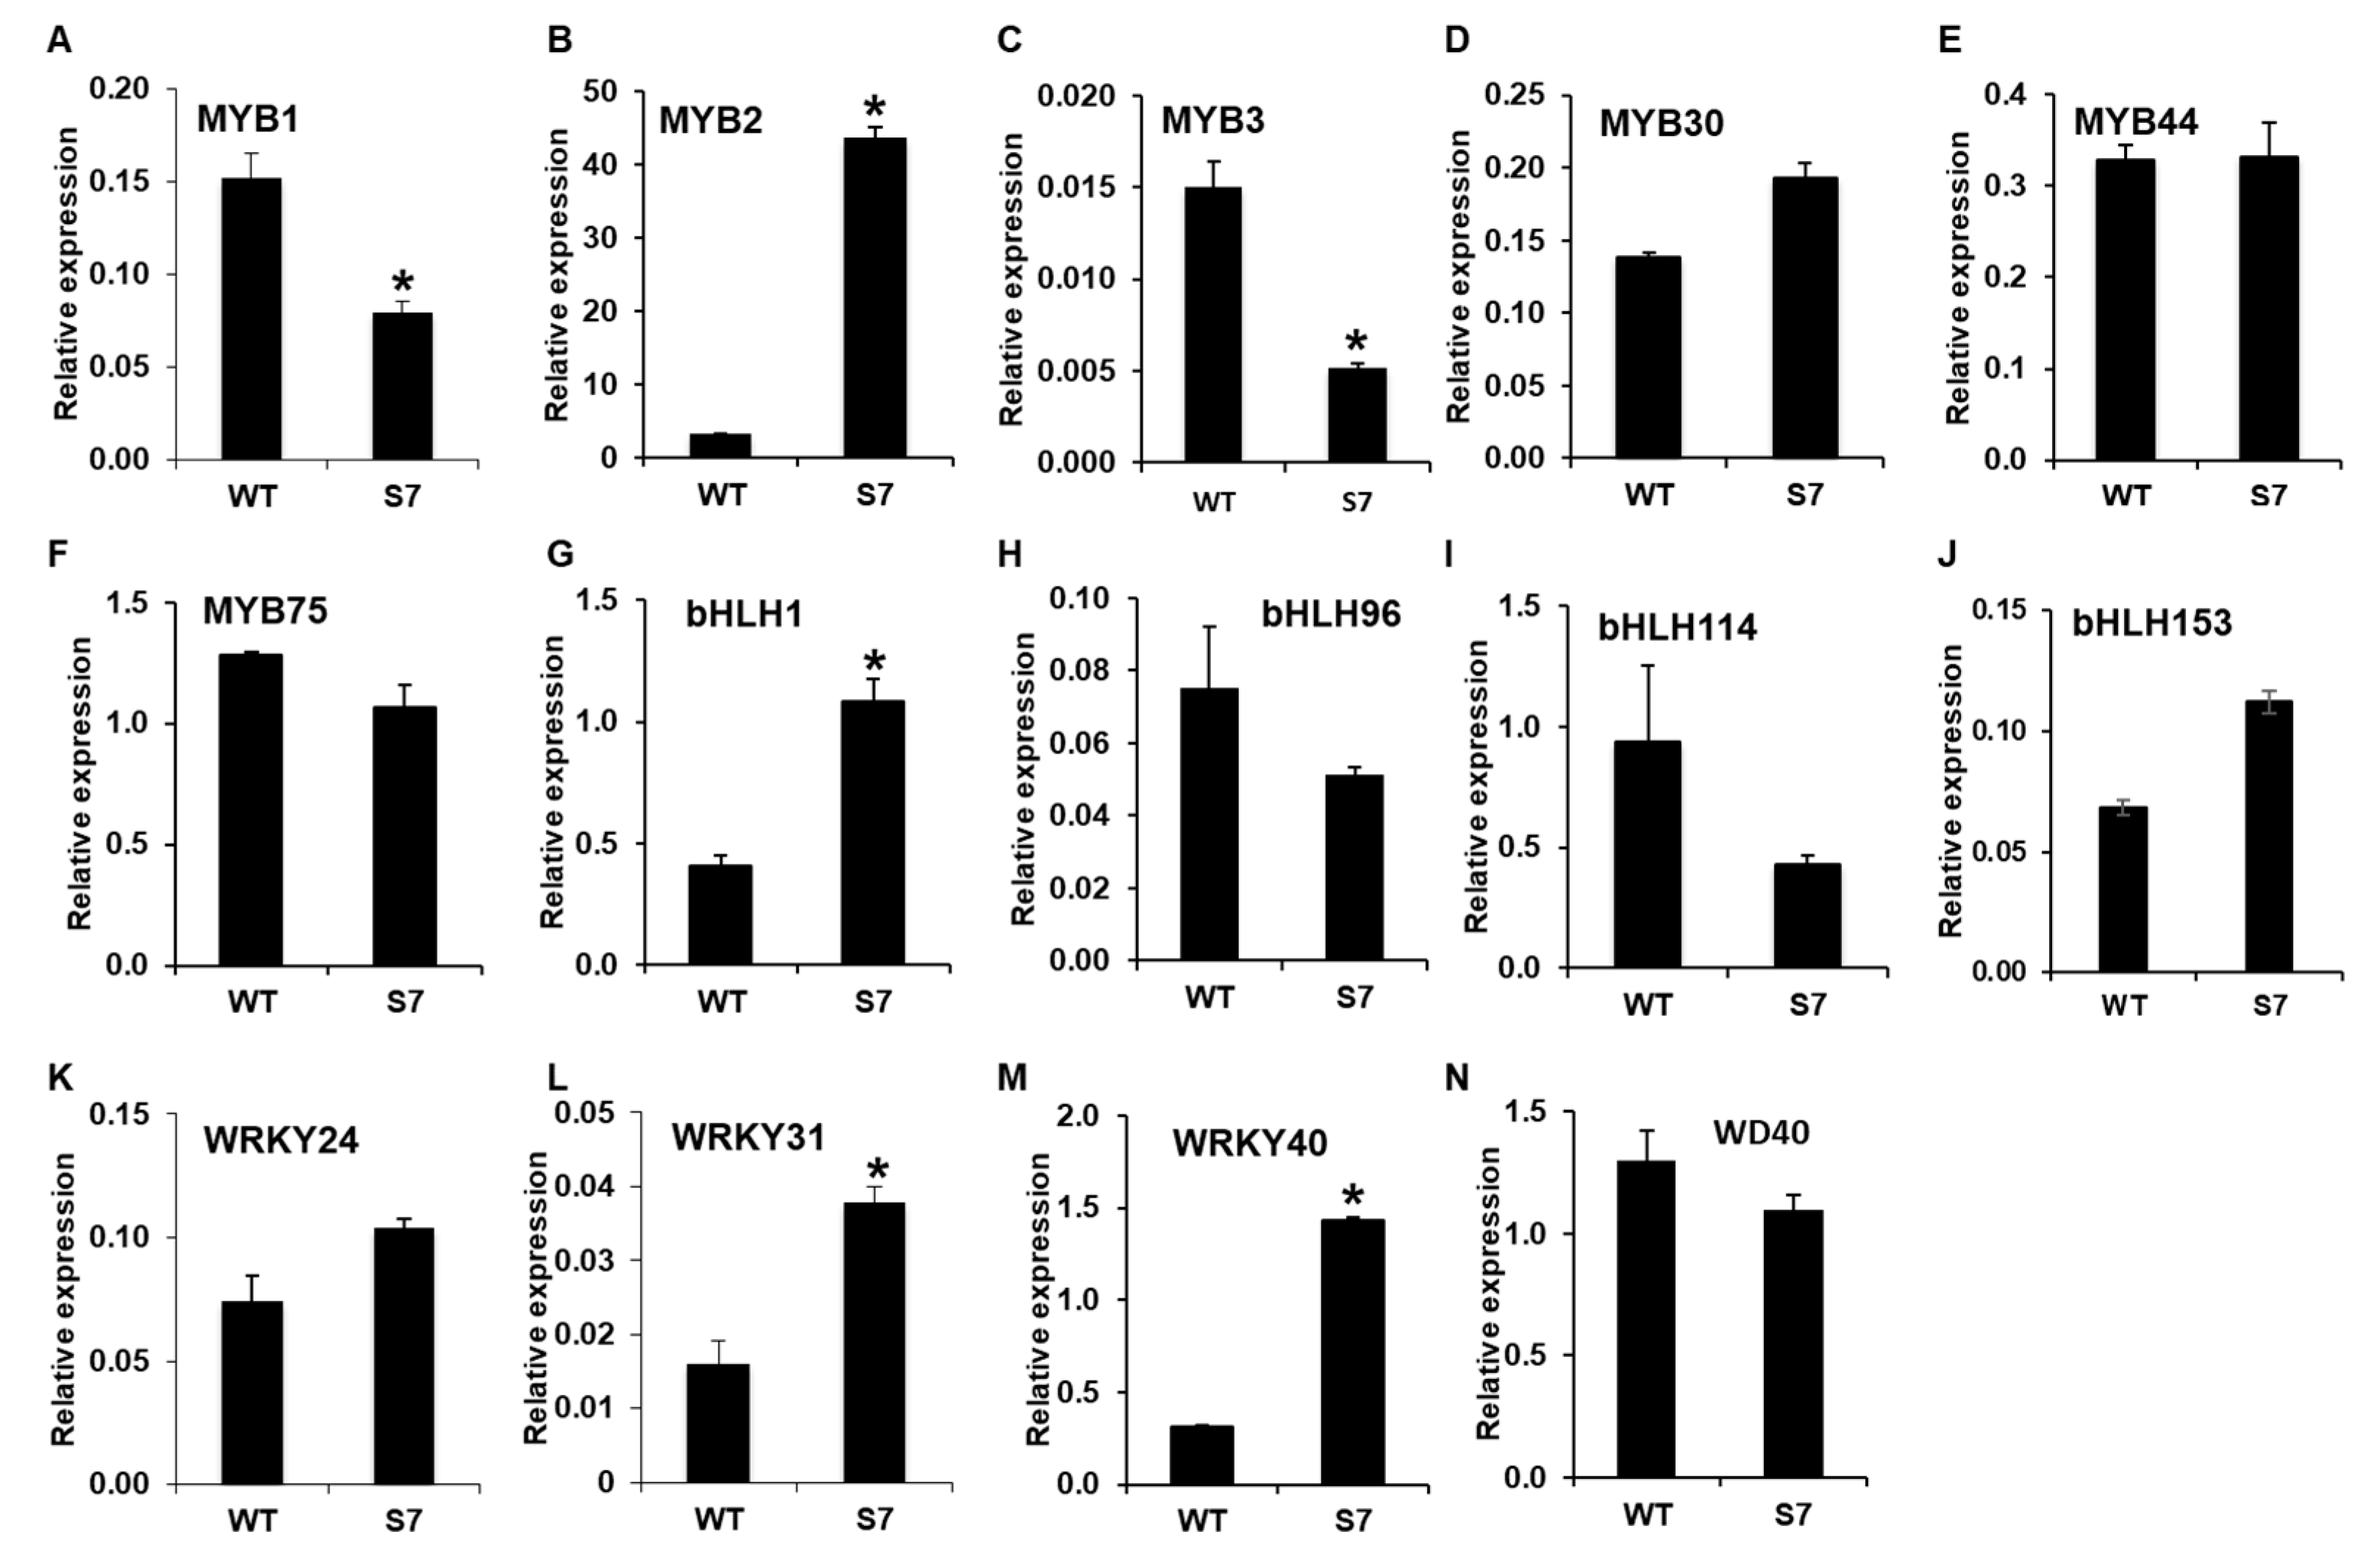
2.5. Quantitative Real-Time PCR (qRT-PCR) Analysis of the Genes Involved in Anthocyanin Biosynthesis

To confirm the RNA-Seq data, we first selected 10 candidate genes associated with anthocyanin biosynthesis and analyzed their expression levels using qRT-PCR. The qRT-PCR analysis confirmed ~1.5-, 2.3-, and 2.4-fold higher levels for PAL1, PAL2, and PAL4, respectively, in the RB016-S7 mutant compared with the WT. In addition, the qRT-PCR analysis showed that C4H, 4CL, and CHS were induced ~2-, 3.3-, and 10-fold in the RB016-S7 mutant compared with the WT. Similarly, F3’H, F3H, DFR, and ANS were induced ~1.2-, 7.2-, 5.0-, and 3-fold in the RB016-S7 mutant compared with the WT (Figure 5). The qRT-PCR data were consistent with results obtained from the RNA-Seq data. Thus, the purple pigmentation in RB016-S7 may be associated with the increased expression levels of genes involved in anthocyanin biosynthesis.
Next, we analyzed the expression levels of regulatory genes associated with anthocyanin biosynthesis. The RNA-Seq dataset showed that DbMYB2, -30, and -44 were highly upregulated in the RB016-S7 mutant compared with the WT, while the expression of DbMYB75 was not significantly different from in WT plants. Notably, the qRT-PCR analysis was only able to confirm a ~13-fold induction in DbMYB2, while the expression of DbMYB30, -44, and -75 remained at WT levels.
Comparisons of expression levels of genes encoding bHLH TFs showed that only DbbHLH1 was expressed at higher levels in RB016-S7 than WT plants. In comparison, DbbHLH96, -114, and -153 showed WT-like expression levels. DbWD40, which showed a 67.97% identity to the Arabidopsis ortholog AtTTG1, had a WT-like expression level [32]. A recent report also suggests roles for WRKY TFs in anthocyanin biosynthesis. RNA-Seq data showed that several WRKY TFs were highly expressed in the RB016-S17 mutant compared with WT. However, the qRT-PCR analysis was only able to confirm ~1.5–3-fold inductions of DbWRKY24, WRKY31, and WRKY40 genes (Figure 6). Thus, only a select group of TFs were upregulated in the mutant plant, and these, in turn, could play roles in the regulation of genes involved in anthocyanin biosynthesis.

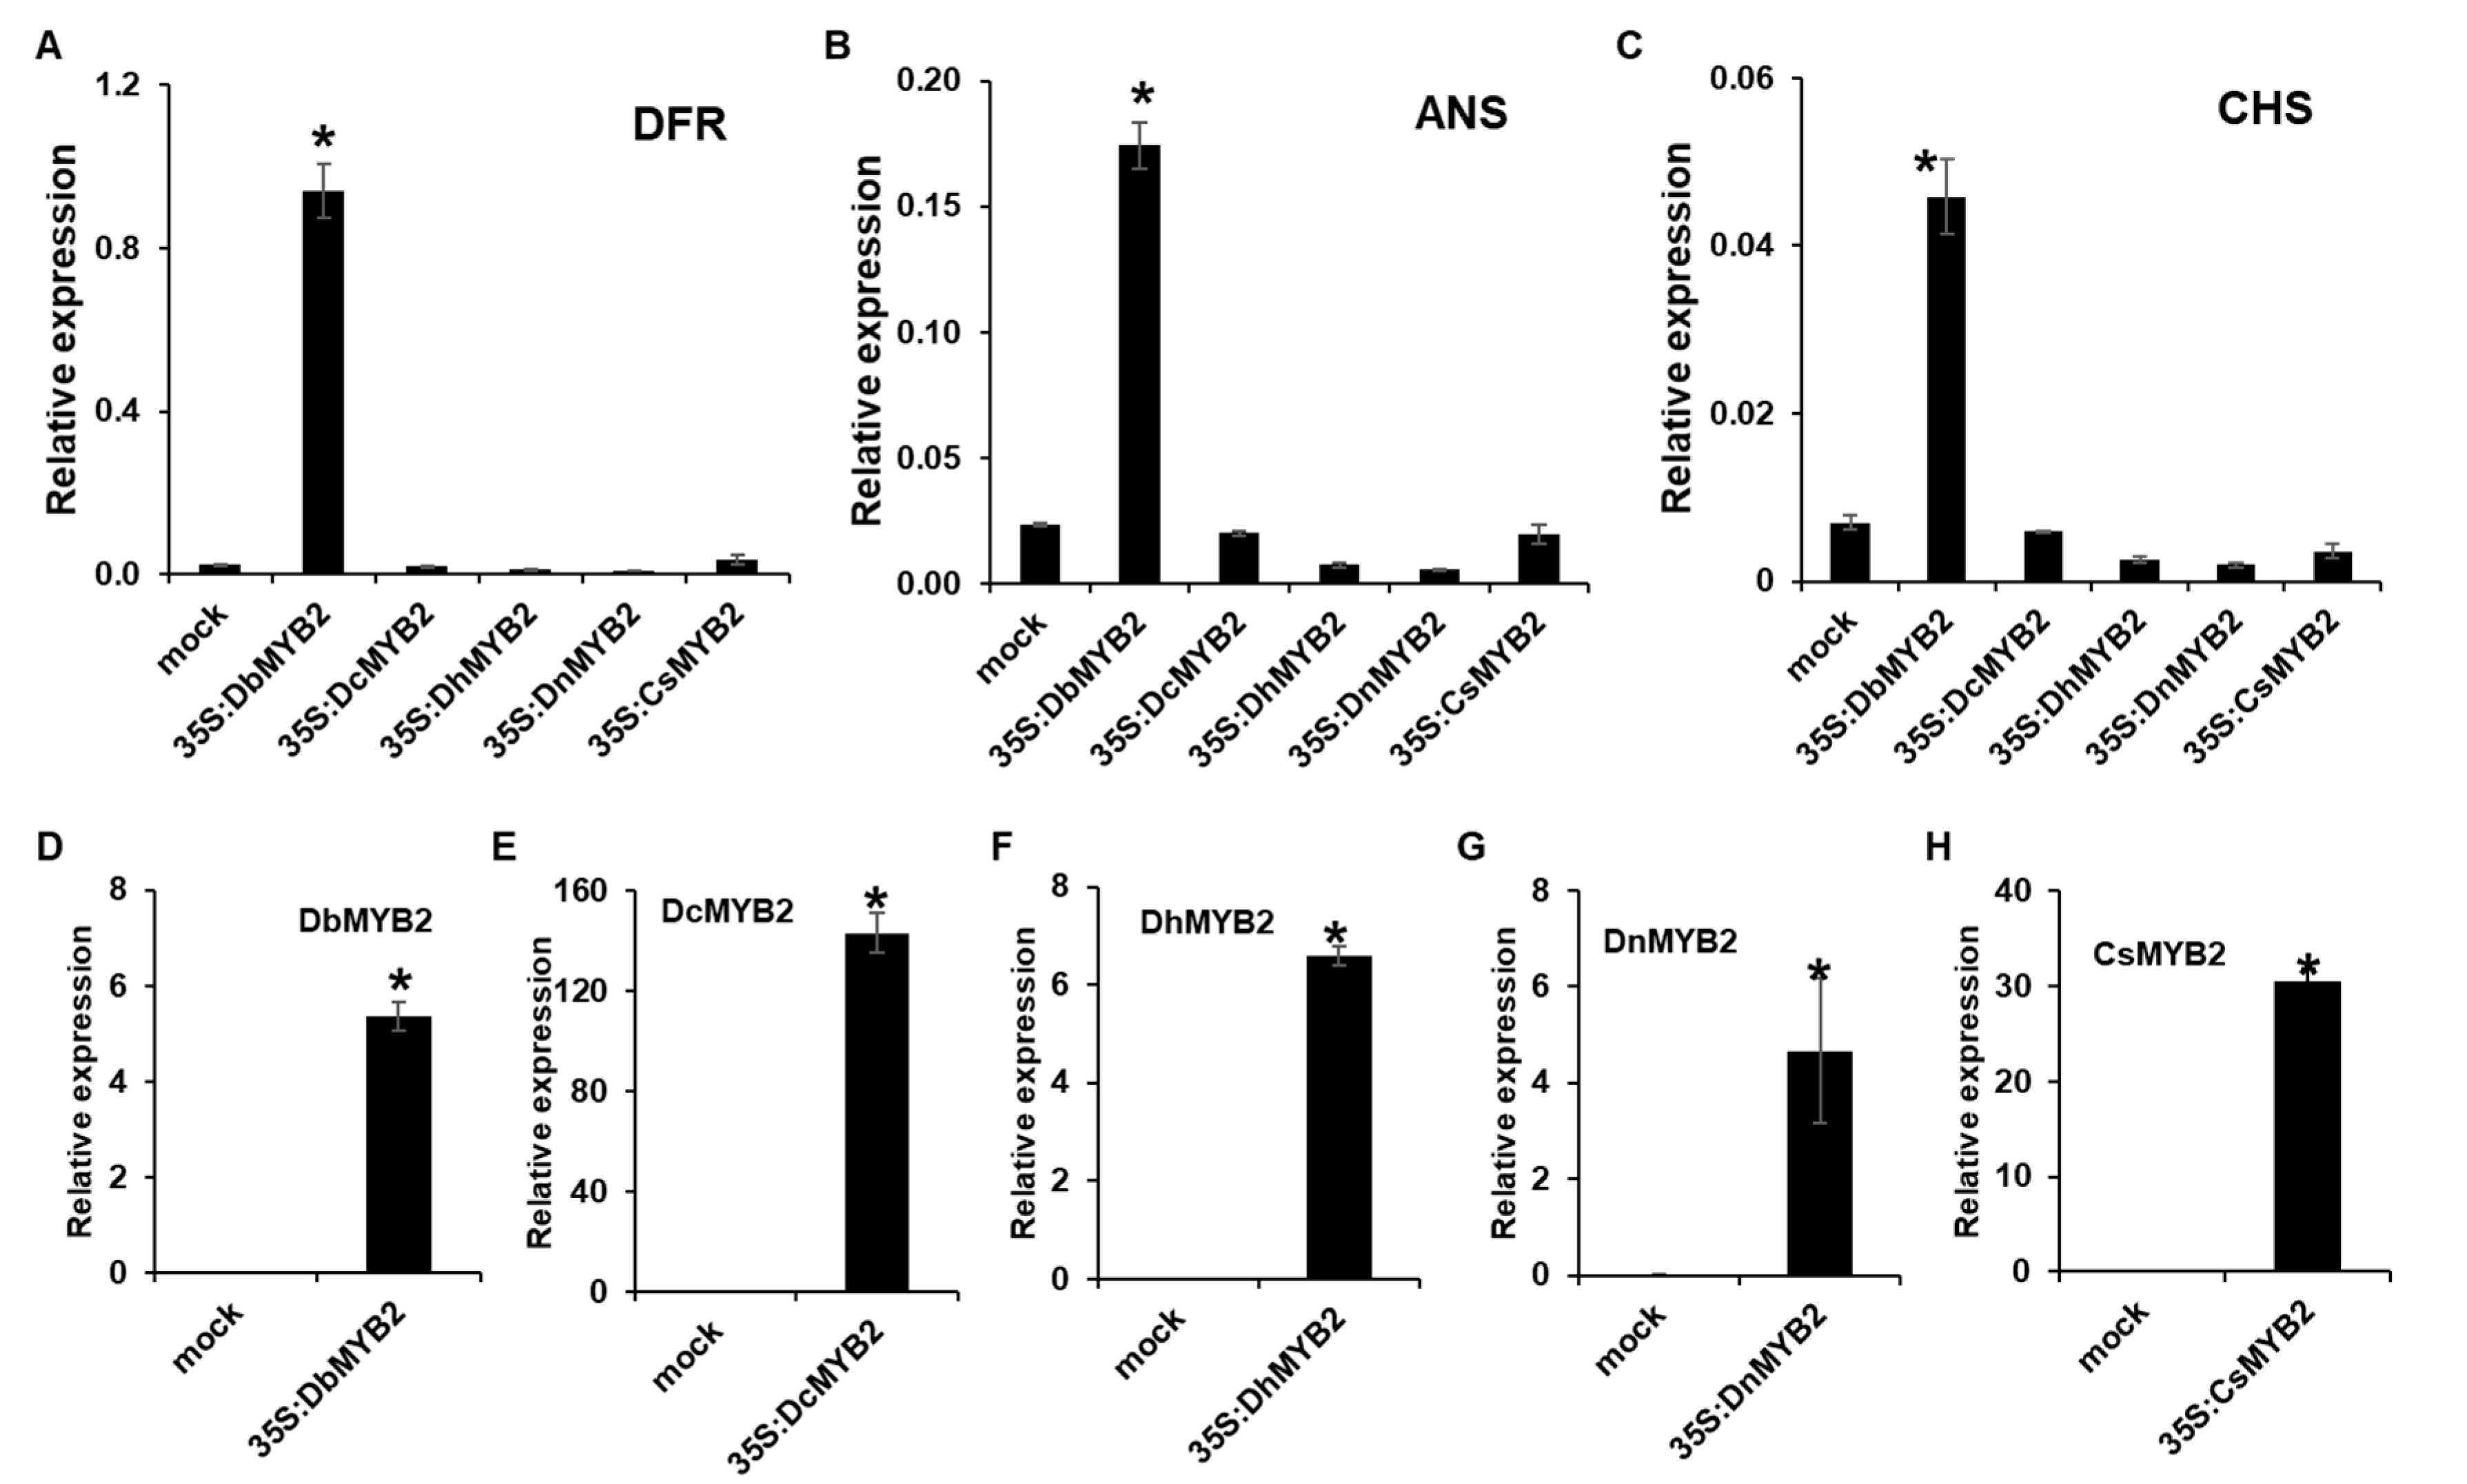
2.6. DbMYB2 Positively Regulates Anthocyanin Biosynthesis

Increased expression of DbMYB2 in the RB016-S17 mutant suggested that MYB2 could positively regulate expression of anthocyanin genes and thereby anthocyanin levels. This is further supported by an earlier study that showed that Dendrobium hybrid MYB2 positively regulated anthocyanin pigmentation in Dendrobium petals. Amino acid alignment of DbMYB2 with DhMYB2 BS No.3 [33] showed ~92% identity. Likewise, amino acid alignment of MYB2 orthologs from D. hybrid, D. candidum, D. nobile, and Cymbidium sinense showed ~80%, ~80%, ~62%, and 63% identity, respectively, with DbMYB2 (Figure 7A). The amino acid alignment showed that the R2R3 repeat region was highly conserved among various MYB proteins (Figure 7A). Phylogenetic analysis between these MYB proteins placed DbMYB2, DhMYB2, and DcMYB2 in the same clade (Figure 7B).
To determine whether increased expression of DbMYB2 positively regulated expression of anthocyanin genes, we expressed MYB2 genes from D. bigibbum, D. candidum, D. nobile, D. hybrid, and C. sinense in Nicotiana benthamiana and evaluated expression of N. benthaminana genes ANS, DFR, and CHS, which are associated with anthocyanin biosynthesis. All the MYB2 genes showed varying levels of increased expression at 36 h post-agroinfiltration (Figure 8D–H). Interestingly, however, only transient expression of DbMYB2 was associated with increased expression of ANS, DFR, and CHS in N. benthamiana (Figure 8A–C). These results strongly suggest that DbMYB2 positively regulates expression of genes associated with anthocyanin biosynthesis, and that higher anthocyanin levels in the RB016-S17 mutant are likely due to higher expression levels of DbMYB2. Inability of other MYB2 orthologs to increase expression of ANS, DFR, and CHS suggests that, regardless of their homology, the MYB2 orthologs function differently.

3. Discussion

Anthocyanins are pigments that confer color to various plant parts [34]. The color is determined by the composition and concentration of pigments, which vary greatly among plant species [35]. Cyanidin-3-glucoside is a major anthocyanin found in most plants [36]. Other common anthocyanin pigments present in plants include delphinidin, pelargonidin, peonidin, malvidin, and petunidin. Earlier studies on Dendrobium orchids primarily focused on anthocyanin profiles in flowers and stems, which contain pelargonidin, cyanidin, peonidin, delphinidin, and/or malvidin [24]. In contrast, we were only able to detect malvidin in the leaves of D. bigibbum (data not shown), and its levels were associated with increased purple pigmentation in the RB016-S7 mutant’s leaves. Thus, anthocyanin pigments present in leaves versus flowers and stems might be associated with the specific genes expressed in these tissues. We determined that the increased anthocyanin accumulation in RB016-S7 was associated with increased expression levels of PAL, CHS, F3′H, and DFR genes that are involved in anthocyanin biosynthesis. Although the anthocyanin biosynthetic genes are well-conserved, the timing, level, and spatial distribution of anthocyanin biosynthesis are primarily determined by TFs.
A recent study offered useful insights into the functions of WRKY TFs in anthocyanin biosynthesis [37], which in turn regulates the MYB/bHLH/WD40complex [27,38,39,40]. Our analysis also identified 33 WRKY-, 20 MYB-, 23 bHLH- and 1WD40-encoding genes that were differentially expressed in the RB016-S7 mutant leaves. It is possible that these TFs regulate the expression of one or more genes involved in the anthocyanin pathway (Table S5). An example of complex regulation underlying anthocyanin biosynthesis includes the feed-forward loop mechanism in which TFs regulate each other and jointly regulate target genes [28]. In Dendrobium hybrid petals, DhMYB2 and DhbHLH1 TFs play regulatory roles in the anthocyanin biosynthetic pathway [33]. Consistent with this finding, we determined that the expression levels of DbMYB2 and DbHLH1 were significantly higher in the RB016-S7 mutant. Notably, the A. thaliana and M. truncatula MYB2 proteins act as transcriptional repressors of anthocyanin biosynthesis, and the overexpression of either MYB2 abolishes anthocyanin biosynthesis [28,29]. Likewise, heterologous overexpression of Malus domestica MYB3 (MdMYB3) in Nicotiana tabacum is associated with increased anthocyanin biosynthesis [41]. Thus, orthologs of MYB and possibly other genes involved in anthocyanin biosynthesis may play opposite roles in different plants. This was further evident in our analysis, which showed that increased expression of MYB2 in RB016-S7 plants positively correlated with anthocyanin biosynthesis. This was further consistent with our result that heterologous overexpression of D. bigibbum MYB2 in N. benthamiana led to increased expression of ANS, DFR, and CHS genes. Interestingly, transient overexpression of MYB2 orthologs from other Dendrobium spp. or C. sinense did not alter expression of ANS, DFR, and CHS genes. These results strongly suggest that DbMYB2 positively regulates expression of genes associated with anthocyanin biosynthesis, even though DbMYB2 showed high levels of homology with other MYB2 orthologs. Thus, subtle changes in MYB2 sequence are likely sufficient to alter their function. It is possible that MYB2 in other orchids could regulate anthocyanin biosynthesis genes by serving as a part of the bigger complex that contains other factors like bHLHs or WD40. Deciphering the exact biochemical functions of various TFs involved in anthocyanin biosynthesis in D. bigibbum will require more detailed analyses of these proteins.

4. Materials and Methods

4.1. Plant Materials

Protocorm-like bodies (PLBs) of Dendrobium bigibbum var. compactum were cultured on pH5.3 Hyponex medium (6.5:6.0:19:0 N:P:K; Hyponex Japan Corp., Ltd, Osaka, Japan) supplemented with sucrose (3% w/v) and agar (0.4% w/v) (Duchefa Biochemie B.V., Haarlem, The Netherlands). PLBs were cultured in 220 ml glass jars containing 30ml medium, which were closed with semipermeable plastic caps. All the cultures were maintained at 22–25 °C and >60% humidity. Plants were grown under white fluorescent light (PPFD = 50 μmol/m2/s) with a 16-h illumination and 8-h dark photoperiod.

4.2. γ-Irradiation of in Vitro Shoot Cultures

Six-month-old in vitro regenerated shoots of approximately 3 cm in length were exposed to γ-radiation using 60Co γ-irradiator (60 Gy/24 h) at the Korea Atomic Energy Research Institute, Jeongeup, Korea [42]. The first vegetative generation in which treatment was performed was referred to as M1V1. The study continued until the fourth generation (M1V4) to confirm the stability of the induced traits. The purple-colored leaf mutant RB016-S7 was obtained and its physiological traits were analyzed.

4.3. RNA Extraction and Quantitative Real-Time PCR (qRT-PCR) Analysis

Total RNA was extracted from the WT and the RB016-S7 plants using an RNeasy plant mini kit (Qiagen, Hilden, Germany), following the manufacturer’s instructions. The RNA concentration and quality of each sample were determined using a Nanodrop 2000 spectrophotometer (Thermo Fisher Scientific, Waltham, MA, USA) and agarose electrophoresis, respectively. The cDNA was transcribed from 500 ng of total RNA using a ReverTra Ace-α-kit (Toyobo Co. Ltd, Osaka, Japan). The qRT-PCR was performed with a CFX96 touch real-time PCR detection system (Bio-Rad, Hercules, CA, USA) using iQ™ SYBR® Green supermix (Bio-Rad, Hercules, CA, USA). The D. bigibbum actin gene was used as an internal control, and the 2−ΔΔCt method was used to analyze differential expression levels. Cycle threshold values were calculated using CFX Manager 3.1 software (Bio-Rad, Hercules, CA, USA). Gene-specific primers are listed in Table S5.

4.4. Measurement of Total Anthocyanin Content

After harvesting the leaves, the samples were freeze-dried and subjected to solvent extraction using a solution of 85% ethanol acidified with 15% 1.5 N HCl. The samples were incubated at 4 °C for 24 h. Samples were diluted in two buffer solutions: potassium chloride buffer 0.025 M (pH 1.0) and sodium acetate buffer 0.4 M (pH 4.5). Absorbance was measured via spectrophotometer at 510 and 700 nm after 15 min of incubation at room temperature, respectively. Absorbance was calculated as
Anthocyanin   pigment   ( cyanidin 3 glucoside   equivalents , mg / L ) = A × MW × DF × 10 3 ε × 1
A = (A510 nm − A700 nm) pH1.0 − (A510 nm − A700 nm) pH4.5; MW (molecular weight) = 449.2 g/mol for cyanidin-3-glucoside (cyd-3-glu); DF = dilution factor; l = pathlength in cm; ε = 26,900 molar extinction coefficient, in L·mol−1·cm−1, for cyd-3-glu; and 103 = factor for conversion from g to mg [43].

4.5. RNA-Seq Analysis, De Novo Assembly, and Unigene Generation

The cDNA libraries were prepared independently from both WT and RB016-S7 leaves. Low quality and duplicated reads, as well as adapter sequences, were removed from RNA-seq raw data using Trimmomatic with default parameters [44]. The de novo assembly was performed using Trinity (ver. 2.8.4) with default parameters [45]. Afterwards, redundant sequences were removed from the assembled transcript sequences using cd-hit-est (ver. 4.7) with a similarity threshold of 90% (i.e., removing similar sequences sharing more than a 90% identity), generating nr transcript sequences. Protein coding sequences (CDSs) were predicted and extracted from the nr transcript sequences using TransDecoder (ver. 5.5) with a parameter of selection of the longest CDS by comparison with Pfam database. The collection of extracted CDSs was designated as the unigene set and used for further analyses. The completeness of the unigene set was validated by analysis with Benchmarking Universal Single-Copy Orthologs (ver. 3.1.0) [46].

4.6. Functional Annotation of Unigenes

Sequences homologous to unigenes were identified using BLASTP analyses (cutoff e-value 1e-5) against the NCBI nr protein database. The GO terms, and eggnog (ver. 3.0) and KEGG pathways, were assigned to the unigenes based on BLASTP results using the Blast2GO program (ver. 5.2.5). Conserved domains in the unigene sequences were identified using InterProScan program (ver. 5.34-73.0) with default parameters. In addition, a KEGG pathway analysis was also performed with the KEGG Automatic Annotation KAAS Server using the single-directional best hit method and searching against representative gene sets from both eukaryotes and monocots.

4.7. Expression Profiling of Unigenes

Trimmed high-quality RNA-seq reads were mapped on the unigene sequences using BWA (ver. 0.7.17-r1188) [47] and then, RNA reads mapped on unigene sequences were counted using SAMtools (ver. 1.9) [48]. Fragments per kilobase of transcript per million mapped reads values were calculated using the number of RNA-seq reads mapped on unigene sequences and used for the expression profiling of unigenes.

4.8. Identification of DEGs between the WT and RB016-S7 Mutant

The bioconductor package DESeq (ver. 1.22.1) was used to identify DEGs between samples [49]. Genes showing over two-fold expression changes with p-values of less than 0.05 were considered DEGs. The GO enrichment analysis was performed for the DEGs using Fisher’s exact test with an adjusted p-value of 0.05 in the Blast2GO program (ver. 5.2.5).

4.9. Analysis of Unigenes Involved in Anthocyanin Biosynthesis

For anthocyanin biosynthesis, unigenes assigned to the anthocyanin biosynthetic reference pathway from the KEGG pathway analysis were first selected. In addition, BLASTP searches (cutoff e-value: 1e-10) were performed using 40 Arabidopsis genes involved in anthocyanin biosynthesis [50] as queries, and then, unigenes with high similarity levels (≥ 60% identity and ≥ 80% alignment length) to the query sequences were selected as candidate unigenes that could be involved in anthocyanin biosynthesis. Expression values (fragments per kilobase of transcript per million mapped reads) for the genes were retrieved from expression profiles of the unigenes set and used for generating heatmaps using the R -package pheatmap (ver. 1.0.12).

4.10. Cloning of Orchid MYB Genes

The full-length MYB2 cDNA (denphalae23719) was PCR-amplified from D. bigibbum leaves and cloned into the Gateway binary vector pMDC32 vector, under the 35S CaMV promoter. The primers used for amplification of MYB2 sequences are listed in Table S5. All the amplified products were sequenced.

4.11. Agroinfiltration of N. Benthamiana

The pMDC32-MYB2 plasmids were transformed into A. tumefaciens strains LBA4404 via the freeze–thaw method [51]. Agrobacteria were grown in the LB medium supplemented with 100 mg/L kanamycin and incubated at 28 °C with shaking. Bacteria were pelleted by centrifugation (14,000g for 5 min) and resuspended to an OD600 = 0.8 in a buffer containing 10 mM MES pH 5.6, 10 mM MgCl2, and 200 μM acetosyringone. Cultures were then incubated for 2–4 h at room temperature. Bacteria were infiltrated into the underside of N. benthamiana leaves using a needleless 1 ml syringe. The agroinfiltrated plants were kept in the growth chamber maintained at 23 °C with a 16-h photoperiod.

Supplementary Materials

Supplementary materials can be found at https://www.mdpi.com/1422-0067/21/16/5653/s1. Figure S1. Images of D. bigibbum. Morphological phenotypes of typical wild type (WT) and the RB016-S7 mutant. Figure S2. Distribution of annotated sequences based on a Gene Ontology (GO) analysis. The GO functional classification assigned 17,498 unigenes to 41 subcategories under the three main GO categories of biological process, cellular component, and molecular function. The x-axis indicates the subcategories and the y-axis indicates the number of unigenes in each category. Figure S3. Numeric distribution of eggNOG annotations of unigenes. Letters on the x-axis refer to the categories on the right. The y-axis indicates the number of unigenes in the corresponding eggNOG category. Figure S4. Distribution of annotated sequences as assessed using a Kyoto Encyclopedia of Genes and Genomes (KEGG) pathway analysis. The x-axis indicates enriched KEGG pathways, and the y-axis represents the number of unigenes within each KEGG pathway. (A) Metabolism; (B) genetic information processing; (C) environmental information processing; (D) cellular processes; (E) organismal systems. Table S1. Significantly enriched GO terms. Table S2: Significantly enriched KEGG pathways. Table S3: Clusters of annotated GO terms in the biological process category enriched in up- and downregulated genes between WT and the RB016-S7 leaves. Table S4: Expression profiles of the regulatory genes for leaf color in D. bigibbum. Table S5: Gene-specific primers used for quantitative real-time PCR and Agrobacterium transient assay. Table S6: MYB2 gene sequence from Dendrobium orchids and Cymbidium sinense for Agrobacterium transient assay.

Author Contributions

Conceptualization, G.-H.L. Formal analysis, G.-H.L.; Funding acquisition, S.-Y.K. and J.-B.K.; Investigation, S.W.K.; Methodology, J.R.; Project administration, S.-Y.K., J.-B.K. and S.H.K.; Resources, S.H.K.; Writing–original draft, G.-H.L. All authors have read and agreed to the published version of the manuscript.

Funding

This work was supported by a grant from the Nuclear R&D program of the Ministry of Science and ICT and the research program of KAERI, Republic of Korea.

Conflicts of Interest

The authors declare no conflict of interest.

Abbreviations

ANSanthocyanidin synthase
4CL4-coumarate CoA ligase
C4Hcinnamic acid 4-hydroxylase
CHIchalcone isomerase
CHSchalcone synthase
DFRdihydroflavonol 4-reductase
F3Hflavanone 3-hydroxylase
F3′H flavonoid 3′-monooxygenase
GOgene ontology
KEGG Kyoto Encyclopedia of Genes and Genomes
PALphenylalanine ammonia-lyase
WTwild -type

References

  1. Wang, H.Z.; Feng, S.G.; Lu, J.J.; Shi, N.N.; Liu, J.J. Phylogenetic study and molecular identification of 31 Dendrobium species using inter-simple sequence repeat (ISSR) markers. Sci. Hortic. 2009, 122, 440–447. [Google Scholar] [CrossRef]
  2. Feng, S.G.; Lu, J.J.; Gao, L.; Liu, J.J.; Wang, H.-Z. Molecular phylogeny analysis and species identification of Dendrobium (Orchidaceae) in China. Biochem. Genet. 2014, 52, 127–136. [Google Scholar] [CrossRef] [PubMed]
  3. Bulpitt, C.J.; Li, Y.; Bulpitt, P.F. The use of orchids in Chinese medicine. Genome Natl. Res. Counc. Can. 2007, 100, 558–563. [Google Scholar]
  4. Wang, H.; Zhang, T.; Sun, W.; Wang, Z.; Zuo, D.; Zhou, Z.; Li, S.; Xu, J.; Yin, F.; Hua, Y. Erianin induces G2/M-phase arrest, apoptosis, and autophagy via the ROS/JNK signaling pathway in human osteosarcoma cells in vitro and in vivo. Cell Death Dis. 2016, 7, e2247. [Google Scholar] [CrossRef] [Green Version]
  5. Khoo, H.E.; Azlan, A.; Tang, S.T.; Lim, S.M. Anthocyanidins and anthocyanins: Colored pigments as food, pharmaceutical ingredients, and the potential health benefits. Food Nutr. Res. 2017, 61, 1361779. [Google Scholar] [CrossRef] [Green Version]
  6. Muddathir, A.M.; Yamauchi, K.; Batubara, I.; Mohieldin, E.A.M.; Mitsunaga, T. Anti-tyrosinase, total phenolic content and antioxidant activity of selected Sudanese medicinal plants. S. Afr. J. Bot. 2017, 109, 9–15. [Google Scholar] [CrossRef]
  7. Szymanowska, U.; Baraniak, B. Antioxidant and Potentially Anti-Inflammatory Activity of Anthocyanin Fractions from Pomace Obtained from Enzymatically Treated Raspberries. Antioxidants 2019, 8, 299. [Google Scholar] [CrossRef] [Green Version]
  8. Jaakola, L. New insights into the regulation of anthocyanin biosynthesis in fruits. Trends Plant. Sci. 2013, 18, 477–483. [Google Scholar] [CrossRef] [Green Version]
  9. Sadilova, E.; Stintzing, F.C.; Carle, R. Anthocyanins, colour and antioxidant properties of eggplant (Solanum melongena L.) and violet pepper (Capsicum annuum L.) peel extracts. Zeitschrift für Naturforschung C 2006, 61, 527–535. [Google Scholar] [CrossRef]
  10. Goodrich, J.; Carpenter, R.; Coen, E.S. A common gene regulates pigmentation pattern in diverse plant species. Cell 1992, 68, 955–964. [Google Scholar] [CrossRef]
  11. Wang, L.M.; Zhang, J.; Dong, X.Y.; Fu, Z.Z.; Jiang, H.; Zhang, H.C. Identification and functional analysis of anthocyanin biosynthesis genes in Phalaenopsis hybrids. Biol. Plant. 2018, 62, 45–54. [Google Scholar] [CrossRef]
  12. Quattrocchio, F.; Wing, J.F.; Va, K.; Mol, J.N.M.; Koes, R. Analysis of bHLH and MYB domain proteins: Species-specific regulatory differences are caused by divergent evolution of target anthocyanin genes. Plant. J. 1998, 13, 475–488. [Google Scholar] [CrossRef] [PubMed]
  13. Cone, K.C.; Cocciolone, S.M.; Burr, F.A.; Burr, B. Maize anthocyanin regulatory gene pl is a duplicate of c1 that functions in the plant. Plant. Cell 1993, 5, 1795–1805. [Google Scholar] [PubMed]
  14. Hanson, M.A.; Gaut, B.S.; Stec, A.O.; Fuerstenberg, S.I.; Goodman, M.M.; Coe, E.H.; Doebley, J.F. Evolution of anthocyanin biosynthesis in maize kernels: The role of regulatory and enzymatic loci. Genetics 1996, 143, 1395–1407. [Google Scholar]
  15. Kim, C.; Park, S.; Kikuchi, S.; Kwon, S.; Park, S.; Yoon, U.; Park, D.; Seol, Y.; Hahn, J.; Park, S. Genetic analysis of gene expression for pigmentation in Chinese cabbage (Brassica rapa). Biochip J. 2010, 4, 123–128. [Google Scholar] [CrossRef]
  16. Guo, N.; Cheng, F.; Wu, J.; Liu, B.; Zheng, S.; Liang, J.; Wang, X. Anthocyanin biosynthetic genes in Brassica rapa. BMC Genom. 2014, 15, 426. [Google Scholar] [CrossRef] [Green Version]
  17. Borevitz, J.O.; Xia, Y.; Blount, J.; Dixon, R.A.; Lamb, C. Activation tagging identifies a conserved MYB regulator of phenylpropanoid biosynthesis. Plant. Cell 2000, 12, 2383–2393. [Google Scholar] [CrossRef] [Green Version]
  18. Payne, C.T.; Zhang, F.; Lloyd, A.M. GL3 encodes a bHLH protein that regulates trichome development in Arabidopsis through interaction with GL1 and TTG1. Genetics 2000, 156, 1349–1362. [Google Scholar]
  19. Holton, T.A.; Cornish, E.C. Genetics and biochemistry of anthocyanin biosynthesis. Plant. Cell 1995, 7, 1071. [Google Scholar] [CrossRef]
  20. Britsch, L.; Ruhnau-Brich, B.; Forkmann, G. Molecular cloning, sequence analysis, and in vitro expression of flavanone 3 beta-hydroxylase from Petunia hybrida. J. Biol. Chem. 1992, 267, 5380–5387. [Google Scholar]
  21. Franken, P.; Niesbach-Klösgen, U.; Weydemann, U.; Maréchal-Drouard, L.; Saedler, H.; Wienand, U. The duplicated chalcone synthase genes C2 and Whp (white pollen) of Zea mays are independently regulated; evidence for translational control of Whp expression by the anthocyanin intensifying gene in. EMBO J. 1991, 10, 2605–2612. [Google Scholar] [CrossRef]
  22. Inagaki, Y.; Hisatomi, Y.; Iida, S. Somatic mutations caused by excision of the transposable element, Tpn1, from the DFR gene for pigmentation in sub-epidermal layer of periclinally chimeric flowers of Japanese morning glory and their germinal transmission to their progeny. Theor. Appl. Genet. 1996, 92, 499–504. [Google Scholar] [CrossRef] [PubMed]
  23. Nakatsuka, T.; Nishihara, M.; Mishiba, K.; Yamamura, S. Temporal expression of flavonoid biosynthesis-related genes regulates flower pigmentation in gentian plants. Plant. Sci. 2005, 168, 1309–1318. [Google Scholar] [CrossRef]
  24. Napoli, C.A.; Fahy, D.; Wang, H.-Y.; Taylor, L.P. White anther: A petunia mutant that abolishes pollen flavonol accumulation, induces male sterility, and is complemented by a chalcone synthase transgene. Plant Physiol. 1999, 120, 615–622. [Google Scholar] [CrossRef] [Green Version]
  25. Yu, Z.; Liao, Y.; Teixeira da Silva, J.A.; Yang, Z.; Duan, J. Differential accumulation of anthocyanins in dendrobium officinale stems with red and green peels. Int J. Mol. Sci. 2018, 19, 2857. [Google Scholar] [CrossRef] [PubMed] [Green Version]
  26. Allan, A.C.; Hellens, R.P.; Laing, W.A. MYB transcription factors that colour our fruit. Trends Plant Sci. 2008, 13, 99–102. [Google Scholar] [CrossRef] [PubMed]
  27. Schaart, J.G.; Dubos, C.; Romero De La Fuente, I.; van Houwelingen, A.M.M.L.; de Vos, R.C.H.; Jonker, H.H.; Xu, W.; Routaboul, J.M.; Lepiniec, L.; Bovy, A.G. Identification and characterization of MYB-b HLH-WD 40 regulatory complexes controlling proanthocyanidin biosynthesis in strawberry (F ragaria× ananassa) fruits. New Phytol. 2013, 197, 454–467. [Google Scholar] [CrossRef]
  28. Matsui, K.; Umemura, Y.; Ohme-Takagi, M. A protein with a single MYB domain, acts as a negative regulator of anthocyanin biosynthesis in Arabidopsis. Plant. J. 2008, 55, 954–967. [Google Scholar] [CrossRef]
  29. Jun, J.H.; Liu, C.; Xiao, X.; Dixon, R.A. The transcriptional repressor MYB2 regulates both spatial and temporal patterns of proanthocyandin and anthocyanin pigmentation in Medicago truncatula. Plant Cell 2015, 27, 2860–2879. [Google Scholar]
  30. Hsu, C.-C.; Chen, Y.-Y.; Tsai, W.-C.; Chen, W.-H.; Chen, H.-H. Three R2R3-MYB transcription factors regulate distinct floral pigmentation patterning in Phalaenopsis spp. Plant Physiol. 2015, 168, 175–191. [Google Scholar] [CrossRef] [Green Version]
  31. Lu, H.-C.; Hsieh, M.-H.; Chen, C.-E.; Chen, H.-H.; Wang, H.-I.; Yeh, H.-H. A high-throughput virus-induced gene-silencing vector for screening transcription factors in virus-induced plant defense response in orchid. Mol. Plant Microbe Interact. 2012, 25, 738–746. [Google Scholar] [CrossRef] [PubMed] [Green Version]
  32. Zhang, B.; Schrader, A. TRANSPARENT TESTA GLABRA 1-dependent regulation of flavonoid biosynthesis. Plants 2017, 6, 65. [Google Scholar] [CrossRef] [PubMed] [Green Version]
  33. Li, C.; Qiu, J.; Ding, L.; Huang, M.; Huang, S.; Yang, G.; Yin, J. Anthocyanin biosynthesis regulation of DhMYB2 and DhbHLH1 in Dendrobium hybrids petals. Plant Physiol. Biochem. 2017, 112, 335–345. [Google Scholar] [CrossRef] [PubMed]
  34. Chen, C. Overview of plant pigments. In Pigments in Fruits and Vegetables; Springer: New York, NY, USA, 2015; pp. 1–7. [Google Scholar]
  35. Veberic, R.; Slatnar, A.; Bizjak, J.; Stampar, F.; Mikulic-Petkovsek, M. Anthocyanin composition of different wild and cultivated berry species. LWT 2015, 60, 509–517. [Google Scholar] [CrossRef]
  36. Noda, N.; Yoshioka, S.; Kishimoto, S.; Nakayama, M.; Douzono, M.; Tanaka, Y.; Aida, R. Generation of blue chrysanthemums by anthocyanin B-ring hydroxylation and glucosylation and its coloration mechanism. Sci. Adv. 2017, 3, e1602785. [Google Scholar] [CrossRef] [Green Version]
  37. Lloyd, A.; Brockman, A.; Aguirre, L.; Campbell, A.; Bean, A.; Cantero, A.; Gonzalez, A. Advances in the MYB-bHLH-WD Repeat (MBW) Pigment Regulatory Model: Addition of a WRKY Factor and Co-option of an Anthocyanin MYB for Betalain Regulation. Plant Cell Physiol. 2017, 58, 1431–1441. [Google Scholar] [CrossRef] [Green Version]
  38. Albert, N.W.; Lewis, D.H.; Zhang, H.; Schwinn, K.E.; Jameson, P.E.; Davies, K.M. Members of an R2R3-MYB transcription factor family in Petunia are developmentally and environmentally regulated to control complex floral and vegetative pigmentation patterning. Plant J. 2011, 65, 771–784. [Google Scholar] [CrossRef]
  39. Gonzalez, A.; Brown, M.; Hatlestad, G.; Akhavan, N.; Smith, T.; Hembd, A.; Moore, J.; Montes, D.; Mosley, T.; Resendez, J. TTG2 controls the developmental regulation of seed coat tannins in Arabidopsis by regulating vacuolar transport steps in the proanthocyanidin pathway. Dev. Biol. 2016, 419, 54–63. [Google Scholar] [CrossRef]
  40. Ramsay, N.A.; Glover, B.J. MYB-bHLH-WD40 protein complex and the evolution of cellular diversity. Trends Plant Sci. 2005, 10, 63–70. [Google Scholar] [CrossRef]
  41. Vimolmangkang, S.; Han, Y.; Wei, G.; Korban, S.S. An apple myb transcription factor, MdMYB3, is involved in regulation of anthocyanin biosynthesis and flower development. BMC Plant Biol. 2013, 13, 176. [Google Scholar] [CrossRef] [Green Version]
  42. Jo, Y.D.; Kim, J.-B. Frequency and Spectrum of Radiation-Induced Mutations Revealed by Whole-Genome Sequencing Analyses of Plants. Quantum Beam Sci. 2019, 3, 7. [Google Scholar] [CrossRef] [Green Version]
  43. Lee, J.; Durst, R.W.; Wrolstad, R.E. Determination of total monomeric anthocyanin pigment content of fruit juices, beverages, natural colorants, and wines by the pH differential method: Collaborative study. J. AOAC Int. 2005, 88, 1269–1278. [Google Scholar] [CrossRef] [PubMed] [Green Version]
  44. Bolger, A.M.; Lohse, M.; Usadel, B. Trimmomatic: A flexible trimmer for Illumina sequence data. Bioinformatics 2014, 30, 2114–2120. [Google Scholar] [CrossRef] [Green Version]
  45. Grabherr, M.G.; Haas, B.J.; Yassour, M.; Levin, J.Z.; Thompson, D.A.; Amit, I.; Adiconis, X.; Fan, L.; Raychowdhury, R.; Zeng, Q. Full-length transcriptome assembly from RNA-Seq data without a reference genome. Nat. Biotechnol. 2011, 29, 644. [Google Scholar] [CrossRef] [PubMed] [Green Version]
  46. Simão, F.A.; Waterhouse, R.M.; Ioannidis, P.; Kriventseva, E.V.; Zdobnov, E.M. BUSCO: Assessing genome assembly and annotation completeness with single-copy orthologs. Bioinformatics 2015, 31, 3210–3212. [Google Scholar] [CrossRef] [Green Version]
  47. Li, H.; Durbin, R. Fast and accurate short read alignment with Burrows–Wheeler transform. Bioinformatics 2009, 25, 1754–1760. [Google Scholar] [CrossRef] [Green Version]
  48. Li, H.; Handsaker, B.; Wysoker, A.; Fennell, T.; Ruan, J.; Homer, N.; Marth, G.; Abecasis, G.; Durbin, R. The sequence alignment/map format and SAMtools. Bioinformatics 2009, 25, 2078–2079. [Google Scholar] [CrossRef] [Green Version]
  49. Anders, S.; Huber, W. Differential expression analysis for sequence count data. Genome. Bio. 2010, 11, R106–R110. [Google Scholar] [CrossRef] [Green Version]
  50. Ren, M.; Wang, Z.; Xue, M.; Wang, X.; Zhang, F.; Zhang, Y.; Zhang, W.; Wang, M. Constitutive expression of an A-5 subgroup member in the DREB transcription factor subfamily from Ammopiptanthus mongolicus enhanced abiotic stress tolerance and anthocyanin accumulation in transgenic Arabidopsis. PLoS ONE 2019, 14, e0224296. [Google Scholar]
  51. Hellens, R.; Mullineaux, P.; Klee, H. Technical focus: A guide to Agrobacterium binary Ti vectors. Trends Plant Sci. 2000, 5, 446–451. [Google Scholar] [CrossRef]
Figure 1. Images of Dendrobium bigibbum and the anthocyanin contents in the leaves. (A) Morphological phenotypes of typical wild type (WT) and RB016-S7 mutant D. bigibbum plants. (B) Relative anthocyanin contents in the WT and RB016-S7 mutant. Error bars represent standard deviations (n = 3). The experiment was repeated three times with similar results. (C) The number of up- and downregulated differentially expressed genes (DEGs) in the WT 3 versus RB016-S7 mutant comparison.
Ijms 21 05653 g001
Figure 2. Sequence length distribution of the unigenes in D. bigibbum transcriptomes. The x-axis indicates unigene length intervals from 200 bp to >3000 bp. The y-axis indicates the number of unigenes of each given length.
Ijms 21 05653 g002
Figure 3. Species distribution of the BLAST search results in the nr database. (A) A cut off E-value of 10−5 was used. Different species are indicated by different colors. (B) A reference phylogenetic tree derived from rDNA ITS 2 sequences of 14 species of Dendrobium, 3 species of Cymbidium, Apostasia shenzhenica, and Phalaenopsis equestris. (C) The number of up- and downregulated differentially expressed genes (DEGs) in the wild type versus RB016-S7 mutant comparison.
Ijms 21 05653 g003
Figure 4. Flavonoid–anthocyanin biosynthetic genes in D. bigibbum. (A) The differentially expressed genes (DEGs) between the WT and RB016-S7 mutant found in leaves are highlighted in blue. Phenylalanine ammonia-lyase, PAL; cinnamic acid 4-hydroxylase, C4H; 4-coumarate CoA-ligase, 4CL; chalcone synthase, CHS; chalcone isomerase, CHI; flavanone 3-hydroxylase, F3H; flavonoid 3′-monooxygenase, F3′H; dihydroflavonol 4-reductase, DFR; and anthocyanidin synthase, ANS. (B) Expression profiles determined using fragments per kilobase of transcript per million mapped reads (FPKM) values obtained from RNA-Seq data. Expression values (as FRKM) were not scaled per row to allow the visualization of original FPKM values among samples. The heatmap was generated using the R package pheatmap.
Ijms 21 05653 g004
Figure 5. qRT-PCR analysis of 10 genes showing altered expression levels in the RNA sequencing (RNA-Seq) analysis. The genes were associated with anthocyanin biosynthesis. More specifically, (AJ) indicate the relative expression levels of PAL1, PAL2, PAL3, C4H, 4CL, CHS, F3H, F3′H, DFR, and ANS, respectively. The elongation factor 1-alpha (EF1a) gene served as an internal control. Error bars indicate standard deviations (n = 3). The experiment was repeated three times with similar results. Asterisks denote a significant difference between respective WT and RB016-S7 mutant leaves samples (t-text, p < 0.0001).
Ijms 21 05653 g005
Figure 6. qRT-PCR analysis of 14 genes showing altered expression levels in the RNA-Seq analysis. The relative expression levels of transcription factor genes in the leaves. More specifically, (AN) indicate the relative expression levels of MYB1, MYB2, MYB3, MYB30, MYB44, MYB75, bHLH1, bHLH96, bHLH114, bHLH153, WRKY24, WRKY31, WRKY40, and WD40. The EF1a gene served as an internal control. Error bars indicate standard deviations (n = 3). The error bars indicate SD (n = 3). Results are representative of two independent experiments. Asterisks denote a significant difference between respective WT and RB016-S7 mutant leaves samples (t-test, p < 0.0001).
Ijms 21 05653 g006
Figure 7. Sequence alignments and phylogenetic tree of DbMYB2 from orchids with known R2R3-MYBs domain. (A) Alignments of the full-length deduced amino acid sequences of DbMYB2 with other R2R3-MYBs present in other orchids. (B) Phylogenetic relationship of DbMYB2 with known anthocyanin MYB regulators from other orchid species.
Ijms 21 05653 g007
Figure 8. Transient expression of DbMYB2s were associated with increased expression of ANS, DFR, and CHS in N. benthamiana. (AC) Real-time quantitative RT-PCR showing relative expression levels of NbDFR, NbANS, and NbCHS genes in N. benthamiana transiently overexpressing MYB2 genes from different orchids. (DH) Real-time quantitative RT-PCR showing relative expression levels of MYB2 genes in N. benthamiana plants transiently overexpressing MYB2 orthologs from different orchids. The error bars indicate SD (n = 4). Results are representative of three independent experiments. Asterisks denote a significant difference with mock and MYB2 overexpressed plants (t-test, p < 0.0001).
Ijms 21 05653 g008
Table 1. Summary of RNA sequencing and de novo transcriptome assembly results.
SequencesControl 1Control 2Control 3RB016-S7-1RB016-S7-2RB016-S7-3
BEFORE TRIMMING
Total nucleotides (bp)4,962,911,5685,845,449,7125,115,158,2644,956,765,9045,110,844,0484,343,315,032
Number of raw reads65,301,46876,913,81267,304,71465,220,60467,247,94857,148,882
AFTER TRIMMING
Total nucleotides (bp)4,288,037,9004,994,465,4714,370,988,5234,215,819,8624,288,137,5513,561,476,236
Number of clean reads56,856,16666,205,49057,973,95655,934,41056,856,13447,287,332
GC content (%)46.4244.2245.7347.0646.7946.55
Q30 percentage (%)95.6795.8695.5695.4395.6895.22
AFTER ASSEMBLY
Number of transcripts in the combined data110,104
Number of unigenes in the combined data32,575
Total nucleotides of transcripts (bp)122,947,955
Total nucleotides of unigenes (bp)34,155,642
Mean length of transcripts (bp)1,116
Mean length of unigenes (bp)1,048
N50 of unigenes (bp)1350
Q30, base call accuracy of 99.9%; N50, the sequence length of the shortest unigene at 50% of the total genome length.
Table 2. Top 20 enriched Kyoto Encyclopedia of Genes and Genomes (KEGG) pathways of upregulated differentially expressed genes (DEGs).
PathwayDEG NumberPathway ID
Ribosome58ko03010
MAPK signaling pathway-plant40ko04016
Plant-pathogen interaction40ko04626
Plant hormone signal transduction37ko04075
Phenylpropanoid biosynthesis28ko00940
Starch and sucrose metabolism25ko00500
Flavonoid biosynthesis23ko00941
Fluid shear stress and atherosclerosis23ko05418
Phenylalanine metabolism19ko00360
Cancer-related pathways18ko05200
Protein processing in the endoplasmic reticulum18ko04141
Cellular senescence16ko04218
Endocytosis16ko04144
Glycolysis/Gluconeogenesis16ko00010
β-Alanine metabolism15ko00410
Calcium signaling pathway14ko04020
Oxytocin signaling pathway14ko04921
Phagosome14ko04145
Amino sugar and nucleotide sugar metabolism13ko00520
Arginine and proline metabolism13ko00330
Table 3. Top 20 enriched KEGG pathways of downregulated DEGs.
PathwayDEG NumberPathway ID
Folate biosynthesis13ko00790
Starch and sucrose metabolism8ko00500
Plant hormone signal transduction7ko04075
Brassinosteroid biosynthesis6ko00905
Phenylpropanoid biosynthesis6ko00940
Circadian rhythm - plant5ko04712
Cyanoamino acid metabolism5ko00460
Glyoxylate and dicarboxylate metabolism5ko00630
Protein processing in the endoplasmic reticulum5ko04141
Renin-angiotensin system5ko04614
β-Alanine metabolism4ko00410
Glycine, serine and threonine metabolism4ko00260
Lysosome4ko04142
Phenylalanine metabolism4ko00360
Photosynthesis4ko00195
Photosynthesis - antenna proteins4ko00196
Platinum drug resistance4ko01524
Protein digestion and absorption4ko04974
Purine metabolism4ko00230
Tropane, piperidine, and pyridine alkaloid biosynthesis4ko00960
Table 4. Expression profiles of anthocyanin biosynthetic genes.
Gene NameUnigene IDGene LengthFPKMFold Changelog2Fold
Change
Wild TypeS7 Mutant
PAL1denphalae0580922233.9889.9821.444.42
PAL2denphalae05806209312.98196.3414.133.82
PAL3denphalae0580821398.5971.567.452.90
C4Hdenphalae1092515181.9218.638.973.16
denphalae10926 *15186.0936.675.502.46
4CLdenphalae18583 *173115.1679.174.782.26
denphalae2260716983.9713.602.891.53
denphalae2715614730.633.235.152.36
denphalae2715716952.916.02--
CHSdenphalae02657 *11732.529.643.401.77
denphalae02658117010.5036.493.151.65
denphalae0518810920.521.62--
denphalae119101188102.38659.265.622.49
F3Hdenphalae02991113798.69245.152.071.05
F3’Hdenphalae11915156331.60152.974.282.10
DFRdenphalae112411059102.75311.672.541.34
ANSdenphalae18276108370.86180.972.221.15
FPKM, fragments per kilobase of transcript per million mapped reads.

