Article

Expression and Role of Biosynthetic, Transporter, Receptor, and Responsive Genes for Auxin Signaling during Clubroot Disease Development

1
Department of Horticulture, Sunchon National University, Suncheon 57922, Korea
2
Department of Genetics and Plant Breeding, Bangladesh Agricultural University, Mymensingh 02202, Bangladesh
3
Department of Agronomy, Patuakhali Science and Technology University, Patuakhali 8602, Bangladesh
*
Author to whom correspondence should be addressed.
Int. J. Mol. Sci. 2020, 21(15), 5554; https://doi.org/10.3390/ijms21155554
Submission received: 24 June 2020 / Revised: 16 July 2020 / Accepted: 30 July 2020 / Published: 3 August 2020
(This article belongs to the Section Molecular Plant Sciences)

Abstract

:
Auxins play a pivotal role in clubroot development caused by the obligate biotroph Plasmodiophora brassicae. In this study, we investigated the pattern of expression of 23 genes related to auxin biosynthesis, reception, and transport in Chinese cabbage (Brassica rapa) after inoculation with P. brassicae. The predicted proteins identified, based on the 23 selected auxin-related genes, were from protein kinase, receptor kinase, auxin responsive, auxin efflux carrier, transcriptional regulator, and the auxin-repressed protein family. These proteins differed in amino acids residue, molecular weights, isoelectric points, chromosomal location, and subcellular localization. Leaf and root tissues showed dynamic and organ-specific variation in expression of auxin-related genes. The BrGH3.3 gene, involved in auxin signaling, exhibited 84.4-fold increase in expression in root tissues compared to leaf tissues as an average of all samples. This gene accounted for 4.8-, 2.6-, and 5.1-fold higher expression at 3, 14, and 28 days post inoculation (dpi) in the inoculated root tissues compared to mock-treated roots. BrNIT1, an auxin signaling gene, and BrPIN1, an auxin transporter, were remarkably induced during both cortex infection at 14 dpi and gall formation at 28 dpi. BrDCK1, an auxin receptor, was upregulated during cortex infection at 14 dpi. The BrLAX1 gene, associated with root hair development, was induced at 1 dpi in infected roots, indicating its importance in primary infection. More interestingly, a significantly higher expression of BrARP1, an auxin-repressed gene, at both the primary and secondary phases of infection indicated a dynamic response of the host plant towards its resistance against P. brassicae. The results of this study improve our current understanding of the role of auxin-related genes in clubroot disease development.

Graphical Abstract

1. Introduction

Clubroot, a serious disease of Brassicaceae family members throughout the world, is caused by an obligate biotroph Plasmodiophora brassicae Woronin. The “clubroot” is symptomatically known by enlarged roots, which eventually results in wilted plants in their upper parts due to nutrient and water losses at the later stages of the disease [1]. P. brassicae completes its life cycle in two phases: a primary phase which is mainly confined to root hairs of the host plants and a secondary phase that takes place in the cortex and the stele of the hypocotyl and roots of the infected plants, leading to cell hypertrophy (cell division) and hyperplasia (cell elongation) and resulting in “gall” or “club” formation (Figure 1) [2,3,4]. Cell division was reported to start from 4 days after inoculation (dai), which continues throughout the secondary cycle of infection, resulting in hypertrophied cells large in size that harbor secondary plasmodia and resting spores [5]. These resting spores are highly persistent, and they may remain infectious up to 15 years in soil [6]. After completion of the secondary phase, the galls in the infected plants can be ten times larger than the noninfected cells [7]. The infection process alters the metabolism and changes the hormone pools of the host [8]. In the progression of a clubroot disease, pathogens can efficiently alter the auxin responses [8].
Auxins are well-known phytohormones for their pivotal role in plant development and defense responses [1,12]. They influence cell division, enlargement, differentiation, and polarity. At the whole plant level, they are involved in regulating tropisms, apical dominance, and root initiation. Intriguingly, auxins have also been reported to regulate various processes related to growth of pathogens and symbionts [13]. Auxin signaling is an important aspect that plays a central role in many plant–pathogen interactions [14]. There are so many cross-talks on auxin signaling and conjugating auxin pathways in the development of clubroot disease [5,7,15,16,17,18]. After the infection of P. brassicae, the cell division process concomitantly involves activities of auxins, cytokinins, and brassinosteroids [19,20,21]. Cell-to-cell auxin transport is very crucial for early clubroot symptom development [3]. Cell division, cell elongation, and eventually the production of hypertrophied cells during clubroot development appears to be exclusively related to higher auxin availability and biosynthesis [3,5,21,22,23,24]. For example, in Chinese cabbage (Brassica rapa), an upregulation of the auxin inducible genes viz. nitrilases and myrosinases via the indole-3-acetonitrile (IAN) pathway indicated their vital role in maintaining higher auxin content in cells during clubroot formation and expansion between 28 and 42 days after inoculation (dai) [25]. The mutants of auxin biosynthesis gene “nitrilase” in Arabidopsis thaliana not only delayed gall formation but also reduced the gall size after inoculation of P. brassicae, indicating the pivotal role of auxin in clubroot formation [17,23]. In addition, morphological changes in the roots including cell elongation after the infection with P. brassicae at 6 dai coincided with the elevated amount of indole-3-acetic acid (IAA) and stimulation of auxin-inducible genes in roots [3].
In spite of the well-established significance of auxins in clubroot disease development, the fluctuation of contents of IAA, INA, and other auxins did not match the infection level in B. rapa roots [26]. Auxin biosynthesis-related genes exhibited a wide range of variability in transcript shifts between clubroot-infected and noninfected root tissues in A. thaliana in the literature. Microarray data on early phase of clubroot infection at 4, 7, and 10 dai demonstrated significant induction or suppression of relatively lower number of genes in A. thaliana [27]. Microarray analysis using Laser Microdissection and Pressure Catapulting (LMPC) of P. brassicae infected and noninfected roots of A. thaliana demonstrated differential regulation of 66 genes associated with auxin metabolism and signaling [21]. More recently, RNAseq data of two contrasting Chinese cabbage lines at 30 days post inoculation with P. brassicae revealed differentially expressed 188 and 138 genes, respectively related to plant–pathogen interaction and hormone signal transduction [28]. By contrast, transcriptome analysis during infection at the root cortex and the clubroot-infected and noninfected roots showed differential expression for more than 1000 genes at both 10 and 23 days after inoculation [20].
Several reports show that unbalanced auxin is conducive for the pathogens in favor of symptom development. To remain healthy and noninfected, a tight control over the auxin concentration by the plants is important, and it can be achieved by biosynthesis, degradation, transport, or reversible inactivation of auxin [13]. However, to date, there is no comprehensive study on the expression of genes related to auxin biosynthesis, transport, and receptor in B. rapa at both the primary and secondary phases of clubroot infection. In a recent study, Laila et al. [29] showed an association between expression of cytokinin-related genes and cytokinin contents from the published data at both the primary and secondary phases of infection in A. thaliana and Brassica spp. In this study, we have characterized 46 auxin signaling, transporter, receptor, and responsive genes in B. rapa through a rigorous in silico analysis. Subsequently, we validated 23 B. rapa auxin-related genes during primary infection, gall initiation, and gall expansion through an extensive expression study in Chinese cabbage, an important vegetable crop in southeast Asia, after inoculating a highly virulent Korean P. brassicae isolate. Finally, we correlated increased expression of auxin biosynthesis-related genes and simultaneous increase/decrease of auxin contents in the published data at the adjacent time-points in the clubroot-infected root tissues to denote the role of auxin-related genes. We believe that our transcript dataset on auxin-related genes helps to understand the pattern of auxin metabolism, transport, and signaling in roots and shoots of Chinese cabbage upon clubroot infection.

2. Results

2.1. Properties of Auxin-Related Proteins

In silico analysis showed that the 23 selected auxin-related genes were from different protein families like protein kinase, receptor kinase, the auxin responsive family, auxin efflux carrier, transcriptional regulator, auxin repressed protein, etc. (Table S1). The isoelectric point of an auxin-responsive GH3 family protein, except BrGH3.2, nitrilase, and aluminum-induced proteins, (BrARG10-like) are < 7.0. Small auxin-up RNA (SAUR)-like auxin-responsive protein family member BrSAUR4 has the highest isoelectric point, 10.96, followed by auxin repressed protein, BrARP1 (Table 1). SAUR-like auxin-responsive protein family members have lower molecular weights (12.03–19.75 kDa), whereas auxin-responsive GH3 family proteins have higher molecular weights (66.03–69.39 kDa). The auxin efflux carrier family protein BrPIN1 is the longest protein with 618 amino acids, whereas the SAUR-like auxin-responsive protein family member, BrSAUR1.1, is the shortest protein with only 104 amino acids (Table 1). Auxin-responsive GH3 family proteins have 587–612 amino acids (Table 1). Auxin-biosynthesis related proteins were predicted to localize in diverse cellular components including nucleus, mitochondrion, cytoplasm, cell membrane, etc. (Table 1).

2.2. Variation in Expression between Leaves and Roots

Experimental data of this study revealed that nineteen auxin biosynthesis-related genes showed statistically significant difference in expression levels in between leaf and root tissues when means values of leaf and roots of all samples from two treatments and five time-points were compared (Figure 2). Five auxin signaling-related genes—BrIAA4, BrIAA5, BrSAUR3, BrSAUR4, and BrPILS1—showed nonsignificant variations between leaf and root tissues (Figure 2). BrGH3.4, BrGH3.2, BrIAA1, BrPIN1, and BrNIT2 genes exhibited 33-, 8.4-, 9.7-, 8.3-, and 7.2-folds higher relative expression in leaf samples compared to root samples, respectively (Figure 2). BrIAA2 and BrIAA3 also showed significantly higher relative expression in leaf tissues compared to root tissues (Figure 2). BrGH3.3 showed a strikingly 1328-fold higher relative expression in root tissues compared to nontreated samples (control) at day 0 (Figure 2). Relative expression of this gene in root samples is 84.4-fold higher compared to leaf samples. BrDCK1 and BrARG10like genes exhibited 28.2- and 10.9-fold higher expression in root tissues compared to leaf tissues, respectively (Figure 2). Nine genes—namely, BrGH3.1, BrSAUR1, BrSAUR2, BrARP1, BrPILS1, BrRACK1, BrLAX1, BrGH3.5, and BrNIT1—also showed significantly higher expression levels in root samples compared to leaf samples (Figure 2).

2.3. Expression Profiles of Auxin-Responsive GH3 Family and BrDCK1 Genes

Relative expression analysis of genes showed that five auxin-responsive GH3 family genes accounted for significant variations in time-points, treatment within time-points, and sample types (leaf vs. root) within treatment and time-points (Table 2). The BrGH3.1 gene exhibited the highest expression level in mock-treated roots at day 3 followed by Seosan-inoculated roots at day 28 (Figure 3). Leaf and root samples of both mock and Seosan-inoculated plants showed comparatively lower expression of BrGH3.1 gene at day 1 (Figure 3). The BrGH3.2 gene was induced 25.4- and 6.5-fold in leaf samples of Seosan-inoculated plants at day 35 and day 28, respectively, compared to mock-treated plants (Figure 3 and Figure 4). This gene showed 13.2-fold increase in expression in root tissues of Seosan-inoculated plants compared to mock-treated plants at day 3 (Figure 4). Relative expression levels of BrGH3.3 gene in root tissues of Seosan-inoculated plants at day 14 and day 28 were remarkable (Figure 3). The BrGH3.3 gene exhibited high expression in root tissues. This gene showed 2.6-fold and 5.1-fold increases in expression in root tissues of Seosan-inoculated plants at day 14 and day 28, respectively, compared to mock-treated plants (Figure 3 and Figure 4). By contrast, the BrGH3.4 gene showed remarkably higher expression in leaf tissues (Figure 3). However, this gene showed >7.0-fold increase in expression in root tissues of Seosan-inoculated plants at day 3, day 14 and day 28 compared to mock-treated plants (Figure 4). The BrGH3.5 gene exhibited the highest expression level in root tissues of Seosan-inoculated plants at day 14 and this expression was 2.3-fold higher than mock-treated root samples (Figure 3 and Figure 4). Similar to the BrGH3.3 gene, the BrDCK1 gene was highly expressed in root tissues at all time-points compared to leaf tissues (Figure 3). The BrDCK1 gene exhibited 5.3-fold and 2.5-fold increases in expression in root samples of Seosan-inoculated plants at day 3 and day 14, respectively, compared to mock-treated plants (Figure 4).

2.4. Expression Profiles of BrIAA and BrRACK Genes

BrIAA1–BrIAA5 genes exhibited significant variations between five time-points, treatments, treatment × time-points, and sample types within treatment and time-point (Table 2). The BrIAA1 gene showed significantly higher expression in leaf samples compared to root samples (Figure 5). This gene showed 6.9-fold increase in expression at day 3 in leaf samples of Seosan-inoculated plants compared to mock-treated leaf samples (Figure 4). The BrIAA2 gene showed the highest expression level in root tissues at day 28 in Seosan-inoculated plants. This gene exhibited 5.4-fold increase in expression in Seosan-inoculated root tissues compared to mock-treated root tissues at day 28 (Figure 4 and Figure 5). The BrIAA3 gene showed the highest expression level in mock-treated leaf tissues on day 35, and the BrIAA4 gene showed the highest expression in mock-treated leaf tissues at day 1 (Figure 5). The BrIAA5 gene showed the highest expression in Seosan-inoculated root tissues on day 14. This gene upregulated 2.8-fold in Seosan-inoculated root tissues compared to mock-treated root tissues at day 14 (Figure 4 and Figure 5). In addition, the BrRACK1 gene exhibited comparatively higher relative expression in root tissues compared to leaf tissues (Figure 5).

2.5. Expression Profiles of BrSAUR and BrNIT Signaling Genes

The expression levels of four SAUR-like auxin-responsive genes varied significantly between time-points, treatment × time-points, and sample types within treatment and time-point (Table 2). The BrSAUR1 gene exhibited the highest expression level in root tissues of Seosan-inoculated plants on day 28 followed by day 14 (Figure 6). This gene upregulated 4.6- and 4.3-fold in root tissues of Seosan-inoculated plants on day 14 and day 28, respectively, compared to mock-treated root tissues (Figure 4 and Figure 6). The BrSAUR2 gene showed higher expression levels in root tissues of Seosan-inoculated plants on day 14 and mock-treated root tissues on day 1 compared to other samples (Figure 6). The BrSAUR3 gene exhibited 4.3-fold increase in expression on day 35 in leaf tissues of Seosan-inoculated plants compared to mock-treated plants (Figure 4 and Figure 6). The BrSAUR4 gene showed higher expression in root tissues on day 1 and day 3 but lower expression on day 28 and day 35 compared to leaf tissues (Figure 6). The nitrilase gene, BrNIT1, showed the highest expression level in mock-treated root tissues on day 1, and the expression of this gene reduced in root tissues with progression of clubroot formation (Figure 6). Another nitrilase gene, BrNIT2, showed upregulation in relative expression in leaf tissues compared to root tissues. This gene exhibited 4.6- and 3.2-fold increases in expression in root tissues of Seosan-inoculated plants compared to mock-treated plants on day 14 and day 28, respectively (Figure 4 and Figure 6).

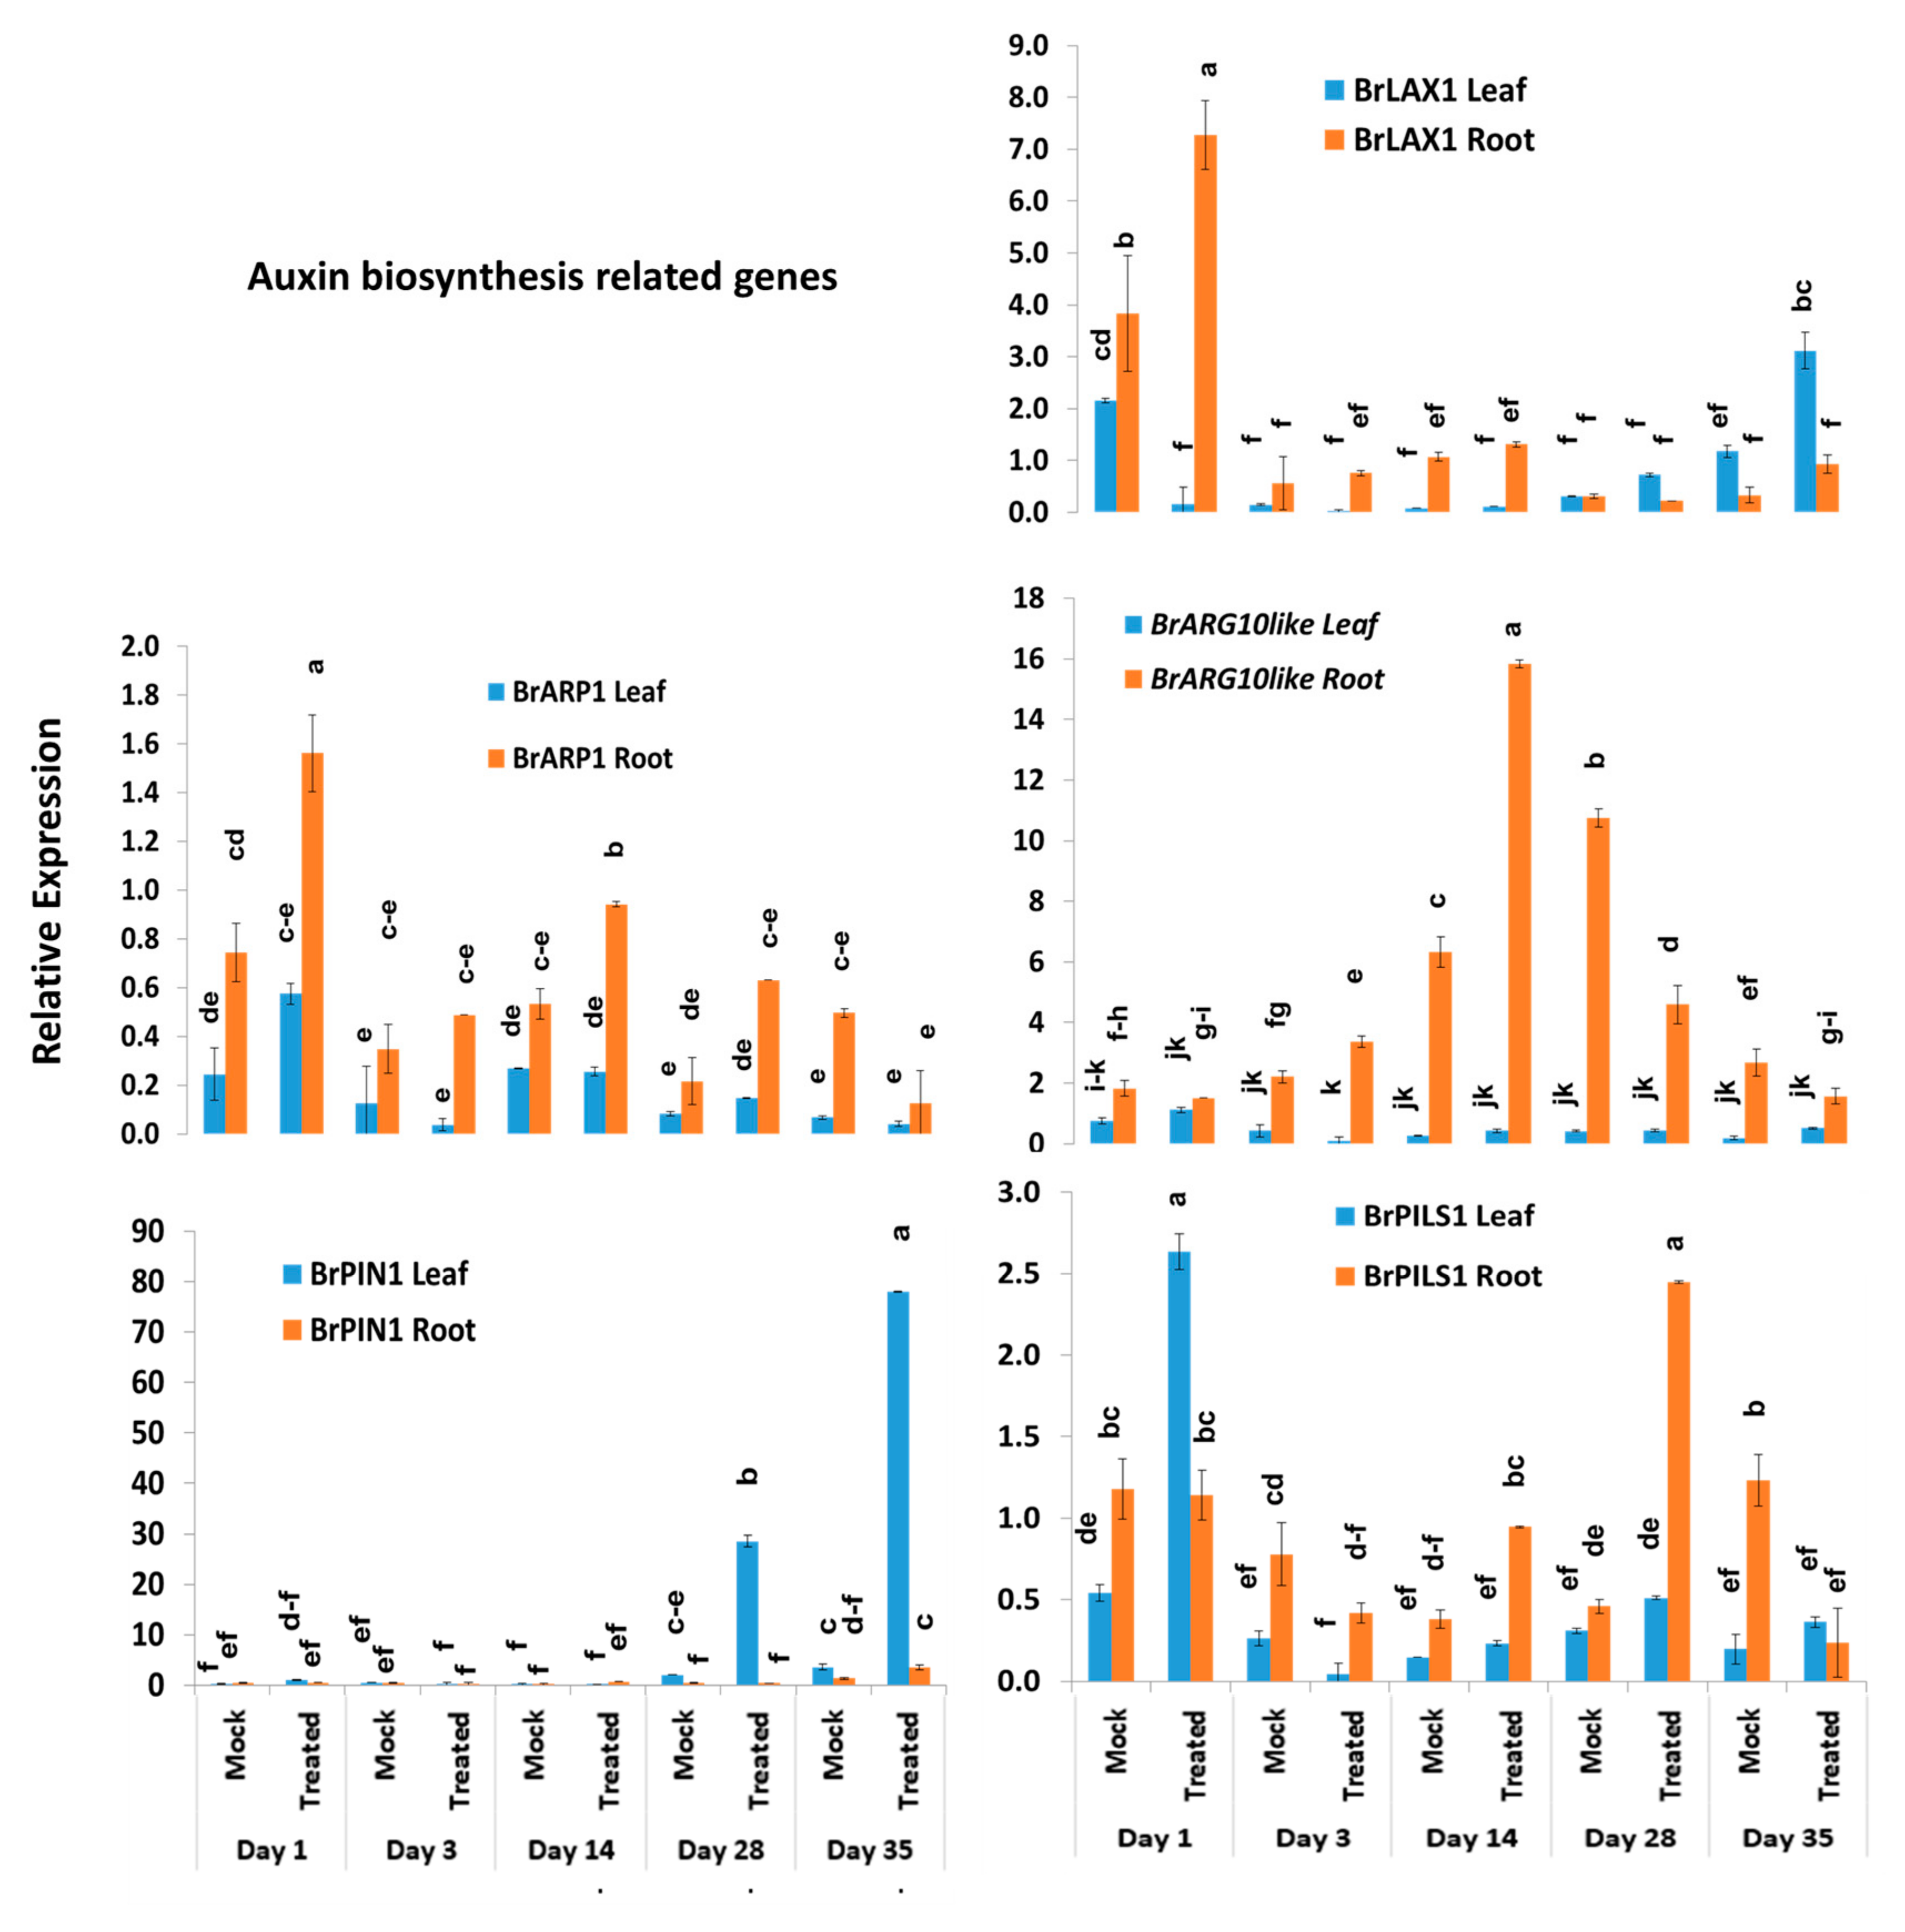
2.6. Expression Profiles of Other Auxin-Related Genes

Among the other five auxin biosynthesis-related genes, the BrLAX1 gene exhibited 1.9-fold increase in expression in root tissues of Seosan-inoculated plants compared to mock-treated plants on day 1 (Figure 4 and Figure 7). The auxin-repressed protein synthesizing gene, BrARP1, upregulated 2.1-, 1.8-, and 2.9-fold in root tissues of Seosan-inoculated plants compared to mock-treated plants on day 1, day 14, and day 28, respectively (Figure 4 and Figure 7). The BrARG10like gene exhibited 2.5-fold increase in expression in root tissues Seosan-inoculated plants compared to mock-treated plants on day 14 (Figure 4 and Figure 7). Relative expression of BrARG10like gene was notably higher in root tissues compared leaf tissues at all time-points (Figure 7). The BrPIN1 gene expressed highly in leaf tissues compared to root tissues, in general (Figure 7). This gene showed 13.7- and 21.9-fold increases in expression in leaf tissues of Seosan-inoculated plants compared to mock-treated plants on day 28 and day 35, respectively (Figure 4 and Figure 7). The BrPILS1 gene showed 4.9-fold increase in expression in leaf tissues on day 1 and 5.3-fold increase in expression in root tissues on day 28 in Seosan-inoculated plants compared to mock-treated plants (Figure 4 and Figure 7).

3. Discussion

The major focus of the study was to investigate the transcript profiles of 23 auxin-related genes at both the primary and secondary phases of clubroot infection in Chinese cabbage after inoculation with P. brassicae. Auxins are the phytohormones that regulate a number of physiological and biochemical processes in roots and shoots during clubroot disease development [1,22,26]. In this study, we used a highly virulent isolate of P. brassicae to inoculate the Chinese cabbage line to obtain a remarked alteration in transcript levels of auxin-related genes [29].

3.1. Expression Level Difference in Leaf vs. Root Tissue

Like cytokinins, auxins also play a vital role in root–shoot homeostasis [30,31]. These phytohormones produced in both shoots and root tips particularly promote elongation of stem and inhibit proliferation of lateral buds other than their role in plant–microbe interactions [32,33,34]. Several auxin-related genes in this study dynamically changed in leaf and root tissues of both mock-treated and Seosan-inoculated samples at both the primary and secondary phases of infection, indicating that auxin homeostasis at the intra-plant level is dynamic and that the auxin level alters over time between roots and shoots (Figure 3, Figure 4, Figure 5, Figure 6 and Figure 7). The BrGH3.3, BrDCK1, and BrARG10like genes were comparatively highly expressed by 84.4-, 28.2-, and 10.9-fold, respectively, in root tissues compared to leaf tissues, indicating that these three genes are important in auxin-mediated root development (Figure 2). In contrast, four genes, BrGH3.2, BrIAA1, BrPIN1, and BrNIT2, were highly expressed in leaf tissues compared to root tissues, indicating that these genes have a vital role in auxin-mediated leaf development (Figure 2). The variation in expression levels of auxin-related genes in leaves and roots further indicated that the auxin level differs between roots and leaves considering that expression level of auxin-signaling, receptor, and transporter genes are positively associated with auxin biosynthesis and accumulation in different organs.

3.2. Expression Level Difference and Role of Auxin Signaling and Biosynthesis (BrGH3, BrIAA, BrNIT, and BrSAUR) Genes

BrGH3, BrIAA, BrNIT, and BrSAUR are the primary responsive genes that play a vital role in auxin signaling and biosynthesis [35,36]. In A. thaliana, several members of AtGH3, auxin conjugate synthetases (Gretchenhagen-3), including GH3.2, GH3.3, GH3.4, GH3.5, GH3.14, and GH3.17 were upregulated at 24 and 28 dai in the P. brassicae-inoculated plants compared to non-inoculated plants [19]. Among them, the AtGH3.5 gene plays multiple roles in auxin biosynthesis by conjugating with IAA and salicylic acid, and this gene has a role in camalexin biosynthesis [19]. GH3 proteins by conjugating with IAA possibly play a role in auxin homeostasis and plant–pathogen interactions [19,37]. In this study, a remarkable upregulation of the BrGH3.3 gene at 14 and 28 dai and the BrGH3.5 gene at 14 dai in the root tissues of Seosan-inoculated plants compared to mock-treated plants indicates that these two genes have a vital importance in clubroot formation through enhanced accumulation of auxins or auxin conjugating enzymes (Figure 8) [19].
Experimental evidence indicated that IAA transport has a role in clubroot formation [3,24]. A few IAA signaling genes such as AtIAA7 [19] and AtIAA2 [24] were upregulated in previous studies in the infected root tissues but the transcript abundance of AtIAA28 was higher in control plants compared to infected plants [19]. AtIAA28 was also found to negatively regulate lateral root formation [38], where hyperplasia and massive lateral root formation occurred simultaneously during clubroot formation [19] indicating that upregulation of AtIAA28 may inhibit clubroot formation. In this study, none among the five BrIAA genes were markedly upregulated in root tissues (Figure 2) except that the BrIAA5 gene was 2.8-fold upregulated at 14 days after inoculation in treated plants, indicating that this gene might play role in auxin signaling during cortex infection (Figure 4 and Figure 8).
Two genes BrNIT1 and BrNIT2 were from the nitrilases protein family that are associated with the biosynthesis of IAA. Nitrilases are involved in catalyzing the conversion of IAN (indole-3-acetonitrile) to IAA in root tissues of A. thaliana [39,40,41]. Both nitrilase 1 and 2 were actively involved in clubroot formation [17,23]. Transformation of A. thaliana plants with nitrilase 1 with antisense direction (aNIT1) exhibited a reduced infection rate cogmpared to wild type plants [17]. In this study, a 4.6-fold higher expression of BrNIT1 gene in the Seosan-inoculated root tissues at 14 days after inoculation compared to mock-treated root tissues indicated that nitrilase enzyme might be activated for auxin signaling during cortex infection (Figure 4). Our assumption is consistent with a previous study that observed a strikingly higher expression of NIT1 gene in susceptible cultivar of B. napus–Hornet compared to the comparatively resistant cultivar Alister [42].
Another group of auxin signaling genes was SAUR-like genes which are transiently expressed in response to auxin. The SAUR-genes, early auxin-responsive gene family in A. thaliana are involved in plant development and leaf senescence [43,44,45]. In A. thaliana, SAUR genes were highly upregulated in the root tissues at 17 dpi after P. brassicae inoculation, indicating that IAA induces root cell division during pre-gall formation and cortex infection [46]. In contrast, Ciaghi et al. [47] reported upregulation of SAUR genes in symptomless root tissues. In this study, an increase in expression of BrSAUR1 gene by 4.6- and 4.3-folds in Seosan-inoculated plants compared to mock-treated plants at 14 and 28 after inoculation, respectively, indicated that this gene has important role in auxin signaling during gall formation (Figure 4 and Figure 8).

3.3. Expression Level Difference and Role of Auxin Transporter (BrPIN, BrPILS, and BrLAX) Genes

PIN, PILS, and LAX proteins are involved in mediating the transport of auxin across the plasma membrane. The subcellular localization of PIN, auxin efflux carriers, largely determine the direction of auxin transport. Subcellular dynamics of PIN proteins is vital for the directionality of auxin transport [48,49]. In addition, distribution of auxin, collectively regulated by five PIN genes in the primary roots of Arabidopsis, regulates cell division and cell expansion [50]. In this study, 3.7- and 2.7-fold upregulation of the BrPIN1 gene at 14 and 35 days after inoculation, respectively, and 5.3-fold upregulation of the BrPILS1 (PIN-like auxin efflux carrier) gene at 28 days after inoculation in Seosan-inoculated roots compared to mock-treated samples indicated that these two genes have vital importance in auxin distribution in dividing cells during cortex infection and gall formation (Figure 4 and Figure 8). AUX/LAX family members and auxin influx transporters are involved in root gravitropism and root hair development along with other activities [51]. In this study, a higher expression of BrLAX1 gene in Seosan-inoculated roots by 1.9-fold at 1 dpi indicated that this gene played a positive role in root hair infection during the primary infection phase of P. brassicae (Figure 4 and Figure 8).

3.4. Expression Level Difference and Role of Auxin Receptor (BrDCK and BrRACK) Genes

BrDCK1 and BrRACK1 are the auxin receptor genes that were not studied before during clubroot disease development. However, experimental data suggested that RACK1 gene, by interacting with signaling molecules and by playing its multiple hormone responsiveness role, may modulate signal transduction pathways [52,53]. Overexpression of BoRACK1 gene in kale (B. oleracea var. acephala) resulted in the reduction of downy mildew symptoms caused by Peronospora brassicae, indicating that this gene may develop a network with regulatory genes to offer resistance to downy mildew disease [53]. In contrast, BjuTIR1/AFB family genes are the auxin receptor genes that were found to be greatly induced by P. brassicae treatment, indicating that upregulation of auxin receptor genes may positively regulate clubroot formation [54]. In this study, induced expression levels of BrDCK1 gene by 5.3- and 2.5-fold in Seosan-inoculated plants compared to mock-treated plants at 3 dpi and 14 dpi, respectively, indicate that this gene has importance in both primary infection and cortex infection (Figure 4 and Figure 8).

3.5. Expression Level Difference and Role of BrARP1 Gene

Auxin-repressed proteins (ARPs) are responsive to various biotic and abiotic stress factors including drought [55,56], salinity [56,57], cold/chilling [56,57,58], heat [57], insect [59], and S. sclerotiorum fungus [59]. In Arabidopsis, the BnARP1-OE-135 transgenic line exhibited 70% seedling survival whereas the wild type plants showed less than 20% seedling survival upon the inoculation of S. sclerotiorum, indicating that a higher expression level of the BnARP1 gene was associated with seedling resistance [59]. Overexpression of the BrARP1 gene in Arabidopsis reduced vegetative growth and seed productivity, indicating that this gene is involved in growth arrest [57]. A notably higher expression of the BrARP1 gene by 2.1-, 1.8-, and 2.9-fold at 1, 14, and 28 dpi, respectively, in the Seosan-inoculated root tissues compared to mock-treated roots indicated that this gene remains active at both the primary and secondary phases of infection to tackle P. brassicae infection. However, the development of disease is a subject of interactions among many other phytohormonal cross-talks including auxins, cytokinins, brassinosteroids, salicylic acid, etc. [29,42]. Contents of IAA and IAN accumulated differentially in B. oleracea (cabbage) and Arabidopsis at 28 dpi in previous studies (Figure 8). Ludwig-Müller et al. [7] observed an increase in accumulation of IAA and IAN in clubroots of A. thaliana whereas Kavanagh and Williams [60] observed a decrease in contents of these two auxins in cabbage at 28 dpi. Content of amide was also increased at both 24 and 30 dpi in A. thaliana [7]. We predict that a higher expression of auxin repressed genes (ARP1) might be one of the factors of decreasing in IAA and IAN in the clubroots of cabbage (Figure 8).

4. Materials and Methods

4.1. Preparation of Plant Materials

The Chinese cabbage (Brassica rapa var. pekinensis) cultivar “Bullam-3-ho” that was collected from Woori Seeds company, South Korea, was selected for inoculation with P. brassicae. Collected seeds were sterilized in 70% ethanol for 1 min and then in 1% sodium hypochlorite (NaOCl) for 8 min and washed by double distilled water (DDW) for three times in turn. For germination and seedling establishment, the seeds were then planted into 50-cell trays (tray size: 540 mm × 280 mm; hole size: 46 mm × 23 mm × 45 mm) containing sterile nursery soil mixture. Plants were grown under controlled conditions at 25 ± 1 °C temperature, 65–70% relative humidity, and 230–250 μmol m-2 s-1 light intensity for a 16:8 h light-dark cycle.

4.2. Gall Collection, Spore Preparation, and Inoculation of Plant Materials

P. brassicae spores of the “Seosan” isolate, a highly virulent isolate, were extracted according to Feng et al. [61] and Laila et al. [29]. Extracted spores were counted in a hemocytometer, and the final concentration was adjusted to 1 × 10⁷ spores µL−1. For the disease inoculation, we followed the root cutting method. Two-week-old seedlings were inoculated with prepared spores of the Seosan isolate of P. brassicae, and the inoculated plants were monitored for the following five weeks for any gall formation (Figure 9). After cutting the root branches, plants were inoculated with 6 mL of spore suspension (107 spores µL-1) for 10–15 minutes, and to maintain a stable growth environment, the inoculated plants were immediately transferred in a 200 cm3 pot containing artificial soil in a controlled growth chamber. The roots of plants under the mock treatment were incubated in 6 mL sterile water.

4.3. Sampling of Inoculated Roots and Leaves for Expression Analysis

For expression study, the Chinese cabbage cultivar “Bullam-3-ho” was inoculated with the P. brassicae isolate “Seosan” (pathotype 4) at 107 spores mL-1. This isolate was found to be the most virulent compared to three other Korean geographical isolates of P. brassicae in a recent study [29]. For the qRT-PCR expression analysis of selected auxin-related genes, roots and leaves were sampled from 14-day-old mock and inoculated plants at 1, 3, 14, 28, and 35 dai as listed in Table 3. Leaf samples from nontreated plants were collected on day 0 as a reference. All the sampling was done in triplicate. After uprooting, the plant roots were washed carefully under running tap water to remove soil particles, followed by drying the roots keeping on filter papers. The samples were then immediately frozen in liquid nitrogen and stored at −80 °C prior to use.

4.4. Extraction of RNA

For extracting total RNA, RNeasy Plant Mini Kit (Qiagen, Hilden, Germany) was used. To extract the total RNA from all 20 samples (Table 3), about 100 mg of leaf or root tissue was taken into a mortar. Samples were homogenized with a pestle in liquid nitrogen. Traces of DNA were eliminated using RNase-free DNase (Qiagen). The level of purity of the isolated RNA was measured at a 260/280 nm ratio in the NanoDrop® ND-1000 (Thermo Scientific, Hudson, NH, USA). Total RNA was converted to complementary DNA (cDNA) using a Superscript® III First-Strand Synthesis Kit (Invitrogen, CA, USA) following the manufacturer’s instructions.

4.5. In Silico Analysis of Auxin-Related Genes

The list of auxin metabolism, signaling, and transport-related genes in A. thaliana reported by Schuller et al. [21] was used as baseline to find corresponding auxin-related B. rapa orthologs from the BRAD database (http://brassicadb.org/brad/; Cheng et al. [62]; Table 1, Figure S1). In silico analysis was performed to assess the gene properties. For analyzing the primary structures of the genes, protParam (http://expasy.org/tools/protparam.html) [63] was used. Localization of the auxin biosynthetic proteins was predicted using both DeepLoc-1.0 (http://www.cbs.dtu.dk/services/DeepLoc/) and UniProt (https://www.uniprot.org/uniprot/). A phylogenetic tree was generated using Neighbor-joining (NJ) algorithm [64] in MEGA X software [65].

4.6. Quantitative RT-PCR for Expression Analysis

The relative expression patterns of B. rapa auxin-related genes were studied using quantitative RT-PCR (qPCR) in 20 samples presented in Table 3. Expression of genes in leaf tissues of control (nontreated) plants on day 0 were set to 1. Each of three biological replicates were repeated three times. The gene-specific primers designed by Primer3 software (http://frodo.wi.mit.edu/primer3) were used for qPCR expression analysis (Table 4). Primer specificity was tested by following Robin et al. [66]. GenBank Accession Nos. XM_009147610.2 and FJ969844.1 from B. rapa representing ACTIN genes (housekeeping genes) were used to standardize the expression levels of 23 auxin-related genes. The qPCR reaction was performed using 1 μL cDNA template of 50 ng μL-1 concentration, 1 μL each of forward and reverse primers at 10 pmol concentration, 10 μL qPCR BIOSyGreen Mix Lo-ROX (PCR Biosystems, London, UK), and 7 μL double distilled water to make a final reaction volume of 20 μL. The conditions for qPCR were as follows: denaturation for 10 min at 95 °C, followed by 40 cycles of amplification at 95 °C for 20 s, 58 °C for 20 s, and 72 °C for 25 s. The fluorescence was recorded following the last step of each cycle for three technical replicates per sample. For the detection of amplification and analyzing data, LightCycler96 (Roche, Mannheim, Germany) software was used. The relative expression value of nontreated leaf samples at day 0 was set to 1. The relative transcript abundance of the auxin-related genes was calculated using the 2−ΔΔCt method [67].

4.7. Statistical Analysis

A nested analysis of variance (ANOVA) under general linear model was employed to depict significant difference in relative expression levels of auxin biosynthesis-related genes for treatments (mock and Seosan-inoculated), time-points (dpi), and sample types (leaf vs. root) using MINITAB 17 Statistical Software (Minitab Inc., State College, PA, USA). A one-way ANOVA was carried out to explore the statistical significance between leaf vs. root using MINITAB 17 Statistical Software. Tukey’s pairwise comparisons were used for comparing means of relative expression values.

5. Conclusions

Expression levels of auxin signaling, transport, receptor, and repressed-related genes showed notable variation between leaf and root tissues, indicating their organ-specific differential expression. The BrGH3.3, BrDCK1, BrNIT1, and BrARG10like genes exhibited remarkably higher expression in root tissues compared to leaf tissues, indicating their importance in clubroot development. The BrGH3.3, BrNIT1, BrPIN1, and BrDCK1 genes were markedly induced in P. brassicae-infected root tissues at 14 dpi during cortex infection and played a role in auxin signaling that is required for clubroot formation. The BrGH3.3, BrPIN1, and BrPILS1 genes were induced at 28 dpi and played a role in auxin accumulation for cell division and expansion during gall formation. BrLAX1 was induced at 1 dpi that possibly enhanced primary infection at root hairs. In contrast, a notably higher expression of BrARP1 gene in infected root tissues at three different dpi indicated resistance response of host plants towards clubroot development. We conclude that the BrGH3.3, BrNIT1, BrPIN1, and BrDCK1 genes play a significant role in clubroot formation via auxin signaling. Developing mutants of these four genes, coupled with a higher expression of BrARP1 gene, may offer clubroot resistance in Chinese cabbage.

Supplementary Materials

The following are available online at https://www.mdpi.com/1422-0067/21/15/5554/s1, Figure S1. Phylogenetic tree showing association between auxin biosynthesis genes (black) in Arabidopsis thaliana and orthologues in Brassica rapa. Different colour codes of B. rapa genes represent different protein/gene families. BrGH3—violet, BrIAA—light blue, BrSAUR—green, BrPIN—orange, BrARG10like—yellow, BrLAX—pink, BrPILS—dark red, BrGH3—light green, BrNIT- chocolate, BrDCK-Red and BrARP—dark blue, Table S1. Protein homology analysis of 23 genes involved in auxin metabolism, signaling, and transport in Brassica rapa.

Author Contributions

I.-S.N., J.-I.P., A.H.K.R., and H.-T.K. conceived and designed the study. G.S. and A.H.K.R. conducted in silico analysis. R.L. and A.H.K.R. managed the experimental plants and collected samples. R.L. prepared cDNA and conducted qRT-PCR analysis. A.H.K.R. analyzed data. A.H.K.R. and G.S. wrote the manuscript. A.H.K.R. critically revised the manuscript. All authors have read and agreed to the published version of the manuscript.

Funding

This study was supported by the Center for Horticultural Seed Development (Golden Seed Project no. 213007-05-4-CG100) of the Ministry of Agriculture, Food, and Rural Affairs in the Republic of Korea (MAFRA).

Acknowledgments

We thank the Woori Seeds, Republic of Korea for providing seeds. The authors thank Gyung Ja Choi for providing clubroot-infected isolates collected from nine regions of Korea.

Conflicts of Interest

The authors declare no conflict of interest.

References

  1. Ludwig-Müller, J. Auxin homeostasis, signaling, and interaction with other growth hormones during the clubroot disease of Brassicaceae. Plant Signal Behav. 2014, 9, e28593. [Google Scholar] [CrossRef] [PubMed] [Green Version]
  2. Wallenhammar, A.C. Prevalence of Plasmodiophora brassicae in a spring oilseed rape growing area in central Sweden and factors influencing soil infestation levels. Plant Pathol. 1996, 45, 710–719. [Google Scholar] [CrossRef]
  3. Devos, S.; Laukens, K.; Deckers, P.; Van Der Straeten, D.; Beeckman, T.; Inzé, D.; Van Onckelen, H.; Witters, E.; Prinsen, E. A hormone and proteome approach to picturing the initial metabolic events during Plasmodiophora brassicae infection on Arabidopsis. Mol. Plant Microbe Interact. 2006, 19, 1431–1443. [Google Scholar] [CrossRef] [Green Version]
  4. Kageyama, K.; Asano, T. Life cycle of Plasmodiophora brassicae. J. Plant Growth Regul. 2009, 28, 203–211. [Google Scholar] [CrossRef]
  5. Devos, S.; Vissenberg, K.; Verbelen, J.P.; Prinsen, E. Infection of Chinese cabbage by Plasmodiophora brassicae leads to a stimulation of plant growth: Impacts on cell wall metabolism and hormone balance. New Phytol. 2005, 166, 241–250. [Google Scholar] [CrossRef]
  6. Dixon, G.R. The occurrence and economic impact of Plasmodiophora brassicae and clubroot disease. J. Plant Growth Regul. 2009, 28, 194–202. [Google Scholar] [CrossRef]
  7. Ludwig-Müller, J.; Pieper, K.; Ruppel, M.; Cohen, J.D.; Epstein, E.; Kiddle, G.; Bennett, R. Indole glucosinolate and auxin biosynthesis in Arabidopsis thaliana (L.) Heynh. glucosinolate mutants and the development of clubroot disease. Planta 1999, 208, 409–419. [Google Scholar]
  8. Ludwig-Müller, J.; Prinsen, E.; Rolfe, S.A.; Scholes, J.D. Metabolism and plant hormone action during clubroot disease. J. Plant Growth Regul. 2009, 28, 229–244. [Google Scholar] [CrossRef]
  9. Robin, A.H.K.; Hossain, M.R.; Kim, H.T.; Nou, I.S.; Park, J.I. Role of Cytokinins in Clubroot Disease Development. Plant Breed. Biotech. 2019, 7, 73–82. [Google Scholar] [CrossRef]
  10. Dekhuijzen, H.M. The occurrence of free and bound cytokinins in plasmodia of Plasmodiophora brassicae isolated from tissue cultures of clubroots. Plant Cell Rep. 1981, 1, 18–20. [Google Scholar] [CrossRef]
  11. Müller, P.; Hilgenberg, W. Isomers of zeatin and zeatin riboside in clubroot tissue: Evidence for trans-zeatin biosynthesis by Plasmodiophora brassicae. Physiol. Plant. 1986, 66, 245–250. [Google Scholar] [CrossRef]
  12. Davies, P.J. The Plant Hormones: Their Nature, Occurrence, and Functions. In Plant Hormones; Springer: Dordrecht, The Netherlands, 2010; pp. 1–15. [Google Scholar]
  13. Ludwig-Müller, J. Bacteria and fungi controlling plant growth by manipulating auxin: Balance between development and defense. J. Plant Physiol. 2015, 172, 4–12. [Google Scholar] [CrossRef]
  14. Fu, J.; Wang, S. Insights into auxin signaling in plant–pathogen interactions. Front. Plant Sci. 2011, 2, 74. [Google Scholar] [CrossRef] [Green Version]
  15. Butcher, D.N.; El-Tigani, S.; Ingram, D.S. The role of indole glucosinolates in the clubroot disease of the Cruciferae. Physiol. Plant Pathol. 1974, 4, 127–140. [Google Scholar] [CrossRef]
  16. Mousdale, D.M.A. Endogenous indolyl-3-acetic acid and pathogen-induced plant growth disorders: Distinction between hyperplasia and neoplastic development. Experientia 1981, 37, 972–973. [Google Scholar] [CrossRef]
  17. Neuhaus, K.; Grsic-Rausch, S.; Sauerteig, S.; Ludwig-Müller, J. Arabidopsis plants transformed with nitrilase 1 or 2 in antisense direction are delayed in clubroot development. J. Plant Physiol. 2000, 156, 756–761. [Google Scholar]
  18. Raa, J. Indole-3-acetic acid levels and the role of indole-3-acetic acid oxidase in the normal root and club-root of cabbage. Physiol. Plant. 1971, 25, 130–134. [Google Scholar] [CrossRef]
  19. Jahn, L.; Mucha, S.; Bergmann, S.; Horn, C.; Siemens, J.; Staswick, P.; Steffens, B.; Ludwig-Müller, J. The clubroot pathogen (Plasmodiophora brassicae) influences auxin signaling to regulate auxin homeostasis. Plants 2013, 2, 726–749. [Google Scholar] [CrossRef] [PubMed] [Green Version]
  20. Siemens, J.; Keller, I.; Sarx, J.; Kunz, S.; Schuller, A.; Nagel, W.; Schmülling, T.; Parniske, M.; Ludwig-Müller, J. Transcriptome analysis of Arabidopsis clubroots indicate a key role for cytokinins in disease development. Mol. Plant Microbe Interact. 2006, 19, 480–494. [Google Scholar] [CrossRef] [Green Version]
  21. Schuller, A.; Kehr, J.; Ludwig-Müller, J. Laser microdissection coupled to transcriptional profiling of Arabidopsis roots inoculated by Plasmodiophora brassicae indicates a role for brassinosteroids in clubroot formation. Plant Cell Physiol. 2014, 55, 392–411. [Google Scholar] [CrossRef]
  22. Ludwig-Müller, J.; Auer, S.; Jülke, S.; Marschollek, S. Manipulation of auxin and cytokinin balance during the Plasmodiophora brassicaeArabidopsis thaliana interaction. In Auxins and Cytokinins in Plant Biology; Humana Press: Totowa, NJ, USA, 2017; pp. 41–60. [Google Scholar]
  23. Grsic-Rausch, S.; Kobelt, P.; Siemens, J.; Bischoff, M.; Ludwig-Müller, J. Expression andlocalization of nitrilase during symptom development of the clubroot disease in Arabidopsis thaliana. Plant Physiol. 2000, 122, 369–378. [Google Scholar] [CrossRef] [Green Version]
  24. Päsold, S.; Siegel, I.; Seidel, C.; Ludwig-Müller, J. Flavonoid accumulation in Arabidopsis thaliana root galls caused by the obligate biotrophic pathogen Plasmodiophora brassicae. Mol. Plant Pathol. 2010, 11, 545–562. [Google Scholar] [CrossRef] [PubMed]
  25. Grsic, S.; Kirchheim, B.; Pieper, K.; Fritsch, M.; Hilgenberg, W.; Ludwig-Müller, J. Induction of auxin biosynthetic enzymes by jasmonic acid and in clubroot diseased Chinese cabbage plants. Physiol. Plant. 1999, 105, 521–531. [Google Scholar] [CrossRef]
  26. Schuller, A.; Ludwig-Müller, J. A family of auxin conjugate hydrolases from Brassica rapa: Characterization and expression during clubroot disease. New Phytol. 2006, 171, 145–158. [Google Scholar] [CrossRef]
  27. Agarwal, A.; Kaul, V.; Faggian, R.; Rookes, J.E.; Ludwig-Müller, J.; Cahill, D.M. Analysis of global host gene expression during the primary phase of the Arabidopsis thaliana–Plasmodiophora brassicae interaction. Funct. Plant Biol. 2011, 38, 462–478. [Google Scholar] [CrossRef] [Green Version]
  28. Jia, H.; Wei, X.; Yang, Y.; Yuan, Y.; Wei, F.; Zhao, Y.; Yang, S.; Yao, Q.; Wang, Z.; Tian, B.; et al. Root RNA-seq analysis reveals a distinct transcriptome landscape between clubroot-susceptible and clubroot-resistant Chinese cabbage lines after Plasmodiophora brassicae infection. Plant Soil. 2017, 421, 93–105. [Google Scholar] [CrossRef]
  29. Laila, R.; Robin, A.H.K.; Park, J.-I.; Saha, G.; Kim, H.-T.; Kayum, M.A.; Nou, I.-S. Expression and Role of Response Regulating, Biosynthetic and Degrading Genes for Cytokinin Signaling during Clubroot Disease Development. Int. J. Mol. Sci. 2020, 21, 3896. [Google Scholar] [CrossRef]
  30. Park, B.S.; Sang, W.G.; Song, J.T.; Lee, B.H.; Kim, J.H.; Seo, H.S. Auxin is involved in the regulation of leaf and root development by LAF1 under short day conditions. Biol. Plant. 2011, 55, 647. [Google Scholar] [CrossRef]
  31. Ruzza, V.; Sessa, G.; Sassi, M.; Morelli, G.; Ruberti, I. Auxin coordinates shoot and root development during shade avoidance response. In Auxin and its role in plant development; Zažímalová, E., Petrášek, J., Benková, E., Eds.; Springer: Vienna, Austria, 2014; pp. 389–412. [Google Scholar]
  32. Aloni, R.; Aloni, E.; Langhans, M.; Ullrich, C.I. Role of cytokinin and auxin in shaping root architecture: Regulating vascular differentiation, lateral root initiation, root apical dominance and root gravitropism. Ann. Bot. 2006, 97, 883–893. [Google Scholar] [CrossRef]
  33. Overvoorde, P.; Fukaki, H.; Beeckman, T. Auxin control of root development. Cold Spring Harb. Perspect. Biol. 2010, 2, a001537. [Google Scholar] [CrossRef] [Green Version]
  34. Spaepen, S.; Vanderleyden, J. Auxin and plant-microbe interactions Cold Spring Harb. Perspect. Biol. 2011, 3, a001438. [Google Scholar]
  35. Hagen, G.; Guilfoyle, T. Auxin-responsive gene expression: Genes, promoters and regulatory factors. Plant Mol. Biol. 2002, 49, 373–385. [Google Scholar] [CrossRef] [PubMed]
  36. Berleth, T.; Krogan, N.T.; Scarpella, E. Auxin signals—turning genes on and turning cells around. Curr. Opin. Plant Biol. 2004, 7, 553–563. [Google Scholar] [CrossRef] [PubMed]
  37. Ludwig-Müller, J. Auxin conjugates: Their role for plant development and in the evolution of land plants. J. Exp. Bot. 2011, 62, 1757–1773. [Google Scholar] [CrossRef] [Green Version]
  38. De Rybel, B.; Vassileva, V.; Parizot, B.; Demeulenaere, M.; Grunewald, W.; Audenaert, D.; van Camenhout, J.; Overvoorde, P.; Jansen, L.; Vanneste, S.; et al. A novel Aux/IAA28 signaling cascade activates GATA23-dependent specification of lateral root founder cell identity. Curr. Biol. 2010, 20, 1697–1706. [Google Scholar] [CrossRef]
  39. Bartling, D.; Seedorf, M.; Schmidt, R.C.; Weiler, E.W. Molecular characterization of two cloned nitrilases from Arabidopsis thaliana: Key enzymes in biosynthesis of the plant hormone indole-3-acetic acid. Proc. Natl. Acad. Sci. USA 1994, 91, 6021–6025. [Google Scholar] [CrossRef] [Green Version]
  40. Bartel, B.; Fink, G.R. Differential regulation of an auxin-producing nitrilase gene family in Arabidopsis thaliana. Proc. Natl. Acad. Sci. USA 1994, 91, 6649–6653. [Google Scholar] [CrossRef] [Green Version]
  41. Müller, A.; Hillebrand, H.; Weiler, E.W. Indole-3-acetic acid is synthesized from L-tryptophan in roots of Arabidopsis thaliana. Planta 1998, 206, 362–369. [Google Scholar] [CrossRef]
  42. Prerostova, S.; Dobrev, P.I.; Konradyova, V.; Knirsch, V.; Gaudinova, A.; Kramna, B.; Kazda, J.; Ludwig-Müller, J.; Vankova, R. Hormonal responses to Plasmodiophora brassicae infection in Brassica napus cultivars differing in their pathogen resistance. Int. J. Mol. Sci. 2018, 19, 4024. [Google Scholar] [CrossRef] [Green Version]
  43. Park, J.E.; Kim, Y.S.; Yoon, H.K.; Park, C.M. Functional characterization of a small auxin-up RNA gene in apical hook development in Arabidopsis. Plant Sci. 2007, 172, 150–157. [Google Scholar] [CrossRef]
  44. Markakis, M.N.; Boron, A.K.; Van Loock, B.; Saini, K.; Cirera, S.; Verbelen, J.P.; Vissenberg, K. Characterization of a small auxin-up RNA (SAUR)-like gene involved in Arabidopsis thaliana development. PLoS ONE 2013, 8, e82596. [Google Scholar] [CrossRef] [Green Version]
  45. Hou, K.; Wu, W.; Gan, S.S. SAUR36, a small auxin up RNA gene, is involved in the promotion of leaf senescence in Arabidopsis. Plant Physiol. 2013, 161, 1002–1009. [Google Scholar] [CrossRef] [PubMed] [Green Version]
  46. Irani, S.; Trost, B.; Waldner, M.; Nayidu, N.; Tu, J.; Kusalik, A.J.; Todd, C.D.; Wei, Y.; Bonham-Smith, P.C. Transcriptome analysis of response to Plasmodiophora brassicae infection in the Arabidopsis shoot and root. BMC Genom. 2018, 19, 23. [Google Scholar] [CrossRef] [PubMed] [Green Version]
  47. Ciaghi, S.; Schwelm, A.; Neuhauser, S. Transcriptomic response in symptomless roots of clubroot infected kohlrabi (Brassica oleracea var. gongylodes) mirrors resistant plants. BMC Plant Biol. 2019, 19, 288. [Google Scholar] [CrossRef] [PubMed] [Green Version]
  48. Friml, J. Subcellular trafficking of PIN auxin efflux carriers in auxin transport. Eur. J. Cell Biol. 2010, 89, 231–235. [Google Scholar] [CrossRef] [PubMed]
  49. Adamowski, M.; Friml, J. PIN-dependent auxin transport: Action, regulation, and evolution. Plant Cell 2015, 27, 20–32. [Google Scholar] [CrossRef] [Green Version]
  50. Blilou, I.; Xu, J.; Wildwater, M.; Willemsen, V.; Paponov, I.; Friml, J.; Heidstra, R.; Aida, M.; Palme, K.; Scheres, B. The PIN auxin efflux facilitator network controls growth and patterning in Arabidopsis roots. Nature 2005, 433, 39–44. [Google Scholar] [CrossRef]
  51. Swarup, R.; Péret, B. AUX/LAX family of auxin influx carriers—an overview. Front. Plant Sci. 2012, 3, 225. [Google Scholar] [CrossRef] [Green Version]
  52. Li, D.H.; Shen, F.J.; Li, H.Y.; Li, W. Kale BoRACK1 is involved in the plant response to salt stress and Peronospora brassicae Gaumann. J. Plant Physiol. 2017, 213, 188–198. [Google Scholar] [CrossRef]
  53. Chen, J.G.; Ullah, H.; Temple, B.; Liang, J.; Guo, J.; Alonso, J.M.; Ecker, J.R.; Jones, A.M. RACK1 mediates multiple hormone responsiveness and developmental processes in Arabidopsis. J. Exp. Bot. 2006, 57, 2697–2708. [Google Scholar] [CrossRef] [Green Version]
  54. Cai, Z.; Zeng, D.E.; Liao, J.; Cheng, C.; Sahito, Z.A.; Xiang, M.; Fu, M.; Chen, Y.; Wang, D. Genome-wide analysis of auxin receptor family genes in Brassica juncea var. tumida. Genes 2019, 10, 165. [Google Scholar] [CrossRef] [PubMed] [Green Version]
  55. Tatematsu, K.; Ward, S.; Leyser, O.; Kamiya, Y.; Nambara, E. Identification of cis-Elements That Regulate Gene Expression during Initiation of Axillary Bud Outgrowth in Arabidopsis. Plant Physiol. 2005, 138, 757–766. [Google Scholar] [CrossRef] [PubMed] [Green Version]
  56. Mantri, N.L.; Ford, R.; Coram, T.E.; Pang, E.C.K. Transcriptional Profiling of Chickpea Genes Differentially Regulated in Response to High-Salinity, Cold and Drought. BMC Genom. 2007, 8, 303. [Google Scholar] [CrossRef] [PubMed] [Green Version]
  57. Lee, J.; Han, C.-T.; Hur, Y. Molecular Characterization of the Brassica rapa Auxin-Repressed, Superfamily Genes, BrARP1 and BrDRM1. Mol. Biol. Rep. 2013, 40, 197–209. [Google Scholar] [CrossRef] [PubMed]
  58. Hwang, E.W.; Kim, K.A.; Park, S.C.; Jeong, M.J.; Byun, M.O.; Kwon, H.B. Expression Profiles of Hot Pepper (Capsicum annum) Genes under Cold Stress Condition. J. Biosci. 2005, 30, 657–667. [Google Scholar] [CrossRef]
  59. Wu, L.; Yu, M.; Holowachuk, J.; Sharpe, A.; Lydiate, D.; Hegedus, D.; Gruber, M. Evaluation of a Brassica napus auxin-repressed gene induced by flea beetle damage and Sclerotinia sclerotiorum infection. Am. J. Plant Sci. 2017, 8, 1921–1952. [Google Scholar] [CrossRef] [Green Version]
  60. Kavanagh, J.A.; Williams, P.H. Indole auxins in Plasmodiophora infected cabbage roots and hypocotyls. Trans. Br. Mycol. Soc. 1981, 77, 125–129. [Google Scholar] [CrossRef]
  61. Feng, J.; Hwang, S.F.; Strelkov, S.E. Studies into primary and secondary infection processes by Plasmodiophora brassicae on canola. Plant Path. 2013, 62, 177–183. [Google Scholar] [CrossRef]
  62. Cheng, F.; Liu, S.; Wu, J.; Fang, L.; Sun, S.; Liu, B.; Li, P.; Hua, W.; Wang, X. BRAD, the genetics and genomics database for Brassica plants. BMC Plant Biol. 2011, 11, 136. [Google Scholar] [CrossRef] [Green Version]
  63. Gasteiger, E.; Gattiker, A.; Hoogland, C.; Ivanyi, I.; Appel, R.D.; Bairoch, A. ExPASy—the proteomics server for in-depth protein knowledge and analysis. Nucleic Acids Res. 2003, 31, 3784–3788. [Google Scholar] [CrossRef] [Green Version]
  64. Saitou, N.; Nei, M. The neighbor-joining method: A new method for reconstructing phylogenetic trees. Mol. Biol. Evol. 1987, 4, 406–425. [Google Scholar] [PubMed]
  65. Kumar, S.; Stecher, G.; Li, M.; Knyaz, C.; Tamura, K. MEGA X: Molecular evolutionary genetics analysis across computing platforms. Mol. Biol. Evol. 2018, 35, 1547–1549. [Google Scholar] [CrossRef] [PubMed]
  66. Robin, A.H.K.; Yi, G.E.; Laila, R.; Yang, K.; Park, J.I.; Kim, H.R.; Nou, I.S. Expression profiling of glucosinolate biosynthetic genes in Brassica oleracea L. var. capitata inbred lines reveals their association with glucosinolate content. Molecules 2016, 21, 787. [Google Scholar] [CrossRef] [PubMed] [Green Version]
  67. Livak, K.J.; Schmittgen, T.D. Analysis of relative gene expression data using real-time quantitative PCR and the 2−ΔΔCT method. Methods 2001, 25, 402–408. [Google Scholar] [CrossRef] [PubMed]
Figure 1. Involvement of auxin in clubroot formation during the life cycle of Plasmodiophora brassicae (Robin et al. [9] after Dekhuijzen [10]; Müller and Hilgenberg [11]).
Ijms 21 05554 g001
Figure 2. Relative expression level differences in auxin-biosynthesis related genes between leaf and root samples: Each data point represents an average value of Seosan-inoculated plus mock-treated samples of all five time-points, i.e., an average of 30 samples. The letters “a” and “b” denote statistically significant differences between leaves and roots at the 5% level of significance. Vertical bars represent standard errors. Expression of genes in leaf tissues of control (nontreated) plants on day 0 were set to 1.
Ijms 21 05554 g002
Figure 3. Variation in relative expression levels of BrGH3 and BrDCK1 auxin-related genes in leaf and root samples under different treatment × time-point combinations in mock-treated and Seosan-inoculated plants: Data represent relative expression levels of three different treatment types—sample type (leaf vs. root), treatment (Seosan-inoculated vs. mock-treated), and time-points. Vertical bars represent standard deviation. Each data point estimates the average of three independent biological replicates. Data bars separated by different letters indicate 5% statistical significance level according to Tukey’s pairwise comparisons. Expression of genes in leaf tissues of control (nontreated) plants on day 0 were set to 1.
Ijms 21 05554 g003
Figure 4. Fold changes in relative expression levels of auxin-related genes in Seosan-inoculated plants compared to mock-treated leaf and root samples at the same time point: Blue and red colors represent upregulation and downregulation of genes, respectively.
Ijms 21 05554 g004
Figure 5. Variation in relative expression levels of auxin-related genes BrIAA and BrRACK1 genes in leaf and root samples under different treatment × time point combinations: Data represent relative expression levels of three different treatment types—sample type (leaf vs. root), treatment (Seosan-inoculated vs. mock-treated), and time-points. Vertical bars represent standard deviation. Each data point estimates the average of three independent biological replicates. Data bars separated by different letters indicate 5% statistical significance level according to Tukey’s pairwise comparisons. Expression of genes in leaf tissues of control (nontreated) plants on day 0 were set to 1.
Ijms 21 05554 g005
Figure 6. Variation in the relative expression levels of auxin-related genes BrNIT and BrSAUR genes in leaf and root samples under different treatment × time-point combinations: Data represent relative expression levels of three different treatment types—sample type (leaf vs. root), treatment (Seosan-inoculated vs. mock-treated), and time-points. Vertical bars represent standard deviation. Each data point estimates the average of three independent biological replicates. Data bars separated by different letters indicate the 5% statistical significance level according to Tukey’s pairwise comparisons. Expression of genes in leaf tissues of control (nontreated) plants on day 0 were set to 1.
Ijms 21 05554 g006
Figure 7. Variation in the relative expression levels of other auxin-related genes in leaf and root samples under different treatment × time-point combinations: Data represent relative expression levels of three different treatment types—sample type (leaf vs. root), treatment (Seosan-inoculated vs. mock-treated), and time-points. Vertical bars represent standard deviation. Each data point estimates the average of three independent biological replicates. Data bars separated by different letters indicate the 5% statistical significance level according to Tukey’s pairwise comparisons. Expression of genes in leaf tissues of control (nontreated) plants on day 0 were set to 1.
Ijms 21 05554 g007
Figure 8. Relative between expression levels of auxin signaling, receptor, transporter, and repressed genes in this study (red color) and auxin contents in the published reports at the adjacent time-points, in Arabidopsis thaliana and Brassica spp. dpi, days post inoculation: Green color represents the dpi at which samples were collected. Upwards- and downwards-pointing arrows represent increase and decrease (blue text) in transcript abundance of genes or auxin accumulation, respectively, in clubroot-infected plants compared to non-inoculated plants.
Ijms 21 05554 g008
Figure 9. Nontreated (A) and Seosan-inoculated plants (B) of Chinese cabbage cultivar “Bullam-3-ho” at 35 days after inoculation of the “Seosan” isolate of P. brassicae.
Ijms 21 05554 g009
Table 1. Properties of genes involved in auxin metabolism, signaling, and transport in Brassica rapa. St., strand; aa, amino acid; Pi, isoelectric point, MW, molecular weight. ‘+’ indicates 5’-3’ direction and ‘-‘ indicates 3’-5’ direction of DNA.
Gene NameBRAD IDChromosomal LocationStart CodonStop CodonSt.Gene Identity(aa)PiMW (kDa)Subcellular Localization
BrDCK1Bra008038A021176354011765539Receptor kinase4479.0650.44Cell membrane
BrDCK1.1Bra016050A072296011522961810Protein kinase4519.2450.77Cell membrane
BrDCK1.2Bra003875A071877948318780917+3968.7444.61Cell membrane
BrLAX1Bra008325A021373234713734803Auxin efflux carrier/
Transporter
4728.9553.53Cell membrane
BrLAX1.1Bra003674A071766882517671143+4718.8653.45Cell membrane
BrPIN1Bra015983A072323426423237329+6189.1466.82Cell membrane
BrPIN1.1Bra008105A021215407612156932+6169.1066.61Cell membrane
BrPILS1Bra014265A08210104521030204319.2646.66Lysosome
BrPILS1.1Bra030441A051132960111331470+4238.8646.08Cell membrane
BrRACK1Bra032261A051230473412306049+Receptor C kinase3276.3135.70Nucleus
BrRACK1.1Bra018745A0622346072235718+2986.0632.47Nucleus
BrRACK1.2Bra022282A051937151219372720+3257.5935.46Nucleus
BrRACK1.3Bra021294A012189978921900926+3268.3335.58Nucleus
BrGH3.1Bra039186A093315363433155891+Auxin-responsive GH3
(auxin signaling)
5966.2867.77Cytoplasm
BrGH3.2Bra008833A1012836737128392055947.8167.08Cytoplasm
BrGH3.3Bra041046Scaffold000414273848325875.9866.03Cytoplasm
BrGH3.31Bra023405A0222182152221058+5955.8067.02Cytoplasm
BrGH3.4Bra034205A09127196012746176106.2868.54Cytoplasm
BrGH3.41Bra013086A0320567114205693055575.4362.48Cytoplasm
BrGH3.5Bra019060A032654102426543324+6125.9869.39Cytoplasm
BrGH3.51Bra026365A0195601549562651+6126.0569.36Cytoplasm
BrGH3.52Bra022725A0267526406754845+6125.8769.09Cytoplasm
BrGH3.53Bra029023A0359311125933213+6085.7468.63Cytoplasm
BrIAA1Bra039855A0863036776305559Auxin signaling2338.6825.85Nucleus
BrIAA2Bra033886A0515764615157665432428.7826.43Nucleus
BrIAA2.1Bra001900A031926330119265148+2378.5426.16Nucleus
BrIAA3Bra001634A031762466817625966Phytochrome
-associated
2727.6830.43Nucleus
BrIAA3.1Bra021184A012267613422677514+2699.2030.28Nucleus
BrIAA4Bra009867A061839978118400911+Auxin signaling1768.8020.33Nucleus
BrIAA4.1Bra036557A09281541628165431759.2420.00Cytoplasm
BrIAA5Bra032521A093819123438191967+Transcriptional regulator1805.1120.36Cytoplasm
BrIAA5.1Bra015297A1021371042137826+1865.3121.10Cytoplasm
BrSAUR1Bra011560A0116809481681271+Auxin-responsive protein (auxin signaling)1076.8212.11Mitochondrion
BrSAUR1.1Bra034651A081148851411488828+1048.6012.03Mitochondrion
BrSAUR1.2Bra017676A0329740606297409291076.8212.14Mitochondrion
BrSAUR1.3Bra013061A0320715121207154471087.7312.36Mitochondrion
BrSAUR2Bra039345Scaffold00016428744291451339.0315.34Mitochondrion
BrSAUR3Bra039264A041896211218962471+1197.8113.67Cell membrane
BrSAUR3.1Bra004515A055605735609411228.7914.06Cell membrane
BrSAUR4Bra014476A0488224488275617010.9619.75Mitochondrion
BrNIT1Bra028932A0354677275469454Auxin biosynthesis3435.5437.73Cytoplasm
BrNIT1.1Bra021681A041393490113936735+3505.4838.48Cytoplasm
BrNIT2Bra020184A0244174724419242+3575.3038.94Cytoplasm
BrARG10-likeBra026348A0196595819660796Auxin responsive2505.5227.55Cytoplasm
BrARG10-like1Bra010404A081357960313580693+2506.0727.49Cytoplasm
BrARP1Bra013191A031998204619983742+Auxin repressed protein4039.7043.86Cell membrane
Table 2. Analysis of variance for relative expression levels of 23 auxin-biosynthesis related genes in two different sample types (leaf vs. root—LvR) at five different time-points (Tm) (1, 3, 14, 28, and 35 days after inoculation) under two different treatments (Tr, mock-treatment vs. inoculation with Seosan-isolate of P. brassicae) in Chinese cabbage cultivar “Bullam-3-ho”.
Sources of Variation dfGenesMSF Statisticp ValueGenesMSF Statisticp ValueGenesMSF Statisticp Value
Time-point 4BrGH3.12.6883.2< 0.01BrIAA41.0163.4< 0.01BrDCK1132.776.3< 0.01
Treatment 1 0.9429.2< 0.01 1.2880.2< 0.01 22.112.7< 0.01
Tm × Tr4 1.3441.8< 0.01 1.3584.5< 0.01 28.516.4< 0.01
LvR (Tm Tr)10 1.2137.7< 0.01 2.14134.3< 0.01 265152.9< 0.01
Error40 0.032 0.016 1.74
Time-point 4BrGH3.2151919.8< 0.01BrIAA515.571.7< 0.01BrRACK111.6769.7< 0.01
Treatment 1 216928.2< 0.01 1.145.280.027 0.1160.700.409
Tm × Tr4 118415.4< 0.01 16.777.3< 0.01 1.116.66< 0.01
LvR (Tm Tr)10 140818.3< 0.01 14.265.9< 0.01 8.0648.2< 0.01
Error40 76.8 0.22 0.167
Time-point 4BrGH3.34,699,1142767< 0.01BrSAUR10.268406.6< 0.01BrLAX114.2128.2< 0.01
Treatment 1 1,822,1771073< 0.01 0.345522.1< 0.01 3.5231.7< 0.01
Tm × Tr4 4,623,0512723< 0.01 0.533805.8< 0.01 0.807.24< 0.01
LvR (Tm Tr)10 6,320,8273723< 0.01 0.505765.3< 0.01 9.1282.2< 0.01
Error40 1698 0.0007 0.11
Time-point 4BrGH3.41978.9582.8< 0.01BrSAUR23.5646.24< 0.01BrARP10.726158< 0.01
Treatment 1 54.8317.0< 0.01 3.6347.22< 0.01 0.42291.8< 0.01
Tm × Tr4 161.850.2< 0.01 2.9338.03< 0.01 0.24352.9< 0.01
LvR (Tm Tr)10 1369.7424.8< 0.01 5.6172.92< 0.01 0.36880.1< 0.01
Error40 3.22 0.077 0.004
Time-point 4BrGH3.5396.072.82< 0.01BrSAUR34.84355.6< 0.01BrARG52.95741.5< 0.01
Treatment 1 71.813.21< 0.01 3.37247.5< 0.01 2.6236.6< 0.01
Tm × Tr4 215.839.69< 0.01 2.06151.0< 0.01 26.39369.6< 0.01
LvR (Tm Tr)10 357.965.82< 0.01 2.96218.0< 0.01 65.54917.8< 0.01
Error40 5.44 0.013 0.071
Time-point 4BrIAA1200.9192.5< 0.01BrSAUR40.518121.1< 0.01BrPIN1260.113.2< 0.01
Treatment 1 76.1873.0< 0.01 0.05713.44< 0.01 298.815.1< 0.01
Tm × Tr4 213.8204.8< 0.01 0.12128.35< 0.01 168.58.54< 0.01
LvR (Tm Tr)10 266.2255.1< 0.01 0.857200.5< 0.01 206.010.4< 0.01
Error40 1.04 0.004 19.7
Time-point 4BrIAA20.01712.15< 0.01BrNIT114844165.8< 0.01BrPILS10.969233.9< 0.01
Treatment 1 0.0139.57< 0.01 9378104.8< 0.01 0.789190.5< 0.01
Tm × Tr4 0.173120.9< 0.01 606467.7< 0.01 0.695167.6< 0.01
LvR (Tm Tr)10 0.12990.6< 0.01 15511173.3< 0.01 0.584140.9< 0.01
Error40 0.0014 89.5 0.004
Time-point 4BrIAA347.3632.4< 0.01BrNIT21.5522.95< 0.01
Treatment 1 8.28110.7< 0.01 0.8512.67< 0.01
Tm × Tr4 8.16109.2< 0.01 1.0515.52< 0.01
LvR (Tm Tr)10 40.1535.5< 0.01 2.7841.08< 0.01
Error40 0.075 0.067
Table 3. Leaf and root samples collected from Seosan-inoculated and mock-treated plants at five different time points under two different treatments.
Sample IDTime PointTreatmentSample Type
1Day 1MockLeaf
2Day 1MockRoot
3Day 1Seosan-inoculatedLeaf
4Day 1Seosan-inoculatedRoot
5Day 3MockLeaf
6Day 3MockRoot
7Day 3Seosan-inoculatedLeaf
8Day 3Seosan-inoculatedRoot
9Day 14MockLeaf
10Day 14MockRoot
11Day 14Seosan-inoculatedLeaf
12Day 14Seosan-inoculatedRoot
13Day 28MockLeaf
14Day 28MockRoot
15Day 28Seosan-inoculatedLeaf
16Day 28Seosan-inoculatedRoot
17Day 35MockLeaf
18Day 35MockRoot
19Day 35Seosan-inoculatedLeaf
20Day 35Seosan-inoculatedRoot
Table 4. List of primer sequences used for qRT-PCR of auxin-related genes.
Arabidopsis Homolog (Accession Number)Gene NameBRAD IDcDNA Size (bp)Primer Forward (F) and Reverse(R)Product Size (bp)
At2g23170BrGH3.1Bra0391861791AAGGACTTGAAAGCTCTCAG156
CTTAAATGTTTTCCGGTCGG
At1g72540BrDCK1Bra0080381344ATCCAGACAAACCTCTGTTC177
AATCCTCCTTCACCGAGATA
At5g13360BrGH3.2Bra0088331758AGTGAGACAGCCTCTAGAAT177
TCGTTGTATAAGCCCACAAA
At4g34760BrSAUR1Bra011560324TTCCACTCGATGTACCAAAG197
TGAGGTTAGGGTCTGAAAGA
At1g77690BrLAX1Bra0083251419CTGTGGAGATAATGCATGCCA161
GAGTAGAGAGAGTGCATTGG
At1g73590BrPIN1Bra0159831857GGAAACAGAAAAGCAGCATT187
GAGTAGAGAGAGTGCATTGG
At1g48630BrRACK1Bra032261984ACATGATCGTCACTTCTTCC243
AGAGAACGTCTTTCGTGTGT
At3g12830BrSAUR2Bra039345402GAATCTTTCCTCCGGTCTTC187
TTTGCTCGTAACCATACTCC
At3g44300BrNIT1Bra0289321032GAATCAGAGGGTCTCATCAC151
TCGAAACGAATGTAACTGGT
At5g22300BrNIT2Bra0201841074GCAAGTATCTTGCTTCTGCT157
TGACCATGTGAGTCAAAGAA
At5g01990BrPILS1Bra0142651296GAAGCAAATCATCCAACCTG167
GTGCCAGTAATATACAGGGG
At1g59500BrGH3.3Bra0410461764TAAGCTTCCTCCAGAACAAC157
GAGCAAACCTCTACCAAGAA
At4g14550BrIAA1Bra039855702CTCTACCAAAGAAGGATCCG163
TTCGCTACACTTCTGATGAG
At4g03400BrGH3.4Bra0342051833ATGTTGAAGAGATGGACGAC208
CTATGGCAAGTAAACGGAAC
At3g23050BrIAA2Bra033886729AGCTGCATTGGTTAAGGTAT184
CAGATCCATTAGCTTGCTCT
At4g27260BrGH3.5Bra0190601839AAGAACGTGATGCCTGTTAT183
TGATCTCCGGTCTAGTTCTT
At4g27450BrARG10-likeBra026348753CTCTGACAACACTTTCTCCA175
GGTCAGACCATATTGCTTG
At3g16500BrIAA3Bra001634819GAGGTCAAGTCAACAAGAGT171
CTCTGAAGAGTTGGTCTACG
At2g04850BrARP1Bra0131911212GAATGTGTTCCAAGGGTTTG189
CTGCTGCATCTATCATCAGT
At2g46690BrSAUR3Bra039264360GCTCTGAAAGGCTTCCATTTAC222
AACGTCGCATGGAATTGTGATG
At5g25890BrIAA4Bra009867531TTCGTCGGATCTAAACAGAC167
CCTTGCAGTTCTTTCTAGGT
At1g04240BrIAA5Bra032521543ATCCCCTCCTAGAAAGACTC152
TTTTCCTCAAGTATGGTGCA
At3g60690BrSAUR4Bra014476513ATACCAATTGGGAAGGAACC172
CAAACTCTTCCTCTGCTTCT
XM_009147610.2ACTIN1 1371F: CAACCAATCGTCTGTGACAA105
R: ATGTCTTGGCCTACCAACAA
FJ969844.1ACTIN2 491F: AATGGTACCGGAATGGTCAA119
R: TCCTTCTGGTTCATCCCAAC

