Article

Two Clubroot-Resistance Genes, Rcr3 and Rcr9wa, Mapped in Brassica rapa Using Bulk Segregant RNA Sequencing

1
Agriculture and Agri-Food Canada, Saskatoon Research and Development Centre, 107 Science Place, Saskatoon, SK S7N OX2, Canada
2
Department of Agricultural, Food and Nutritional Science, University of Alberta, Edmonton, AB T6G 2P5, Canada
*
Author to whom correspondence should be addressed.
Int. J. Mol. Sci. 2020, 21(14), 5033; https://doi.org/10.3390/ijms21145033
Submission received: 22 June 2020 / Revised: 13 July 2020 / Accepted: 14 July 2020 / Published: 16 July 2020
(This article belongs to the Section Molecular Plant Sciences)

Abstract

:
Genetic resistance is widely used to manage clubroot (Plasmodiophora brassicae) in brassica crops, but new pathotypes have recently been identified on canola (Brassica napus) on the Canadian prairies. Resistance effective against both the most prevalent pathotype (3H, based on the Canadian Clubroot Differential system) and the new pathotypes is needed. BC1 plants of Brassica rapa from a cross of line 96-6990-2 (clubroot resistance originating from turnip cultivar ‘Waaslander’) and a susceptible doubled-haploid line, ACDC, exhibited a 1:1 segregation for resistance against pathotypes 3H and 5X. A resistance gene designated as Rcr3 was mapped initially based on the percentage of polymorphic variants using bulked segregant RNA sequencing (BSR-Seq) and further mapped using Kompetitive Allele Specific PCR. DNA variants were identified by assembling short reads against a reference genome of B. rapa. Rcr3 was mapped into chromosome A08. It was flanked by single nucleotide polymorphisms (SNP) markers (A90_A08_SNP_M12 and M16) between 10.00 and 10.23 Mb, in an interval of 231.6 Kb. There were 32 genes in the Rcr3 interval. Three genes (Bra020951, Bra020974, and Bra020979) were annotated with disease resistance mechanisms, which are potential candidates for Rcr3. Another resistance gene, designated as Rcr9wa, for resistance to pathotype 5X was mapped, with the flanking markers (A90_A08_SNP_M28 and M79) between 10.85 and 11.17 Mb using the SNP sites identified through BSR-Seq for Rcr3. There were 44 genes in the Rcr9wa interval, three of which (Bra020827, Bra020828, Bra020814) were annotated as immune-system-process related genes, which are potential candidates for Rcr9wa.

1. Introduction

Clubroot, caused by Plasmodiophora brassicae Woronin, is a soil-borne disease of brassica crops that causes around 15% annual yield loss worldwide [1]. Integration of practices such as liming and early spring seeding can reduce clubroot levels, but is often not economical for large-scale canola production [2,3,4,5].
Clubroot is an emerging threat to canola production across the northern Great Plains of North America [6,7,8,9,10]. Identifying genetic resistance for use in resistant cultivars could be an effective strategy for clubroot management in canola [11,12]. Clubroot resistance (CR) is usually not durable [13], so monitoring to identify shifts in the virulence of the P. brassicae population is important [14].
The pathogen recognition systems that provide strong resistance in plants generally function in one of two ways. In one system, a pattern recognition receptor (PRR) in the plant interacts with a microbial/pathogen-associated molecular pattern (MAMP, PAMP) from the pathogen inside the apoplast, resulting in PAMP-triggered immunity (PTI). In the other system, a R gene encoded NBS-LRR (nucleotide-binding site leucine-rich repeat) protein in the plant interacts with an effector from the pathogen, usually inside the cytoplast, resulting in effector-triggered immunity (ETI) [15]. The NBS-LRR protein family can be subdivided according to their functional domain as toll/interleukin-1 receptor (TIR)-domain-containing (TIR-NBS-LRR protein) and coiled-coil (CC)-domain-containing (CC-NBS-LRR protein) subfamilies [16]. NBS-LRR related disease resistance is effective against obligate and hemibiotrophic pathogens [17].
Brassica rapa ssp. rapifera has been the sole source of resistance to clubroot in commercial cultivars of B. rapa, B. napus, and B. oleracea [18,19,20,21]. Across all Brassica spp., at least 15 CR loci from B. rapa, 22 quantitative trait loci (QTLs) from B. oleracea, and 16 QTLs from B. napus have been identified [21,22,23,24]. In B. rapa, chromosome A03 carried the highest number of loci, including CRa [25,26,27], CRb [28], Crr3 [29,30], CRk [31], PbBa3.1 and PbBa3.3 [32], Rcr1 [33], Rcr2 [34], Rcr4 [24], and Rcr5 [35]. Another four chromosomes were identified as carrying CR loci: Crr1 [36], Rcr9 [24], and CRs [37] on A08; Crr2 on A01 [38]; Crr4 on A06 [38]; and CRc [31] and Rcr8 on A02 [24]. Crr1 was demonstrated to consist of two gene loci; the major locus, Crr1a, and the minor locus, Crr1b [39,40]. Crr1a is expressed as a TIR-NB-LRR disease resistance protein in the stele and roots, and was shown to have originated from the European fodder turnip ‘Siloga’ [40]. The CR genes CRa and CRbkato also encode TIR-NB-LRR class proteins [23,40,41,42]. Recently, several new sources of CR have been identified [11,43,44]. Additionally, resistance locus CRs, resistant to a Korean isolate of P. brassicae, was recently reported from turnip line SCNU-T2016 on chromosome A08 (10.7–11.5 Mb). Two genes, Bra020918 and Bra020876, were reported as candidate genes for CRs [37].
Pathotype 5X was the first pathotype identified that overcame resistance in the first generation of CR canola cultivars in Canada [14], although many more resistance-breaking pathotypes have subsequently been identified [45]. Studies to identify sources of resistance to pathotype 5X identified two independent QTLs, Rcr8 and Rc9, in the A genome on chromosomes A02 and A08 [24]. In addition, a single dominant gene, Rcr7, was identified that provided resistance to pathotypes 3H and 5X in the C genome on chromosome C07, which was homologous to a region on the A03 chromosome [46].
In several cases, a modifier gene has been reported to increase the efficacy of a dominant CR gene against a virulent pathotype. For example, Crr1 alone provided resistance to a moderately aggressive field collection [36], but resistance against a more aggressive field collection required the presence of the modifier locus Crr2 [38]. Enhancers and locus control regions are occasionally located away from candidate genes, with the result that communications may occur via histone modification or intra- and inter-chromosomal loops [47]. Such unusual relationships can complicate use of marker-assisted selection for CR genes.
Next-generation sequencing (NGS) technology is being used to accelerate conventional breeding [48,49]. For example, high-throughput, sequence-based, single-nucleotide polymorphism (SNP) markers have largely replaced PCR and hybridization-based markers in the last decade [50]. SNPs are the most frequent and the most abundant DNA sequence variant type in plant genomes, human genomes, and other organisms [51,52].
The advantage of RNA sequencing (RNA-Seq) over other NGS technologies is that RNA-Seq can be applied to both genetic mapping and expression analysis [53]. RNA-Seq also identifies higher numbers of functional variants from coding regions [54,55]. Coding sequences represent only 1–2% of the genome [56], making downstream data handling and analysis of RNA much easier than with DNA. Recently, RNA-Seq has been used to identify functional variants related to disease resistance [35,56,57]. Bulk-segregant analysis (BSA) identifies differences between two distinct characters. Using BSA together with RNA-Seq (BSR-Seq) provides an efficient approach for the identification of differential gene expression and a high-density of SNP markers for gene mapping and marker-assisted selection (MAS) [35,46].
A B. rapa line that was resistant to several pathotypes of P. brassicae but genetically distant from genotypes known to carry the major CR gene Rcr1 was selected as the focus of the current study. The objectives of the study were to (1) map the CR gene(s) in the B. rapa line using BSR-Seq through analysis of percentage of polymorphic variants (PPV) described by Dakouri et al. [46], (2) use genome-wide DNA variant analysis to identify SNP markers for MAS, and (3) identify the most probable candidate gene(s) responsible for the resistance in the B. rapa line.

2. Results

2.1. Inheritance of CR in B. rapa Line 96-6990-2

The clubroot reaction of the parental lines, F1 and BC1 population were tested based on inoculation with each of two pathotypes of P. brassicae, representing pathotypes 3 or H (3H) and 5 or X (5X), respectively, as classified on the differentials of Williams’ (1966) or the Canadian Clubroot Differential Set [45] under controlled conditions using the ratings of 0–3 (Figure 1). Each plant of 96-6990-2 was resistant to pathotype 3H and each plant of ACDC was susceptible (Table 1). Each of the F1 plants (derived from reciprocal crosses) was also highly resistant. Segregation for resistant (R) and susceptible (S) reaction in the BC1 population was consistent with an expected ratio of 1:1 (Table 1). The same pattern of results in the parental lines, F1 and BC1 population was obtained with inoculation with pathotype 5X (Table 1). These results indicated that the resistance in 96-6990-2 to pathotype 3H was associated with a single dominant nuclear gene (designated as Rcr3) and 96-6990-2 was homozygous at the Rcr3 locus. Similarly, resistance to pathotype 5X was also conferred by a single dominant gene (designated as Rcr9wa), which was homozygous in 96-6990-2.

2.2. RNA-Seq and Assembling Short Reads from BRS-Seq for Resistance to Pathotype 3H

In total, MiSeq produced 122.3 million (M) reads, with a mean of 20.4 M reads per biological replicate. From the bulked samples sequence, 50.2–55.4% reads in the R bulk with 107.5 M reads and 44.1–49.1% reads in the S bulk with 97.1 M were assembled into the chromosomes of the B. rapa ‘Chiifu’ reference genome v1.5 [58] (Supplementary Table S1, Table 2). Total sequence data yielded 18.95 Gb per biological replicate, with a mean yield of 6.32 Gb. Mean depth of coverage was 31.4-fold for the R bulk and 28.4-fold for the S bulk. A similar number of reads were assembled against the top and bottom strands of the reference genome using the pooled sample assembly method [57] (Table 2).

2.3. Mapping Rcr3 for Resistance to Pathotype 3H Using PPV

In total, 654.1 K variants were identified in the R bulks and 637.7 K variants in the S bulks compared with the reference genome at Q-call ≥15 and depth ≥5 (Table 3). The R and S bulks contained 585.8 K and 571.0 K SNPs, and 68.3 K and 66.6 K InDels, respectively. The number of variants identified per chromosome in R and S bulk were positively correlated with chromosome length (r = 0.83 and 0.81).
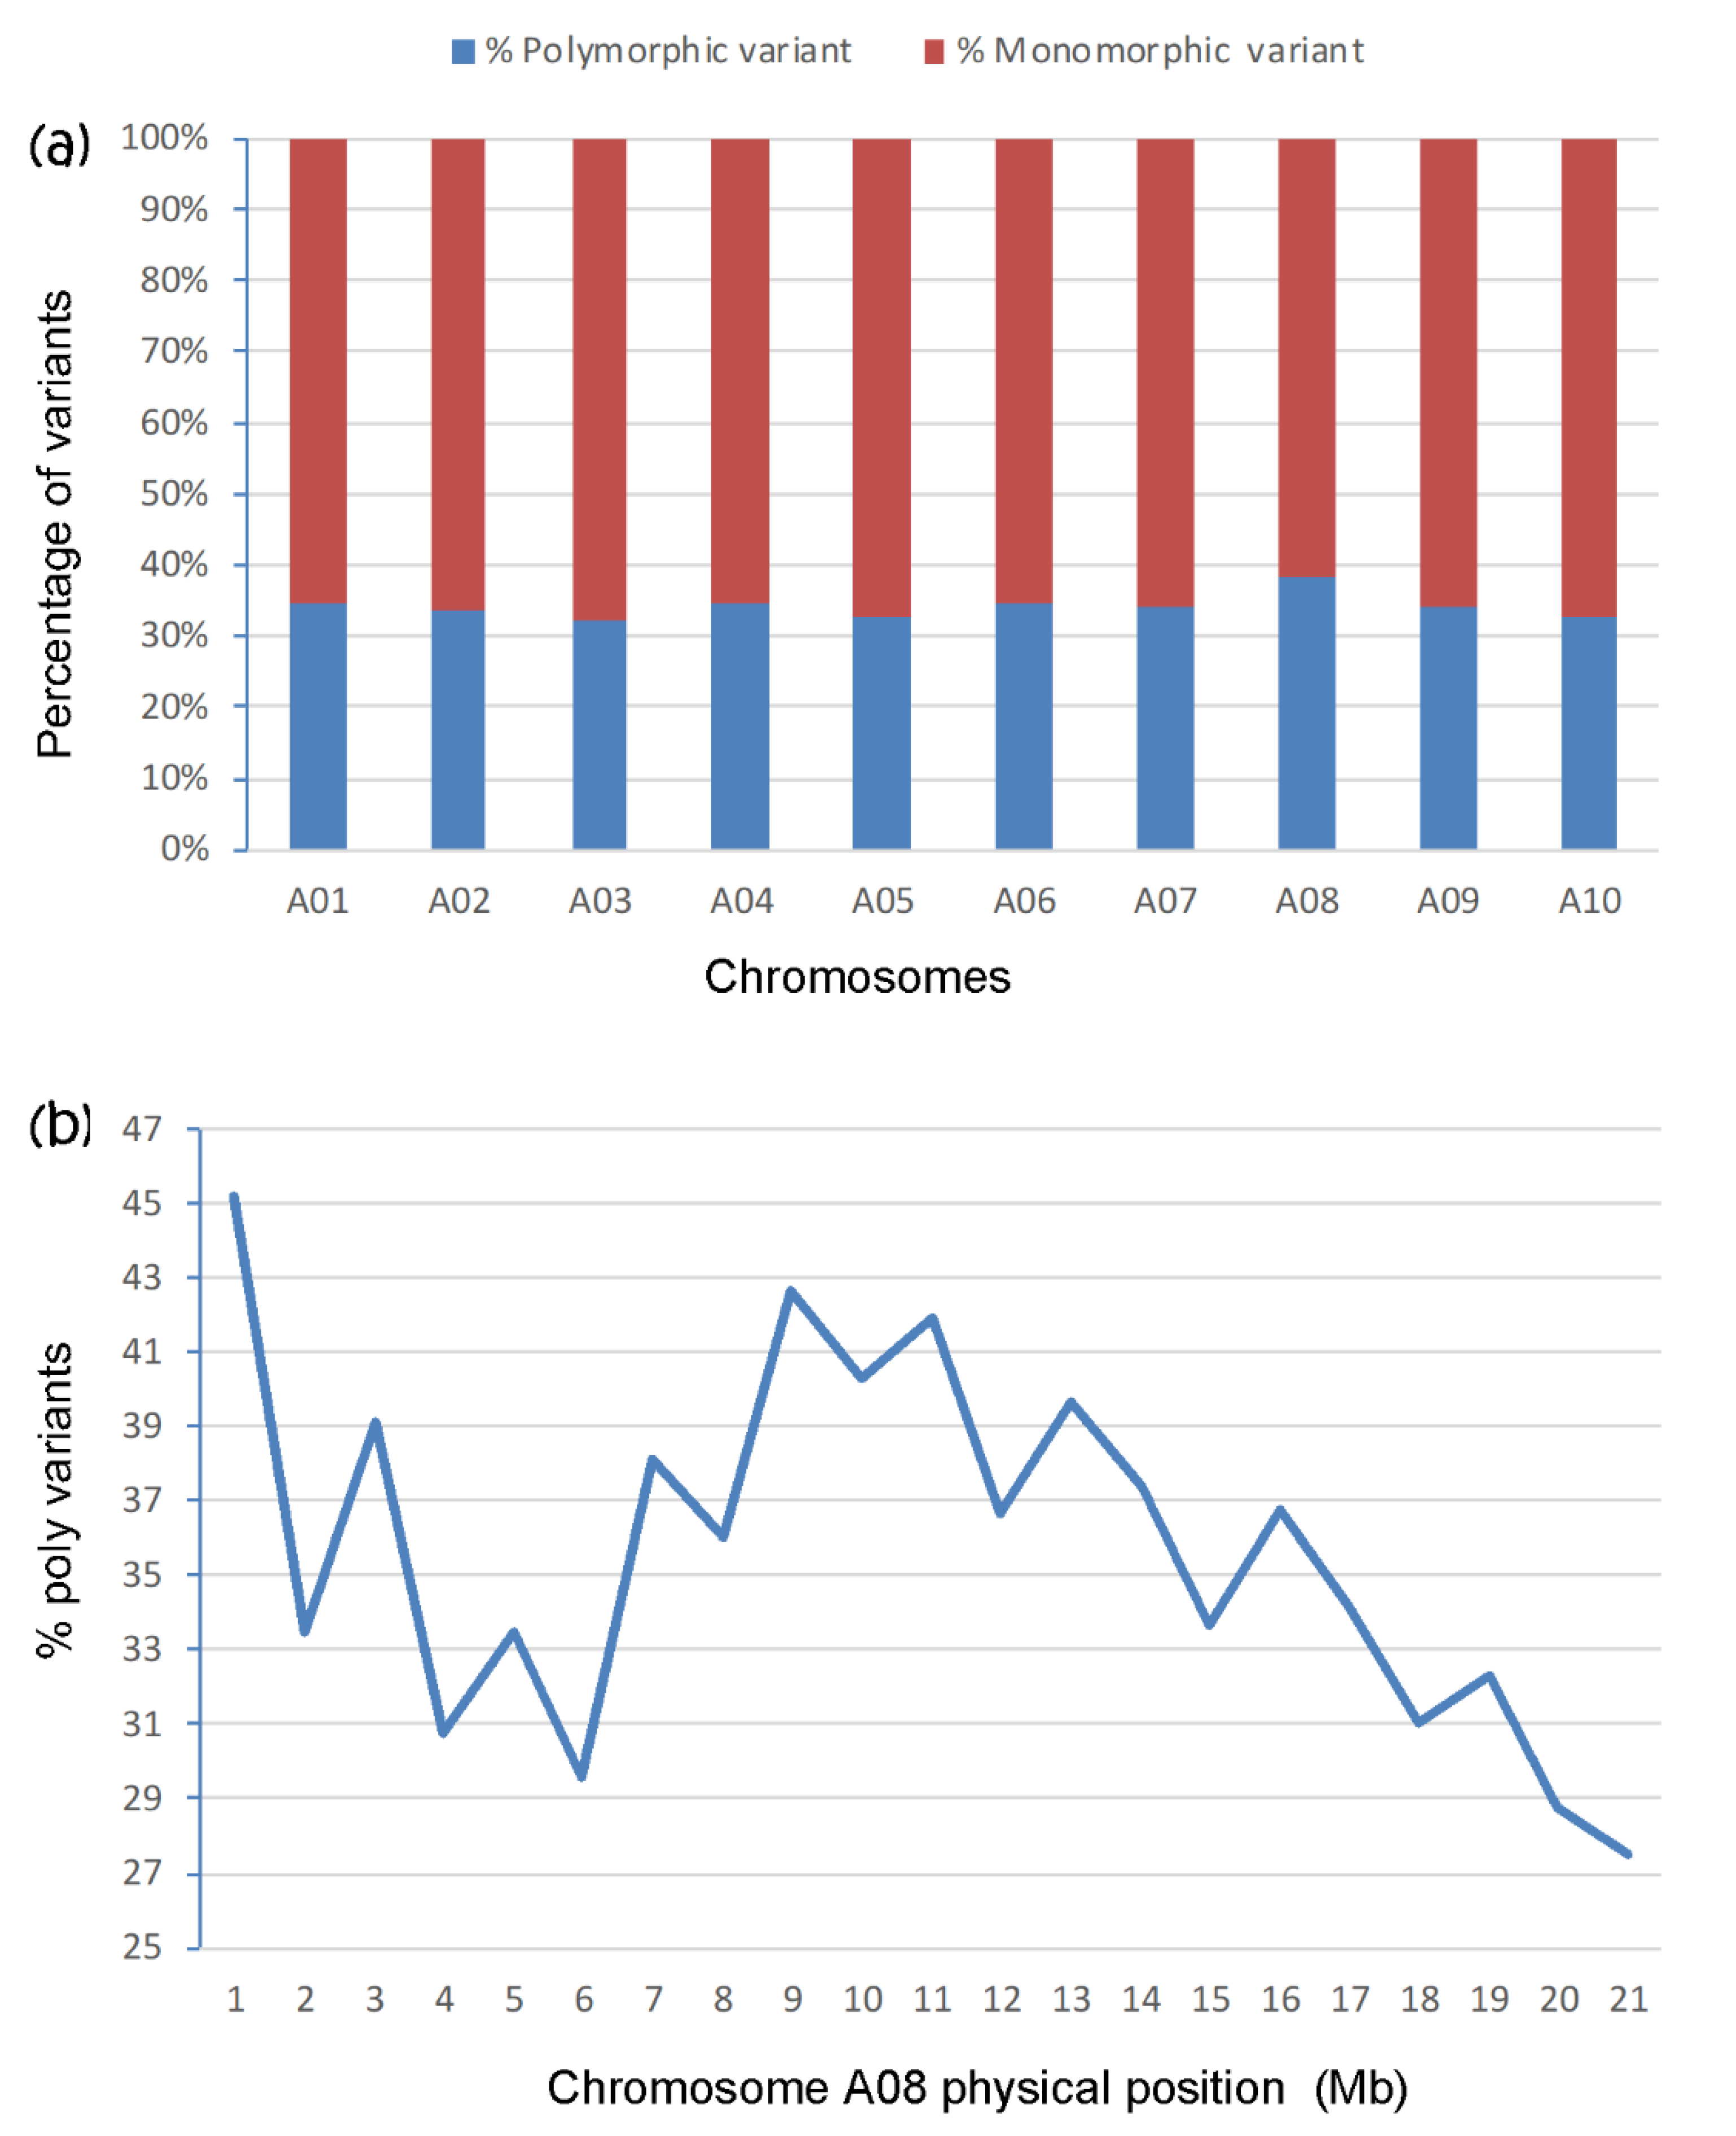
The highest PPV (38.2%) and the lowest percentage of monomorphic variants (61.8%) were identified on chromosome A08 (Figure 2a); the range for the other chromosomes was 32.3–34.6% for polymorphic variants and 65.4–67.7% for monomorphic variants. Chromosome A08 carried the highest PPV relative to the other chromosomes. This indicated that Rcr3 likely resided on A08. To locate the CR on A08, the distribution of PPV on the chromosome was analyzed. Two peaks of poly variants were observed; at 0–1 Mb (45.2%) and at 8–11 Mb (40.3–42.7%), providing two candidate genomic regions for Rcr3 (Figure 2b).

2.4. Mapping of Rcr3 Though Kompetitive Allele Specific PCR (KASP) Analysis

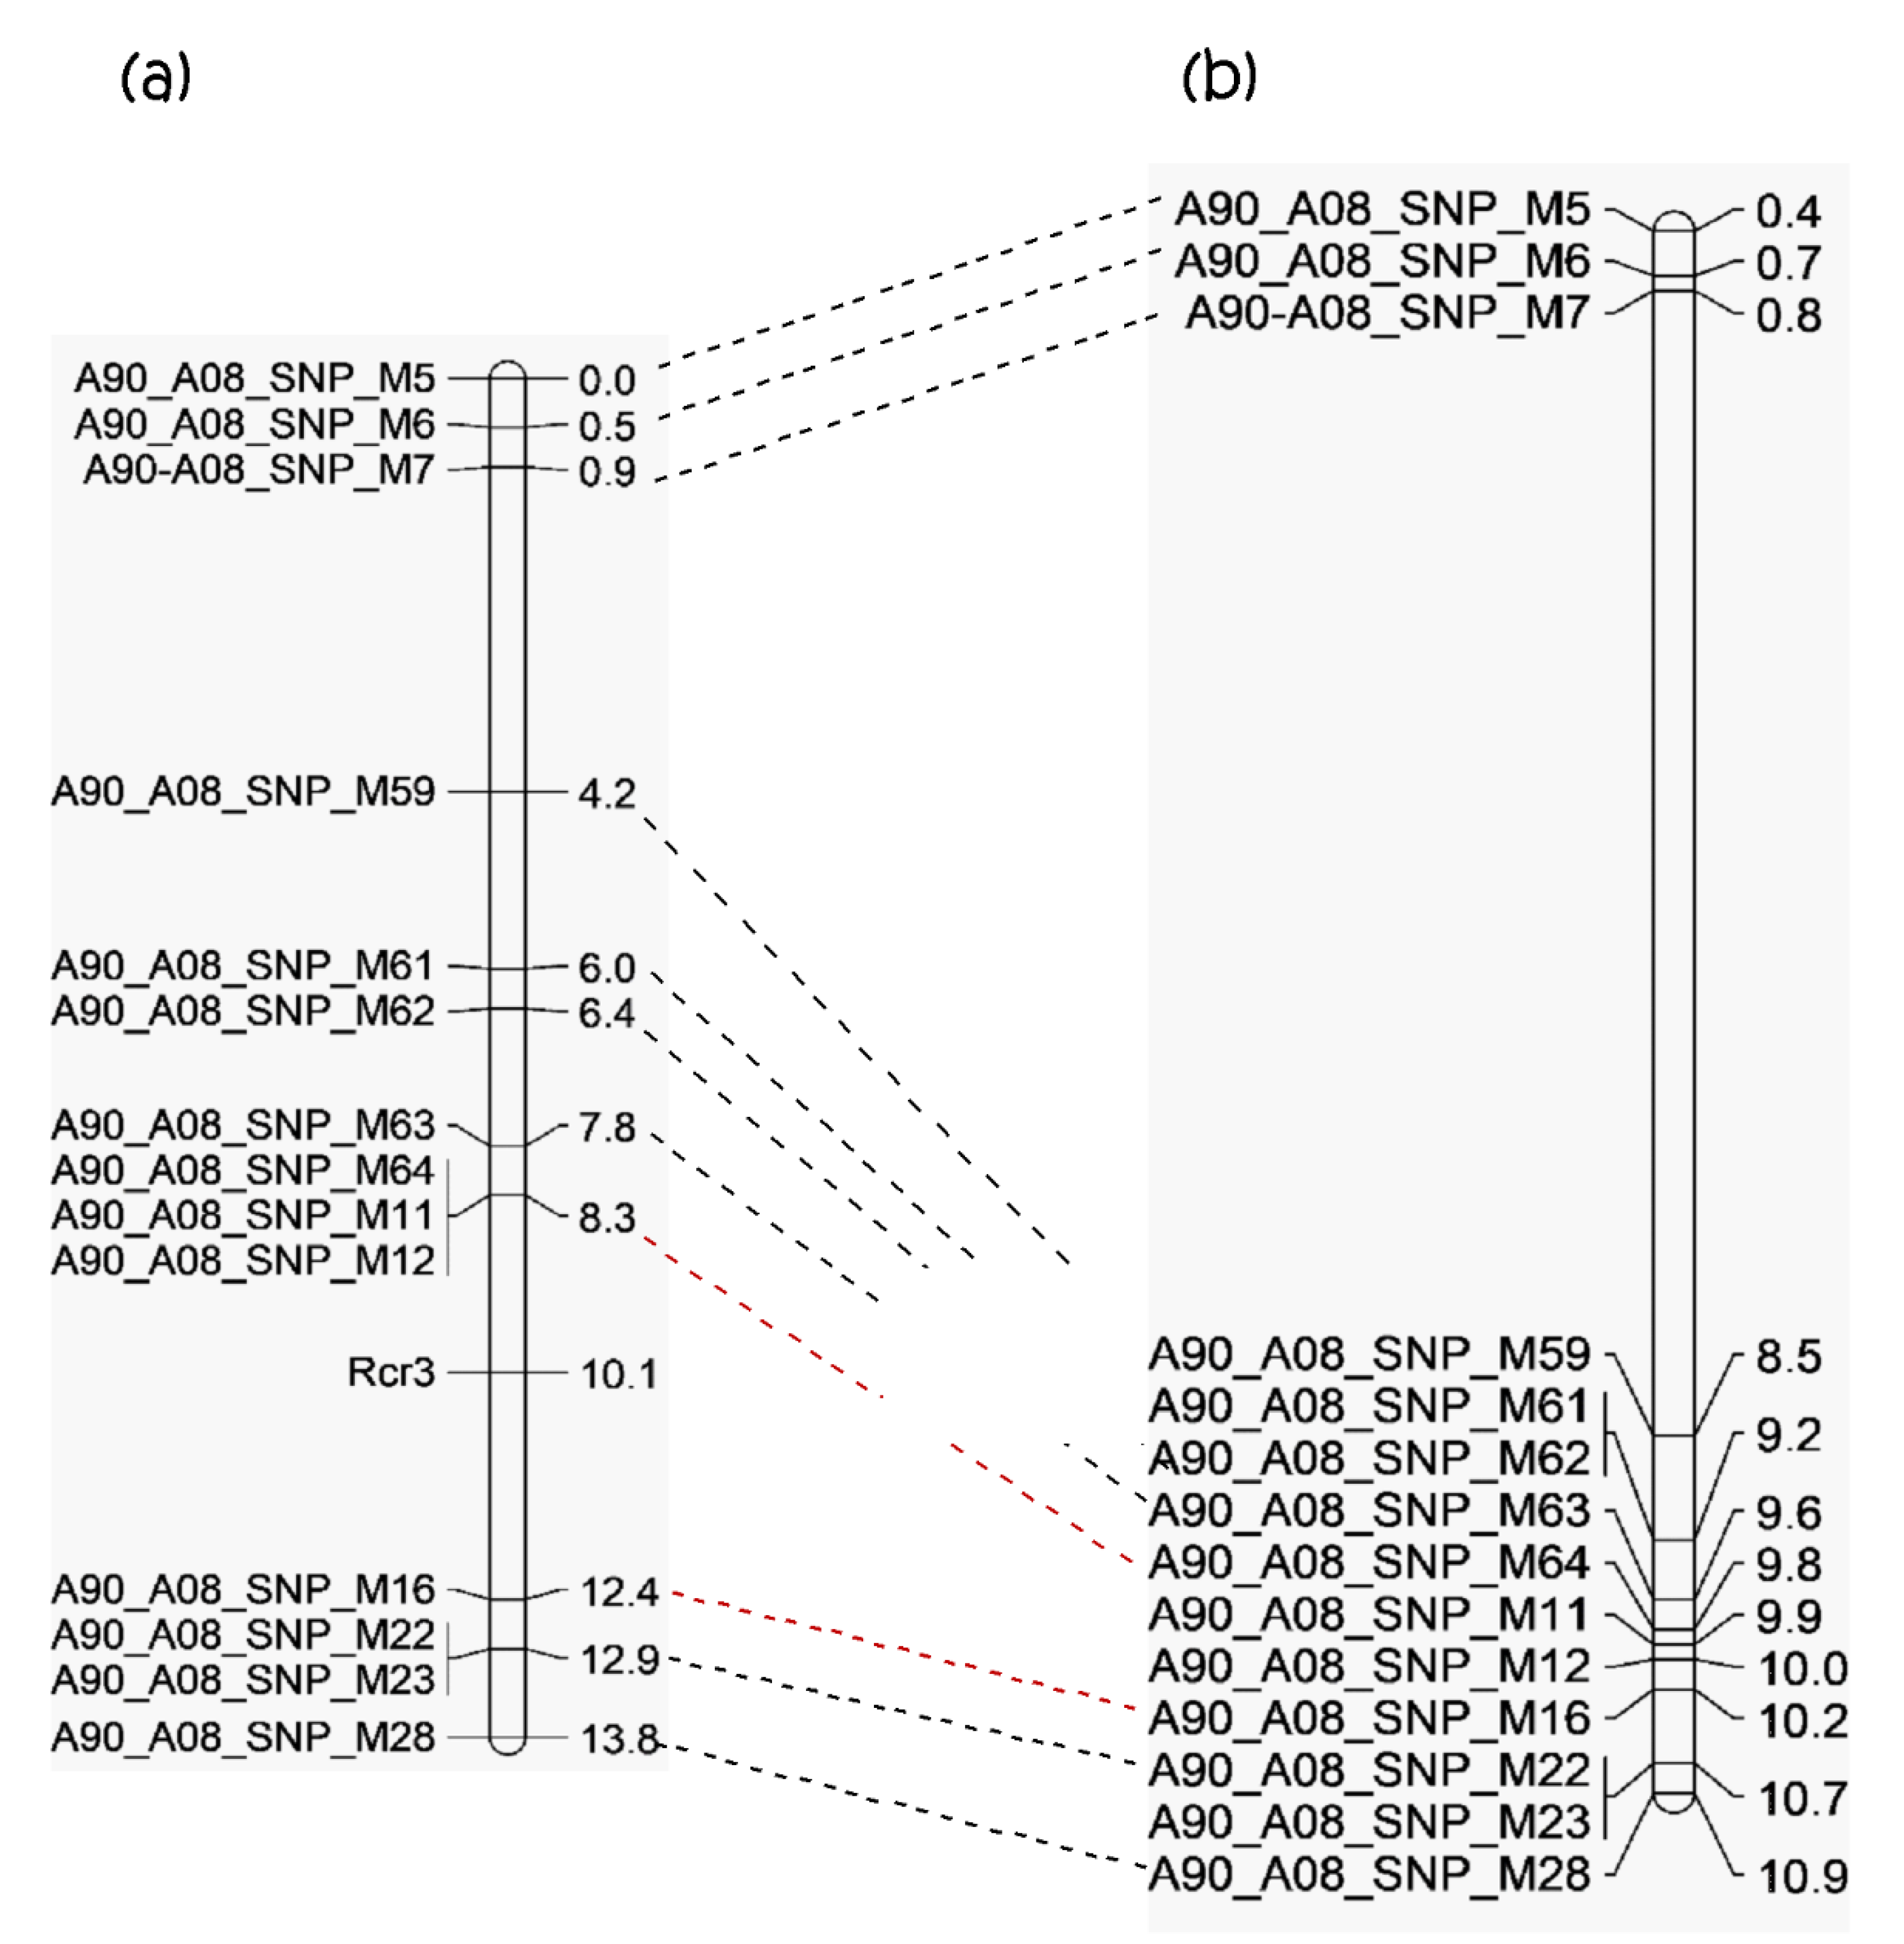
To define the genomic region of Rcr3, a total of 240 plants in the BC1 population were analyzed with three SNP sites from the 0–1 Mb and 11 SNP sites from the 8–11 Mb physical intervals of chromosome A08 through Kompetitive Allele Specific PCR (KASP) assay (Figure 3, Supplementary Figure S1).
A linkage map was constructed based on the reaction of the 240 BC1 plants to pathotype 3H, together with their genotypic data from KASP analysis with the 14 SNP markers (Figure 3, Supplementary Table S2). Rcr3 was flanked by SNP markers A90_A08_SNP_M12 (located at 9,997,211 bp of A08) and A90_A08_SNP_M16 (located at 10,228,875 bp of A08), which spanned an interval of 231.66 Kb (Figure 3). Therefore, Rcr3 was located in the genomic region of 8–11 Mb as determined by analysis of PPV, but not in the 0–1 Mb region (Figure 3).

2.5. Gene Annotation in the Rcr3 Target Region

There are 32 genes in the Rcr3 target region (10.00–10.23 Mb of chromosome A03) of the B. rapa reference genome v1.5. Blast2GO by a BLASTX search of Arabidopsis thaliana (Supplementary Table S3) was performed. Twenty-eight of these 32 genes were annotated. Three genes were associated with disease resistance mechanisms; Bra020951 produces a protein from the glycosyl hydrolase family with a chitinase insertion domain-containing protein, Bra020974 produces a protein from the leucine-rich receptor-like protein kinase family, and Bra020979 produces a receptor-like protein 11.

2.6. Mapping Rcr9wa for Resistance to Pathotype 5X

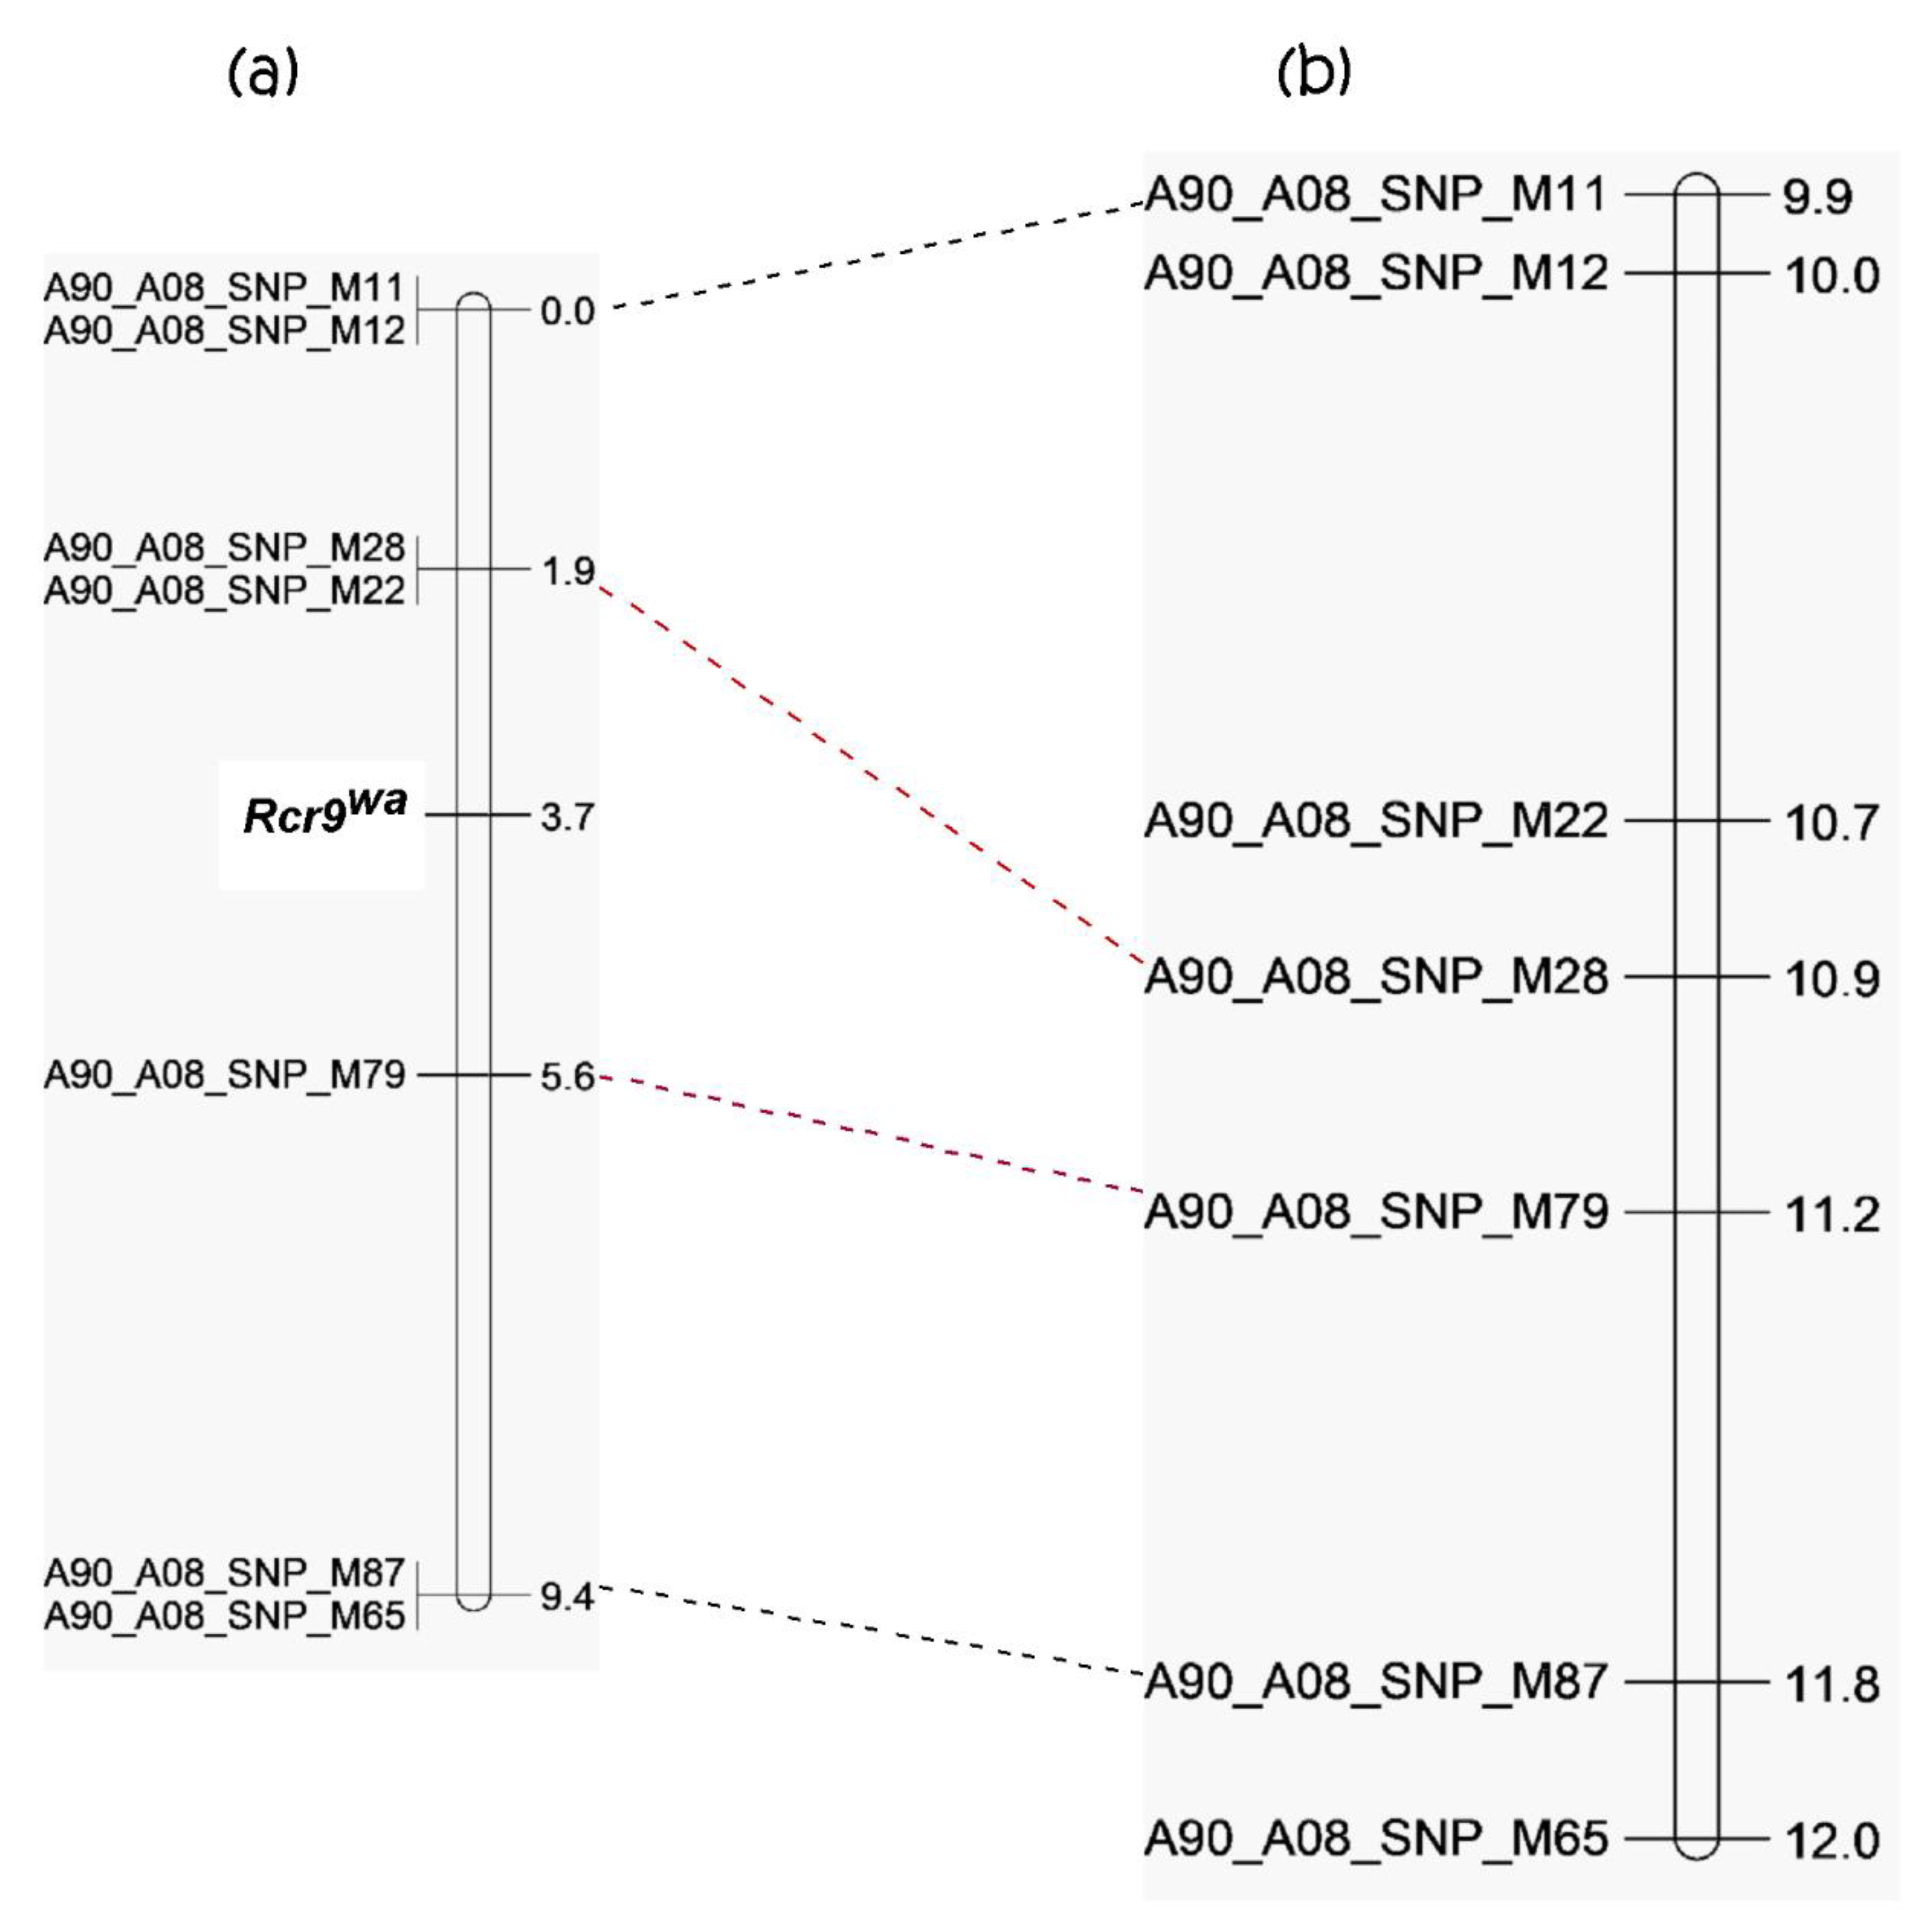
A total of 108 BC1 plants were analyzed with four SNP markers flanking Rcr3 (A90_A08_SNP_M11 and M12 above Rcr3, A90_A08_SNP_M22 and M28 below Rcr3) for mapping of the gene for resistance to pathotype 5X using KASP analysis (Figure 4, Supplementary Table S2). However, the gene responsible for resistance to the pathotype 5X was not in the interval, but below the marker A90_A08_SNP_M28. Three additional SNP markers were chosen to define the location of Rcr9wa (Figure 4, Supplementary Table S2). Rcr9wa was flanked by A08_SNP_M28 (located at 10,850,444 bp of chromosome A08) and A08_SNP_M79 (located at 11,173,147 bp of chromosome A08), covering an interval of 322.7 Kb. This represented a different interval from that of Rcr3 (10.00–10.23 Mb) and Crr1 gene Bra020861 (10,809,433–10,825,238 bp) [40], but lay within the same interval as Rcr9 (7.1–13.5Mb), a QTL to pathotype 5X previously mapped in B. rapa [24]. Therefore, the gene for resistance to pathotype 5X was designated as Rcr9wa since it was originated from turnip cultivar ‘Waaslander’.
The Rcr9wa region between the flanking markers included 44 genes, three of which (Bra020827, Bra020828, Bra020814) were annotated as immune-system-process related genes (Supplementary Table S4).

3. Discussion

NGS has ignited a revolution in life sciences. It allows the rapid development and application of genomics tools, especially DNA markers in plant genetics and breeding. BSA (genotyping bulks of plants with extreme phenotypes) and NGS have recently been applied to mapping and marker development for CR genes in Brassica spp. [34,35,46,57,59]. To minimize the complexity of plant genomes for data analysis and the cost for NGS, BSA has also been coupled with RNA-Seq for genetic mapping. In this study, we used an established BSR-Seq method to map Rcr3 into chromosome A08 of B. rapa. A large number of SNP sites were obtained in the BSA-Seq project. The location of Rcr3 was further defined and a second gene (Rcr9wa) was finely mapped using the SNP markers identified from BSA-Seq, demonstrating that BSA-Seq coupled with conventional linkage analysis is a powerful method to identify genes of interest.
In the current study, the reaction of BC1 [ACDC × (ACDC × 96-6990-2)] to pathotypes 3H and 5X was assessed. Pathotype 3H is prevalent on canola in Canada, while pathotype 5X is virulent on previously resistant canola cultivars [14].
Previous studies had identified and mapped Rcr1, Rcr2, and Rcr4, which produced resistance against multiple pathotypes in B. rapa lines including pak choy cv. ‘Flower Nabana’, Chinese cabbage cv. ‘Jazz’, and canola breeding line T19 [24,34,57]. In the current study, B. rapa line 96-6990-2, which is genetically distant from ‘Flower Nabana’, ‘Jazz’, and T19, was used as the resistance source (Supplementary Figure S2). A 1:1 segregation ratio in the BC1 population in response to inoculation with either pathotype 3H or pathotype 5X indicated that resistance was controlled by a single dominant locus. Rcr3 was associated with resistance to pathotype 3H and was mapped onto chromosome A08 using SNP markers developed through BSR-Seq. Additionally, Rcr9wa was associated with 5X and mapped onto chromosome A08. Leaf tissues were used in this study because collection was easier and less likely to carry microbial contaminants compare to root tissue. Additionally, the plants continued to grow well after leaf collection without producing any root damage. Clubroot is a root disease, but RNA-Seq data from root as well leaf tissue had previously been shown to produce good numbers of variants for CR gene mapping [34,35,46,57,59].
Previous reports indicated that all of the loci identified on chromosome A03 (Rcr1, Rcr2, Rcr4, Rcr5) conferred resistance to pathotype 3H [24,34,35,57]. In the current study, a new CR gene effective against 3H, named Rcr3, was identified on chromosome A08 between SNP markers A90_A08_SNP_M12 (9,997,211 bp) and A90_A08_SNP_M16 (10,228,875 bp) and spanning a physical interval of 231.6 Kb. The CR gene Crr1a had previously been mapped to chromosome A08 and cloned. It is highly homologous to gene Bra020861, which was located in the 10.81–10.83 Mb region of chromosome A08. Therefore, Rcr3 is not allelic to Crr1. Similarly, Crr1b has been mapped to chromosome A08, about 712 Kb from Crr1a [39]. Although Rcr3 and Crr1b share the same genomic region, Crr1b functions as a complementary allele for Crr1a and only has a minor role in CR [40]. The difference in role supports our conclusion that Rcr3 and Crr1b represent different genes. Rcr3 lies in the same genomic region as CR gene CRs [37], but the current study demonstrated that these two genes differ in pathotype specificity. This study supports a previous report that chromosome A08 of B. rapa carries a cluster of CR genes [39,44].
In the current study, Rcr9wa was fine mapped in a 322.7 Kb interval (10.85–11.17 Mb) within the Rcr9 interval (7.1–13.5 Mb) on chromosome A08. Rcr3 and Rcr9wa were mapped as being 1.17 Mb apart on chromosome A08, based on plant reaction to inoculation with pathotype 3H and 5X. The flanking SNP markers that had been used to locate Rcr3 did not co-segregate with pathotype 5X resistance, so we conclude that two separate genes are responsible for resistance to pathotype 3H and 5X in the A genome of parental line 96-6990-2. A major locus, Rcr7 on C07, was recently reported be associated with pathotype 3H and 5X resistance. However, common SNP markers co-segregated completely with the resistance; so, it could be a single dominant gene or tightly linked genes. The C genome Rcr7 region is homologous to B. rapa chromosome A03 [46].
A total of 654.0 K variants were produced in the R bulks and 637.7 K variants in the S bulks. SNP variants were more abundant than InDels. The number of variants identified per chromosome was positively correlated with chromosome length (r = 0.83 and 0.81), as supported by a previous report [57].
Variant analysis across chromosomes has become the method of choice to identify quantitative and qualitative trait loci [60,61]. Variation of SNPs in the R and S bulks provided valuable information about the location of resistance genes on chromosomes. Polymorphic variants are a key factor for the identification of differences between two traits, and chromosomes with the highest PPV likely carry the gene(s) of interest [35,46,57]. In the current study, the highest numbers of polymorphic variants were found in chromosome A08, which indicated that Rcr3 was located on A08. Rcr3 was further mapped into the physical interval from 8 to 11 Mb of chromosome A08 though analysis of PPV and confirmed by the selected SNP sites in the interval through KASP analysis. However, a PPV peak from 0 to 1 Mb of chromosome A08 was also found, but it was irrelevant for Rcr3. One reason for this could be the low number of variants identified in the region due to a relatively low depth of RNA-Seq reads in the region [35], which causes a bias on the estimation of PPV.
Rcr3 was mapped within a flanking region of 231.66 Kb from A90_A08_M12 (9,997,211 bp) to A90_A08_M16 (10,228,875 bp). Blast2GO analysis was conducted within the flanking region to identify the candidate genes corresponding to Rcr3. Three genes were annotated with disease resistance mechanisms that appear to be viable options as candidate genes for Rcr3; Bra020951 produces a protein from the glycosyl hydrolase family with a chitinase insertion domain-containing protein, and Bra020979 produces a receptor-like protein 11. Bra020974 was annotated to produce a protein in the leucine-rich receptor-like protein kinase family. However, further clarification of the relationships among the genes or other candidates and Rcr3 was beyond the scope of the present study.
Three genes (Bra020827, Bra020828, Bra020814) were annotated as immune-system-process related genes, but only one gene, Bra020814 (11,173,076–11,174,598 bp), of the 44 genes identified in the region flanking Rcr9wa was associated with a disease resistance protein (TIR-NBS-LRR class) in A. thaliana. Each of these genes is a possible candidate gene for Rcr9wa. Our previous study identified a QTL (Rcr9) in B. rapa line T19 for resistance to pathotype 5X of P. brassicae through analysis of QTL [24]. Rcr9 was roughly mapped in a large interval of chromosome A08. In another recent study, B. napus lines with Rcr9 exhibited an intermediate level of resistance, while lines with Rcr9wa were highly resistant (unpublished data). Therefore, it is likely that Rcr9wa is a different CR gene from Rcr9. However, cloning of the genes is required to further clarify the relationship between Rcr9 and Rcr9wa.
In summary, CR genes that provided resistance against pathotypes 3H (Rcr3) and 5X (Rcr9wa) were identified. Tightly linked SNP markers associated with Rcr3 and Rcr9wa were identified, and will be valuable for use in marker-assisted selection for these genes in both B. rapa and B. napus. Searching for candidates for Rcr3 and Rcr9wa in the respective mapping intervals was also described. PPV analysis of variants based on BSR-Seq was demonstrated to be an effective technique to identify genome-wide variants for KASP-based mapping.

4. Materials and Methods

4.1. Plant Materials for CR Genetic Mapping

A backcross mapping population was developed from a cross between two B. rapa lines, the clubroot-resistant line, 96-6990-2, and the susceptible double haploid line ACDC. The parental lines were provided by Dr. Kevin Falk at Saskatoon Research and Development Centre, Agriculture and Agri-Food Canada. The line 96-6990-2 was selected for use as the resistant parent [11] because it was a B. rapa canola breeding line that carried CR introgressed from a clubroot-resistant turnip cultivar, ‘Waaslander’, which was a derivation of ECD04 [62]. This source was selected because turnip belongs to a different genetic subgroup (Supplementary Figure S2) from pak choy (B. rapa subsp. chinensis) cvs. ‘Flower Nabana’, ‘Jazz’, and breeding line T19, which were the sources of the resistance loci (Rcr1, Rcr2, and Rcr4), respectively, that had previously been identified on chromosome A03 with efficacy against pathotype 3H of P. brassicae [24,34,57]. In a preliminary screening, 96-6990-2 was resistant to both pathotype 3H and pathotype 5X (field isolates LG1, LG2, and LG3). In total, 240 BC1 plants were used to map resistance to pathotype 3H and 108 BC1 plants for resistance to pathotype 5X-LG2. Leaf samples from the 240 BC1 plants were used for BSR-Seq.

4.2. Plant Inoculation with Pathotypes 3H and 5X

One field isolate of P. brassicae pathotype 3H (original pathotype 3, based on Williams’ differential set) and another of 5X (field isolate LG2) [14], both collected from canola fields in Alberta, Canada, were used in this study. To produce inoculum, seedlings of a susceptible cultivar were inoculated and maintained under controlled conditions. After 5–6 weeks, clubbed roots were harvested from infected plants and stored at −20 °C. After softening about 5 g of frozen club in a small amount of water, the material was homogenized in a blender for 2 min and strained through 2–3 layers of nylon mesh cloth. The resulting spore suspension was diluted with deionized water to produce a final concentration of 1 × 10⁷ resting spores mL−1.
Seedlings were grown in tall, narrow plastic pots (164 mL Conetainers, Stuewe & Sons INC., Corvallis, OR, USA) filled with soil-less mix (Sunshine Mix 3, TerraLink Horticulture Inc., BC, Canada). The pots were filled with tightly packed, moist potting mix, and 2.5 mL of inoculum was added to soil three times; before sowing, after sowing, and at the stem base of each seedling at 7 days after sowing, to minimize disease escape.
The inoculated seedlings were maintained in a growth chamber set at 23 °C with frequent watering to maintain moist soil conditions. At 6 weeks after inoculation, each plant was rated for clubroot symptoms using a 0–3 scale [33], where 0 = no symptoms, 1 = a few small clubs, 2 = moderate clubbing, and 3 = severe clubbing (Figure 1). After the plants were rated for clubroot symptoms, the leaf samples that had been collected previously were separated into resistant (R) and susceptible (S) groups to create R and S bulks. Three biological replicates were assessed, with each biological replicate consisting of one R bulk and one S bulk. Each R bulk consisted of 30 plants with a clubroot severity rating of 0 and each S bulk consisted of 30 plants with a clubroot rating of 2 or 3. Plants with a rating of 1 were not included in either bulk because their reaction was considered intermediate.
In addition to the parental lines (ACDC—susceptible, 96-6990-2—resistant), two checks susceptible to one or two pathotypes were included in each assessment. One check was DH16516, a doubled-haploid line from single spore of B. napus cv. ‘Topas’, susceptible to both pathotypes 3H and 5X, and the other check was cv. ‘45H29′, a commercial canola cultivar of Pioneer Hi-Bred in Canada, resistant to pathotype 3H but susceptible to pathotype 5X.

4.3. RNA Extraction, Illumina Library Preparation, and Sequencing

At 2 weeks after inoculation, young, fresh leaves were harvested from each BC1 plant, immediately placed into liquid nitrogen, and stored at −80 °C until used. Total RNA was extracted from each bulk using an RNeasy® Mini Kit (Qiagen, Toronto, ON, Canada). The total RNA concentration was measured with a Nanodrop2000 (Thermo Scientific™) and RNA quality was assessed using Bio-Rad ExperionTM (Bio-Rad Laboratories, Inc. USA) following the manufacturer’s instructions (Catalog #700-7103 #700-7105). The RNA quality for each bulk sample was deemed acceptable if the RNA quality indicator (RQI) value in the total RNA sample was ≥8.
A 100 ng aliquot of RNA from each bulk sample was used to prepare a cDNA library, following the manufacturer’s protocol (Illumina TruSeq® RNASample Preparation v2 Guide, RS-122-9001DOC, Part # 15026495 Rev. F, March 2014, Illumina Inc., San Diego, CA, USA). The cDNA library concentration was measured with a Nanodrop2000 and cDNA quality with Bio-Rad ExperionTM. The cDNA samples were diluted and quantified using KAPA library quantification kits (KAPA Biosystem, Germany). Sample pooling was performed by mixing 10 nM l-1 cDNA from each R and S bulk replicate (e.g., R1 with S1). The final concentration (18–20 pM L−1) was used to prepare sequencing samples using a MiSeq® reagent Kit V3 as per the manufacturer’s instructions (MS-102-3001, Illumina Inc.). RNA sequencing was performed with an Illuimna MiSeq® System. All three biological replicates were sequenced twice to increase the depth and breadth of coverage.

4.4. Read Mapping, Variant Analysis, and Genetic Mapping by Analysis of PPV

Raw pair-end RNA sequencing reads were filtered to remove small fragments (≤50 bp), aligned to a B. rapa reference genome v1.5 (http://brassicadb.org/brad/downloadOverview.php), then assembled into 10 chromosomes using SeqMan NGen (DNASTAR.13 Lasergene Inc., Madison, WI, USA). Pooled sample assembly for variant analysis was conducted as described by Yu et al. [57] using SeqMan Pro and ArrayStar software in DNASTAR.13. A standard filter option (SNP% ≥ 15%, P not ref ≥ 90%, Q-call ≥ 15 and depth ≥ 5) was used to get consistent output. The PPV analysis [57], which was recently confirmed as a desirable approach for genetic mapping [46], was used for genetic mapping.

4.5. SNP Selection, KASP Analysis, and Linkage Analysis

High quality SNP loci (hetero type, non-synonymy and 40–60% SNP distribution in the R bulks and 0% SNP in the S bulks) were chosen for KASP analysis. The primers were designed by adding standard FAM or HEX reporter dye tails to the 3′ end of selected SNPs (Supplementary Table S2). The KASP assay was conducted using a StepOne Plus Real-Time PCR System (Applied Biosystems, Mississauga, ON, Canada). To assess marker association, genomic DNA was collected from each BC1 plant and from the parental lines. KASP markers were selected based on the RNA-Seq data from the first set of 240 BC1 plants (inoculated with pathotype 3H). The polymorphic SNP markers that had been identified were validated and used for mapping on a second set of 109 BC1 plants (inoculated with pathotype 5X-isolate LG2).
Linkage analysis and genetic map construction were conducted with JoinMap version 4.1 [63]. Genetic distances were converted from recombination frequencies using the Kosambi mapping function [64].

4.6. Identification of Potential Candidates for the Mapped Genes

The location of the SNP markers flanking Rcr3 (A90_A08_SNP_M12 and A90_A08_SNP_M16) and Rcr9wa (A08_SNP_M28 and A08_SNP_M79) on the B. rapa reference genome v1.5 (http://brassicadb.org/brad/downloadOverview.php) was obtained using SeqMan Pro and ArrayStar components in DNASTAR.13 software. The information on the physical location, length, description, and gene ontology (GO) name for each gene in the flanking region of the reference genome was searched using Blast2GO [65]. The level of gene expression based on RPKM (Reads Per Kilobase of transcript per Million mapped reads) in the leaf tissue of the Rcr3 interval from the RNA-Seq project was obtained using ArrayStar.

Supplementary Materials

Supplementary materials can be found at https://www.mdpi.com/1422-0067/21/14/5033/s1.

Author Contributions

F.Y. conceived of the project; M.M.K. designed and conducted the experiments, analyzed data, and drafted the manuscript. A.D., Y.Z. and Q.C. contributed to the experiments; G.P. identified the resistant line; S.E.S. provided the inoculum; F.Y. and B.D.G. edited the manuscript; F.Y. contributed to the experiment design, data analysis, and secured funding. All authors reviewed and approved the manuscript.

Funding

This project was funded by the Western Grains Research Foundation, the Alberta Producers Commission, and the Canola Agri-Science Cluster II.

Acknowledgments

The authors thank K. Falk for providing the two parental lines, T. Song for helping with RNA sequencing, and L. McGregor, M. Kehler, J. Wang, K. Flavel, A. Ashraf and A. Chang for technical assistance.

Conflicts of Interest

The authors declare that they have no competing financial or non-financial interests.

Abbreviations

AAFCAgriculture and Agri-Food Canada
BCBack Cross
BLASTBasic Local Alignment Search Tool
BSABulk Segregant Analysis
BSR-SeqBulk Segregant RNA sequencing
CC-NBS-LRRCoiled Coil-Nucleotide Binding Site-Leucine Rich Repeat
cDNAComplementary DNA
cMCentimorgan
CRClubroot Resistant
DEGDifferential Expressed Genes
DNADeoxyribonucleic Acid
ETIEffector Triggered Immunity
GbGigabases
GOGene Ontology
InDelsInsertions and Deletions
KASPKompetitive Allele Specific PCR
KbKilobase
MAMPsMicrobial Associated Molecular Patterns
MASMarker Assisted Selection
MbMegabase
NBS-LRRNucleotide Binding Site-Leucine Rich Repeat)
NGSNext Generation Sequencing
NSNon Synonymous
PAMPsPathogen-Associated Molecular Patterns
PCRPolymerase Chain Reaction
PGRCPlant Genetic Resource Centre
PPVPercent Polymorphic Variants
PRRsPattern Recognition Receptors
PTIPAMP-Triggered Immunity
qPCRquantitative PCR
QTLQuantitative Trait Locus
R bulkResistant bulk
RQIRNA quality indicator
RNARibonucleic Acid
RNA-SeqRNA sequencing
S bulkSusceptible bulk
SSynonymous
SNPSingle Nucleotide Polymorphism
TIR-NBS-LRRToll Interleukin1 Receptor-Nucleotide Binding Site-Leucine-Rich Repeat

References

  1. Dixon, G.R. The Occurrence and Economic Impact of Plasmodiophora brassicae and Clubroot Disease. J. Plant Growth Regul. 2009, 28, 194–202. [Google Scholar] [CrossRef]
  2. Voorrips, R.E. Plasmodiophora brassicae: Aspects of pathogenesis and resistance in Brassica oleracea. Euphytica 1995, 83, 139–146. [Google Scholar] [CrossRef]
  3. Gossen, B.D.; Adhikari, K.K.; McDonald, M.R. Effect of seeding date on development of clubroot in short-season Brassica crops. Can. J. Plant Pathol. 2012, 34, 516–523. [Google Scholar] [CrossRef]
  4. Donald, E.C.; Porter, I.J. Clubroot in Australia: The history and impact of Plasmodiophora brassicae in Brassica crops and research efforts directed towards its control. Can. J. Plant Pathol. 2014, 36, 66–84. [Google Scholar] [CrossRef]
  5. Hwang, S.-F.; Howard, R.J.; Strelkov, S.E.; Gossen, B.D.; Peng, G. Management of clubroot (Plasmodiophora brassicae) on canola (Brassica napus) in western Canada. Can. J. Plant Pathol. 2014, 36, 49–65. [Google Scholar] [CrossRef]
  6. Tewari, J.P.; Strelkov, S.E.; Orchard, D.; Hartman, M.; Lange, R.M.; Turkington, T.K. Identification of clubroot of crucifers on canola (Brassica napus) in Alberta. Can. J. Plant Pathol. 2005, 27, 143–144. [Google Scholar] [CrossRef]
  7. Cao, T.; Manolii, V.P.; Strelkov, S.E.; Hwang, S.-F.; Howard, R.J. Virulence and spread of Plasmodiophora brassicae [clubroot] in Alberta, Canada. Can. J. Plant Pathol. 2009, 31, 321–329. [Google Scholar] [CrossRef]
  8. Dokken-Bouchard, F.L.; Anderson, K.; Bassendowski, K.A.; Bouchard, A.; Brown, B. Survey of canola diseases in Saskatchewan, 2011. Can. Plant Dis. Surv. 2012, 92, 125–129. [Google Scholar]
  9. Strelkov, S.E.; Manolii, V.; Harding, M.; Hwang, S.F.; Fei, W.; Rong, S.; Burke, D.; Pugh, C.A.; Nielson, J.M.; Barnes, A.; et al. The spread of clubroot on canola in Alberta in 2014. Can. Plant Dis. Surv. 2015, 95, 155–158. [Google Scholar]
  10. Chittem, K.; Mansouripour, S.; Mendoza, L.E.D.R. First Report of Clubroot on Canola Caused by Plasmodiophora brassicae in North Dakota. Plant Dis. 2014, 98, 1438. [Google Scholar] [CrossRef]
  11. Peng, G.; Falk, K.C.; Gugel, R.K.; Franke, C.; Yu, F.; James, B.; Strelkov, S.E.; Hwang, S.-F.; McGregor, L. Sources of resistance to Plasmodiophora brassicae (clubroot) pathotypes virulent on canola. Can. J. Plant Pathol. 2014, 36, 89–99. [Google Scholar] [CrossRef]
  12. Rahman, H.; Peng, G.; Yu, F.; Falk, K.; Kulkarni, M.; Selvaraj, G. Genetics and breeding for clubroot resistance in Canadian spring canola (Brassica napus L.). Can. J. Plant Pathol. 2014, 36, 122–134. [Google Scholar] [CrossRef]
  13. Wallenhammar, A.-C.; Almquist, C.; Soderstrom, M.; Jónsson, Á. In-field distribution of Plasmodiophora brassicae measured using quantitative real-time PCR. Plant Pathol. 2012, 61, 16–28. [Google Scholar] [CrossRef]
  14. Strelkov, S.E.; Hwang, S.-F.; Manolii, V.P.; Cao, T.; Feindel, D. Emergence of new virulence phenotypes of Plasmodiophora brassicae on canola (Brassica napus) in Alberta, Canada. Eur. J. Plant Pathol. 2016, 145, 517–529. [Google Scholar] [CrossRef]
  15. Jones, J.D.G.; Dangl, J.L. The plant immune system. Nature 2006, 444, 323–329. [Google Scholar] [CrossRef] [Green Version]
  16. McHale, L.; Tan, X.; Koehl, P.; Michelmore, R. Plant NBS-LRR proteins: Adaptable guards. Genome Biol. 2006, 7, 212. [Google Scholar] [CrossRef] [Green Version]
  17. Glazebrook, J. Contrasting Mechanisms of Defense Against Biotrophic and Necrotrophic Pathogens. Annu. Rev. Phytopathol. 2005, 43, 205–227. [Google Scholar] [CrossRef]
  18. Kuginuki, Y.; Yoshikawa, H.; Hirai, M. Variation in Virulence of Plasmodiophora brassicae in Japan Tested with Clubroot-resistant Cultivars of Chinese Cabbage (Brassica rapa L. ssp. pekinensis). Eur. J. Plant Pathol. 1999, 105, 327–332. [Google Scholar] [CrossRef]
  19. Gustafsson, M.; Falt, A.S. Genetic studies on resistance to clubroot in Brassica napus. Ann. Appl. Biol. 1986, 108, 409–415. [Google Scholar] [CrossRef]
  20. Diederichsen, E.; Beckmann, J.; Schondelmeier, J.; Dreyer, F. Genetics of clubroot resistance in Brassica napus ‘mendel’. Acta Hortic. 2006, 706, 307–312. [Google Scholar] [CrossRef]
  21. Diederichsen, E.; Frauen, M.; Linders, E.G.A.; Hatakeyama, K.; Hirai, M. Status and Perspectives of Clubroot Resistance Breeding in Crucifer Crops. J. Plant Growth Regul. 2009, 28, 265–281. [Google Scholar] [CrossRef]
  22. Piao, Z.; Ramchiary, N.; Lim, Y.P. Genetics of Clubroot Resistance in Brassica Species. J. Plant Growth Regul. 2009, 28, 252–264. [Google Scholar] [CrossRef]
  23. Hatakeyama, K.; Niwa, T.; Kato, T.; Ohara, T.; Kakizaki, T.; Matsumoto, S. The tandem repeated organization of NB-LRR genes in the clubroot-resistant CRb locus in Brassica rapa L. Mol. Genet. Genom. 2017, 292, 397–405. [Google Scholar] [CrossRef]
  24. Yu, F.; Zhang, X.; Peng, G.; Falk, K.C.; Strelkov, S.E.; Gossen, B.D. Genotyping-by-sequencing reveals three QTL for clubroot resistance to six pathotypes of Plasmodiophora brassicae in Brassica rapa. Sci. Rep. 2017, 7, 4516. [Google Scholar] [CrossRef]
  25. Matsumoto, E.; Yasui, C.; Ohi, M.; Tsukada, M. Linkage analysis of RFLP markers for clubroot resistance and pigmentation in Chinese cabbage (Brassica rapa ssp. pekinensis). Euphytica 1998, 104, 79–86. [Google Scholar] [CrossRef]
  26. Matsumoto, E.; Hayashida, N.; Sakamoto, K.; Ohi, M. Behavior of DNA Markers Linked to a Clubroot Resistance Gene in Segregating Populations of Chinese Cabbage (Brassica rapa ssp. pekinensis). J. Jpn. Soc. Hortic. Sci. 2005, 74, 367–373. [Google Scholar] [CrossRef] [Green Version]
  27. Hayashida, N.; Takabatake, Y.; Nakazawa, N.; Aruga, D.; Nakanishi, H.; Taguchi, G.; Sakamoto, K.; Matsumoto, E. Construction of a Practical SCAR Marker Linked to Clubroot Resistance in Chinese Cabbage, with Intensive Analysis of HC352b Genes. J. Jpn. Soc. Hortic. Sci. 2008, 77, 150–154. [Google Scholar] [CrossRef] [Green Version]
  28. Piao, Z.Y.; Deng, Y.Q.; Choi, S.R.; Park, Y.J.; Lim, Y.P. SCAR and CAPS mapping of CRb, a gene conferring resistance to Plasmodiophora brassicae in Chinese cabbage (Brassica rapa ssp. pekinensis). Theor. Appl. Genet. 2004, 108, 1458–1465. [Google Scholar] [CrossRef]
  29. Hirai, M.; Harada, T.; Kubo, N.; Tsukada, M.; Suwabe, K.; Matsumoto, S. A novel locus for clubroot resistance in Brassica rapa and its linkage markers. Theor. Appl. Genet. 2004, 108, 639–643. [Google Scholar] [CrossRef]
  30. Saito, M.; Kubo, N.; Matsumoto, S.; Suwabe, K.; Tsukada, M.; Hirai, M. Fine mapping of the clubroot resistance gene, Crr3, in Brassica rapa. Theor. Appl. Genet. 2006, 114, 81–91. [Google Scholar] [CrossRef] [PubMed]
  31. Sakamoto, K.; Saito, A.; Hayashida, N.; Taguchi, G.; Matsumoto, E. Mapping of isolate-specific QTLs for clubroot resistance in Chinese cabbage (Brassica rapa L. ssp. pekinensis). Theor. Appl. Genet. 2008, 117, 759–767. [Google Scholar] [CrossRef] [PubMed]
  32. Chen, J.; Jing, J.; Zhan, Z.; Zhang, T.; Zhang, C.; Piao, Z. Identification of Novel QTLs for Isolate-Specific Partial Resistance to Plasmodiophora brassicae in Brassica rapa. PLoS ONE 2013, 8, e85307. [Google Scholar] [CrossRef] [PubMed] [Green Version]
  33. Chu, M.; Song, T.; Falk, K.C.; Zhang, X.; Liu, X.; Chang, A.; Lahlali, R.; McGregor, L.; Gossen, B.D.; Yu, F.; et al. Fine mapping of Rcr1 and analyses of its effect on transcriptome patterns during infection by Plasmodiophora brassicae. BMC Genom. 2014, 15, 1166. [Google Scholar] [CrossRef] [PubMed] [Green Version]
  34. Huang, Z.; Peng, G.; Liu, X.; Deora, A.; Falk, K.C.; Gossen, B.D.; McDonald, M.R.; Yu, F. Fine Mapping of a Clubroot Resistance Gene in Chinese Cabbage Using SNP Markers Identified from Bulked Segregant RNA Sequencing. Front. Plant Sci. 2017, 8, 1448. [Google Scholar] [CrossRef] [Green Version]
  35. Huang, Z.; Peng, G.; Gossen, B.D.; Yu, F. Fine mapping of a clubroot resistance gene from turnip using SNP markers identified from bulked segregant RNA-Seq. Mol. Breed. 2019, 39, 131. [Google Scholar] [CrossRef]
  36. Suwabe, K.; Tsukazaki, H.; Iketani, H.; Hatakeyama, K.; Fujimura, M.; Nunome, T.; Fukuoka, H.; Matsumoto, S.; Hirai, M. Identification of two loci for resistance to clubroot (Plasmodiophora brassicae Woronin) in Brassica rapa L. Theor. Appl. Genet. 2003, 107, 997–1002. [Google Scholar] [CrossRef]
  37. Laila, R.; Park, J.-I.; Robin, A.H.K.; Natarajan, S.; Vijayakumar, H.; Shirasawa, K.; Isobe, S.; Kim, H.-T.; Nou, I.-S. Mapping of a novel clubroot resistance QTL using ddRAD-seq in Chinese cabbage (Brassica rapa L.). BMC Plant Biol. 2019, 19, 13. [Google Scholar] [CrossRef]
  38. Suwabe, K.; Tsukazaki, H.; Iketani, H.; Hatakeyama, K.; Kondo, M.; Fujimura, M.; Nunome, T.; Fukuoka, H.; Hirai, M.; Matsumoto, S. Simple Sequence Repeat-Based Comparative Genomics Between Brassica rapa and Arabidopsis thaliana: The Genetic Origin of Clubroot Resistance. Genetics 2006, 173, 309–319. [Google Scholar] [CrossRef] [Green Version]
  39. Suwabe, K.; Suzuki, G.; Nunome, T.; Hatakeyama, K.; Mukai, Y.; Fukuoka, H.; Matsumoto, S. Microstructure of a Brassica rapa genome segment homoeologous to the resistance gene cluster on Arabidopsis chromosome 4. Breed. Sci. 2012, 62, 170–177. [Google Scholar] [CrossRef] [Green Version]
  40. Hatakeyama, K.; Suwabe, K.; Tomita, R.N.; Kato, T.; Nunome, T.; Fukuoka, H.; Matsumoto, S. Identification and Characterization of Crr1a, a Gene for Resistance to Clubroot Disease (Plasmodiophora brassicae Woronin) in Brassica rapa L. PLoS ONE 2013, 8, e54745. [Google Scholar] [CrossRef]
  41. Ueno, H.; Matsumoto, E.; Aruga, D.; Kitagawa, S.; Matsumura, H.; Hayashida, N. Molecular characterization of the CRa gene conferring clubroot resistance in Brassica rapa. Plant Mol. Biol. 2012, 80, 621–629. [Google Scholar] [CrossRef] [PubMed] [Green Version]
  42. Marone, D.; Russo, M.A.; Laidò, G.; De Leonardis, A.M.; Mastrangelo, A.M. Plant Nucleotide Binding Site–Leucine-Rich Repeat (NBS-LRR) Genes: Active Guardians in Host Defense Responses. Int. J. Mol. Sci. 2013, 14, 7302–7326. [Google Scholar] [CrossRef] [Green Version]
  43. Hasan, M.J.; Strelkov, S.E.; Howard, R.J.; Rahman, H. Screening of Brassica germplasm for resistance to Plasmodiophora brassicae pathotypes prevalent in Canada for broadening diversity in clubroot resistance. Can. J. Plant Sci. 2012, 92, 501–515. [Google Scholar] [CrossRef] [Green Version]
  44. Hasan, M.J.; Rahman, H. Genetics and molecular mapping of resistance to Plasmodiophora brassicae pathotypes 2, 3, 5, 6, and 8 in rutabaga (Brassica napus var. napobrassica). Genome 2016, 59, 805–815. [Google Scholar] [CrossRef] [Green Version]
  45. Strelkov, S.E.; Hwang, S.-F.; Manolii, V.P.; Cao, T.; Fredua-Agyeman, R.; Harding, M.W.; Peng, G.; Gossen, B.D.; McDonald, M.R.; Feindel, D. Virulence and pathotype classification of Plasmodiophora brassicae populations collected from clubroot resistant canola (Brassica napus) in Canada. Can. J. Plant Pathol. 2018, 40, 284–298. [Google Scholar] [CrossRef]
  46. Dakouri, A.; Zhang, X.; Peng, G.; Falk, K.C.; Gossen, B.D.; Strelkov, S.E.; Yu, F. Analysis of genome-wide variants through bulked segregant RNA sequencing reveals a major gene for resistance to Plasmodiophora brassicae in Brassica oleracea. Sci. Rep. 2018, 8, 17657. [Google Scholar] [CrossRef]
  47. Dean, A. On a chromosome far, far away: LCRs and gene expression. Trends Genet. 2006, 22, 38–45. [Google Scholar] [CrossRef]
  48. Baulcombe, D. Reaping Benefits of Crop Research. Science 2010, 327, 761. [Google Scholar] [CrossRef] [PubMed] [Green Version]
  49. Van Nimwegen, K.; Van Soest, R.A.; Veltman, J.A.; Nelen, M.R.; Van Der Wilt, G.J.; Vissers, L.E.; Grutters, J.P. Is the $1000 Genome as Near as We Think? A Cost Analysis of Next-Generation Sequencing. Clin. Chem. 2016, 62, 1458–1464. [Google Scholar] [CrossRef] [Green Version]
  50. Mammadov, J.; Aggarwal, R.; Buyyarapu, R.; Kumpatla, S. SNP Markers and Their Impact on Plant Breeding. Int. J. Plant Genom. 2012, 2012, 1–11. [Google Scholar] [CrossRef]
  51. Takano, S.; Matsuda, S.; Kinoshita, N.; Shimoda, N.; Sato, T.; Kato, K. Genome-wide single nucleotide polymorphisms and insertion–deletions of Oryza sativa L. subsp. japonica cultivars grown near the northern limit of rice cultivation. Mol. Breed. 2014, 34, 1007–1021. [Google Scholar] [CrossRef]
  52. Sathya, B.; Dharshini, A.P.; Kumar, G.R. NGS meta data analysis for identification of SNP and INDEL patterns in human airway transcriptome: A preliminary indicator for lung cancer. Appl. Transl. Genom. 2014, 4, 4–9. [Google Scholar] [CrossRef] [Green Version]
  53. Scheben, A.; Batley, J.; Edwards, D. Genotyping-by-sequencing approaches to characterize crop genomes: Choosing the right tool for the right application. Plant Biotechnol. J. 2017, 15, 149–161. [Google Scholar] [CrossRef] [PubMed] [Green Version]
  54. Wang, Z.; Gerstein, M.; Snyder, M. RNA-Seq: A revolutionary tool for transcriptomics. Nat. Rev. Genet. 2009, 10, 57–63. [Google Scholar] [CrossRef]
  55. Li, X.; Zhu, C.; Yeh, C.-T.; Wu, W.; Takacs, E.M.; Petsch, K.A.; Tian, F.; Bai, G.; Buckler, E.S.; Muehlbauer, G.J.; et al. Genic and nongenic contributions to natural variation of quantitative traits in maize. Genome Res. 2012, 22, 2436–2444. [Google Scholar] [CrossRef] [Green Version]
  56. Pennisi, E. The Human Genome. Science 2001, 291, 1177–1180. [Google Scholar] [CrossRef]
  57. Yu, F.; Zhang, X.; Huang, Z.; Chu, M.; Song, T.; Falk, K.C.; Deora, A.; Chen, Q.; Zhang, Y.; McGregor, L.; et al. Identification of Genome-Wide Variants and Discovery of Variants Associated with Brassica rapa Clubroot Resistance Gene Rcr1 through Bulked Segregant RNA Sequencing. PLoS ONE 2016, 11, e0153218. [Google Scholar] [CrossRef]
  58. Wang, X.; The Brassica rapa Genome Sequencing Project Consortium; Wang, H.; Sun, R.; Wu, J.; Liu, S.; Bai, Y.; Mun, J.-H.; Bancroft, I.; Cheng, F.; et al. The genome of the mesopolyploid crop species Brassica rapa. Nat. Genet. 2011, 43, 1035–1039. [Google Scholar] [CrossRef] [Green Version]
  59. Chang, A.; Lamara, M.; Wei, Y.; Hu, H.; Parkin, I.A.; Gossen, B.D.; Peng, G.; Yu, F. Clubroot resistance gene Rcr6 in Brassica nigra resides in a genomic region homologous to chromosome A08 in B. rapa. BMC Plant Biol. 2019, 19, 224. [Google Scholar] [CrossRef]
  60. Takagi, H.; Abe, A.; Yoshida, K.; Kosugi, S.; Natsume, S.; Mitsuoka, C.; Uemura, A.; Utsushi, H.; Tamiru, M.; Takuno, S.; et al. QTL-seq: Rapid mapping of quantitative trait loci in rice by whole genome resequencing of DNA from two bulked populations. Plant J. 2013, 74, 174–183. [Google Scholar] [CrossRef]
  61. Trick, M.; Adamski, N.M.; Mugford, S.G.; Jiang, C.-C.; Febrer, M.; Uauy, C. Combining SNP discovery from next-generation sequencing data with bulked segregant analysis (BSA) to fine-map genes in polyploid wheat. BMC Plant Biol. 2012, 12, 14. [Google Scholar] [CrossRef] [PubMed] [Green Version]
  62. Wit, F. The use of inbred lines in turnips breeding. Qualitas Plantarum et Materiae Vegetabiles 1966, 13, 305–310. [Google Scholar] [CrossRef]
  63. Van ooijen, J.V.; Voorrips, R.E. Join Map ® 3.0, Software for the Calculation of Genetic Linkage Maps, Plant Research International: Wageningen, The Netherlands, 2001.
  64. Kosambi, D.D. The estimation of map distances from recombination values. Ann. Eugen. 1943, 12, 172–175. [Google Scholar] [CrossRef]
  65. Conesa, A.; Götz, S.; García-Gómez, J.M.; Terol, J.; Talon, M.; Robles, M. Blast2GO: A universal tool for annotation, visualization and analysis in functional genomics research. Bioinformatics 2005, 21, 3674–3676. [Google Scholar] [CrossRef] [PubMed] [Green Version]
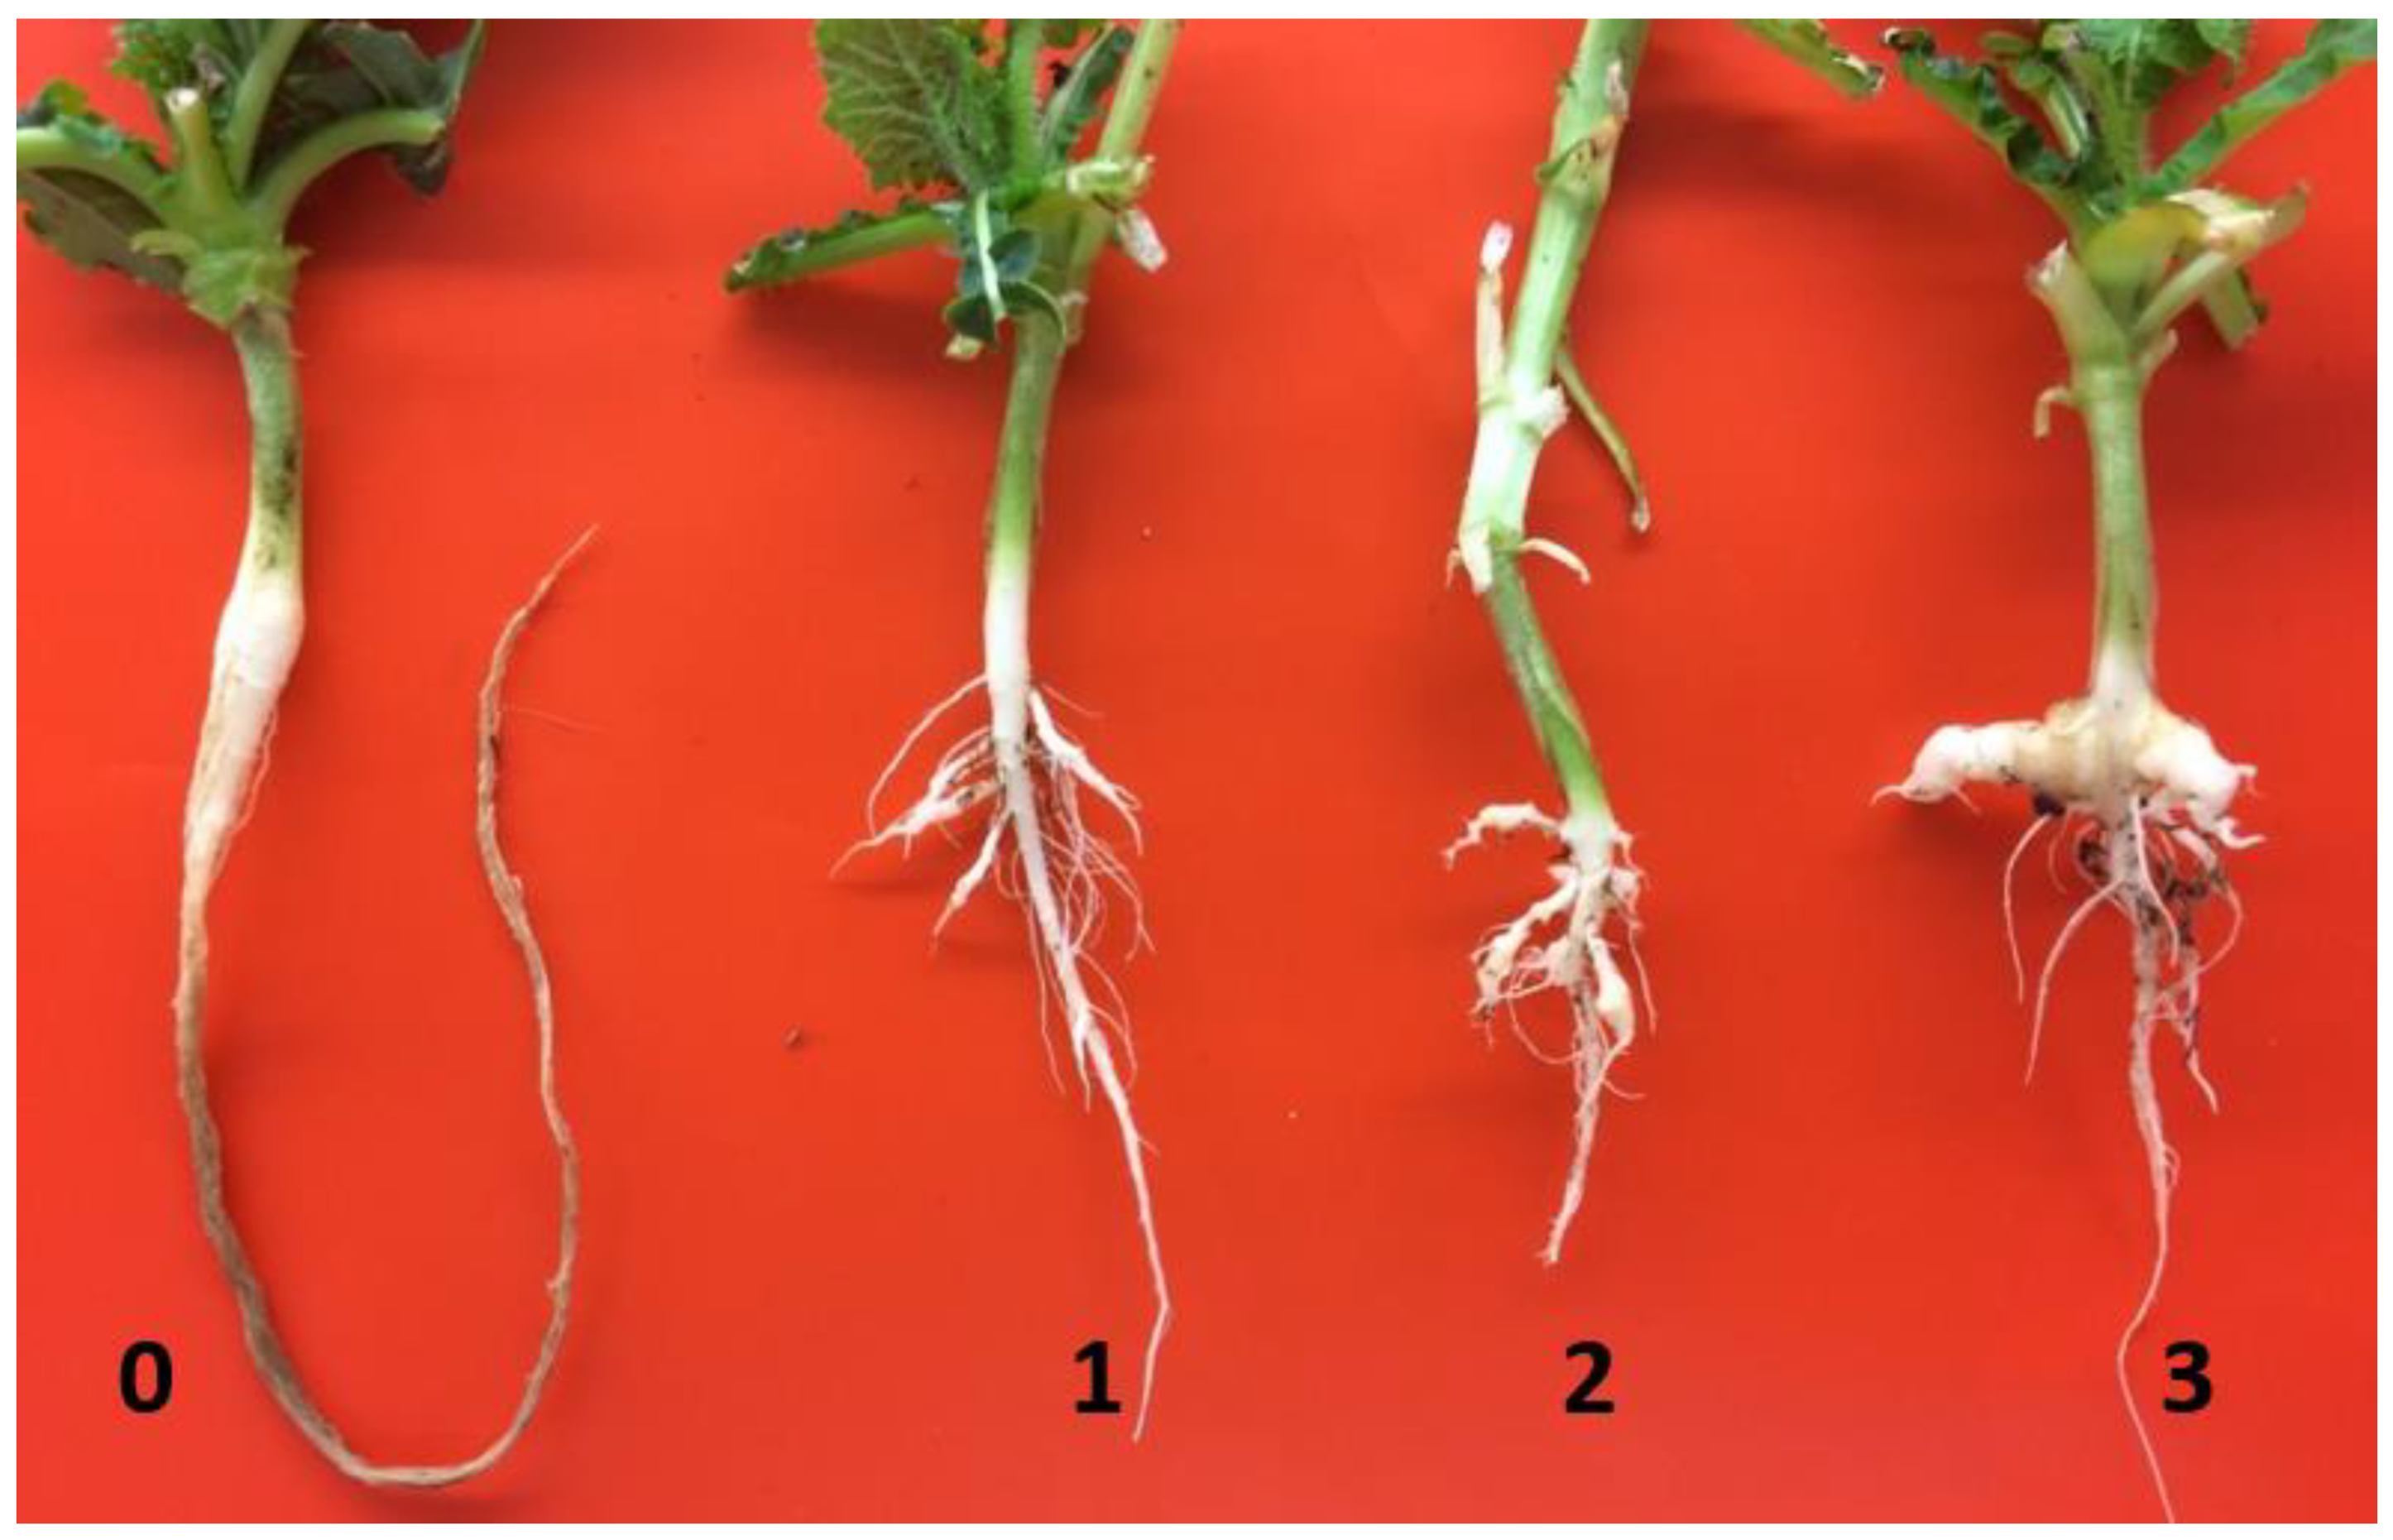
Figure 1. Clubroot reaction to pathotype 3H of the BC1 population derived from ACDC × (ACDC × 96-6990-2) at 6 weeks after inoculation; 0 = no clubs, 1 = a few small clubs, 2 = moderate clubbing, 3 = large clubs on the main and lateral roots.
Ijms 21 05033 g001
Figure 2. Analysis of bulked segregant RNA-Seq (BSR-Seq) to map Rcr3 based on the reference genome of Brassica rapa: (a) the percentage (%) of monomorphic and polymorphic variants on each chromosome; (b) % polymorphic variants on chromosome A08.
Ijms 21 05033 g002
Figure 3. Genetic linkage map based on BC1 populations of Brassica rapa line 96-6990-2; (a) genetic map of the region in which the Rcr3 gene is located (genetic distance on right), and (b) physical location of the Rcr3 region (in bases, on right), with SNP markers connected with a broken line between the maps.
Ijms 21 05033 g003
Figure 4. Genetic linkage map based on BC1 populations of Brassica rapa line 96-6990-2; (a) genetic map of the region in which the Rcr9wa gene is located (genetic distance on right), and (b) physical location of the Rcr9wa region (in bases, on right), with SNP markers connected with a broken line between the maps.
Ijms 21 05033 g004
Table 1. Clubroot reaction (resistant, R; susceptible, S) to pathotypes 3H and 5X of Plasmodiophora brassicae in parental lines, F1, and backcross (BC1) progeny in crosses between Brassica rapa lines 96-6990-2 and ACDC, compared to an expected ratio of 1:1.
Parents and CrossesTypeClubroot Rating (0-3)No. of Plants and Analysis
0123TotalRSχ2P
Pathotype 3H
96-6990-2R parent1400014140
ACDCS parent0001414014
ACDC × 96-6990-2F17000770
96-6990-2 × ACDCF17000770
ACDC × F1 BC1118001222401181220.060.81
Pathotype 5X
96-6990-2R parent7000770
ACDCS parent0002707
ACDC × 96-6990-2F11400014140
96-6990-2 × ACDCF11400014140
ACDC × F1BC177006013777602.100.15
A rating of 0 was defined as R, and ratings of 1–3 as S.
Table 2. Length and number of short read sequences assembled into chromosomes of the reference genome Brassica rapa ‘Chifu’ v1.5 in pooled sample assembly in the resistant (R) and susceptible (S) bulks of plants inoculated with pathotype 3H.
Chrom.Ref. Genome Length (Mb)Length of Accumulated Sequence (Mb)Reads per Strand (×106)
TopBottomTotal
RSRSRSRS
A0126.9782.1703.15.24.75.24.610.49.3
A0227.0676.3607.94.64.14.44.09.08.1
A0331.91127.51012.47.56.77.46.714.913.4
A0419.3601.4548.94.13.73.93.68.07.3
A0525.4733.6668.14.94.54.84.49.78.9
A0625.3912.2799.26.15.36.05.312.110.6
A0725.9805.1732.05.44.95.34.810.79.7
A0820.9724.6669.34.84.54.84.49.68.9
A0939.01186.21077.97.97.27.87.115.714.3
A1016.4563.2513.53.83.43.73.47.56.8
Total257.98112.17332.354.249.053.348.2107.597.1
Table 3. Single nucleotide polymorphisms (SNPs), Insertions and deletions (InDels), and total variants identified in resistant (R) and susceptible (S) bulks relative to the Brassica rapa reference genome v1.5.
Chrom.SNPs InDels Total
(×1000) (×1000) (×1000)
RSRSRS
A0157.556.16.16.063.662.0
A0253.852.15.65.459.457.5
A0387.186.59.19.096.295.5
A0437.936.23.93.841.840.0
A0558.057.06.26.164.263.1
A0660.460.57.06.867.467.4
A0758.256.46.05.964.262.3
A0848.042.85.24.953.247.7
A0980.479.414.414.294.893.5
A1044.444.04.84.749.248.7
Total585.8571.068.366.6654.1637.7