Robust and Scalable Angiogenesis Assay of Perfused 3D Human iPSC-Derived Endothelium for Anti-Angiogenic Drug Screening

 ,
,
Abstract
1. Introduction
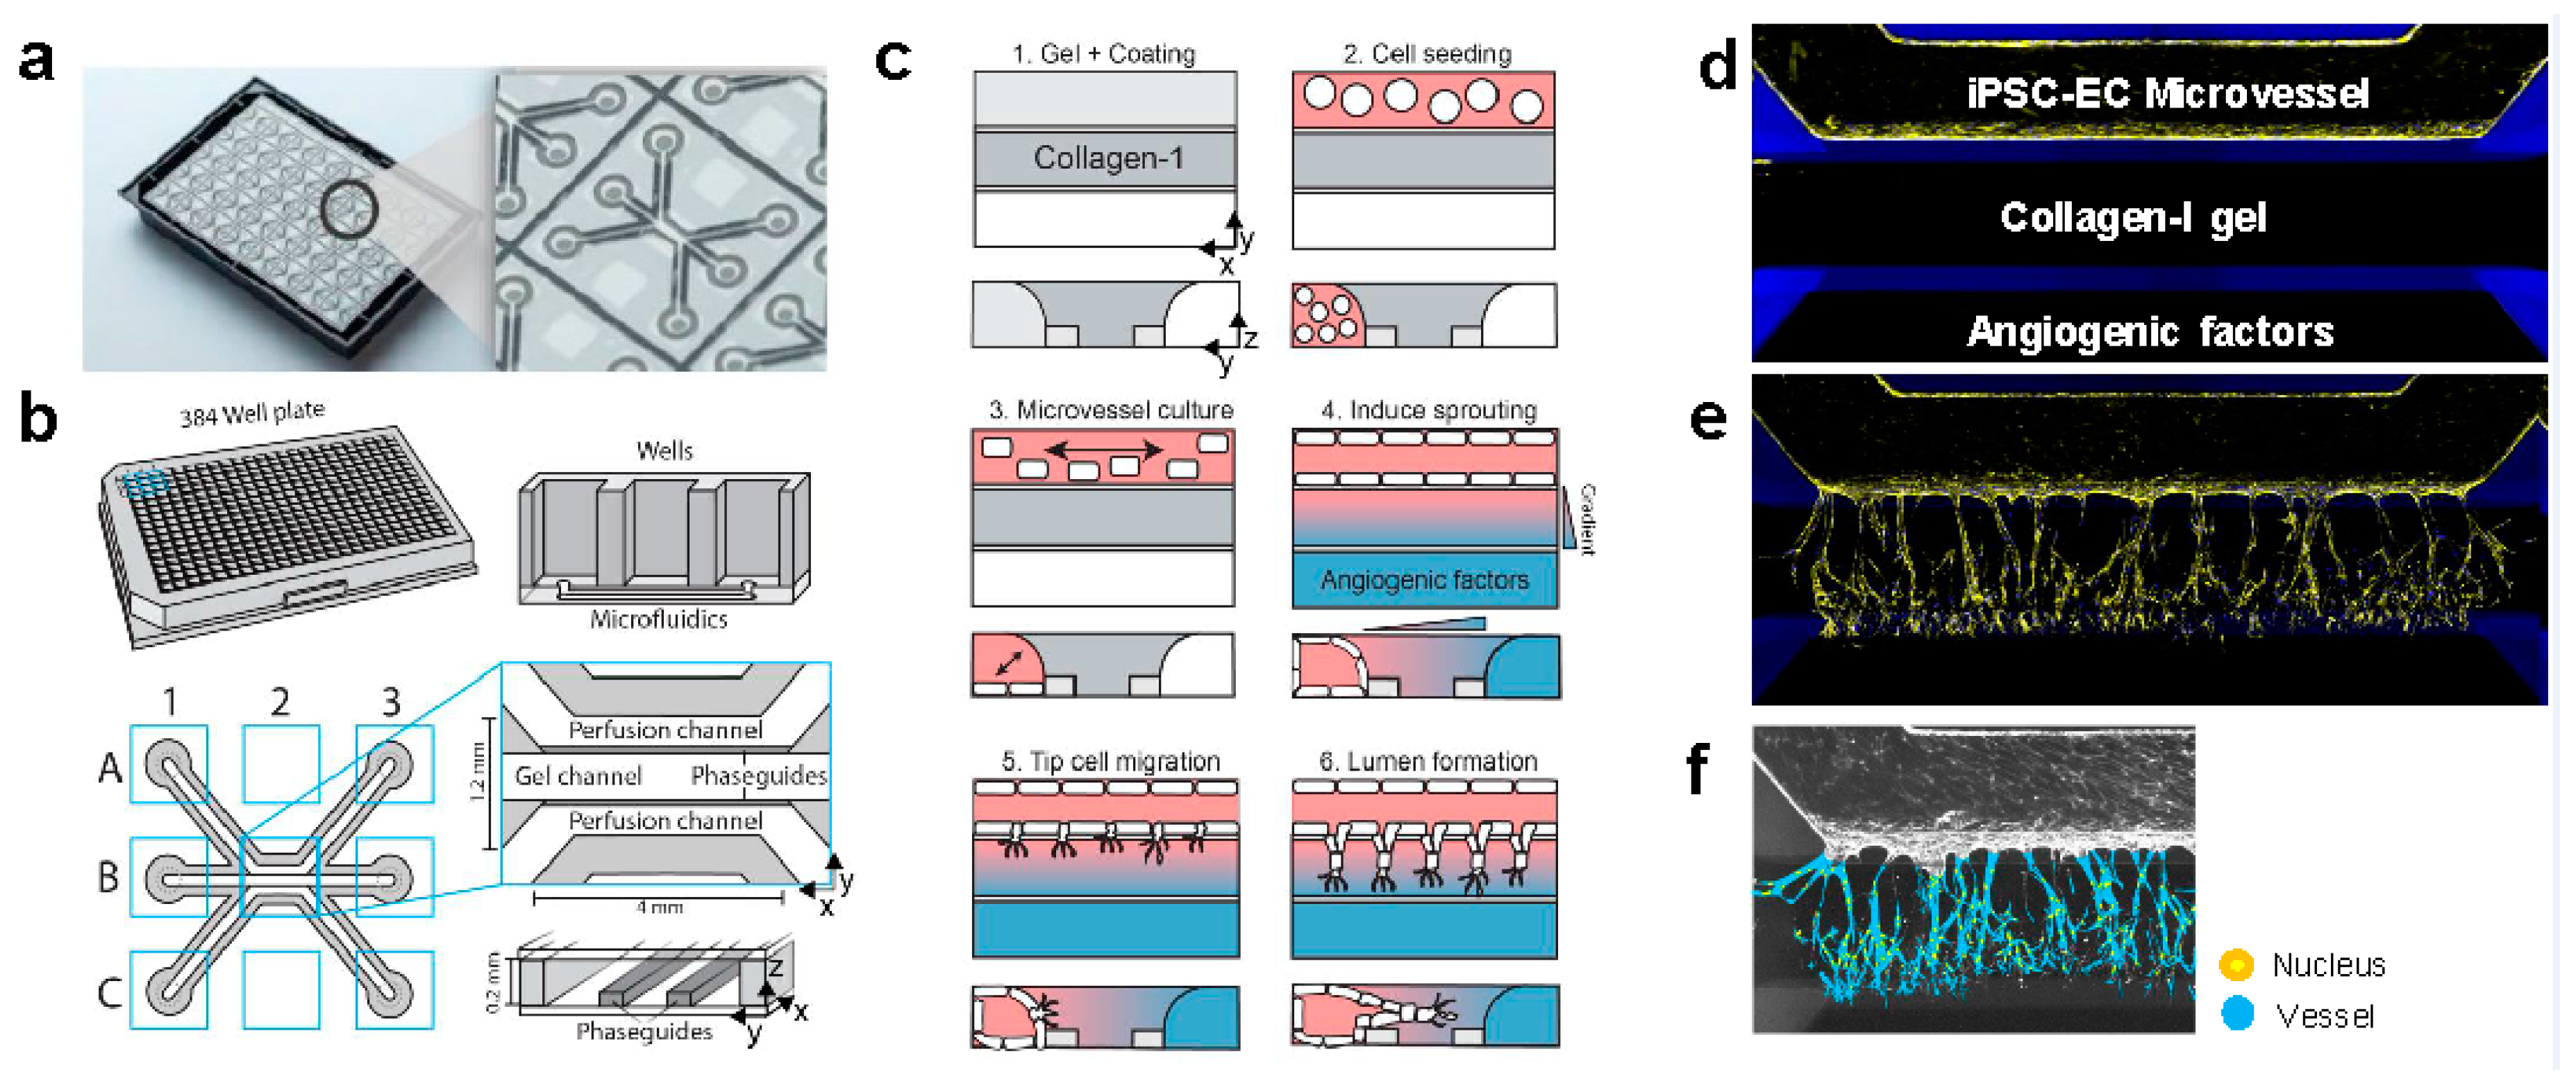
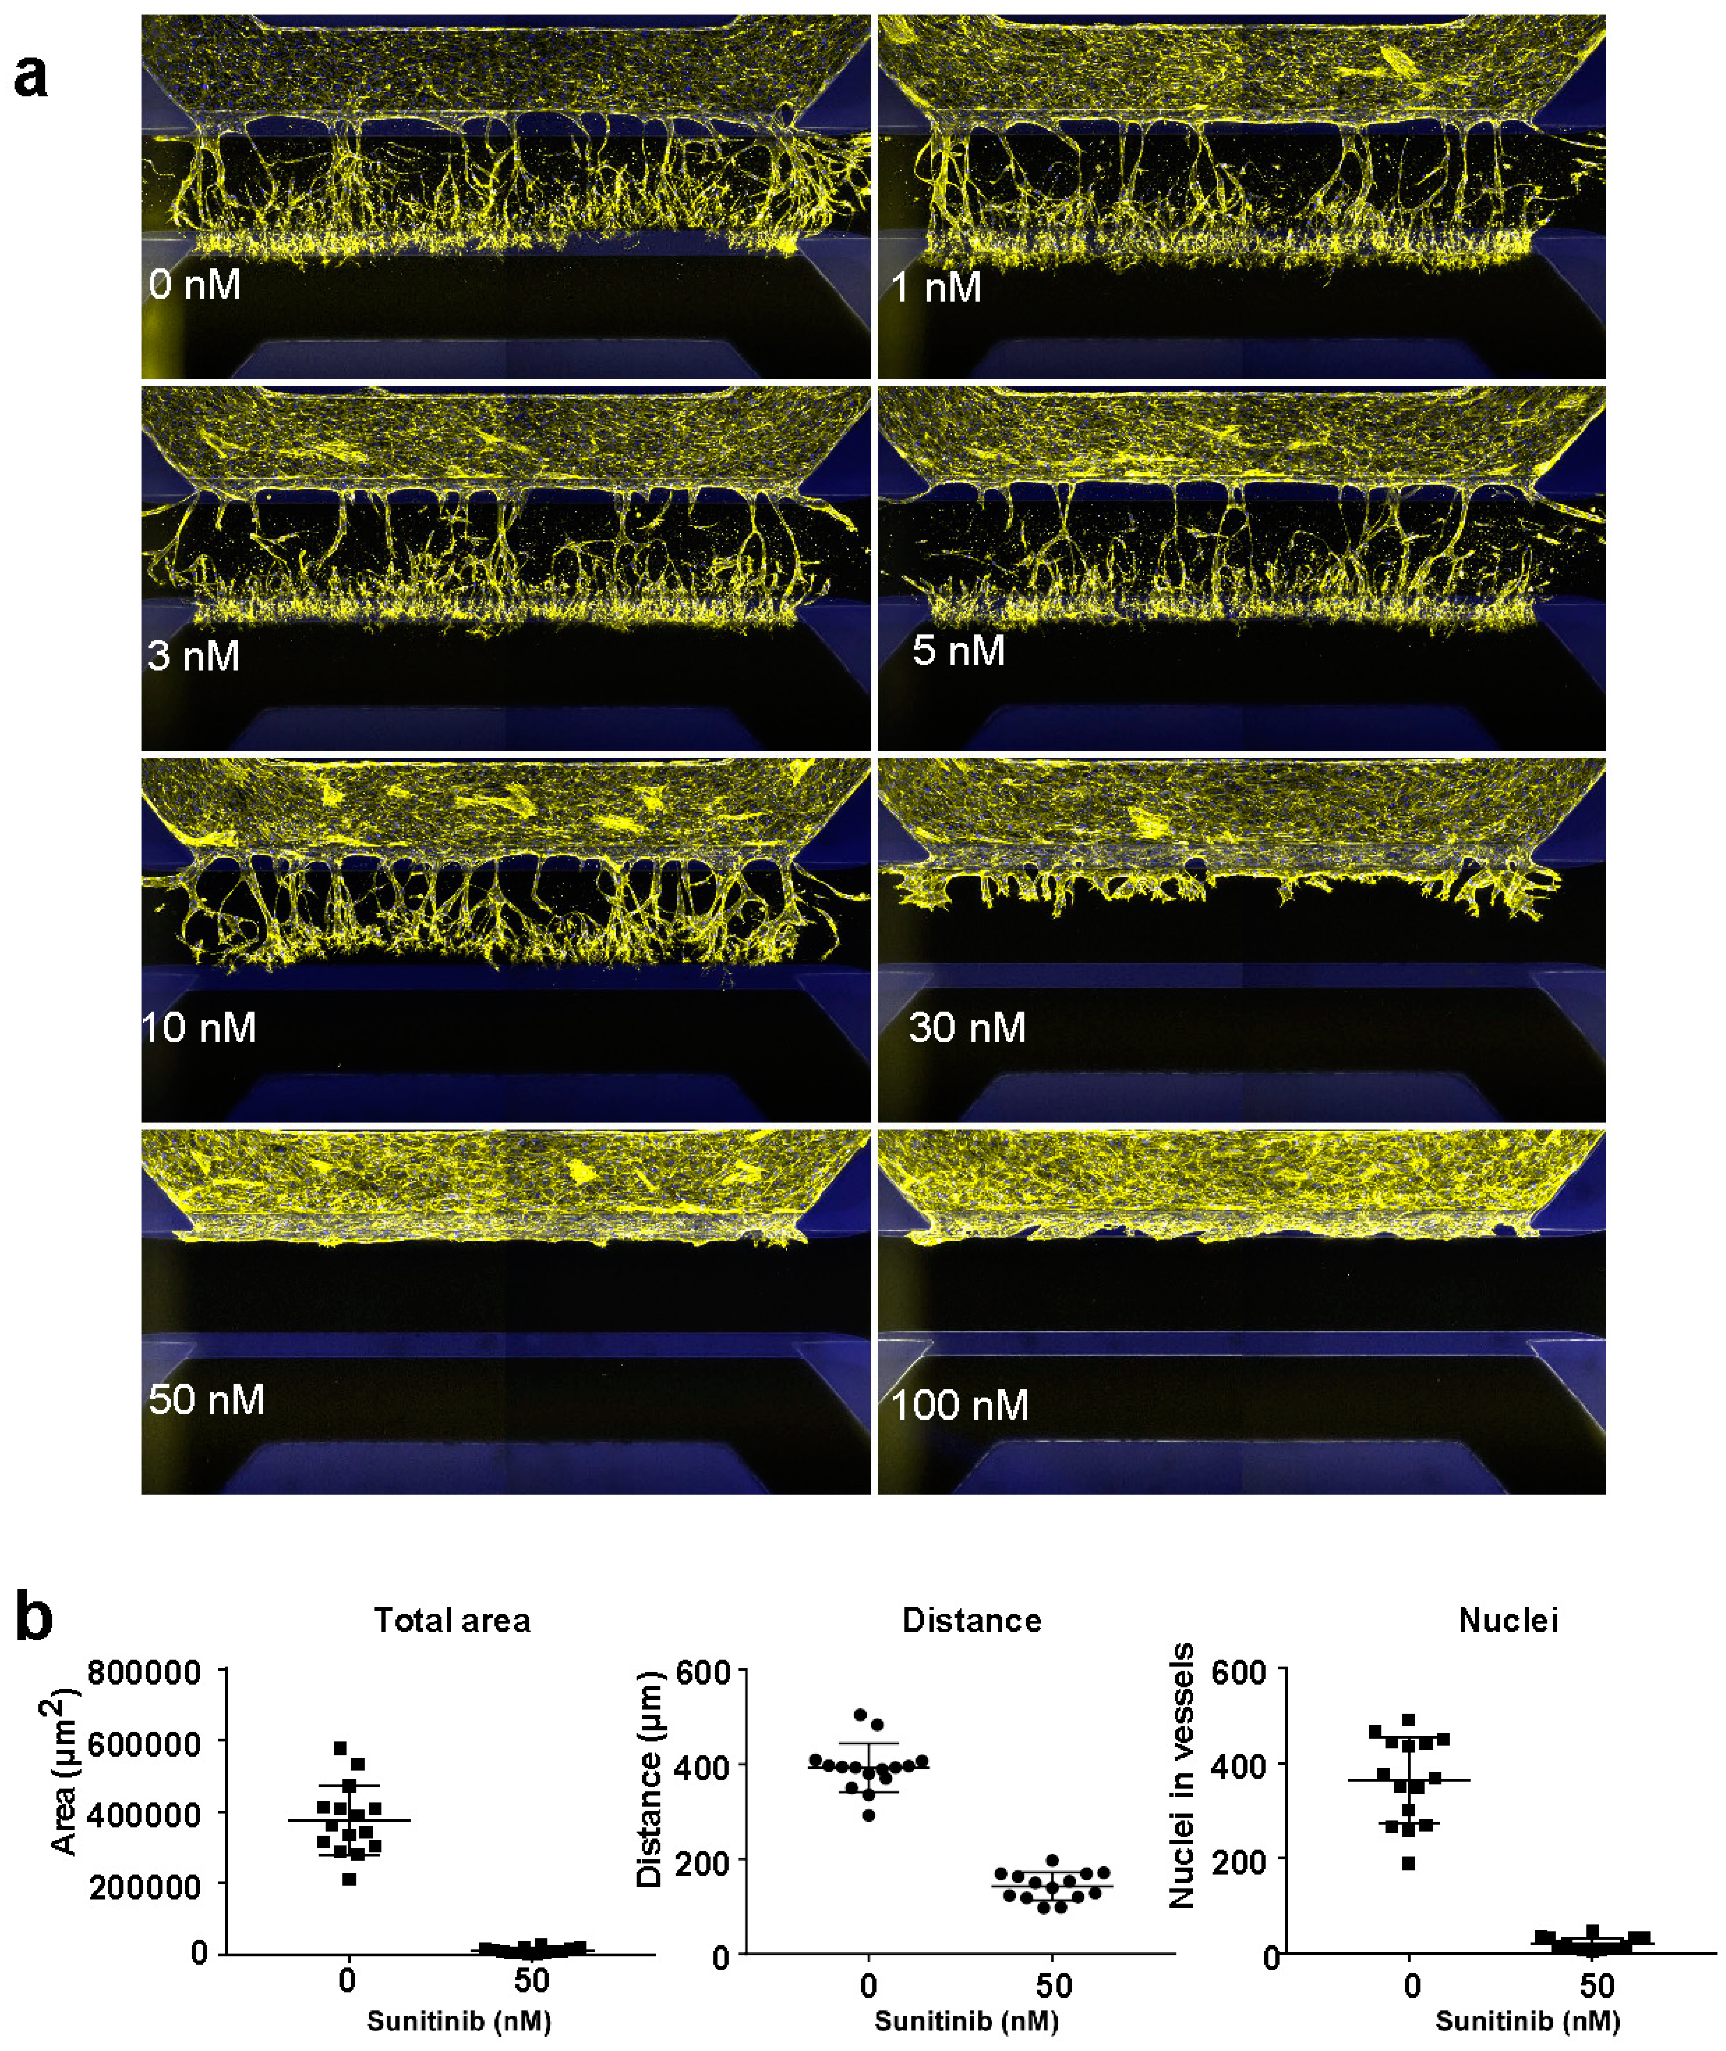
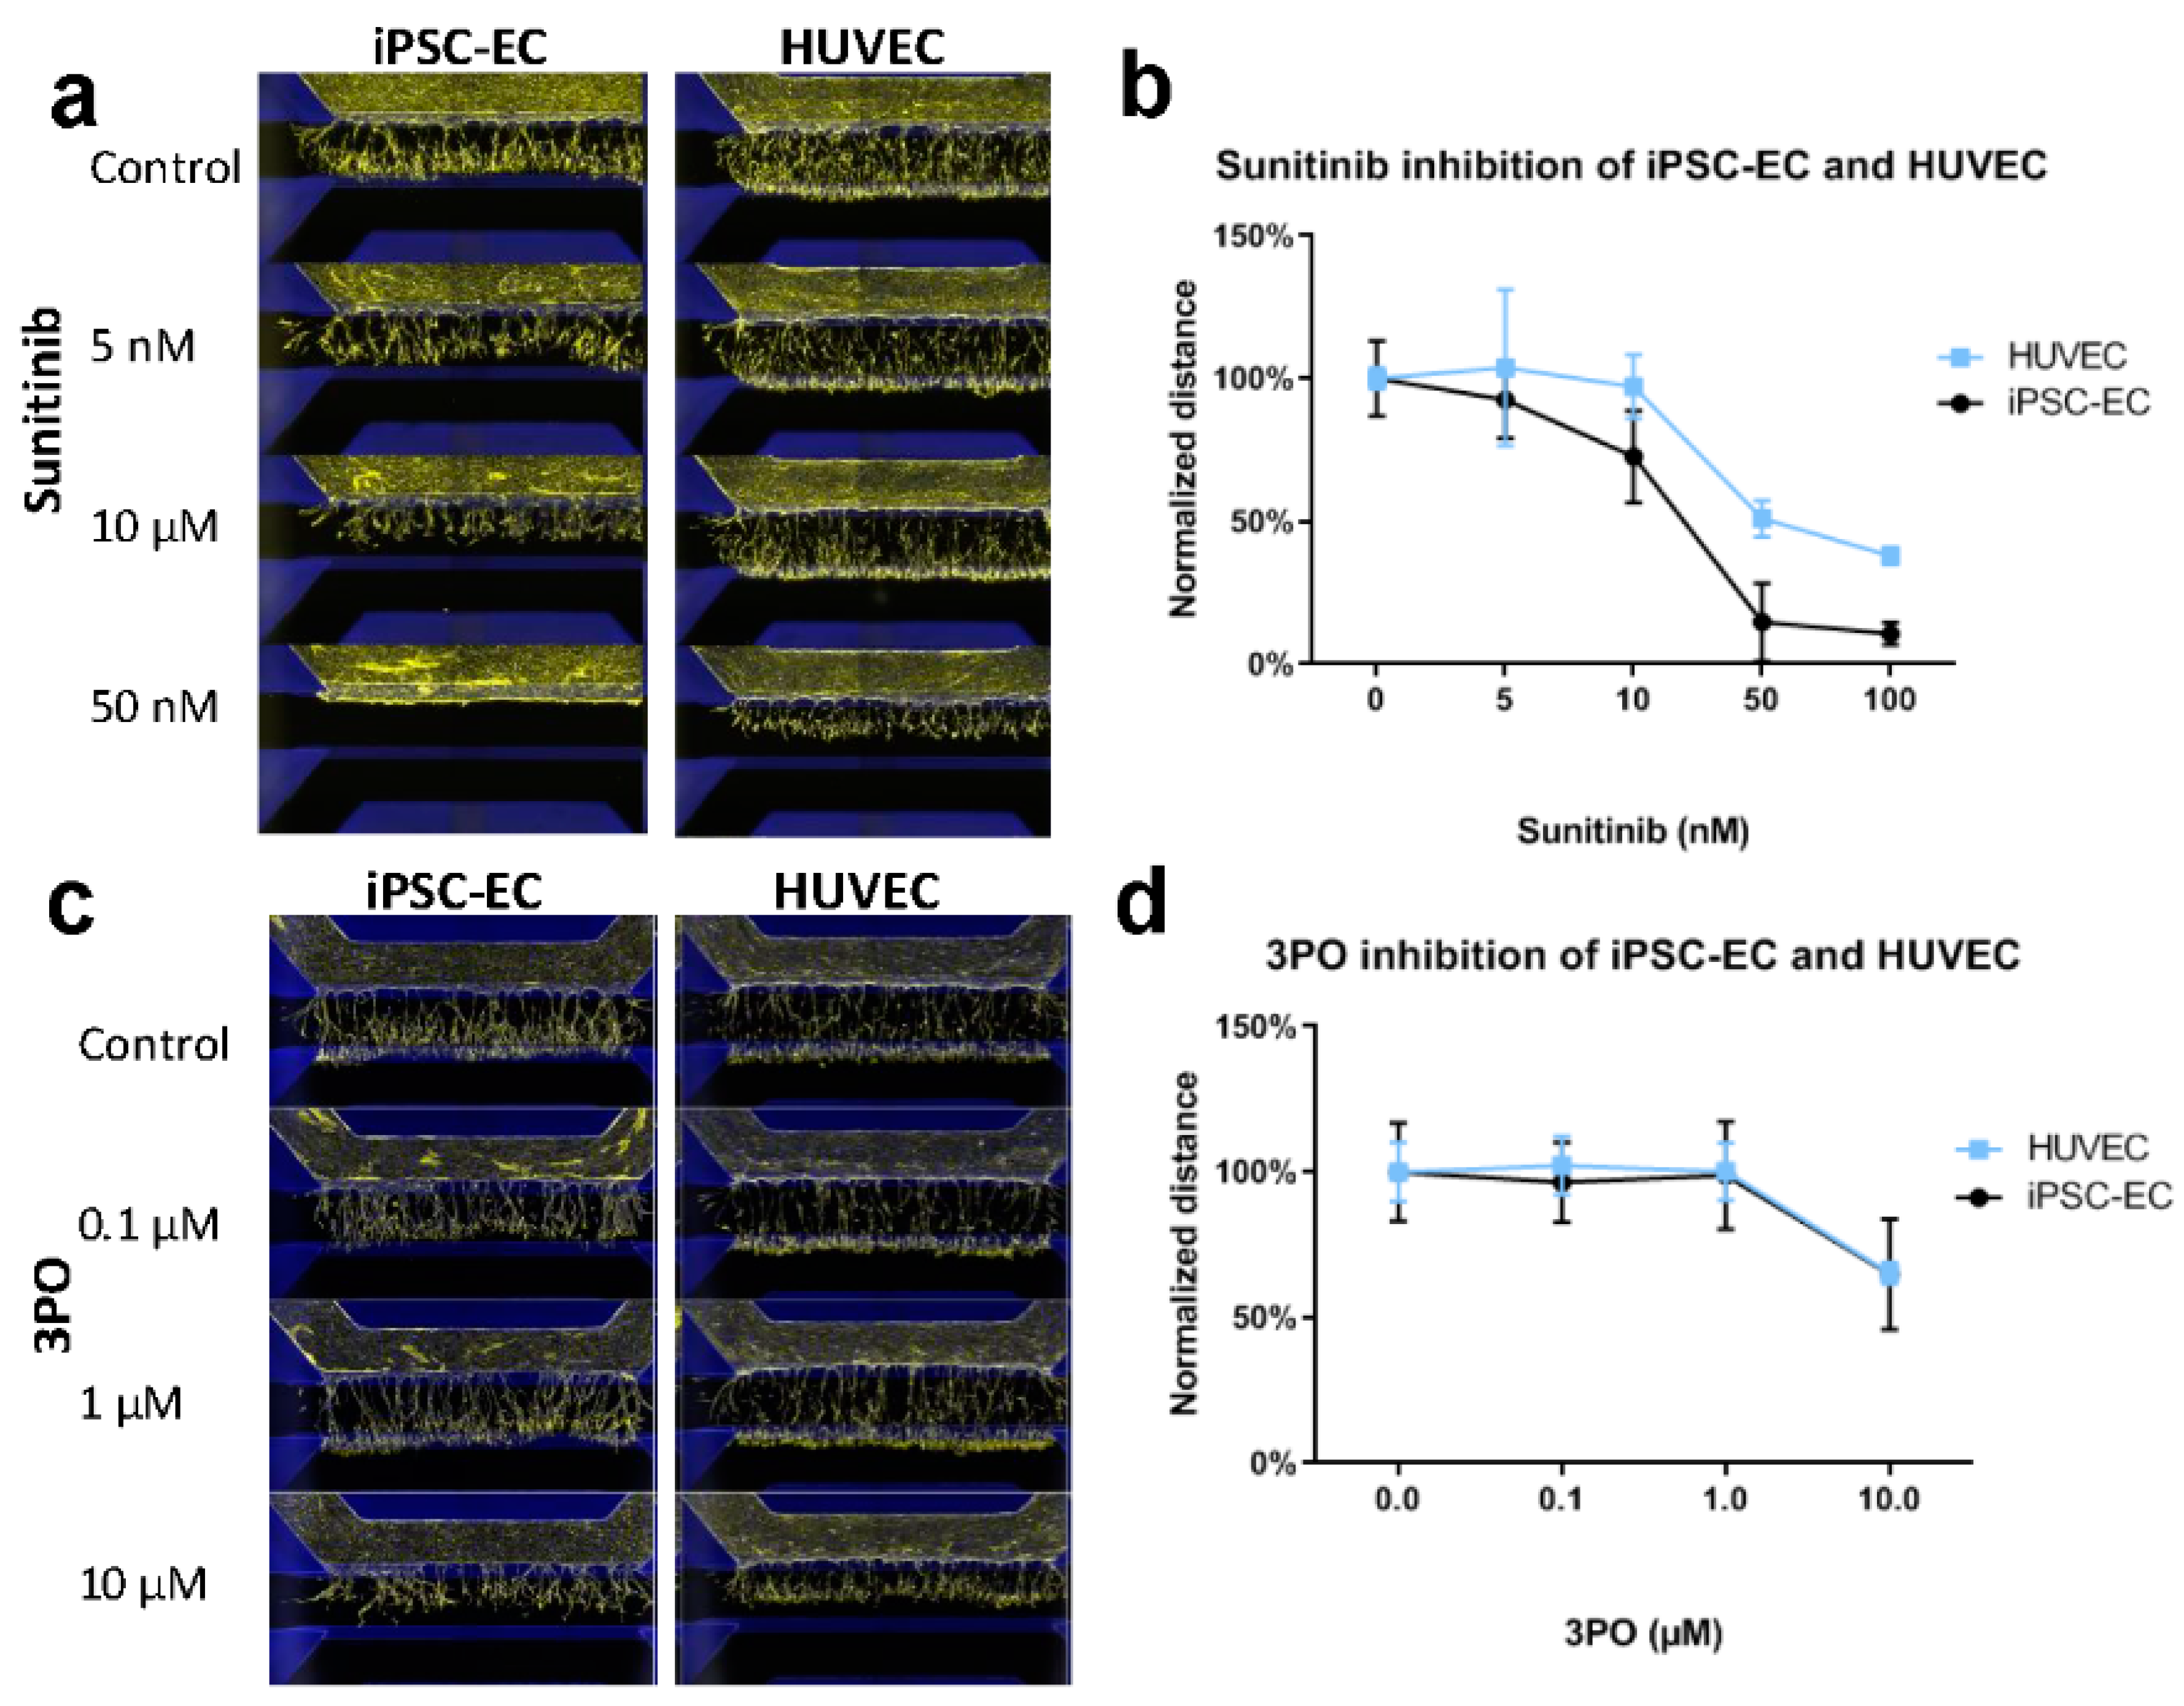
2. Results
3. Discussion
4. Materials and Methods
4.1. Device Preparation and Cell Culture in Microfluidic Channels
4.2. Inhibition of Angiogenic Sprouting
4.3. Fixation, Staining and Imaging
4.4. Sprouting Quantification
4.5. Assay Performance Quantification and Plate Acceptance Criteria
5. Conclusions
Supplementary Materials
Author Contributions
Funding
Conflicts of Interest
References
- Wong, B.W.; Marsch, E.; Treps, L.; Baes, M.; Carmeliet, P. Endothelial cell metabolism in health and disease: Impact of hypoxia. EMBO J. 2017, 36, 2187–2203. [Google Scholar] [CrossRef] [PubMed]
- Horvath, P.; Aulner, N.; Bickle, M.; Davies, A.M.; Del Nery, E.; Ebner, D.; Montoya, M.C.; Östling, P.; Pietiäinen, V.; Price, L.; et al. Screening out irrelevant cell-based models of disease. Nat. Rev. Drug Discov. 2016, 15, 751–769. [Google Scholar] [CrossRef]
- Eglen, R.M.; Randle, D.H. Drug Discovery Goes Three-Dimensional: Goodbye to Flat High-Throughput Screening? ASSAY Drug Dev. Technol. 2015, 13, 262–265. [Google Scholar] [CrossRef] [PubMed]
- Nowak-Sliwinska, P.; Alitalo, K.; Allen, E.; Anisimov, A.; Aplin, A.C.; Auerbach, R.; Augustin, H.G.; Bates, D.O.; Van Beijnum, J.R.; Bender, R.H.F.; et al. Consensus guidelines for the use and interpretation of angiogenesis assays. Angiogenesis 2018, 21, 425–532. [Google Scholar] [CrossRef] [PubMed]
- Griffith, L.G.; Swartz, M.A. Capturing complex 3D tissue physiology in vitro. Nat. Rev. Mol. Cell Biol. 2006, 7, 211–224. [Google Scholar] [CrossRef] [PubMed]
- Davis, G.E.; Kim, D.J.; Meng, C.; Norden, P.R.; Speichinger, K.R.; Davis, M.T.; Smith, A.O.; Bowers, S.L.K.; Stratman, A.N. Control of Vascular Tube Morphogenesis and Maturation in 3D Extracellular Matrices by Endothelial Cells and Pericytes. Methods Mol. Biol. 2013, 1066, 17–28. [Google Scholar] [CrossRef] [PubMed]
- Smith, A.O.; Bowers, S.L.K.; Stratman, A.N.; Davis, G.E. Hematopoietic Stem Cell Cytokines and Fibroblast Growth factor-2 Stimulate Human Endothelial Cell-Pericyte Tube Co-Assembly in 3D Fibrin Matrices under Serum-Free Defined Conditions. PLoS ONE 2013, 8, e85147. [Google Scholar] [CrossRef]
- Van Duinen, V.; Trietsch, S.J.; Joore, J.; Vulto, P.; Hankemeier, T. Microfluidic 3D cell culture: From tools to tissue models. Curr. Opin. Biotechnol. 2015, 35, 118–126. [Google Scholar] [CrossRef]
- Kim, S.; Chung, M.; Jeon, N.L. Three-dimensional biomimetic model to reconstitute sprouting lymphangiogenesis in vitro. Biomaterials 2016, 78, 115–128. [Google Scholar] [CrossRef]
- Kim, C.; Kasuya, J.; Jeon, J.; Chung, S.; Kamm, R.D. A quantitative microfluidic angiogenesis screen for studying anti-angiogenic therapeutic drugs. Lab Chip 2015, 15, 301–310. [Google Scholar] [CrossRef]
- Kim, J.; Chung, M.; Kim, S.; Jo, D.H.; Kim, J.H.; Jeon, N.L. Engineering of a Biomimetic Pericyte-Covered 3D Microvascular Network. PLoS ONE 2015, 10, e0133880. [Google Scholar] [CrossRef]
- Tourovskaia, A.; Fauver, M.; Kramer, G.; Simonson, S.; Neumann, T. Tissue-engineered microenvironment systems for modeling human vasculature. Exp. Biol. Med. 2014, 239, 1264–1271. [Google Scholar] [CrossRef] [PubMed]
- Van Duinen, V.; Stam, W.; Borgdorff, V.; Reijerkerk, A.; Orlova, V.; Vulto, P.; Hankemeier, T.; Van Zonneveld, A.J. Standardized and Scalable Assay to Study Perfused 3D Angiogenic Sprouting of iPSC-derived Endothelial Cells In vitro. J. Vis. Exp. 2019, 2019, e59678. [Google Scholar] [CrossRef]
- Yamamoto, K.; Tanimura, K.; Watanabe, M.; Sano, H.; Uwamori, H.; Mabuchi, Y.; Matsuzaki, Y.; Chung, S.; Kamm, R.D.; Tanishita, K.; et al. Construction of Continuous Capillary Networks Stabilized by Pericyte-like Perivascular Cells. Tissue Eng. Part A 2019, 25, 499–510. [Google Scholar] [CrossRef]
- Song, J.W.; Munn, L.L. Fluid forces control endothelial sprouting. Proc. Natl. Acad. Sci. USA 2011, 108, 15342–15347. [Google Scholar] [CrossRef]
- Junaid, A.; Mashaghi, A.; Hankemeier, T.; Vulto, P. An end-user perspective on Organ-on-a-Chip: Assays and usability aspects. Curr. Opin. Biomed. Eng. 2017, 1, 15–22. [Google Scholar] [CrossRef]
- Pagano, G.; Ventre, M.; Iannone, M.; Greco, F.; Maffettone, P.L.; Netti, P. Optimizing design and fabrication of microfluidic devices for cell cultures: An effective approach to control cell microenvironment in three dimensions. Biomicrofluidics 2014, 8, 046503. [Google Scholar] [CrossRef]
- Berthier, E.; Young, E.W.K.; Beebe, D. Engineers are from PDMS-land, Biologists are from Polystyrenia. Lab Chip 2012, 12, 1224. [Google Scholar] [CrossRef] [PubMed]
- Passier, R.; Orlova, V.V.; Mummery, C.L. Complex Tissue and Disease Modeling using hiPSCs. Cell Stem Cell 2016, 18, 309–321. [Google Scholar] [CrossRef] [PubMed]
- Van Duinen, V.; Zhu, D.; Ramakers, C.; Van Zonneveld, A.J.; Vulto, P.; Hankemeier, T. Perfused 3D angiogenic sprouting in a high-throughput in vitro platform. Angiogenesis 2018, 22, 157–165. [Google Scholar] [CrossRef] [PubMed]
- Schoors, S.; De Bock, K.; Cantelmo, A.R.; Georgiadou, M.; Ghesquière, B.; Cauwenberghs, S.; Kuchnio, A.; Wong, B.W.; Quaegebeur, A.; Goveia, J.; et al. Partial and Transient Reduction of Glycolysis by PFKFB3 Blockade Reduces Pathological Angiogenesis. Cell Metab. 2014, 19, 37–48. [Google Scholar] [CrossRef] [PubMed]
- Vulto, P.; Podszun, S.; Meyer, P.A.; Hermann, C.; Manz, A.; Urban, G.A. Phaseguides: A paradigm shift in microfluidic priming and emptying. Lab Chip 2011, 11, 1596. [Google Scholar] [CrossRef]
- Iversen, P.W.; Eastwood, B.J.; Sittampalam, G.S.; Cox, K.L. A Comparison of Assay Performance Measures in Screening Assays: Signal Window, Z’ Factor, and Assay Variability Ratio. J. Biomol. Screen. 2006, 11, 247–252. [Google Scholar] [CrossRef]
- Arima, S.; Nishiyama, K.; Ko, T.; Arima, Y.; Hakozaki, Y.; Sugihara, K.; Koseki, H.; Uchijima, Y.; Kurihara, Y.; Kurihara, H. Angiogenic morphogenesis driven by dynamic and heterogeneous collective endothelial cell movement. Development 2011, 138, 4763–4776. [Google Scholar] [CrossRef] [PubMed]
- Sharghi-Namini, S.; Tan, E.; Ong, L.L.; Ge, R.; Asada, H.H. Dll4-containing exosomes induce capillary sprout retraction in a 3D microenvironment. Sci. Rep. 2014, 4, 4031. [Google Scholar] [CrossRef]
- Bentley, K.; Mariggi, G.; Gerhardt, H.; Bates, P.A. Tipping the Balance: Robustness of Tip Cell Selection, Migration and Fusion in Angiogenesis. PLoS Comput. Biol. 2009, 5, e1000549. [Google Scholar] [CrossRef]
- Tiemeier, G.L.; De Koning, R.; Wang, G.; Kostidis, S.; Rietjens, R.G.J.; Sol, W.M.P.J.; Dumas, S.J.; Giera, M.; Berg, C.W.V.D.; Eikenboom, J.C.J.; et al. Lowering the increased intracellular pH of human-induced pluripotent stem cell-derived endothelial cells induces formation of mature Weibel-Palade bodies. Stem Cells Transl. Med. 2020, 9, 758–772. [Google Scholar] [CrossRef]
- Yetkin-Arik, B.; Vogels, I.M.C.; Neyazi, N.; Van Duinen, V.; Houtkooper, R.H.; Van Noorden, C.J.F.; Klaassen, I.; Schlingemann, R.O. Endothelial tip cells in vitro are less glycolytic and have a more flexible response to metabolic stress than non-tip cells. Sci. Rep. 2019, 9, 10414. [Google Scholar] [CrossRef]
- Preibisch, S.; Saalfeld, S.; Tomancak, P. Globally optimal stitching of tiled 3D microscopic image acquisitions. Bioinformatics. 2009, 25, 1463–1465. [Google Scholar] [CrossRef] [PubMed]


| Total Area | Distance | Nuclei | Reference Values [23] | |
|---|---|---|---|---|
| Signal window | 11.70 | 14.76 | 11.68 | >1 acceptable |
| Z-factor | 0.78 | 0.75 | 0.77 | >0.5 excellent |
| Assay variability ratio | 0.84 | 0.94 | 0.88 | <0.6 recommended |
| CVmax (%) | 25 | 13 | 24 | <20 acceptable |
| CVmin (%) | 70 | 20 | 71 | <20 acceptable |
© 2020 by the authors. Licensee MDPI, Basel, Switzerland. This article is an open access article distributed under the terms and conditions of the Creative Commons Attribution (CC BY) license (http://creativecommons.org/licenses/by/4.0/).
Share and Cite
van Duinen, V.; Stam, W.; Mulder, E.; Famili, F.; Reijerkerk, A.; Vulto, P.; Hankemeier, T.; van Zonneveld, A.J. Robust and Scalable Angiogenesis Assay of Perfused 3D Human iPSC-Derived Endothelium for Anti-Angiogenic Drug Screening. Int. J. Mol. Sci. 2020, 21, 4804. https://doi.org/10.3390/ijms21134804
van Duinen V, Stam W, Mulder E, Famili F, Reijerkerk A, Vulto P, Hankemeier T, van Zonneveld AJ. Robust and Scalable Angiogenesis Assay of Perfused 3D Human iPSC-Derived Endothelium for Anti-Angiogenic Drug Screening. International Journal of Molecular Sciences. 2020; 21(13):4804. https://doi.org/10.3390/ijms21134804
Chicago/Turabian Stylevan Duinen, Vincent, Wendy Stam, Eva Mulder, Farbod Famili, Arie Reijerkerk, Paul Vulto, Thomas Hankemeier, and Anton Jan van Zonneveld. 2020. "Robust and Scalable Angiogenesis Assay of Perfused 3D Human iPSC-Derived Endothelium for Anti-Angiogenic Drug Screening" International Journal of Molecular Sciences 21, no. 13: 4804. https://doi.org/10.3390/ijms21134804
APA Stylevan Duinen, V., Stam, W., Mulder, E., Famili, F., Reijerkerk, A., Vulto, P., Hankemeier, T., & van Zonneveld, A. J. (2020). Robust and Scalable Angiogenesis Assay of Perfused 3D Human iPSC-Derived Endothelium for Anti-Angiogenic Drug Screening. International Journal of Molecular Sciences, 21(13), 4804. https://doi.org/10.3390/ijms21134804