Article

Distinct Local and Systemic Molecular Signatures in the Esophageal and Gastric Cancers: Possible Therapy Targets and Biomarkers for Gastric Cancer

by
Iwona Bednarz-Misa
1,
Paulina Fortuna
1,
Dorota Diakowska
2,3,
Natalia Jamrozik
1 and
Małgorzata Krzystek-Korpacka
1,*
1
Department of Medical Biochemistry, Wroclaw Medical University, 50-368 Wroclaw, Poland
2
Department of Gastrointestinal and General Surgery, Wroclaw Medical University, 50-368 Wroclaw, Poland
3
Department of Nervous System Diseases, Wroclaw Medical University, 51-618 Wroclaw, Poland
*
Author to whom correspondence should be addressed.
Int. J. Mol. Sci. 2020, 21(12), 4509; https://doi.org/10.3390/ijms21124509
Submission received: 5 June 2020 / Revised: 23 June 2020 / Accepted: 24 June 2020 / Published: 25 June 2020
(This article belongs to the Special Issue Gastric Cancers: Molecular Pathways and Candidate Biomarkers 3.0)

Abstract

:
Gastric (GC) and esophageal (EC) cancers are highly lethal. Better understanding of molecular abnormalities is needed for new therapeutic targets and biomarkers to be found. Expression of 18 cancer-related genes in 31 paired normal-tumor samples was quantified by reversely-transcribed quantitative polymerase chain reaction (RTqPCR) and systemic concentration of 27 cytokines/chemokines/growth factors in 195 individuals was determined using Luminex xMAP technology. Only Ki67, CLDN2, and BCLxL were altered in GC while Ki67, CDKN1A, ODC1, SLC2A1, HIF1A, VEGFA, NOS2, CCL2, PTGS2, IL10, IL10Ra, and ACTA2 were changed in EC. The relatively unaltered molecular GC landscape resulted from high expression of BCLxL, CDKN1A, BCL2, Ki67, HIF1A, VEGFA, ACTA2, TJP1, CLDN2, IL7Ra, ODC1, PTGS2, and CCL2 in non-cancerous tissue. The NOS2 expression and IL-4, IL-9, FGF2, and RANTES secretion were higher in cardiac than non-cardiac GC. Four-cytokine panels (interleukin (IL)-1β/IL-1ra/IL-6/RANTES or IL-1β/IL-6/IL-4/IL-13) differentiated GC from benign conditions with 87–89% accuracy. Our results showed increased proliferative, survival, inflammatory and angiogenic capacity in gastric tumor-surrounding tissue, what might contribute to GC aggressiveness and facilitate cancer recurrence. Further studies are needed to determine the CLDN2 and NOS2 suitability as candidate molecular targets in GC and cardiac GC, respectively, and discern the role of CLDN2 or to verify IL-1β/IL-1ra/IL-6/RANTES or IL-1β/IL-6/IL-4/IL-13 usefulness as differential biomarkers.

1. Introduction

Gastric cancer (GC) and esophageal cancer (EC) are among the most lethal malignancies worldwide due to delayed diagnosis and lack of effective treatment modalities. While GC is the fifth most frequent diagnosed cancer and ranked third as a cause of cancer-related deaths [1,2,3], EC ranks seventh in incidence but sixth in cancer-related deaths [1]. The global effort to eradicate Helicobacter pylori infections, a main risk factor for GC, has caused a decrease in the incidence of a more common distal GC but concomitantly contributed to about seven-fold increase in incidence of its cardia subtype [4]. Cardia GC may share the etiology with non-cardia subtype or resemble esophageal adenocarcinoma [4]. H. pylori infections are responsible for chronic inflammation and oxidative stress in the gastric mucosa, leading to genetic instability and, consequently, to neoplastic transformation [5].
Radical surgery is the gold standard for treatment of solid tumors. Most often, however, GC and EC are recognized at an advanced stage, not amenable for curative resection and, thus, limiting therapeutic options to chemotherapy. Apart from serious side effects, the benefits of chemotherapy are rather disappointing [6]. Consequently, prognoses remain poor, with the five-year survival rates of ~20% in both GC [3] and EC [7]. Therefore, the urgent need for better understanding of the molecular mechanisms underlying the disease is emphasized in hope that it would lead to discovery of new therapeutic strategies, less toxic and more efficient, and ultimately improve survival [5]. As the mortality in GC and EC strongly depends on the disease stage at the time of diagnosis [2,7], non-costly and non-invasive tools allowing for early cancer detection are sought after as well.
Recent advances in biotechnology have facilitated a shift in research on biomarkers and molecular therapeutic targets from immunohistochemical determination of proteins, qualitative but semi-quantitative at best, towards unraveling the genetic and molecular anomalies underlying cancer, paving the way for personalized medicine [8]. Although delayed compared to other solid tumors, the “biomarker-driven cancer medicine“ approach in GC is gaining momentum [5]. Therefore, the aim of our study was comparative analysis of molecular signatures in GC at the local and systemic level with reference to cancer anatomical site (cardia and non-cardia GC) and as compared to EC. Locally, the expression of genes encoding key proteins relevant for cancer growth and progression was analyzed. Those included Ki67 proliferation marker, BCL2, BCLxL, and CDKN1A (encoding p21CIP1/WAF1) pro-survival factors, CCL2 (encoding monocyte chemoattractant protein (MCP)-1), PTGS2 (encoding cyclooxygenase-2) and NOS2 (encoding nitric oxide synthase-2) inflammatory factors, and IL7 and IL10 immune mediators and their receptors IL7Ra and IL10Ra. In addition, HIF1A (encoding hypoxia-inducible factor 1α) and VEGFA (encoding vascular endothelial growth factor (VEGF)-A) angiogenic factors, ACTA2 (encoding smooth muscle α-2 actin; aSMA), TJP1 (encoding zonula occludens (ZO)-1) and CLDN2 (encoding claudin-2) epithelial-mesenchymal transition (EMT) markers, and SLC2A1 (encoding glucose transporter GLUT1) and ODC1 (encoding ornithine decarboxylase) metabolic reprogramming markers were quantified. At the systemic level, the concentration of 27 circulating cytokines, chemokines and growth factors was determined. Quantified cytokines included interleukin (IL)-1β, IL-1ra, IL-2, IL-4, IL-5, IL-6, IL-7, IL-8, IL-9, IL-10, IL-12(p70), IL-13, IL-15, IL-17A, interferon γ (IFNγ), IFNγ-induced protein 10 (IP-10), eotaxin 1 (EOX1), fibroblast growth factor 2 (FGF2), granulocyte colony-stimulating factor (G-CSF), granulocyte-macrophage colony-stimulating factor (GM-CSF), MCP-1, monocyte inflammatory protein (MIP)-1 α and β, platelet-derived growth factor (PDGF)-BB, RANTES, tumor necrosis factor α (TNFα), and VEGF-A.

2. Results

2.1. Local Expression of Cancer-Promoting Mediators

The local expression of genes encoding proteins facilitating cancer growth and progression was determined using real time (quantitative) polymerase chain reaction (PCR) methodology with SYBR green chemistry in 31 patient-matched samples of tumor and tumor-adjacent macroscopically normal tissue from GC (n = 15) and EC (n = 16) patients. Data on demography and pathology are presented in Table 1.

2.1.1. Gastric Cancer

In GC, paired analysis showed significantly upregulated Ki67 proliferation marker and tight junction protein CLDN2 and downregulated anti-apoptotic BCL2 in tumor as compared to non-cancerous tumor-adjacent tissue. Expression of CDKN1A, ODC1, CCL2, and TJP1 tended to be lower and that of SLC2A1 higher in tumors as well, but the differences did not reach statistical significance (Figure 1).

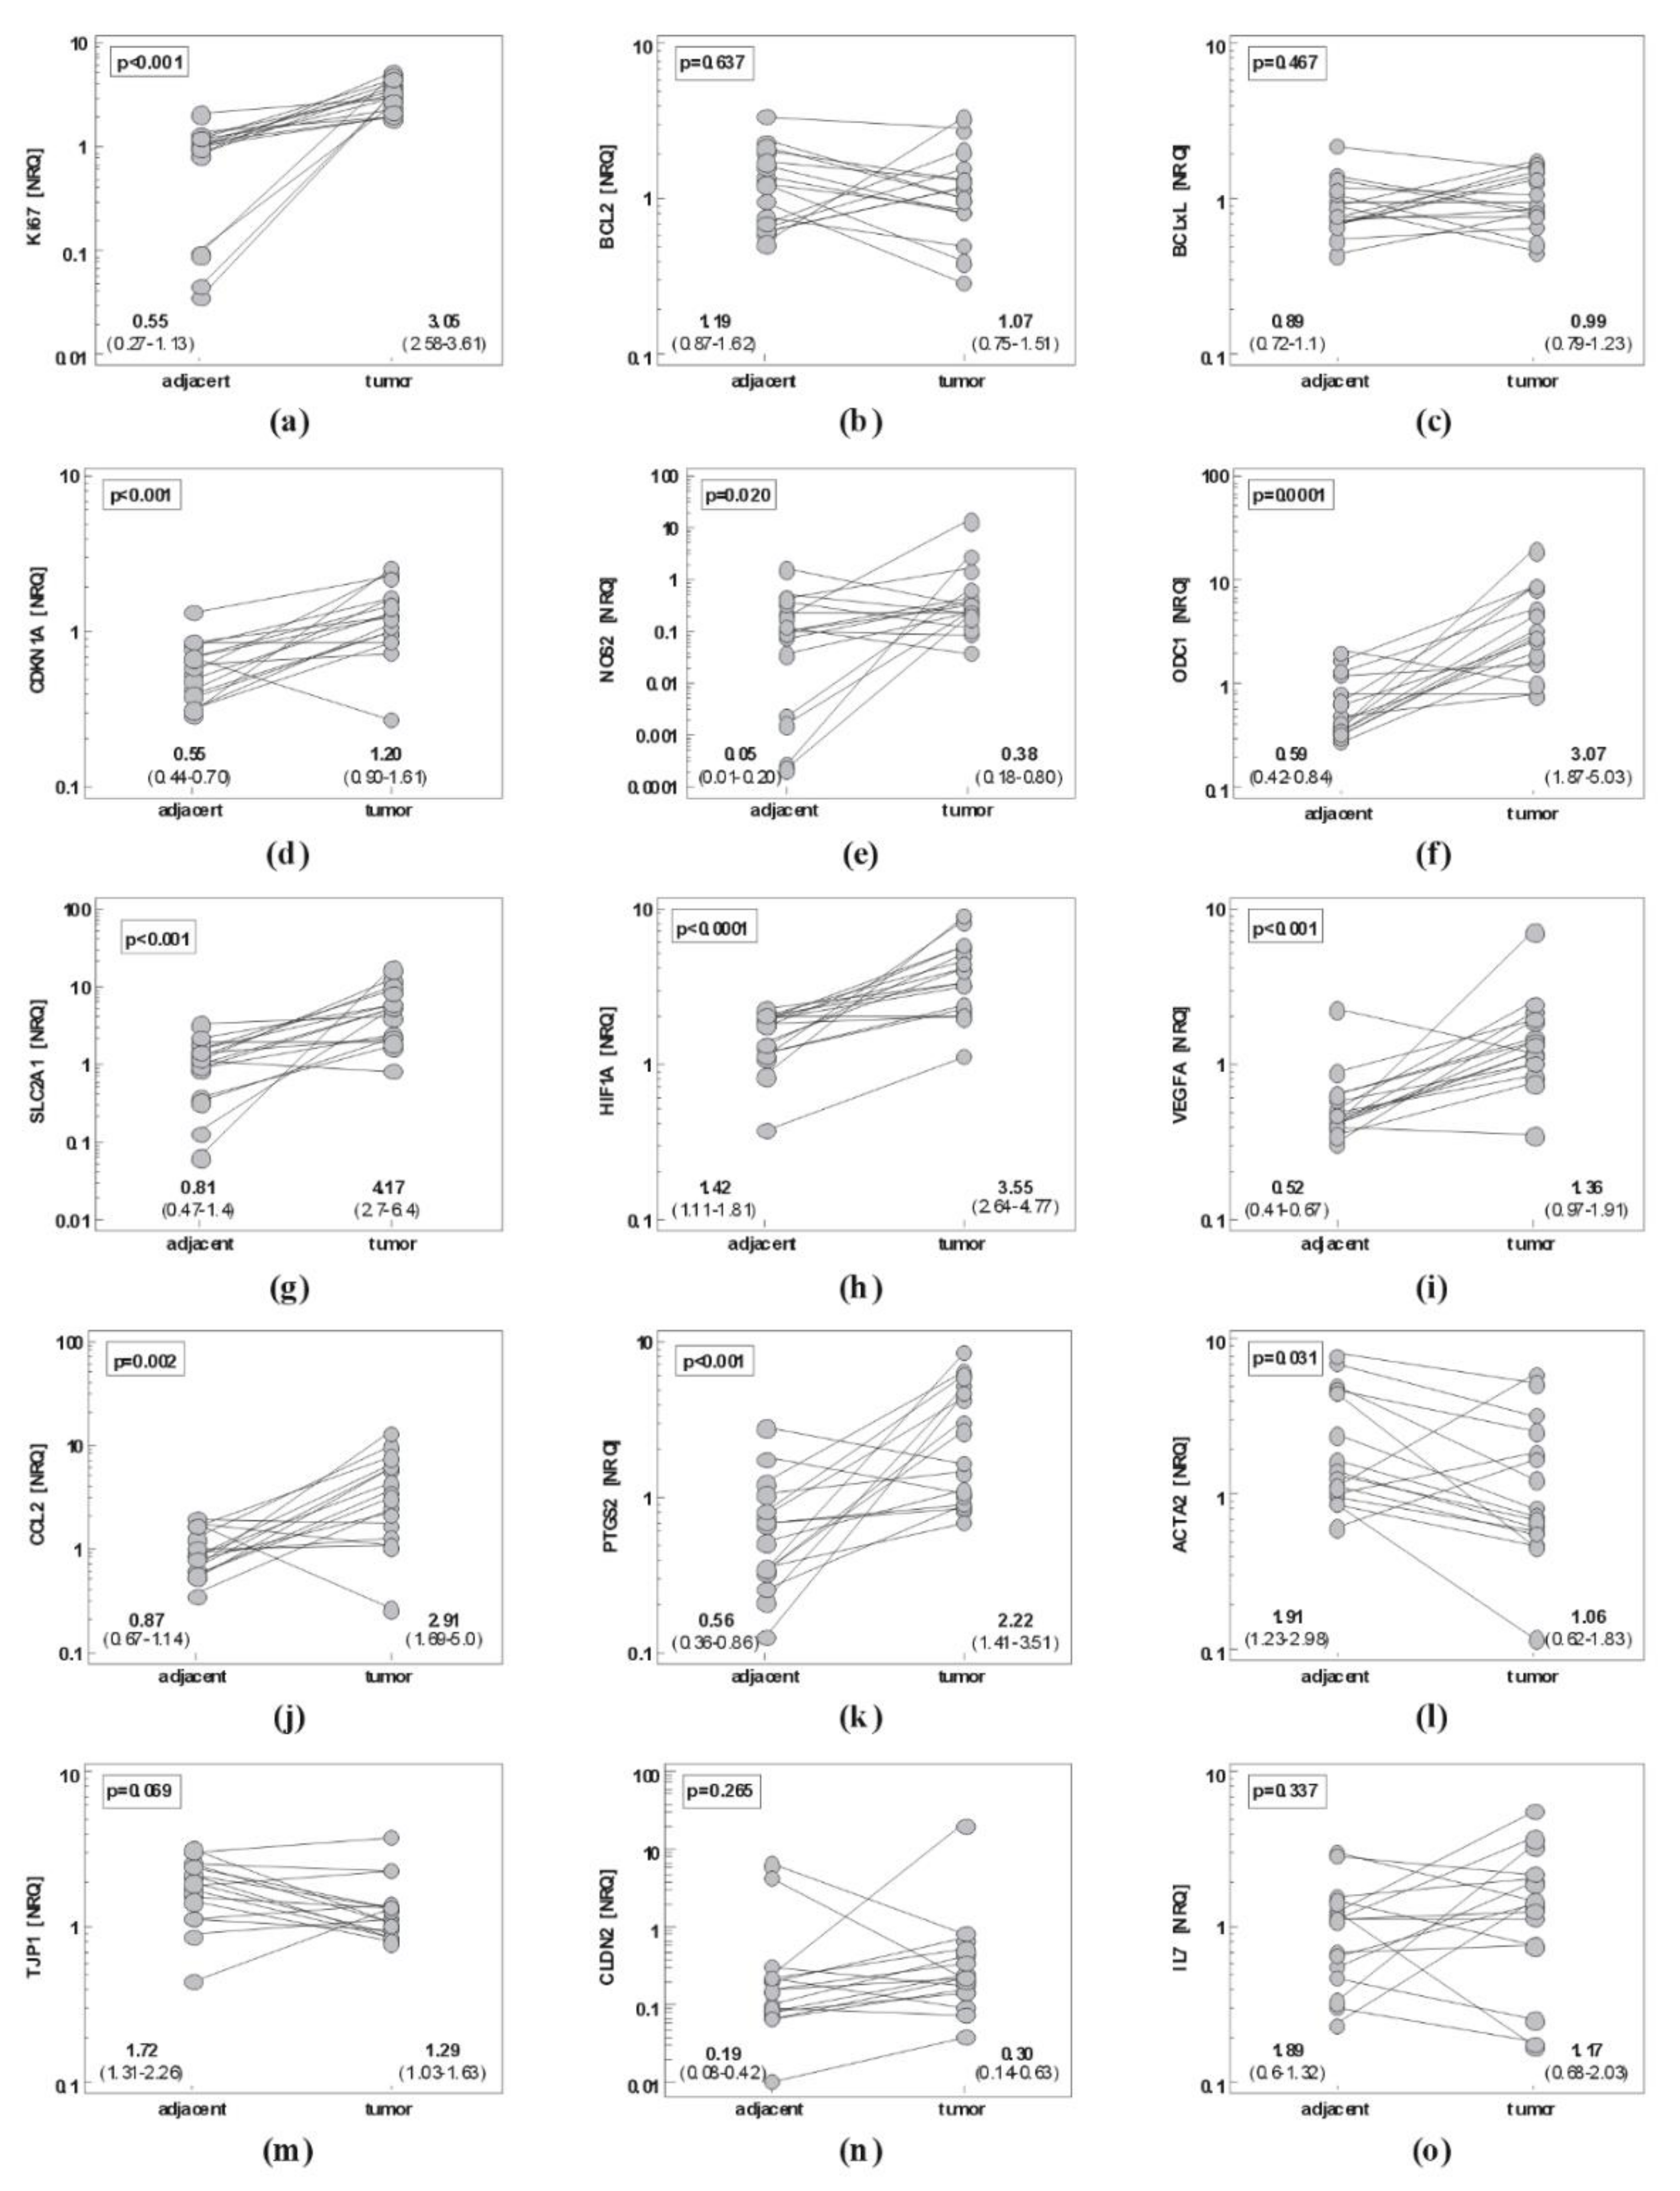
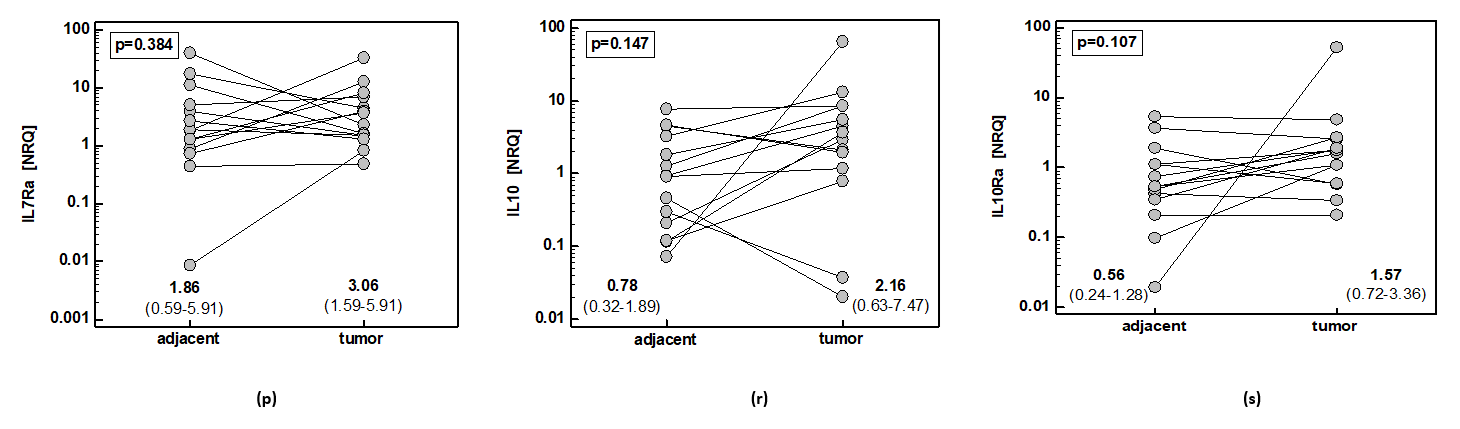
2.1.2. Esophageal Cancer

In EC, paired analysis showed significantly upregulated Ki67 and CDKN1A, markers of metabolic reprogramming ODC1 and SLC2A1, mediators of angiogenesis HIF1A and VEGFA, mediators of inflammation and immunity NOS2, CCL2, PTGS2, IL10 and its receptor IL10Ra and downregulated mesenchymal marker ACTA2 in tumor as compared to non-cancerous tumor-adjacent tissue. In addition, epithelial marker TJP1 tended to be decreased in esophageal tumors as well (Figure 2).

2.1.3. Comparison of Gene Signatures in Gastric and Esophageal Cancers

Tumor-to-Adjacent Fold-Change in Expression

First, we investigated whether the differences in gene up- or downregulation (fold change in expression between tumor and adjacent tissue) differed between GC and EC (Table 1).
The expression of Ki67, PTGS2, and SLC2A1 in tumors as compared to adjacent tissue was markedly more upregulated in EC than GC, by 2.8, 3.3, and 3.1-fold, respectively. There was no significant difference regarding anti-apoptotic BCL2 and BCLxL but the difference in fold change in cell cycle regulator CDKN1A, downregulated in GC and upregulated in EC, was 3.5-fold. Fold change in ODC1 and CCL2, downregulated in GC and upregulated in EC, was higher in EC than GC by 7.7 and 6.4-fold, respectively. The fold change in HIF1A and VEGFA was significantly different between GC and EC as well, by 2.7-fold in both cases (Table 2).
Of 15 GC patients, eight had cardia subtype and seven had non-cardia subtype of cancer. Comparison of gene expression signatures with respect to anatomical site showed NOS2 to be more markedly upregulated in cardia GC (by 176-fold; mean fold change 36.7 in cardia vs. 0.21 in non-cardia, p = 0.022). Tumors from patients with cardia GC tended to have also higher IL10 expression (by 7-fold; mean NRQ 5.7 vs. 0.8, p = 0.087).

Gene Expression in Tumors and Non-Cancerous Tissue

Subsequently, we compared gene expression (as normalized relative quantity) between gastric and esophageal tumors as well as between gastric and esophageal non-cancerous tumor-adjacent tissue (Table 3).

Independent Predictors of Gene Expression in Tumors and Non-Cancerous Gastric Tissue

Correlation analysis on genes differently expressed in GC and EC was conducted. First, significant associations were found in univariate analysis (Pearson correlation). Then, least squares multiple regression analysis was applied to identify variables independently from others associated with the expression of gene of interest. Partial (net) correlation coefficients (rp) were calculated for independent variables and model fit was expressed in terms of coefficient of determination (R2). Results are presented in Table 4 (non-cancerous tissue) and Table 5 (tumors).
The most striking difference between gastric and esophageal cancers was CLDN2 expression, both regarding non-cancerous and tumor tissue. The expression of Ki67 and NOS2 was independently associated with CLDN2 in non-cancerous adjacent tissue, explaining 83% in its variation, and BCLxL was independently associated with CLDN2 in gastric tumors, explaining 64% in its variability. The expression of PTGS2 was independently associated with ACTA2 in non-cancerous tissue, explaining 38% in gene variability, and BCL2 was independently associated with ACTA2 in gastric tumors, explaining 39% in gene variability. The expression of ACTA2, HIF1A, and VEGFA was independently associated with TJP1 in non-cancerous tissue, explaining 90% in its variability, and BCL2, HIF1A, CDKN1A, and PTGS2 were independently associated with TJP1 in gastric tumors, explaining 98% in gene variability.
The expression of SLC2A1 and HIF1A was independently associated with ODC1 in non-cancerous tissue, explaining 94% in its variability. In tumors, HIF1A was independently associated with ODC1 expression, explaining 74% in its variability. The expression of ODC1 was independently from other genes associated with SLC2A1 in adjacent tissue, explaining 72% in its variability, and Ki67 was independently associated with SLC2A1 in tumors, explaining 63% in gene variability.
The expression of TJP1 was independently associated with VEGFA in non-cancerous tissue, explaining 71% in gene variability, and SLC2A1 was independently associated with VEGFA expression in tumors, explaining 59% in gene variability. The expression of BCLxL, CDKN1A, CCL2, and ODC1 was independently from other genes associated with HIF1A in non-cancerous tissue, explaining 99% in its variability, and CCL2 and ODC1 remained independently associated with HIF1A in tumors, explaining 90% in its variability.
The expression of CCL2 was independently associated with PTGS2 in non-cancerous tissue, explaining 59% of variability in gene expression, and CCL2, BCL2, and VEGFA were independently associated with PTGS2 expression in tumors, explaining 91% in gene variability. The expression of PTGS2, BCL2, and IL7 (inversely) was independently associated with CCL2 in non-cancerous tissue, explaining 88% in gene variability, and HIF1A and BCL2 were independently associated with CCL2 in gastric tumors, explaining 83% in its variation.
The expression of BCLxL and CDKN1A was independently associated with Ki67 in non-cancerous tissue while BCLxL and ODC1 in tumors, explaining 75 and 94% in gene variability, respectively. The expression of HIF1A was independently associated with BCLxL in non-cancerous tissue while with CLDN2 and Ki67 in tumors, explaining 81 and 91% in gene variability, respectively. The expression of HIF1A and PTGS2 was independently associated with BCL2 in non-cancerous tissue while with TJP1 in tumors, explaining 77% and 78% in gene variability, respectively. The expression of CCL2 was independently associated with CDKN1A in non-cancerous tissue and with PTGS2 in tumors, explaining 87% and 92% in gene variability, respectively.

Impact of GC Pathological Stage on Fold Change in Gene Expression

The Ki67 expression was upregulated in more advanced cancers—it correlated positively with TNM stage and presence of lymph node metastasis and tended to correlate with the extension of primary tumor. The BCL2 and BCLxL expression tended to be less downregulated in gastric cancers with lymph node involvement and BCL2 in more advanced primary tumors. The CDKN1A was less downregulated in more advanced and aggressive cancers as it is positively correlated with TNM stage, primary tumor extension, and histopathological grade, and tended to be upregulated in tumors with distant metastases present. The expression of ODC1 was less downregulated in advanced cancers and a fold change in its expression correlated positively with TNM and lymph node metastasis and tended to correlate with the primary tumor extension as well. The expression of HIF1A was upregulated along with increasing TNM stage and in N1/2 cancers. Pro-inflammatory CCL2 was less downregulated and PTGS2 more upregulated in aggressive tumors. The fold change in CCL2 expression correlated positively with the primary tumor extension and tended to be related to lymph node involvement. Fold change in expression of epithelial marker TJP1 increased along with increasing TNM and the primary tumor extension. The gene was also less downregulated in GC patients with lymph node metastasis and tended to be upregulated in the presence of distant metastases. Immunosuppressive IL10 was more pronouncedly upregulated in aggressive tumors (Table 6).
The correlation pattern observed for TJP1 was counterintuitive and might be mediated by positive correlation between its expression and the expression of other genes (Table 4 and Table 5), also positively correlated with GC pathology (Table 6). Therefore, least squares multiple regression was applied to discern independent predictors of a fold change in TJP1 expression. When co-examined with other genes, impact of TNM stage on TJP1 lost significance as the association occurred to be mediated by CDKN1A and HIF1A. The TJP1 association with tumor extension (T) lost significance as it was mediated by BCL2 and ODC1 and the TJP1 association with lymph node metastasis (N) lost significance as it was mediated by HIF1A.

2.2. Systemic Cytokine Signatures in EC and GC

Systemic concentration of cytokines, chemokines and growth factors was determined using flow cytometry-based Luminex xMAP® technology in 195 individuals including 92 EC and 64 GC patients (32 with cardia and 32 with non-cardia subtypes), and 39 patients with benign conditions of esophagus and stomach. Data on demography and pathology are presented in Table 7.
Systemic concentration of IL-2, IL-15, and IL-17A was below the limit of detection in a great number of patients therefore those interleukins were excluded from further analysis.

2.2.1. Systemic Concentration of Cytokines, Chemokines, and Growth Factors in Gastric and Esophageal Cancer and Benign Conditions

The GC patients had significantly higher concentration of IL-1β, IL-4, IFNγ, and PDGF-BB and lower of IL-1ra, IL-12(p70), IL-13, and MCP-1 than patients with EC or individuals with benign conditions of esophagus and stomach. In addition, they had higher IL-6 and G-CSF but lower RANTES than individuals with benign conditions and higher IL-9 and FGF2 but lower GM-CSF than EC patients (Table 8).

Cytokine Signatures Distinguishing between GC and Benign Conditions

In order to select cytokines distinguishing GC, data were log-transformed to allow for logistic regression analysis. Cytokines found significantly different between GC and benign conditions in univariate analysis (IL-1β, IL-1ra, IL-4, IL-6, IL-12(p70), IL-13, IFNγ, G-CSF, MCP-1, PDGF-BB, and RANTES) were entered as explanatory variables. Two methods were applied. In the stepwise approach, IL-1β, IL-1ra, IL-6, and RANTES were selected as independent GC predictors (cytokine panel 1). The model was characterized by a good fit (χ2 = 4.57, p = 0.803 in a Hosmer and Lemeshow test and Nagelkerke R2 = 0.51). In the backward approach, IL-1ra, IL-4, IL-13, and IL-6 were selected as independent GC predictors (cytokine panel 2). The model was characterized by a good fit (χ2 = 10.0, p = 0.264 in a Hosmer and Lemeshow test and Nagelkerke R2 = 0.54).
Receiver operating characteristics (ROC) curve analysis was conducted to evaluate individual cytokines and their panels as potential biomarkers in GC differentiating cancer patients from those with benign conditions. Individually, IL-1β, IL-1ra, and IFNγ had superior, but still only fair, overall accuracy. Only IL-1β had a Youden index higher than 0.5, indicative of superior combination of sensitivity and specificity. IL-1ra and G-CSF had superior sensitivity, allowing identifying patients with the disease, but accompanied by poor specificity. Cytokine panel 2 displayed equally good sensitivity, which, however, was accompanied by excellent specificity, minimalizing likelihood of false positives (Table 9).

Cytokine Signatures Distinguishing between GC and EC

In order to select cytokines distinguishing GC, cytokines found significantly different between GC and EC in univariate analysis (IL-1β, IL-1ra, IL-4, IL-9, IL-12(p70), IL-13, IFNγ, GM-CSF, MCP-1, PDGF-BB, and FGF2) were entered as explanatory variables into logistic regression analysis. IL-1ra, IL-4, IL-12(p70), and IL-13 were selected in a backward method and IL-1ra, IL-4, and IL-13 in a stepwise method. Both panels distinguished between GC and EC with similar accuracy. The area under ROC curve (AUC) was 0.79 (95%CI: 0.72–0.85) for the four-cytokine panel and 0.80 (0.73–0.86) for the three-cytokine panel.

2.2.2. Cytokine Signatures Distinguishing between Cardia and Non-Cardia Subtypes of Gastric Cancer

Comparison of cytokine concentration in patients with cardia and non-cardia gastric cancer showed similar systemic cytokine signatures in both cancer subtypes. Only IL-4 (by 1.3-fold), IL-9 (by 1.7-fold), FGF2 (by 2.7-fold), and RANTES (by 2.1-fold) were significantly higher, although borderline, in non-cardia GC (Figure 3).
In logistic regression, either FGF2 (backward method) or RANTES (stepwise method) were selected as independent predictors of non-cardia GC with comparable accuracy. The area under the ROC curve (AUC) was 0.63 (95%CI: 0.5–0.74) for FGF2 and 0.64 (0.51–0.75) for RANTES.

3. Discussion

Gastric and esophageal cancers are lagging behind others in implementing the idea of personalized medicine [5,6]. As frequently emphasized, there is an urgent need for discerning patterns of molecular abnormalities to facilitate discovery of novel targets and biomarkers [5,8]. Here, we examined expression patterns of 18 genes, encoding representative proteins relevant for cancer growth and progression. As compared to EC, in which expression of 12 genes was altered, gastric tumors had significantly upregulated expression of only two (Ki67 and CLDN2) and downregulated one (BCL2). Qualitative differences were accompanied by quantitative, as Ki67, PTGS2, and SLC2A upregulation was significantly more pronounced in EC. Therefore, GC might appear to have relatively unaltered molecular landscape. However, the traditional analysis of fold change in expression ratio erroneously assumes “normality” of tumor-surrounding tissue. Actually, it has been argued that discerning molecular alterations happening in still non-transformed tissue is more informative on the processes leading to neoplastic transformation than the analysis based on already transformed cells and may pave the way to developing strategies for early cancer detection and/or primary chemoprevention [9]. Indeed, lack of gene upregulation and even their counterintuitive downregulation observed in GC seems to be associated with high gene expression in tumor-adjacent tissue. In fact, most genes were upregulated in “normal” gastric as compared to esophageal mucosa. The columnar epithelial cells lining the stomach are reportedly prone to inflammation and oxidative stress-induced damage [4], what would explain the particularly large difference in pro-inflammatory CCL2 and PTGS2. The damage accumulation in cells holding high proliferative and survival capacity is particularly oncogenic [10]. Here we showed that, compared to esophageal apparently normal tissue, gastric mucosa had significantly upregulated expression of proliferation and survival markers Ki67, BCL2, BCLxL, and CDKN1A. This observation agrees well with increased risk of adenocarcinoma in chronic gastroesophageal reflux disease (GERD), associated with the replacement of squamous epithelium with columnar [11]. We further observed that non-cancerous gastric mucosa expressed markedly more pro-angiogenic factors (HIF1A, VEGFA, and IL7 and its receptor IL7Ra) and EMT markers (CLDN2, ACTA2, and TJP1). Those observations add to the growing awareness that the macroscopically normal tumor-surrounding tissue might harbor molecular alterations [9,12,13,14,15,16]. Although not sufficient to change cell morphology, they are still of clinical relevance as the phenomenon of “molecular margin” is being argued to contribute to therapy failure and cancer recurrence following curative resection and/or to the occurrence of synchronous multiple tumors [12,13]. In addition to differences regarding non-transformed tissue, gastric tumors had higher than esophageal ones expression of BCLxL, CDKN1A, VEGFA, ACTA2, CLDN2, TJP1, and IL7Ra. Of note, markedly higher IL-7 protein upregulation in GC than EC has previously been reported [17].
Metabolic reprogramming of neoplastic cells with the accelerated glucose up-take is a recognized hallmark of cancer [18]. The overexpression of glucose transporter SLC2A1/GLUT-1 has been repeatedly shown in numerous solid tumors and associated with shorter overall and disease-free survival [19]. Here, SLC2A1 was significantly upregulated only in EC, and was the sole gene overexpressed in esophageal as compared to gastric tumors. Cancer-type related variance in GLUT1 abundance is of clinical relevance as it directly correlates with the uptake of 18F-fluoro-2-deoxyglucose, a glucose analog used for cancer detection [20]. Therefore, cancers with low transporter expression are likely to pose a challenge for imaging employing positron emission tomography (PET). Corroborating our findings, Carvalho et al. [21] showed immunoreactivity for GLUT1 depends on the cancer anatomical site and histology, being low in gastric adenocarcinoma and present in cell cytoplasm rather than on the surface. Although EC has not been assessed, GLUT1 immunoreactivity in other squamous cell carcinomas was three to four times higher and evident on the cell surface. Others have postulated roles for GLUT1 beyond the transport of glucose, linking it with aggressive cancer behavior, high proliferation potential, and hypoxia [22,23]. Accordingly, SLC2A1 expression correlated positively with markers of hypoxia and angiogenesis and mediators/indices of proliferation and survival. Moreover, factors indicative of high proliferative capacity—Ki67 and ODC1—were independent predictors of SLC2A1 expression in non-cancerous tissue and gastric tumor, respectively.
Ornithine decarboxylase, encoded by the ODC1 gene, is a key enzyme in the polyamine biosynthesis pathway. Being exposed to harmful agents, the gastrointestinal tract mucosa had to be rapidly self-renewing. Polyamines play a crucial role in maintaining and controlling its proliferative, survival, migration, and angiogenic potential [24]. However, ODC1 is a downstream target of the MYC oncogene and, thus, implicated in neoplastic transformation [25,26,27]. Here, we showed markedly higher ODC1 expression in “normal” gastric than esophageal mucosa. This observation agrees well with the reported increase in polyamine concentration along the gastrointestinal tract [24]. Considering the enzyme role in mucosal healing, particularly high ODC1 expression in gastric non-cancerous tissue is likely to be a response to overexpression of pro-inflammatory mediators. It has been shown that in the stomach, ornithine decarboxylase and polyamines are necessary for epithelial restitution and that the polyamine-mediated repair of the epithelial barrier involves upregulation of ZO-1 [24]. Accordingly, ODC1 expression correlated positively with TJP1 in both non-cancerous and tumor tissue. In line with a pro-proliferative character of polyamines, executed, among others, by polyamine-induced p21CIP1/WAF1 synthesis [24], ODC1 expression correlated positively with CDKN1A and Ki67. Moreover, variability in CDKN1A expression independently predicted ODC1 variation in non-cancerous tissue and variability in Ki67—in gastric tumors. Angiogenesis, manifested by upregulated HIF1A and VEGFA [24,28], is a part of the healing process of the gastric mucosa as well as a means of gastric cancer growth and dissemination. Studies with ornithine decarboxylase inhibitors have shown a stimulatory effect on angiogenesis, although, the underlying mechanisms remain obscure [24]. Still, cobalt-induced hypoxia in glioma cells resulted in increased expression of ODC1 preceded by HIF1A upregulation [29]. Corroborating positive association between the enzyme and angiogenesis, ODC1 correlated positively with HIF1A and VEGFA. More so, HIF1A was an independent predictor of ODC1 expression in both non-cancerous and tumor tissue. Furthermore, despite apparent ODC1 downregulation in gastric tumors, its expression positively correlated with cancer pathology—the TNM stage and, particularly, lymph node involvement.
A need for unraveling mechanisms underlying EMT in GC has been stressed and potential usefulness of EMT mediators as biomarkers and targets for preventative as well as curative interventions in GC has been suggested [30]. The EMT is associated with rearrangement in tight junction proteins, including downregulation of the epithelial marker TJP1/ZO-1 and upregulation of the mesenchymal marker ACTA2/aSMA [30]. While TJP1 indeed tended to be downregulated in tumors as compared to adjacent tissue, ACTA2 was downregulated as well, significantly so in EC. This, however, is probably caused by non-optimal tissue sampling from tumor bulk, as ACTA2-expressing myofibroblasts are located mostly at its border. Counterintuitively and contrary to literature data [31], TJP1 expression correlated positively with GC pathology, but the association was apparent and mediated by other genes. Nonetheless, VEGFA and HIF1 were independent predictors of TJP1 expression. Correspondingly, others have shown the effect of VEGF-A on TJP1/ZO-1 to be inhibitory in endothelial but stimulatory in epithelial cells [32]. Here, ACTA2 and TJP1 were markedly more expressed in GC than EC, both in tumors and non-cancerous tissue. However, the most striking cancer-type related difference was associated with the expression of CKDN2, a gene encoding tight junction protein claudin-2. We found it upregulated by 44-fold in gastric tumors as compared to esophageal neoplasms and by 18-fold in non-cancerous tissue. Previously, upregulated claudin-2 immunoreactivity has been reported in esophageal squamous cell carcinoma [33] while data regarding GC are equivocal [34,35]. Claudin-2 is a pore forming protein but mounting evidence suggests that its role is not limited to regulating epithelial barrier permeability. The bulk of existing studies on claudin-2 in the gastrointestinal tract concerns colorectal cancer, where it is upregulated in response to IL-4 and IL-13 [16] and involved in promoting proliferation, survival, migration, colony formation, and drug resistance [16,36,37]. In addition, claudin-2 has been shown to facilitate self-renewal of colorectal stem-like cells. As these cells are held responsible for cancer recurrence following curative resection, claudin-2 has been proposed as a novel therapeutic target in colorectal cancer [38]. Scarce functional data in GC have shown that claudin-2 promotes migration but has no effect on the growth of gastric cancer cells [39]. Still, CLDN2 expression in clinical samples examined here was independently associated with the expression of proliferation and survival markers, supporting its possible involvement also in improving cell viability. Taking into account that CLDN2 expression has been shown to be downregulated by non-steroid anti-inflammatory drugs [39], it makes it a promising molecular target for cancer chemoprevention and warrants further in-depth functional studies on the protein.
In the present study, we compared the signatures of cardia and non-cardia subtypes of gastric cancer. Locally, cardia cancers were distinguished by comparatively high expression of NOS2, and tended to have seven-fold higher expression of IL10, which correlated positively with histological grade and, thus, with tumor aggressiveness. Taking into account inflammation and oxidative stress-promoting nature of NOS2 and immunosuppressive character of IL-10, their overexpression in cardiac cancers may contribute to generally worse prognosis associated with this subtype [40]. While this finding requires confirmation on a larger set of samples and on protein level, the notion was further supported by higher systemic concentrations of immunosuppressive IL-4, proangiogenic FGF2, and pro-inflammatory RANTES, observed here in patients with cardiac sublocation of the primary tumor. In addition, cardia GC was associated with elevated IL-9. The interleukin promotes inflammation [41] and plays a role in autoimmune diseases but its role in cancer is dichotomous [42].
One of the main reasons of high mortality accompanies EC and GC is their delayed detection, resulting from inconspicuous symptoms and lack of non-invasive diagnostic and differential biomarkers. Panels of cytokines have previously been shown to facilitate differential diagnosis in other cancers with superior accuracy [43]. Therefore, we aimed at determining the systemic cytokine signature of GC that would distinguish it from benign conditions. Individually, IL-1β had the highest diagnostic power as IFNγ and IL-1ra had a markedly worse Youden index, despite comparable accuracy. Both parameters were significantly improved for multi-cytokine panels. We built two sets—one included IL-1β (increased), IL-1ra (decreased), IL-6 (increased), and RANTES (decreased) and the other consisted of IL-1β, IL-6, IL-4 (increased), and IL-13 (decreased). Both panels were based on classic inflammatory cytokines IL-1 and IL-6, significantly more elevated in GC, despite the benign conditions analyzed here being inflammatory in nature as well. IL-1β is a prototypical pro-inflammatory cytokine induced by H. pylori infection, which further stimulate the expression of IL-6 and, concomitantly, of its non-functional analog IL-1ra, as a regulatory mechanism preventing hyperinflammation. The upregulation of IL-1β during H. pylori infection inhibits gastric acid secretion, facilitating further colonization of bacteria. It also increases secretion of gastrin, a hormone implicated in neoplastic transformation. Long-term, IL-1β oversecretion leads to the organ atrophy and adenocarcinoma [44,45]. Genetic studies have shown the risk for GC to depend on polymorphisms in the IL1B gene. Certain variants have been demonstrated to raise GC susceptibility by increasing IL-1β and reducing IL-1ra production [46]. Therefore, inclusion of IL-1β, IL-1ra, and IL-6 in the panels differentiating GC from benign conditions might be interpreted as a representation of more pronounced inflammation in GC. Interestingly, there was a difference in IL-4 and IL-13 between GC and benign conditions with elevated IL-4 and IL-13 in GC and benign conditions, respectively. Both interleukins are known to promote cancer development by interfering with anti-tumor immunity [47]. Recent findings, however, show that they may also support tumor cells directly, by facilitating their growth, survival, and migration [16,48,49]. They were both demonstrated to be elevated in gastric tumors as well as to upregulate the expression of CLDN2 while downregulating that of TJP1 in colonic cancer cells [16].

4. Materials and Methods

4.1. Patients

4.1.1. Study Population—Local Molecular Signatures (Gene Expression)

Matched tissue samples (tumor and macroscopically normal tumor-adjacent) were collected intraoperatively from 51 cancer patients, admitted to the Department of Gastrointestinal and General Surgery of Wroclaw Medical University for curative resection of gastric adenocarcinoma (n = 15) or esophageal squamous cell carcinoma (n = 16). Patients with any severe systemic illness, with gross metastatic disease or subjected to radio- or chemotherapy were not included. Patients were subjected to a standard preoperative evaluation (blood work, physical examination, and imaging techniques, such as ultrasonography, computed tomography, and magnetic resonance). Cancers were rated pathologically using the 7th edition of the Union for International Cancer Control TNM system. In all cases, the resection margins have been confirmed to be tumor-free. Detailed population characteristics are depicted in Table 1.

4.1.2. Study Population—Systemic Cytokine Signatures

The cohort of 195 patients was analyzed, including 39 controls (patients with benign conditions: gastritis, cardiospasmus, gastro-esophageal reflux disease, esophagitis) and 156 patients with histologically confirmed esophageal squamous cell carcinoma (n = 92) or gastric adenocarcinoma (n = 64). Among GC patients, 32 had adenocarcinomas of the gastric cardia and 32 had a non-cardia subtype (distal GC). All patients were admitted to the Department of Gastrointestinal and General Surgery of Wroclaw Medical University for the disease diagnosis and/or treatment (curative surgery or palliative treatment). Cancers were rated clinically using the 7th edition of the Union for International Cancer Control TNM system. Detailed population characteristics are depicted in Table 7.

4.1.3. Ethical Considerations

The study protocol was approved by the Medical Ethics Committee of Wroclaw Medical University (signature number: KB 203/2016). The study was conducted in accordance with the Helsinki Declaration of 1975, as revised in 1983, and informed consent was obtained from all study participants.

4.2. Analytical Methods

4.2.1. Sample Collection

Tissue Samples

Paired tissue samples were obtained intraoperatively and rinsed with saline prior their immersion in RNAlater solution (Ambion Inc., Austin TX, USA). Tissue samples were then stored at −80 °C until RNA isolation.

Serum Samples

Peripheral blood was collected by venipuncture into BD Vacutainer CAT tubes (Becton Dickinson, Plymouth, UK) and clotted for 30 min at room temperature (RT). Samples were subsequently centrifuged at 1500 × g for 10 min at RT. Collected sera were aliquoted and stored at −45 °C until examination. Blood samples were taken upon admission, prior to any treatment.

4.2.2. Transcriptional Analysis

Tissue Homogenization

Tissue samples (up-to 40 mg) were homogenized in lysis buffer (provided as a part of PureLink™ RNA Mini Kit) with β-mercaptoethanol (Sigma-Aldrich, St. Louis, MO, USA) using Fastprep 24 Homogenizer (MP Biomedical, Solon, OH, USA) and ceramic spheres.

RNA Isolation

Total RNA was isolated using phenol-chloroform extraction followed by purification with PureLink™ RNA Mini Kit (Thermo-Fisher Scientific, Waltham, MA, USA) involving on-column digestion of genomic DNA with PureLink™ DNase Set (Thermo-Fisher Scientific). Purified RNA isolates were quantified using NanoDrop 2000 (Thermo-Fisher Scientific). RNA purity was determined by calculating ratios of absorbance at 260, 280, and 230 nm. RNA integrity was evaluated using the Experion platform, incorporating LabChip microfluidic technology, and Experion RNA StdSens analysis kits (BioRad, Hercules, CA, USA). RNA quality indicator (RQI) score was calculated for each RNa sample and only RNA isolates with RQI ≥ 7, indicative of good RNA quality, were used for reversely-transcribed quantitative polymerize chain reaction (RT-qPCR).

cDNA Synthesis

Aliquots containing 1000 ng of RNA were reversely transcribed using C1000 termocycler (BioRad) and iScript™ cDNA Synthesis Kit (BioRad), following the manufacturer’s instructions.

Quantitative (Real-Time) PCR

Quantitative PCRs were conducted using CFX96 Real-Time PCR system (BioRad) and SsoFast EvaGreen® Supermix (BioRad). The cycling conditions were as follows: 30 sec activation at 95 °C, 5 sec denaturation at 95 °C, annealing/extension for 5 sec at 61 °C, 40 cycles, followed by melting step (60–95°C with fluorescent reading every 0.5 °C). Reaction mixture contained 2 µL of cDNA (diluted 1:5), 10 µL of 2× SsoFast EvaGreen® Supermix, 1 µL of each 10 nM forward and reverse target-specific primers, and water up to 20 µL. Primers were synthesized by Genomed (Warsaw, Poland) and their sequences are presented in Table 10. Primers’ specificity was tested by melting curve analysis and an electrophoresis in a high-resolution agarose (SeaKem LE agarose from Lonza, Basel, Switzerland) in TBE with SYBR Green (Lonza) detection.

Expression Calculation and Normalization Strategy

Technical replicates were averaged prior analysis. Geometric mean of all Cq values across all samples was calculated and subtracted from individual sample Cq (ΔCq). Subsequently, ΔCq values were linearized by 2^ΔCq conversion and normalized to GAPDH, serving as an internal control. The obtained values are referred to as a normalized relative quantity (NRQ) [50] and subjected to statistical analysis.

4.2.3. Serum Cytokine Quantification

Serum concentration of 27 cytokines, chemokines, and growth factors was quantified using the BioPlex 200 platform (Bio-Rad), incorporating Luminex xMAP® technology, allowing for simultaneous quantification of multiple analytes in real-time, and Bio-Plex Pro™ Human Cytokine, Chemokine, and Growth Factor Magnetic Bead–Based Assays. This flow cytometry-based method utilizes magnetic microspheres conjugated with monoclonal antibodies and fluorescent reading. All analyses were conducted in duplicates following manufacturer’s instructions. Standard curves were drawn using 5-PL logistic regression and the data were analyzed using BioPlex Manager 6.0 software.

4.3. Statistical Analysis

Normality of distribution was evaluated using the Kolmogorov–Smirnov test. Homogeneity of variances was tested using the Levene test. Paired data were analyzed using the t-test for paired samples. Two-group comparisons were conducted using t-test for independent samples, with Welch correction in case of unequal variances, and resulting data are presented as geometric means with 95% confidence interval (CI). Multi-group comparisons were conducted using either one-way ANOVA on log-transformed data, with Tukey–Kramer post-hoc test, or Kruskal–Wallis H test, with the Conover post-hoc test. Resulting data are presented as, respectively, means or geometric means with standard deviation (SD) or 95%CI or medians with interquartile range. Frequency analysis was conducted using Fisher’s exact test (2 × 2) or χ2 test. Correlation analysis was conducted using Spearman’s rank correlation test (ρ) or Pearson correlation test.
Least squares multiple regression (stepwise method) was used to discern independent predictors of gene expression. Variables were entered into the model if p < 0.05 and removed if p > 0.1. Partial correlation coefficients (rp) with the effect of co-variables removed were calculated. Goodness-of-fit of the built regression model is expressed in terms of coefficient of determination (R2).
Logistic regression, stepwise and backward method, was applied to select independent explanatory variables. Variables entered the model if p < 0.05 and was removed if p > 0.1. Goodness-of-fit of a build model was determined by the Nagelkerke coefficient of determination (R2) and the Hosmer and Lemeshow test (tests for lack of fit; therefore, p > 0.05 is indicative of a model fit). Calculated probabilities from logistic regression were subsequently used as dependent variable in ROC curve analysis. The ROC curve analysis was applied to determine the diagnostic power (or to test the strength of association) of individual and multiple cytokines. Their ability to distinguish GC was assessed in terms of overall accuracy expressed as AUC (in %) and sensitivity and specificity at a given cut-off, summarized as Youden index (J = sensitivity + specificity − 100).
All calculated probabilities were two-tailed. The p values ≤0.05 were considered statistically significant. The entire analysis was conducted using MedCalc Statistical Software version 19.2 (MedCalc Software Ltd, Ostend, Belgium; https://www.medcalc.org; 2020).

5. Conclusions

Taken together, our results show increased proliferative, survival, inflammatory, and angiogenic capacity in gastric tumor-surrounding tissue as compared to esophageal non-cancerous mucosa. It might contribute to GC aggressiveness and facilitate cancer recurrence following curative tumor resection. Distinct molecular patterns between cardiac and non-cardiac GC with upregulated expression of pro-inflammatory and pro-oxidative NOS2 and immunosuppressive IL10 might contribute, in turn, to worse prognosis associated with cardiac GC subtype. We also showed distinct systemic cytokine signatures in gastric and esophageal cancers and their benign conditions, with cytokine panels consisting of IL-1β/IL-1ra/IL-6/RANTES or IL-1β/IL-6/IL-4/IL-13 holding promise as differential biomarkers in GC. The striking upregulation of CLDN2 in GC and NOS2 in the cardiac GC subtype warrants further studies on a larger cohort and with concomitant protein assessment to determine their suitability as candidate molecular targets. Functional studies discerning the role of CLDN2 in GC are needed as well.

Author Contributions

Conceptualization: I.B.-M. and M.K.-K.; data curation: D.D.; formal analysis: I.B.-M., P.F., D.D. and M.K.-K.; funding acquisition: M.K.-K.; investigation: I.B.-M., P.F., N.J. and M.K.-K.; methodology: I.B.-M. and M.K.-K.; supervision: M.K.-K.; visualization: I.B.-M.; writing—original draft: I.B.-M. and M.K.-K.; writing—review and editing: I.B.-M., P.F., D.D., N.J. and M.K.-K. All authors have read and agreed to the published version of the manuscript.

Funding

This research was funded by Wroclaw Medical University, statutory grant number SUB.A040.19.016.

Acknowledgments

The authors would like to thank the Foundation of Wroclaw Medical University (FAM) and its Board Chairmen for financing a lease of BioRad Experion platform, CFX96 Real-Time PCR system, and Bioplex200.

Conflicts of Interest

The authors declare no conflict of interest. The funders had no role in the design of the study; in the collection, analyses, or interpretation of data; in the writing of the manuscript, or in the decision to publish the results.

Abbreviations

AUCArea under ROC curve
ECEsophageal cancer
EMTEpithelial-mesenchymal transition
GCGastric cancer
GERDGastro-esophageal reflux disease
ILInterleukin
NRQNormalized relative quantity
ROCReceiver operating characteristics curve analysis
TNMTumor-node-metastasis cancer staging system

References

  1. Bray, F.; Ferlay, J.; Soerjomataram, I.; Siegel, R.L.; Torre, L.A.; Jemal, A. Global Cancer Statistics 2018: GLOBOCAN Estimates of Incidence and Mortality Worldwide for 36 Cancers in 185 Countries. CA Cancer J. Clin. 2018, 68, 394–424. [Google Scholar] [CrossRef] [PubMed] [Green Version]
  2. Thrift, A.P.; El-Serag, H.B. Burden of Gastric Cancer. Clin. Gastroenterol. Hepatol. 2020, 18, 534–542. [Google Scholar] [CrossRef] [PubMed]
  3. GBD 2017 Stomach Cancer Collaborators. The Global, Regional, and National Burden of Stomach Cancer in 195 Countries, 1990–2017: A Systematic Analysis for the Global Burden of Disease Study 2017. Lancet Gastroenterol. Hepatol. 2020, 5, 42–54. [Google Scholar] [CrossRef] [Green Version]
  4. Rawla, P.; Barsouk, A. Epidemiology of Gastric Cancer: Global Trends, Risk Factors and Prevention. Prz Gastroenterol. 2019, 14, 26–38. [Google Scholar] [CrossRef] [PubMed]
  5. Liu, X.; Meltzer, S.J. Gastric Cancer in the Era of Precision Medicine. Cell. Mol. Gastroenterol. Hepatol. 2017, 3, 348–358. [Google Scholar] [CrossRef] [PubMed] [Green Version]
  6. Choi, Y.Y.; Noh, S.H.; Cheong, J.H. Evolution of Gastric Cancer Treatment: From the Golden Age of Surgery to an Era of Precision Medicine. Yonsei Med. J. 2015, 56, 1177–1185. [Google Scholar] [CrossRef] [PubMed] [Green Version]
  7. Tustumi, F.; Kimura, C.M.; Takeda, F.R.; Uema, R.H.; Salum, R.A.; Ribeiro-Junior, U.; Cecconello, I. Prognostic Factors and Survival Analysis in Esophageal Carcinoma. Arquivos Brasileiros de Cirurgia Digestiva (São Paulo) 2016, 29, 138–141. [Google Scholar] [CrossRef]
  8. Aftimos, P.G.; Barthelemy, P.; Awada, A. Molecular Biology in Medical Oncology: Diagnosis, Prognosis, and Precision Medicine. Discov. Med. 2014, 17, 81–91. [Google Scholar]
  9. Patel, A.; Tripathi, G.; Gopalakrishnan, K.; Williams, N.; Arasaradnam, R.P. Field Cancerisation in Colorectal Cancer: A New Frontier or Pastures Past? World J. Gastroenterol. 2015, 21, 3763–3772. [Google Scholar] [CrossRef]
  10. Sesti, F.; Tsitsilonis, O.E.; Kotsinas, A.; Trougakos, I.P. Oxidative Stress-Mediated Biomolecular Damage and Inflammation in Tumorigenesis. Vivo 2012, 26, 395–402. [Google Scholar]
  11. Wang, D.H. The Esophageal Squamous Epithelial Cell-Still a Reasonable Candidate for the Barrett’s Esophagus Cell of Origin? Cell. Mol. Gastroenterol. Hepatol. 2017, 4, 157–160. [Google Scholar] [CrossRef] [PubMed]
  12. Mao, L.; Clark, D. Molecular Margin of Surgical Resections—Where Do We Go from Here? Cancer 2015, 121, 1914–1916. [Google Scholar] [CrossRef] [PubMed]
  13. Dakubo, G.D.; Jakupciak, J.P.; Birch-Machin, M.A.; Parr, R.L. Clinical Implications and Utility of Field Cancerization. Cancer Cell Int. 2007, 7, 2. [Google Scholar] [CrossRef] [PubMed] [Green Version]
  14. Neubauer, K.; Bednarz-Misa, I.; Diakowska, D.; Kapturkiewicz, B.; Gamian, A.; Krzystek-Korpacka, M. Nampt/PBEF/Visfatin Upregulation in Colorectal Tumors, Mirrored in Normal Tissue and Whole Blood of Colorectal Cancer Patients, Is Associated with Metastasis, Hypoxia, IL1β, and Anemia. BioMed. Res. Int. 2015, 2015, 523930. [Google Scholar] [CrossRef] [Green Version]
  15. Krzystek-Korpacka, M.; Gorska, S.; Diakowska, D.; Kapturkiewicz, B.; Podkowik, M.; Gamian, A.; Bednarz-Misa, I. Midkine Is Pp-regulated in Both Cancerous and Inflamed Bowel, Reflecting Lymph Node Metastasis in Colorectal Cancer and Clinical Activity of Ulcerative Colitis. Cytokine 2017, 89, 68–75. [Google Scholar] [CrossRef]
  16. Bednarz-Misa, I.; Diakowska, D.; Szczuka, I.; Fortuna, P.; Kubiak, A.; Rosińczuk, J.; Krzystek-Korpacka, M. Interleukins 4 and 13 and Their Receptors Are Differently Expressed in Gastrointestinal Tract Cancers, Depending on the Anatomical Site and Disease Advancement, and Improve Colon Cancer Cell Viability and Motility. Cancers 2020, 12, 1463. [Google Scholar] [CrossRef]
  17. Bednarz-Misa, I.; Diakowska, D.; Krzystek-Korpacka, M. Local and Systemic IL-7 Concentration in Gastrointestinal Tract Cancers. Medicina 2019, 55, E262. [Google Scholar] [CrossRef] [Green Version]
  18. Hanahan, D.; Weinberg, R.A. Hallmarks of Cancer: The Next Generation. Cell 2011, 144, 646–674. [Google Scholar] [CrossRef] [Green Version]
  19. Wang, J.; Ye, C.; Chen, C.; Xiong, H.; Xie, B.; Zhou, J.; Chen, Y.; Zheng, S.; Wang, L. Glucose Transporter GLUT1 Expression and Clinical Outcome in Solid Tumors: A Systematic Review and Meta-Analysis. Oncotarget 2017, 8, 16875–16886. [Google Scholar] [CrossRef] [Green Version]
  20. Usuda, K.; Sagawa, M.; Aikawa, H.; Ueno, M.; Tanaka, M.; Machida, Y.; Zhao, X.T.; Ueda, Y.; Higashi, K.; Sakuma, T. Correlation between glucose transporter-1 expression and 18F-fluoro-2-deoxyglucose uptake on positron emission tomography in lung cancer. Gen. Thorac. Cardiovasc. Surg. 2010, 58, 405–410. [Google Scholar] [CrossRef]
  21. Carvalho, K.C.; Cunha, I.W.; Rocha, R.M.; Ayala, F.R.; Cajaíba, M.M.; Begnami, M.D.; Vilela, R.S.; Paiva, G.R.; Andrade, R.G.; Soares, F.A. GLUT1 Expression in Malignant Tumors and Its Use as an Immunodiagnostic Marker. Clinics 2011, 66, 965–972. [Google Scholar] [CrossRef] [PubMed] [Green Version]
  22. Oh, S.; Kim, H.; Nam, K.; Shin, I. Glut1 Promotes Cell Proliferation, Migration and Invasion by Regulating Epidermal Growth Factor Receptor and Integrin Signaling in Triple-Negative Breast Cancer Cells. BMB Rep. 2017, 50, 132–137. [Google Scholar] [CrossRef] [PubMed]
  23. Sawayama, H.; Ogata, Y.; Ishimoto, T.; Mima, K.; Hiyoshi, Y.; Iwatsuki, M.; Baba, Y.; Miyamoto, Y.; Yoshida, N.; Baba, H. Glucose Transporter 1 Regulates the Proliferation and Cisplatin Sensitivity of Esophageal Cancer. Cancer Sci. 2019, 110, 1705–1714. [Google Scholar] [CrossRef] [Green Version]
  24. Gao, J.H.; Guo, L.J.; Huang, Z.Y.; Rao, J.N.; Tang, C.W. Roles of Cellular Polyamines in Mucosal Healing in the Gastrointestinal Tract. J. Physiol. Pharmacol. 2013, 64, 681–693. [Google Scholar] [PubMed]
  25. Casero, R.A.; Murray Stewart, T.; Pegg, A.E. Polyamine Metabolism and Cancer: Treatments, Challenges and Opportunities. Nat. Rev. Cancer 2018, 18, 681–695. [Google Scholar] [CrossRef] [PubMed]
  26. Meyskens, F.L., Jr.; McLaren, C.E.; Pelot, D.; Fujikawa-Brooks, S.; Carpenter, P.M.; Hawk, E.; Kelloff, G.; Lawson, M.J.; Kidao, J.; McCracken, J.; et al. Difluoromethylornithine Plus Sulindac for the Prevention of Sporadic Colorectal Adenomas: A Randomized Placebo-Controlled, Double-Blind Trial. Cancer Prev. Res. 2008, 1, 32–38. [Google Scholar] [CrossRef] [PubMed] [Green Version]
  27. Gerner, E.W.; Bruckheimer, E.; Cohen, A. Cancer Pharmacoprevention: Targeting Polyamine Metabolism to Manage Risk Factors for Colon Cancer. J. Biol. Chem. 2018, 293, 18770–18778. [Google Scholar] [CrossRef] [Green Version]
  28. Danza, K.; Silvestris, N.; Simone, G.; Signorile, M.; Saragoni, L.; Brunetti, O.; Monti, M.; Mazzotta, A.; De Summa, S.; Mangia, A.; et al. Role of miR-27a, miR-181a and miR-20b in gastric cancer hypoxia-induced chemoresistance. Cancer Biol. Ther. 2016, 17, 400–406. [Google Scholar] [CrossRef] [Green Version]
  29. Itoh, M.; Nishibori, N.; Her, S.; Lee, M.; Morita, K. Chemical Hypoxia-Induced Stimulation of Polyamine Biosynthesis and Ornithine Decarboxylase Gene Transcription in C6 Glioma Cells. J. Mol. Pathophysiol. 2015, 4, 29–37. [Google Scholar] [CrossRef]
  30. Huang, L.; Wu, R.L.; Xu, A.M. Epithelial-Mesenchymal Transition in Gastric Cancer. Am. J. Transl. Res. 2015, 7, 2141–2158. [Google Scholar]
  31. Ohtani, S.; Terashima, M.; Satoh, J.; Soeta, N.; Saze, Z.; Kashimura, S.; Ohsuka, F.; Hoshino, Y.; Kogure, M.; Gotoh, M. Expression of Tight-Junction-Associated Proteins in Human Gastric Cancer: Downregulation of Claudin-4 Correlates with Tumor Aggressiveness and Survival. Gastric Cancer 2009, 12, 43–51. [Google Scholar] [CrossRef] [PubMed]
  32. Ghassemifar, R.; Lai, C.M.; Rakoczy, P.E. VEGF Differentially Regulates Transcription and Translation of ZO-1alpha+ and ZO-1alpha- and Mediates Trans-Epithelial Resistance in Cultured Endothelial and Epithelial Cells. Cell Tissue Res. 2006, 323, 117–125. [Google Scholar] [CrossRef] [PubMed]
  33. Abu-Farsakh, S.; Wu, T.; Lalonde, A.; Sun, J.; Zhou, Z. High Expression of Claudin-2 in Esophageal Carcinoma and Precancerous Lesions Is Significantly Associated with the Bile Salt Receptors VDR and TGR5. BMC Gastroenterol. 2017, 17, 33. [Google Scholar] [CrossRef] [Green Version]
  34. Jung, H.; Jun, K.H.; Jung, J.H.; Chin, H.M.; Park, W.B. The Expression of Claudin-1, Claudin-2, Claudin-3, and Claudin-4 in Gastric Cancer Tissue. J. Surg. Res. 2011, 167, e185–e191. [Google Scholar] [CrossRef] [PubMed]
  35. Yang, L.; Sun, X.; Meng, X. Differences in the Expression Profiles of Claudin Proteins in Human Gastric Carcinoma Compared with Non-Neoplastic Mucosa. Mol. Med. Rep. 2018, 18, 1271–1278. [Google Scholar] [CrossRef] [PubMed] [Green Version]
  36. Venugopal, S.; Anwer, S.; Szászi, K. Claudin-2: Roles beyond Permeability Functions. Int. J. Mol. Sci. 2019, 20, 5655. [Google Scholar] [CrossRef] [Green Version]
  37. Dhawan, P.; Ahmad, R.; Chaturvedi, R.; Smith, J.J.; Midha, R.; Mittal, M.K.; Krishnan, M.; Chen, X.; Eschrich, S.; Yeatman, T.J.; et al. Claudin-2 Expression Increases Tumorigenicity of Colon Cancer Cells: Role of Epidermal Growth Factor Receptor Activation. Oncogene 2011, 30, 3234–3247. [Google Scholar] [CrossRef] [Green Version]
  38. Paquet-Fifield, S.; Koh, S.L.; Cheng, L.; Beyit, L.M.; Shembrey, C.; Mølck, C.; Behrenbruch, C.; Papin, M.; Gironella, M.; Guelfi, S.; et al. Tight Junction Protein Claudin-2 Promotes Self-Renewal of Human Colorectal Cancer Stem-like Cells. Cancer Res. 2018, 78, 2925–2938. [Google Scholar] [CrossRef] [Green Version]
  39. Mima, S.; Takehara, M.; Takada, H.; Nishimura, T.; Hoshino, T.; Mizushima, T. NSAIDs Suppress the Expression of Claudin-2 to Promote Invasion Activity of Cancer Cells. Carcinogenesis 2008, 29, 1994–2000. [Google Scholar] [CrossRef]
  40. Asplund, J.; Kauppila, J.H.; Mattsson, F.; Lagergren, J. Survival Trends in Gastric Adenocarcinoma: A Population-Based Study in Sweden. Ann. Surg. Oncol. 2018, 25, 2693–2702. [Google Scholar] [CrossRef]
  41. Matusiewicz, M.; Neubauer, K.; Bednarz-Misa, I.; Gorska, S.; Krzystek-Korpacka, M. Systemic interleukin-9 in inflammatory bowel disease: Association with mucosal healing in ulcerative colitis. World J. Gastroenterol. 2017, 23, 4039–4046. [Google Scholar] [CrossRef] [PubMed]
  42. Gerlach, K.; Weigmann, B. The Dichotomous Function of Interleukin-9 in Cancer Diseases. J. Mol. Med. 2019, 97, 1377–1383. [Google Scholar] [CrossRef] [PubMed]
  43. Krzystek-Korpacka, M.; Diakowska, D.; Kapturkiewicz, B.; Bębenek, M.; Gamian, A. Profiles of Circulating Inflammatory Cytokines in Colorectal Cancer (CRC), High Cancer Risk Conditions, and Health Are Distinct. Possible Implications for CRC Screening and Surveillance. Cancer Lett. 2013, 337, 107–114. [Google Scholar] [CrossRef] [PubMed]
  44. El-Omar, E.M. The Importance of Interleukin 1β in Helicobacter pylori Associated Disease. Gut 2001, 48, 743–747. [Google Scholar] [CrossRef] [Green Version]
  45. Rozengurt, E.; Walsh, J.H. Gastrin, CCK, Signaling, and Cancer. Annu. Rev. Physiol. 2001, 63, 49–76. [Google Scholar] [CrossRef]
  46. Camargo, C.M.; Mera, R.; Correa, P.; Peek, R.M., Jr.; Fontham, E.T.H.; Goodman, K.J.; Piazuelo, B.M.; Sicinschi, L.; Zabaleta, J.; Schneider, B.G. Interleukin-1β and Interleukin-1 Receptor Antagonist Gene Polymorphisms and Gastric Cancer: A Meta-analysis. Cancer Epidemiol. Biomark. Prev. 2006, 15, 1674–1687. [Google Scholar] [CrossRef] [Green Version]
  47. Rabinovich, G.A.; Gabrilovich, D.; Sotomayor, E.M. Immunosuppressive Strategies that are Mediated by Tumor Cells. Annu. Rev. Immunol. 2007, 25, 267–296. [Google Scholar] [CrossRef] [Green Version]
  48. Hallett, M.A.; Venmar, K.T.; Fingleton, B. Cytokine Stimulation of Epithelial Cancer Cells: The Similar and Divergent Functions of IL4 and IL13. Cancer Res. 2012, 72, 6338–6343. [Google Scholar] [CrossRef] [Green Version]
  49. Bankaitis, K.V.; Fingleton, B. Targeting IL4/IL4R for the Treatment of Epithelial Cancer Metastasis. Clin. Exp. Metastasis 2015, 32, 847–856. [Google Scholar] [CrossRef]
  50. Hellemans, J.; Vandesompele, J. qPCR Data analysis—Unlocking the Secret to Successful Results. In PCR Troubleshooting and Optimization: The Essential Guide, 1st ed.; Kennedy, S., Oswald, N., Eds.; Caister Academic Press: Poole, UK, 2011; pp. 1–13. [Google Scholar]
Figure 1. Pairwise analysis of local expression of cancer-promoting mediators in gastric mucosa: (a) Ki67; (b) BCL2; (c) BCLxL; (d) CDKN1A; (e) NOS2; (f) ODC1; (g) SLC2A1; (h) HIF1A; (i) VEGFA; (j) CCL2; (k) PTGS2; (l) ACTA2; (m) TJP1; (n) CLDN2; (o) IL7; (p) IL7Ra; (r) IL10; (s) IL10Ra. Data were analyzed as logs using t-test for paired samples and presented as geometric means of normalized relative quantities (NRQ) with 95% confidence interval (CI).
Ijms 21 04509 g001aIjms 21 04509 g001b
Figure 2. Pairwise analysis of local expression of cancer-promoting mediators in esophageal mucosa: (a) Ki67; (b) BCL2; (c) BCLxL; (d) CDKN1A; (e) NOS2; (f) ODC1; (g) SLC2A1; (h) HIF1A; (i) VEGFA; (j) CCL2; (k) PTGS2; (l) ACTA2; (m) TJP1; (n) CLDN2; (o) IL7; (p) IL7Ra; (r) IL10; (s) IL10Ra. Data were analyzed as logs using t-test for paired samples and presented as geometric means of normalized relative quantities (NRQ) with 95% confidence interval (CI).
Ijms 21 04509 g002aIjms 21 04509 g002b
Figure 3. Systemic concentration of cytokines, chemokines, and growth factors in cardia and non-cardia subtypes of gastric cancer: (a) IL-4; (b) IL-9; (c) FGF2; (d) RANTES. Data presented as means (red triangles) with 95% confidence interval (whiskers) and analyzed using t-test for independent samples with Welch correction.
Ijms 21 04509 g003
Table 1. Characteristics of study population for analysis of local molecular signatures.
Characteristics:ECGCp
n1615
Sex (F/M), n6/104/110.704 1
Age (yrs.), mean ± SD63.3 ± 766.0 ± 120.465 2
Stage (I/II/III/IV)0/5/9/22/3/7/30.404 3
Primary tumor, T (1/2/3/4)0/5/8/31/1/9/40.279 3
Lymph node metastasis, N (no/yes)8/85/100.472 1
Distant metastasis, M (no/yes)14/212/30.654 1
Histological grade, G (1/2/3/x)5/7/4/01/6/7/10.209 3
n, number of observations; F/M, female-to-male ratio; yrs., years; SD, standard deviation; 1, Fisher’s exact test; 2, t-test for independent samples with Welch correction for unequal variances; 3, Chi-squared test; EC, esophageal squamous cell carcinoma; GC, gastric adenocarcinoma.
Table 2. Comparison of fold change in gene expression between tumor and non-cancerous tumor-adjacent tissue in gastric and esophageal cancer.
GeneFold-Change (Tumor-to-Adjacent)p
GCEC
Ki671.975.520.032 1
BCL20.350.900.078 2
BCLxL0.881.100.267 1
CDKN1A0.622.18<0.001 1
NOS23.298.120.527 1
ODC10.685.17<0.0001 1
SLC2A11.665.150.017 1
HIF1A0.942.510.001 1
VEGFA0.982.620.025 2
CCL20.523.34<0.0011
PTGS21.214.010.014 1
ACTA20.710.560.564 1
TJP10.620.750.496 1
CLDN23.981.610.128 1
IL70.981.320.642 2
IL7Ra1.651.950.805 1
IL102.763.90.616 2
IL10Ra2.81.740.467 2
Data presented as expression ratio (fold change) between tumor and non-cancerous tumor-adjacent tissue and analyzed on log-transformed data using 1 t-test for independent samples or 2 t-test for independent samples with Welch correction.
Table 3. Expression patterns of cancer-promoting genes in gastric cancer as compared to esophageal and colorectal cancer.
GeneNon-Cancerous Tissue (NRQ)Tumor (NRQ)
GCECpGCECp
Ki672.190.550.027 14.323.050.347 2
BCL24.871.190.0001 21.681.070.372 2
BCLxL3.080.89<0.001 22.720.990.002 2
CDKN1A3.410.55<0.0001 22.11.20.038 1
NOS20.370.050.073 11.230.380.100 1
ODC15.80.59<0.0001 13.913.070.518 1
SLC2A10.90.810.778 11.54.170.011 1
HIF1A4.541.420.001 24.273.550.609 2
VEGFA4.60.52<0.001 24.521.360.004 2
CCL29.390.87<0.001 24.932.910.243 1
PTGS22.930.56<0.001 13.552.220.240 1
ACTA24.571.910.008 13.231.060.008 1
TJP14.441.72<0.001 12.741.290.019 2
CLDN23.360.19<0.001 113.40.3<0.001 1
IL71.930.890.0951.91.170.345 1
IL7Ra1.860.530.047 23.061.040.037 1
IL100.780.700.805 22.162.730.695 2
IL10Ra0.560.560.993 21.570.970.245 2
Data presented as geometric means of normalized relative quantities (NRQ) and analyzed as log-transformed data using 1t-test for independent samples or 2t-test for independent samples with Welch correction.
Table 4. Independent predictors of gene expression in non-cancerous tissues from GC patients—results of least squares multiple regression.
Explained VariableExplanatory Variables
EnteredRetainedR2
CLDN2BCLxL, SLC2A1, Ki67, NOS2Ki67: rp = 0.81, NOS2: rp = 0.800.827
ACTA2CCL2, PTGS2, IL-7, CDKN1A, TJP1PTGS2: rp = 0.620.381
TJP1ACTA2, HIF1A, VEGFA, BCLxL, SLC2A1, ODC1, CDKN1A, BCL2, Ki67ACTA2: rp = 0.68, HIF1A: rp = 0.67,
VEGFA: rp = 0.71
0.896
ODC1SLC2A1, HIF1A, BCLxL, CDKN1A, BCL2, Ki67, VEGFA, TJP1SLC2A1: rp = 0.64, HIF1A: rp = 0.880.938
SLC2A1BCLxL, HIF1A, CDKN1A, ODC1, BCL2, CLDN2, Ki67, VEGFA, TJP1ODC1: rp = 0.850.715
VEGFABCLxL, BCL2, CCL2, HIF1A, CDKN1A, ODC1, Ki67, TJP1TJP1: rp = 0.840.712
HIF1ASLC2A1, BCL2, Ki67, VEGFA, TJP1, BCLxL, CCL2, ODC1, CDKN1ABCLxL: rp = 0.80, CCL2: rp = 0.90, ODC1: rp = 0.95, CDKN1A: rp = −0.810.987
PTGS2ACTA2, CDKN1A, BCL2, CCL2CCL2: rp = 0.770.585
CCL2ACTA2, HIF1A, CDKN1A, Ki67, PTGS2, BCL2, IL7PTGS2: rp = 0.53, BCL2: rp = 0.69,
IL7: rp = −0.78
0.876
Ki67BCLxL, CLDN2, SLC2A1, HIF1A, ODC1, BCL2, VEGFA, TJP1BCLxL: rp = 0.70 CLDN2: rp = 0.580.753
‘BCLxLSLC2A1, HIF1A, ODC1, CDKN1A, BCL2, CLDN2, Ki67, VEGFA, TJP1HIF1A: rp = 0.900.808
BCL2HIF1A, PTGS2, BCLxL, CCL2, SLC2A1, ODC1, CDKN1A, CLDN2, VEGFA, TPJ1, Ki67HIF1A: rp = 0.75, PTGS2: rp = 0.600.772
CDKN1AACTA2, BCLxL, SLC2A1, BCL2, TJP1, PTGS2, CCL2, HIF1A, ODC1, VEGFACCL2: rp = 0.89, HIF1A: rp = −0.73, ODC1: rp = 0.59, VEGFA: rp = 0.660.871
Variables significantly correlated with explained variable in univariate analysis (Pearson correlation) were entered into the least squares multiple regression analysis (listed as Explanatory Variables: Entered). Variables were retained (listed as Explanatory Variables: Retained) in the regression model if p < 0.1. Partial correlation coefficients (rp) are presented for explanatory variables independently from other variables associated with explained variable. Model fit is presented as the coefficient of determination (R2).
Table 5. Independent predictors of gene expression in tumor tissues from GC patients—results of least squares multiple regression.
Explained VariableExplanatory Variables
EnteredRetainedR2
CLDN2Ki67, BCLxLBCLxL: rp = 0.800.642
ACTA2BCL2, CCL2, NOS2, CDKN1A, TJP1BCL2: rp = 0.630.391
TJP1CCL2, IL7, NOS2, ODC1, ACTA2, BCL2, HIF1A, CDKN1A, PTGS2BCL2: rp = 0.84, HIF1A: rp = 0.71,
CDKN1A: rp = 0.91,
PTGS2: rp = −0.82
0.978
ODC1HIF1A, BCLxL, CCL2, SLC2A1, Ki67, CDKN1A, PTGS2, VEGFA, TJP1HIF1A: rp = 0.860.736
SLC2A1Ki67, BCLxL, HIF1A, VEGFA, ODC1Ki67: rp = 0.800.632
VEGFABCLxL, ODC1, SLC2A1, HIF1A, Ki67, CDKN1ASLC2A1: rp = 0.770.589
HIF1ACCL2, ODC1, BCL2, BCLxL, Ki67, PTGS2, VEGFA, TJP1, SLC2A1, IL7, CDKN1ACCL2: rp = 0.78, ODC1: rp = 0.760.896
PTGS2BCLxL, CCL2, VEGFA, HIF1A, Ki67, CDKN1A, ODC1, TJP1BCLxL: rp = −0.60,
CCL2: rp = 0.85,
VEGFA: rp = 0.87
0.907
CCL2HIF1A, BCL2, IL7, ODC1, PTGS2, CDKN1A, ACTA2, TJP1HIF1A: rp = 0.74, BCL2: rp = 0.560.829
Ki67BCLxL, ODC1, CLDN2, HIF1A, PTGS2, CDKN1A, VEGFA, SLC2A1BCLxL: rp = 0.91,
ODC1: rp = 0.82
0.940
BCLxLCLDN2, Ki67, SLC2A1, HIF1A, ODC1, VEGFACLDN2: rp = 0.72, Ki67: rp = 0.870.913
BCL2TJP1, CCL2, CLDN2, HIF1A, IL7, CDKN1A, ACTA2TJP1: rp = 0.880.779
CDKN1APTGS2, TJP1, BCL2, CCL2, HIF1A, Ki67, NOS2, ODC1, VEGFA, ACTA2PTGS2: rp = 0.76, TJP1: rp = 0.890.915
Variables significantly correlated with explained variable in univariate analysis (Pearson correlation) were entered into the least squares multiple regression analysis (listed as Explanatory variables: Entered). Variables were retained (listed as Explanatory variables: Retained) in the regression model if p < 0.1. Partial correlation coefficients (rp) are presented for explanatory variables independently from other variables associated with explained variable. Model fit is presented as coefficient of determination (R2).
Table 6. Impact of pathological stage on fold change in expression of cancer-related genes in gastric cancer.
GeneTNM 1T 1N (N0 vs. N1/2) 2M 2G 1
Ki670.63 30.50 50.77 vs. 3.16 3nsns
BCL2ns0.50 50.11 vs. 0.62 5nsns
BCLxLnsns0.62 vs. 1.05 5nsns
CDKN1A0.51 30.55 3ns0.50 vs. 1.44 50.58 3
ODC10.58 30.46 50.32 vs. 0.99 4nsns
HIF1A0.56 3ns0.43 vs. 1.39 4nsns
CCL2ns0.53 30.22 vs. 0.8 5ns0.54 3
PTGS2nsnsnsns0.48 5
TJP10.66 40.69 40.3 vs. 0.88 30.49 vs. 1.59 5ns
IL10nsnsnsns0.56 3
Data presented as 1 Spearman correlation coefficients (ρ) or 2 mean fold change in expression (tumor to adjacent) analyzed using one-way ANOVA on log-transformed data. Only significant associations or tendencies (p < 0.1) are presented. TNM, cancer stage (tumor-node-metastases); T, extension of primary tumor; N, lymph node involvement; M, distant metastases; G, histological grade; ns, non-significant. Statistical significance is marked as 3, p ≤ 0.05; 4, p < 0.01; 5, tendency (0.1 > p > 0.05).
Table 7. Characteristics of study population for analysis of systemic cytokine signatures.
Characteristics:BenignECGCp
CardiaNon-Cardia
n39923232-
Sex (F/M), n18/2131/617/2510/210.195 1
Age (yrs.), mean ± SD61.1 ± 1362.4 ± 962.3 ± 963.3 ± 110.820 2
Stage (I/II/III/IV)6/23/25/380/5/6/211/9/6/160.260 1
Primary tumor, T (1/2/3/4)8/15/27/420/1/8/231/2/12/170.059 1
Lymph node metastasis, N (no/yes)33/595/2710/220.102 1
Distant metastasis, M (no/yes)54/3811/2116/160.058 1
n, number of observations; F/M, female-to-male ratio; yrs., years; SD, standard deviation; 1, Chi-squared test; 2, one-way ANOVA; EC, esophageal squamous cell carcinoma; GC, gastric adenocarcinoma.
Table 8. Systemic concentration of cytokines, chemokines and growth factors in gastric cancer as compared to esophageal cancer and benign conditions of upper gastrointestinal tract.
Cytokine
(pg/mL)
Benign ConditionsEsophageal CancerGastric Cancerp Value
IL-1β0.15 (0.15–0.15) 2,30.15 (0.15–1.66) 1,31.12 (0.15–1.55) 1,2<0.0001
IL-1ra339.3 (116–630) 2,3119.4 (71–518) 1,367.8 (42–167) 1,2<0.0001
IL-43.52 (2.4–4.2) 32.97 (2.0–4.0) 34.50 (3.3–5.0) 1,2<0.0001
IL-55.43 (4.1–7.5)5.65 (3.8–7.0)4.68 (3.0–8.1)0.270
IL-65.31 (1–11) 2,38.84 (15.5–14) 18.12 (5.4–15) 10.010
IL-78.02 (5.5–10)8.05 (6–11)7.06 (4.8–9.5)0.091
IL-843.5 (20–50)33.6 (17–49)21.7 (13–49)0.058
IL-958.5 (12–70)14.9 (7.5–69) 352.6 (38–67) 20.054
IL-104.15 (2.3–8.1)4.83 (3.1–7.9)4.33 (2.6–8.2)0.817
IL-12(p70)54.7 (28–81) 337.6 (18–70) 317.9 (6.9–57) 1,2<0.001
IL-1310.35 (5.6–14) 311.04 (7.6–16) 36.4 (4.3–9.8) 1,2<0.0001
IFNγ25.2 (16–34) 2,331.8 (19–47) 1,356.5 (28–74) 1,2<0.0001
IP-10925 (625–1244)745 (490–1124)831 (649–1097)0.326
EOX1135.5 (110–184)138.8 (92–195)150.5 (104–181)0.888
FGF223.9 (13–30)16.6 (8.6–28) 328.3 (18–36) 20.002
G-CSF33.9 (31–46) 2,343.6 (34–65) 141.0 (34–52) 10.024
GM-CSF3.05 (0.68–7.28) 26.39 (1.65–12.6) 1,32.61 (0.06–8.89) 20.008
MCP-166.1 (42–76) 354.3 (27–71) 324.1 (15–61) 1,2<0.0001
MIP-1α1.49 (0.2–2.7) 22.38 (1.4–3.4) 11.84 (1.5–2.7)0.019
MIP-1β74.5 (54–96)53.5 (32–85)74 (42–103)0.058
PDGF-BB1436 (1171–1970) 31584 (1021–2406) 31909 (1245–2757) 1,20.032
RANTES19,865 (912–21,922) 2,31893 (640–21,105) 12992 (1898–5199) 10.025
TNFα30.1 (25–34)27.0 (22–32)30.6 (23–39)0.137
VEGF-A43.4 (28–103)50.2 (26–88)48.8 (23–118)0.955
Data presented as medians with interquartile range and analyzed using Kruskal–Wallis H test with Conover post hoc test. 1, significantly different from benign conditions of upper gastrointestinal tract; 2, significantly different from esophageal cancer; 3, significantly different from gastric cancer.
Table 9. Individual cytokines and cytokine panels as differential biomarkers in gastric cancer.
CytokineAUC (95%CI), pSens. and Spec.J IndexCut-Off
IL-1β0.75 (0.65–0.83), p < 0.00170.3% and 84.6%0.549>0.15 pg/mL
IL-1ra0.76 (0.66–0.84), p < 0.00181.2% and 61.5%0.428≤238.1 pg/mL
IL-40.68 (0.58–0.76), p = 0.00157.8% and 76.9%0.347>4.15 pg/mL
IL-60.67 (0.57–0.76), p = 0.00375.0% and 53.8%0.289>5.53 pg/mL
IL12(p70)0.71 (0.61–0.79), p < 0.00162.5% and 74.4%0.369≤29.3 pg/mL
IL-130.66 (0.56–0.75), p = 0.00379.7% and 51.3%0.310≤10.3 pg/mL
IFNγ0.76 (0.66–0.84), p < 0.00154.7% and 94.9%0.496>54.01 pg/mL
G-CSF0.62 (0.52–0.71), p = 0.04382.8% and 41.0%0.238>32.3 pg/mL
MCP-10.72 (0.62–0.80), p < 0.00162.5% and 76.9%0.394≤44.4 pg/mL
PDGF-BB0.64 (0.54–0.73), p = 0.01253.1% and 74.4%0.275>1891 pg/mL
RANTES0.67 (0.57–0.76), p = 0.00778.1% and 66.7%0.448≤6005 pg/mL
Panel 1 10.87 (0.79–0.93), p < 0.00171.9% and 94.9%0.668>0.742 3
Panel 2 20.89 (0.82–0.95), p < 0.00182.8% and 92.3%0.751>0.595 3
1, Cytokine panel selected in logistic regression (stepwise method) consisting of IL-1β, IL-1ra, IL-6, and RANTES; 2, cytokine panel selected in logistic regression (backward method) consisting of IL-1ra, IL-4, IL-13, and IL-6; 3, predicted probabilities. AUC, area under receiver operating characteristics (ROC) curve; CI, confidence interval; sens., sensitivity; spec., specificity; J index, Youden index.
Table 10. Primers’ sequences.
SymbolGene NameAccession No.Primer Sequence 5′→3′Amp. Size (bp)
IL71Interleukin 7NM_000880.4F: gacagcatgaaagaaattggtagc
R: caacttgcgagcagcacggaat
117
IL7Ra1Interleukin 7 receptor alphaNM_002185.5F: atcgcagcactcactgacctgt
R: tcaggcactttacctccacgag
101
IL101Interleukin 10NM_000572.3F: tctccgagatgccttcagcaga
R: tcagacaaggcttggcaaccca
126
IL10Ra1Interleukin 10 receptor alphaNM_001558.4F: gccgaaagaagctacccagtgt
R: ggtccaagttcttcagctctgg
153
ACTA21Alpha smooth muscle actinNM_001141945.2F: ctatgcctctggacgcacaact
R: cagatccagacgcatgatggca
115
BCL21B-cell lymphoma 2NM_000633.3F: atcgccctgtggatgactgagt
R: gccaggagaaatcaaacagaggc
127
BCLxL1B-cell lymphoma-extra largeNM_001317919.2F: gccacttacctgaatgaccacc
R: aaccagcggttgaagcgttcct
131
CCL21Monocyte chemoattractant protein 1 (MCP1)NM_002982.4F: agaatcaccagcagcaagtgtcc
R: tcctgaacccacttctgcttgg
98
CDKN1A1Cyclin Dependent Kinase Inhibitor 1A (p21CIP1/WAF1)NM_001220777.2F: aggtggacctggagactctcag
R: tcctcttggagaagatcagccg
95
GAPDH2Glyceraldehyde-3-phosphate dehydrogenaseNM_001256799.3F: tagattattctctgatttggtcgtattgg
R: gctcctggaagatggtgatgg
223
CLDN21Claudin 2NM_020384.4F: gtgacagcagttggcttctcca
R: ggagattgcactggatgtcacc
153
SLC2A11Glucose transporter 1 (GLUT1)NM_006516.4F: ttgcaggcttctccaactggac
R: cagaaccaggagcacagtgaag
113
HIF1A1Hypoxia-inducible factor 1αNM_181054.3F: tatgagccagaagaacttttaggc
R: cacctcttttggcaagcatcctg
145
Ki671Proliferation marker Ki67NM_001145966.2F: gaaagagtggcaacctgccttc
R: gcaccaagttttactacatctgcc
151
NOS21Inducible nitric oxide synthaseNM_000625.4F: gctctacacctccaatgtgacc
R: ctgccgagatttgagcctcatg
136
ODC11Ornithine decarboxylaseNM_001287189.2F: ccaaagcagtctgtcgtctcag
R: cagagattgcctgcacgaaggt
162
PTGS21Prostaglandin-endoperoxide synthase 2 (COX2)NM_000963.4F: cggtgaaactctggctagacag
R: gcaaaccgtagatgctcaggga
156
TJP11Tight junction protein 1NM_001355014.2F: gtccagaatctcggaaaagtgcc
R: ctttcagcgcaccataccaacc
132
VEGFA1Vascular endothelial growth factor ANM_001025366.3F: ttgccttgctgctctacctcca
R: gatggcagtagctgcgctgata
126
Amp., amplicon; 1, primer sequences were as proposed by Origene (www.origene.com); 2, primers were designed using Beacon Designer Probe/Primer Design Software (BioRad), validated in silico by Blast analysis, and their specificity tested by means of melting curve analysis and an electrophoresis in a high-resolution agarose. Forward and reverse primer sequences are denoted by “F” and “R”, respectively.

