How Do Trichoderma Genus Fungi Win a Nutritional Competition Battle against Soft Fruit Pathogens? A Report on Niche Overlap Nutritional Potentiates


Abstract
1. Introduction
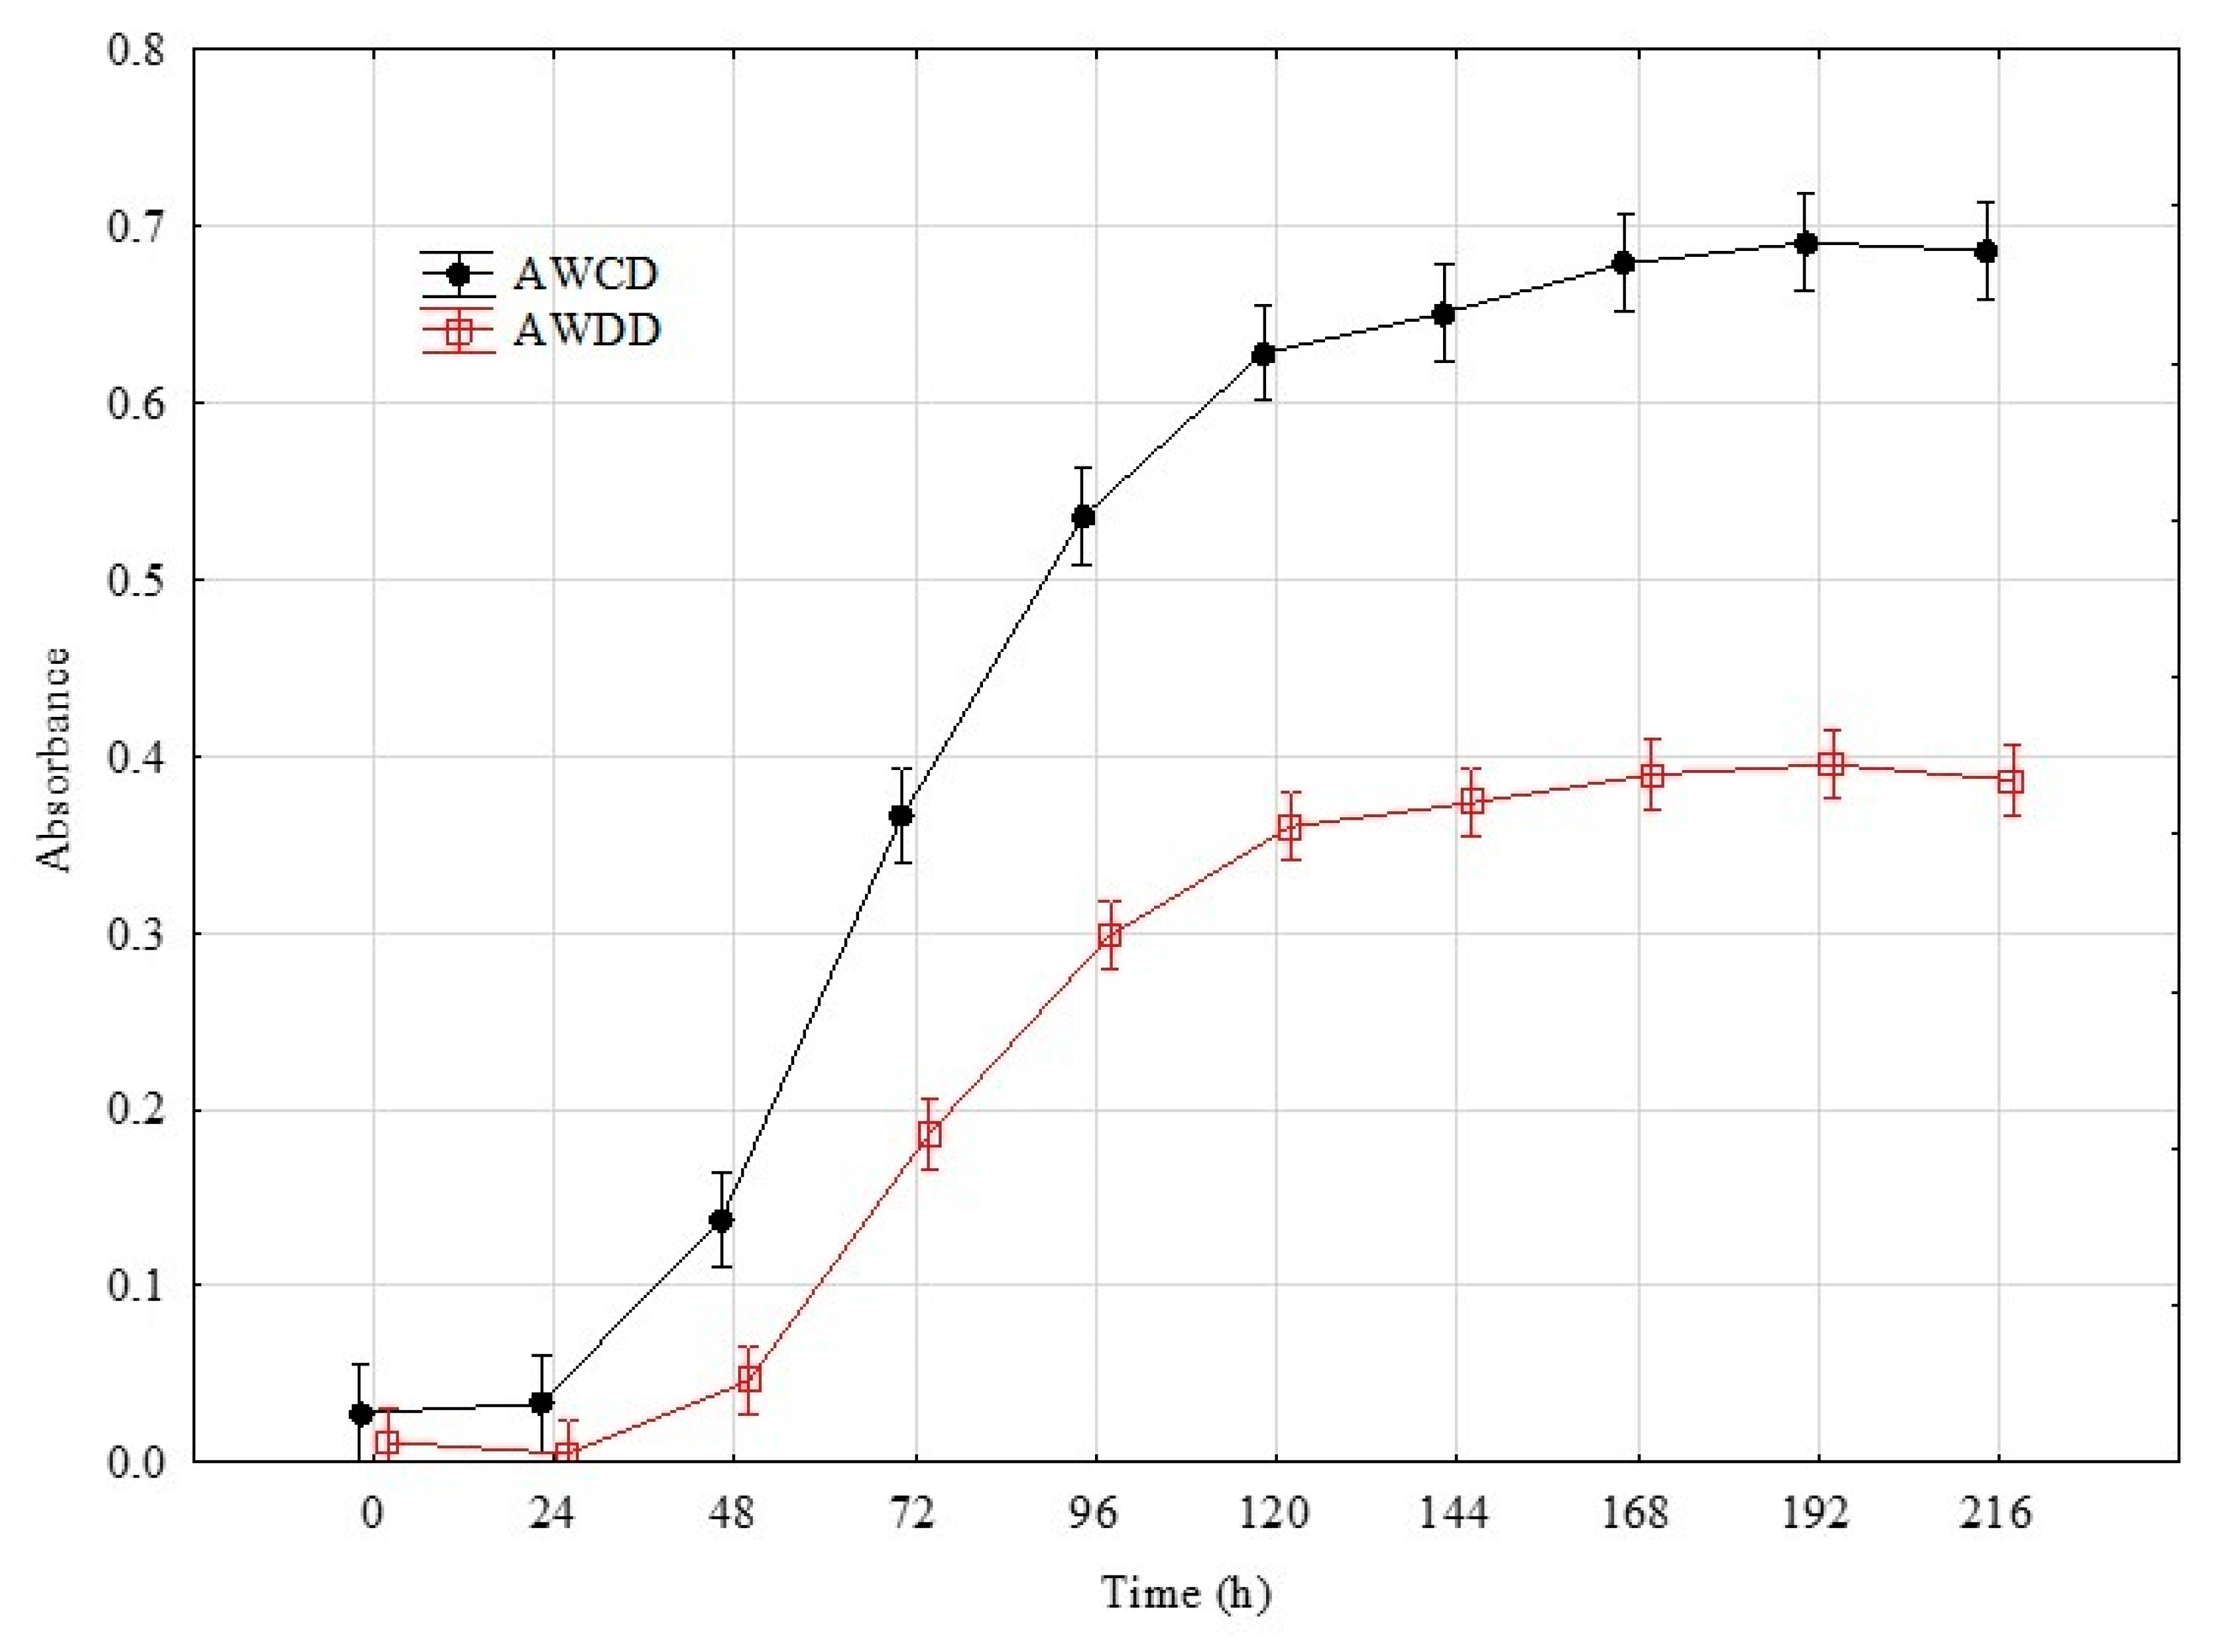
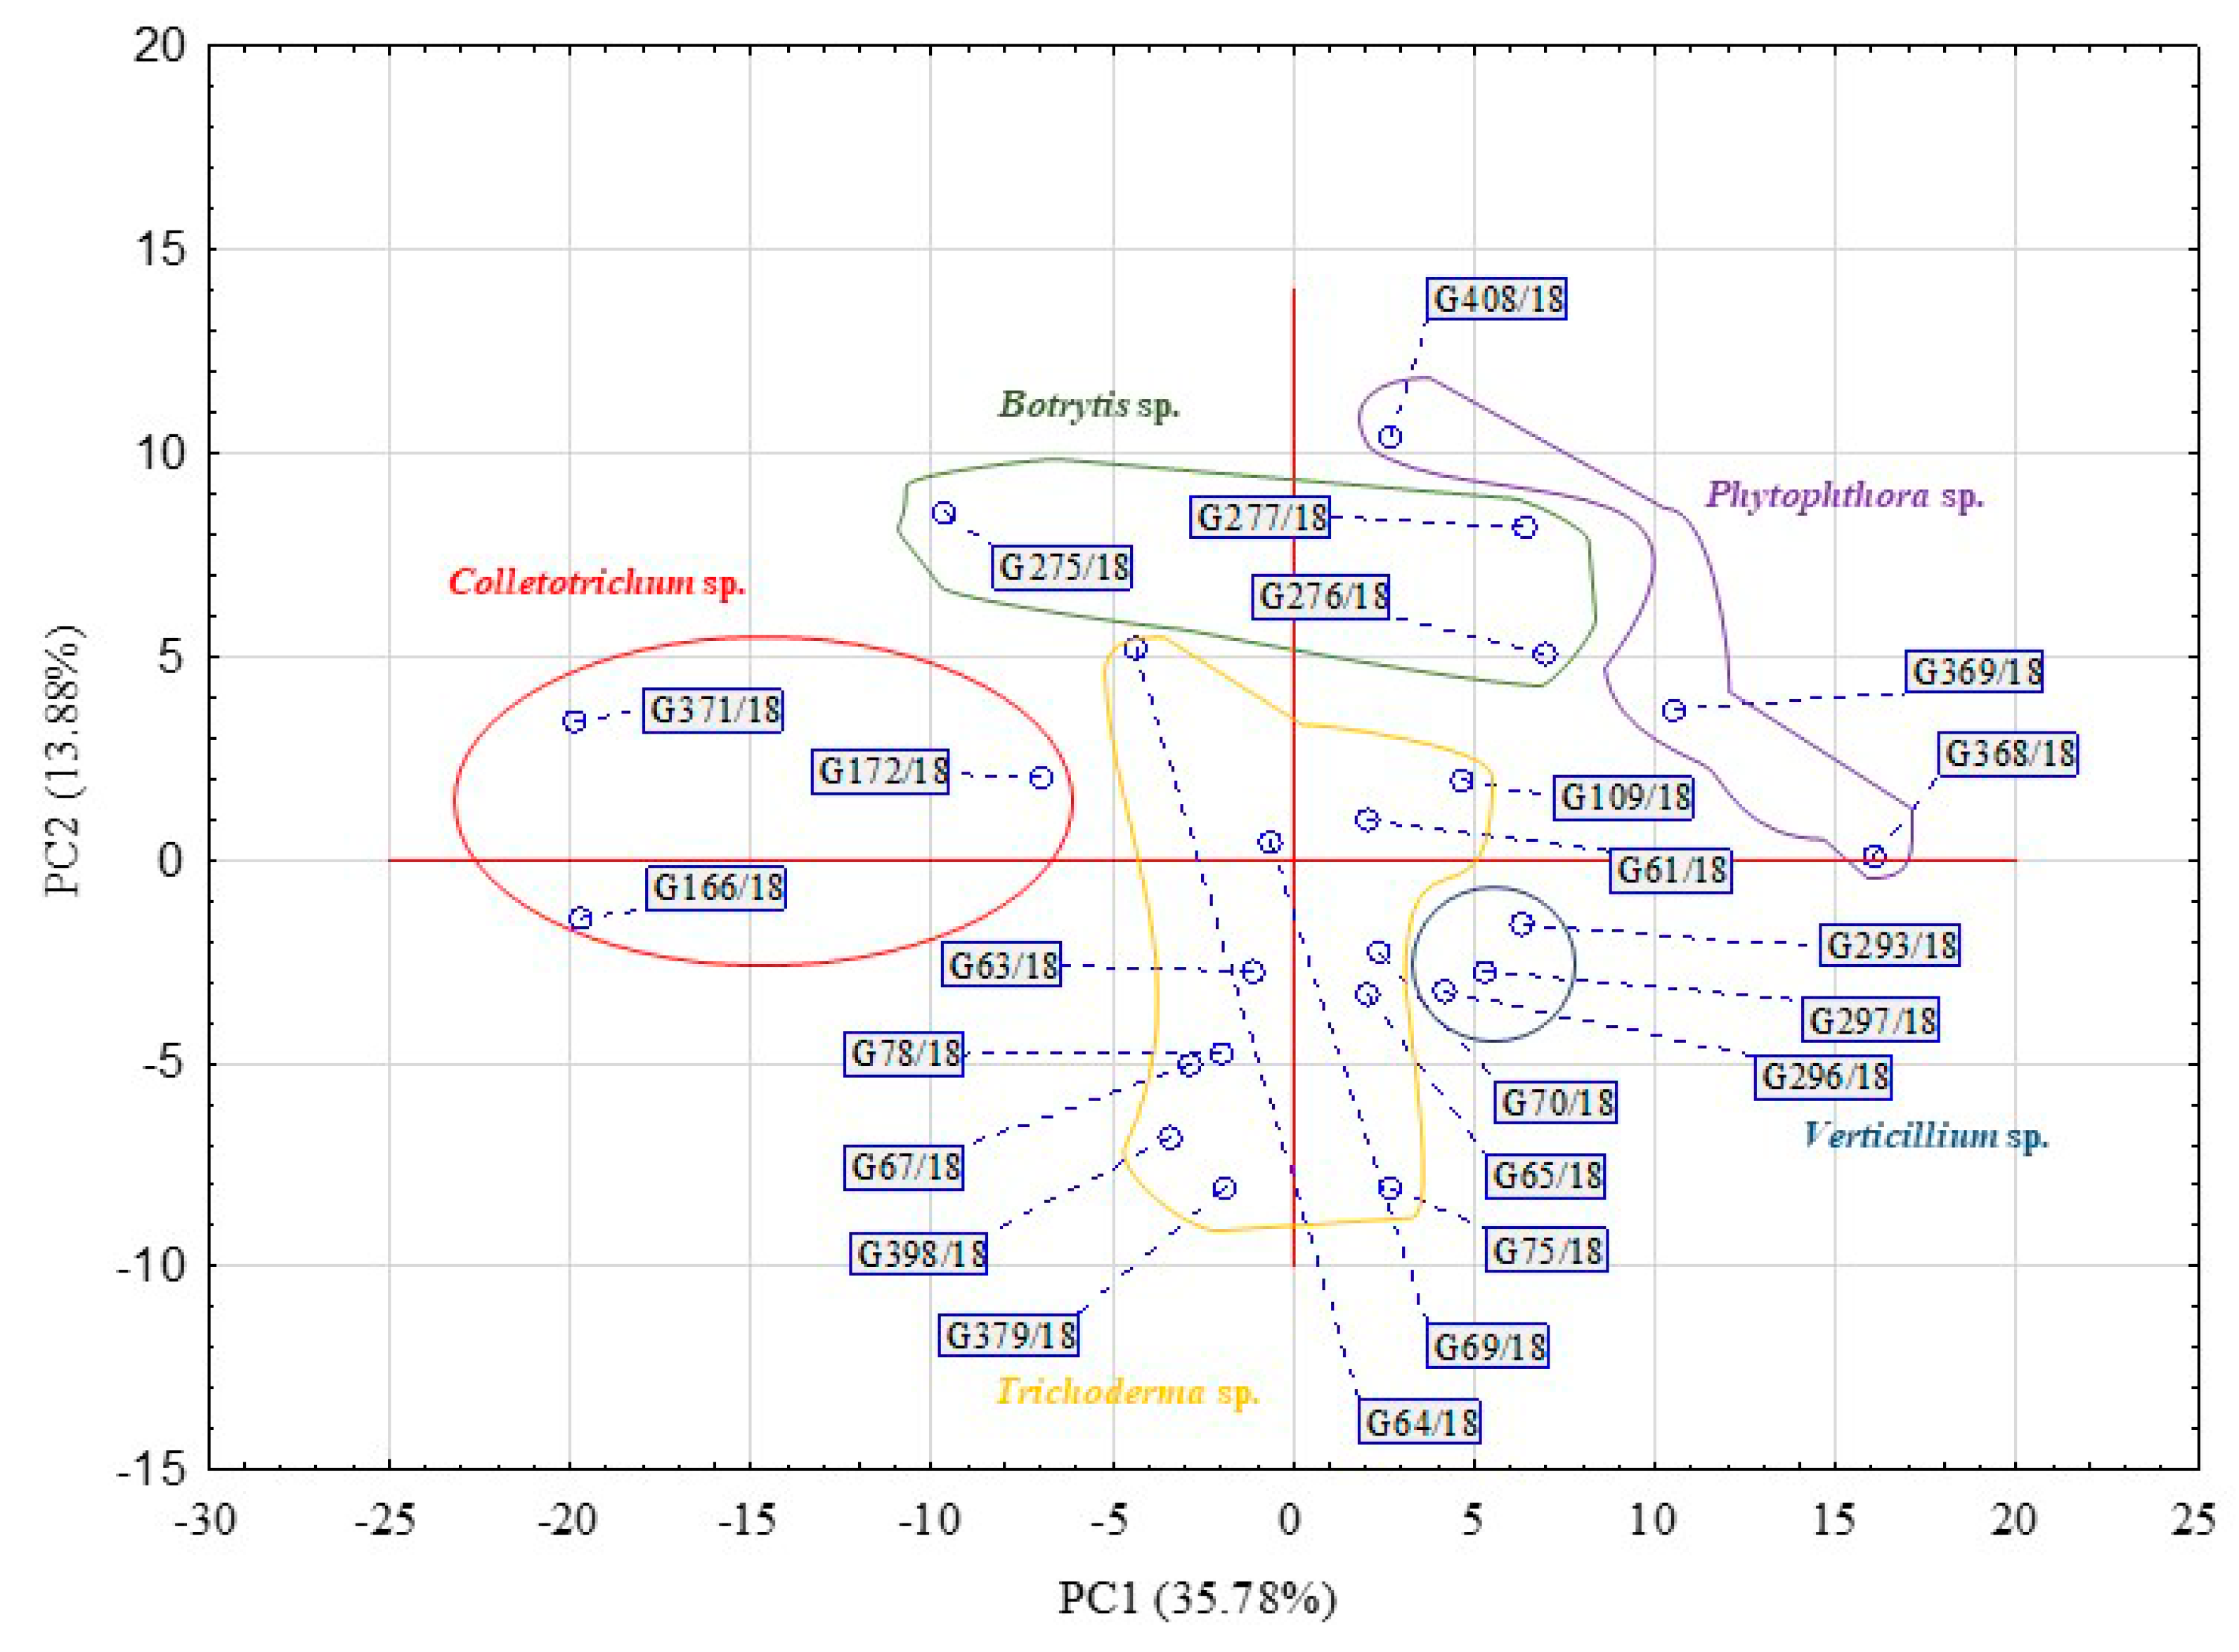
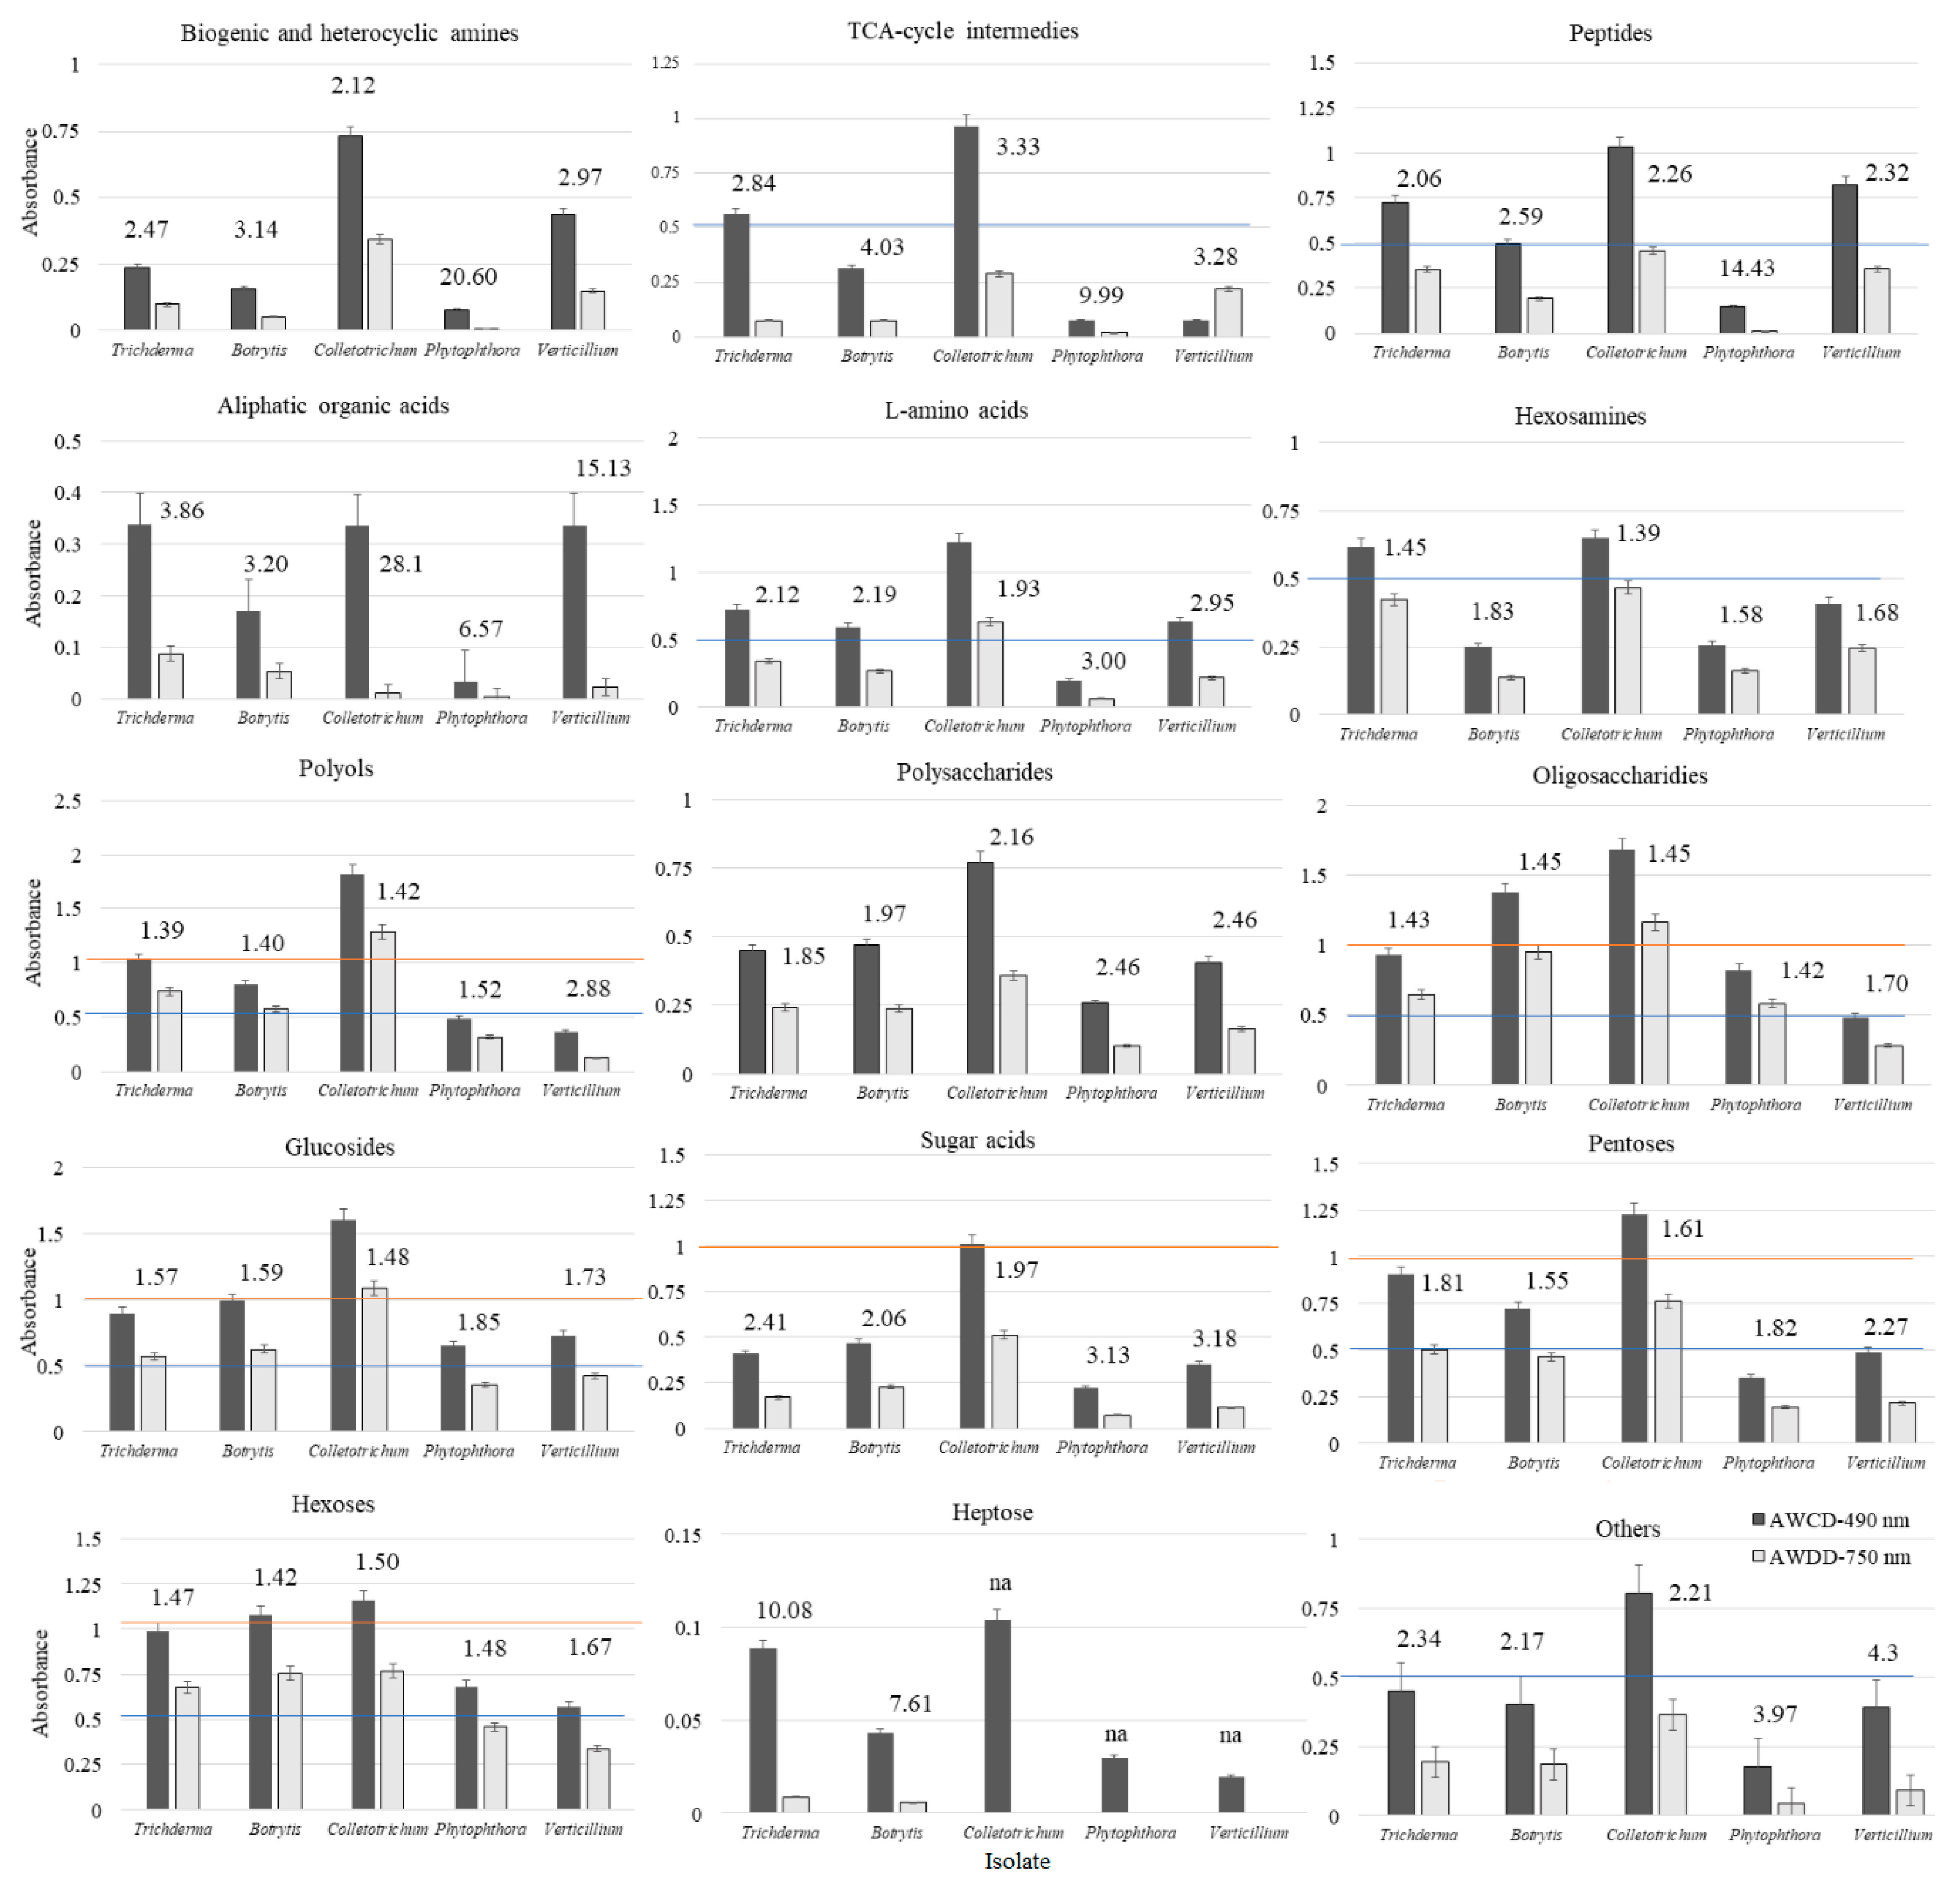
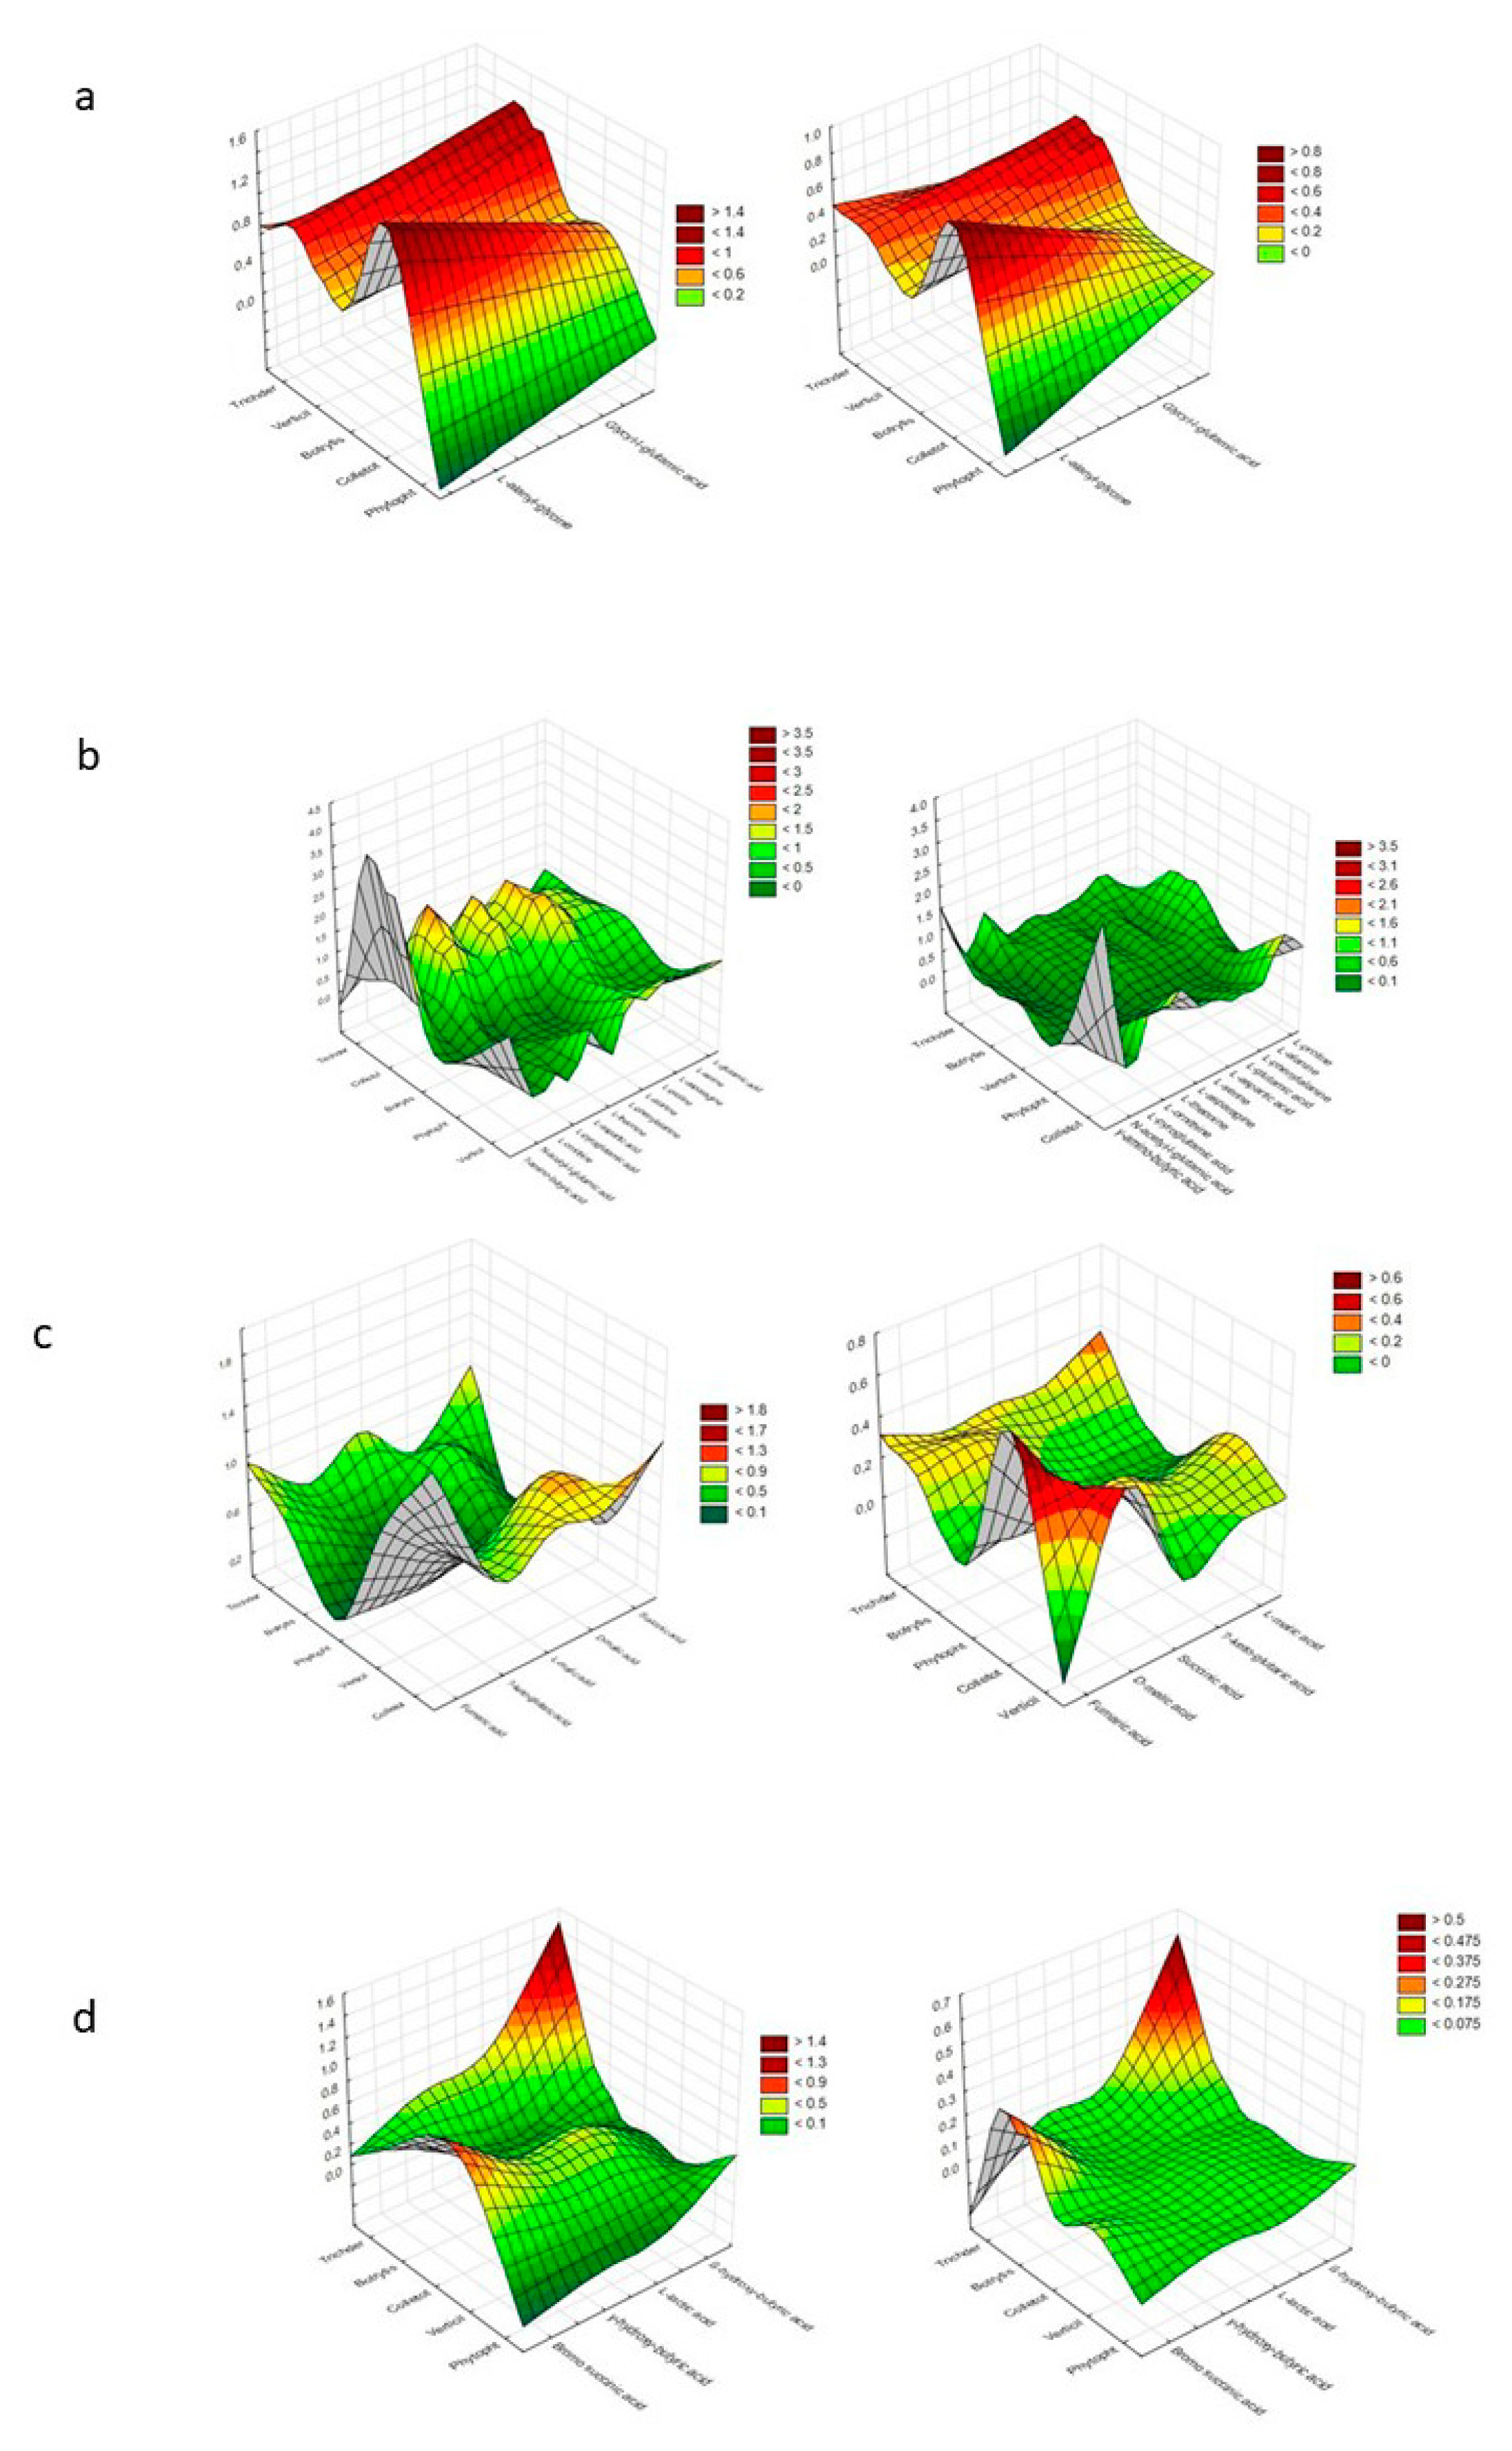
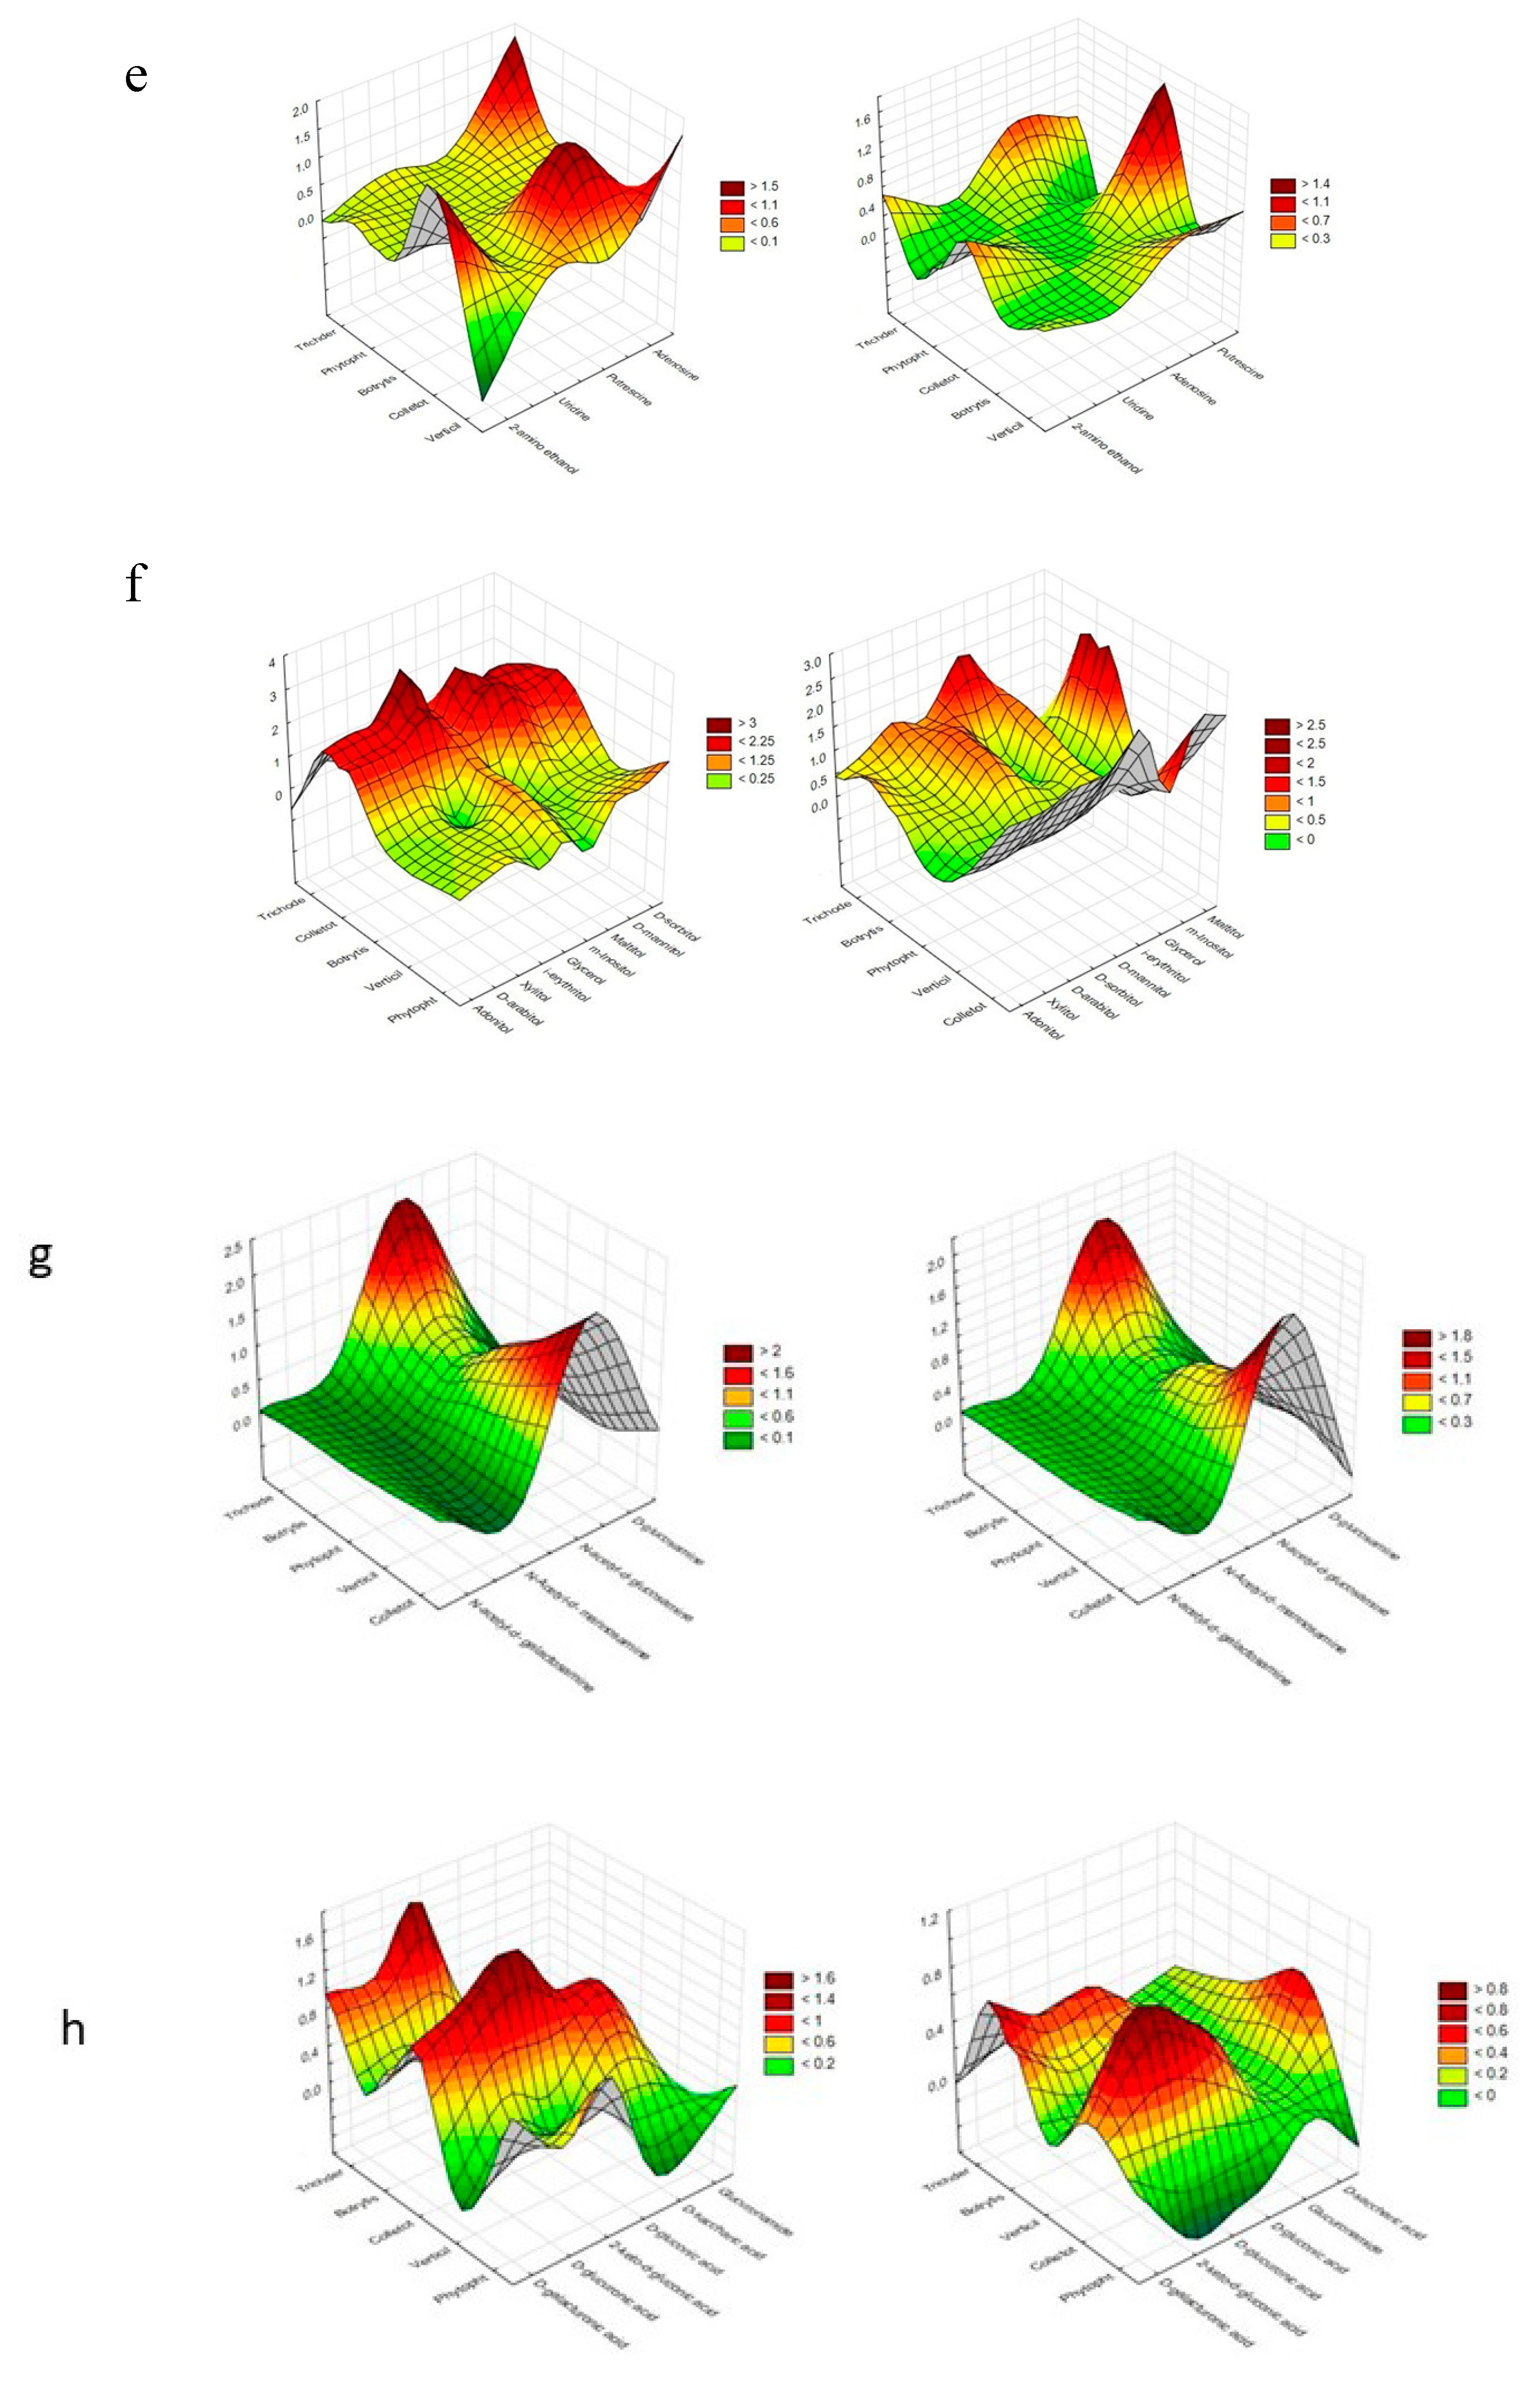
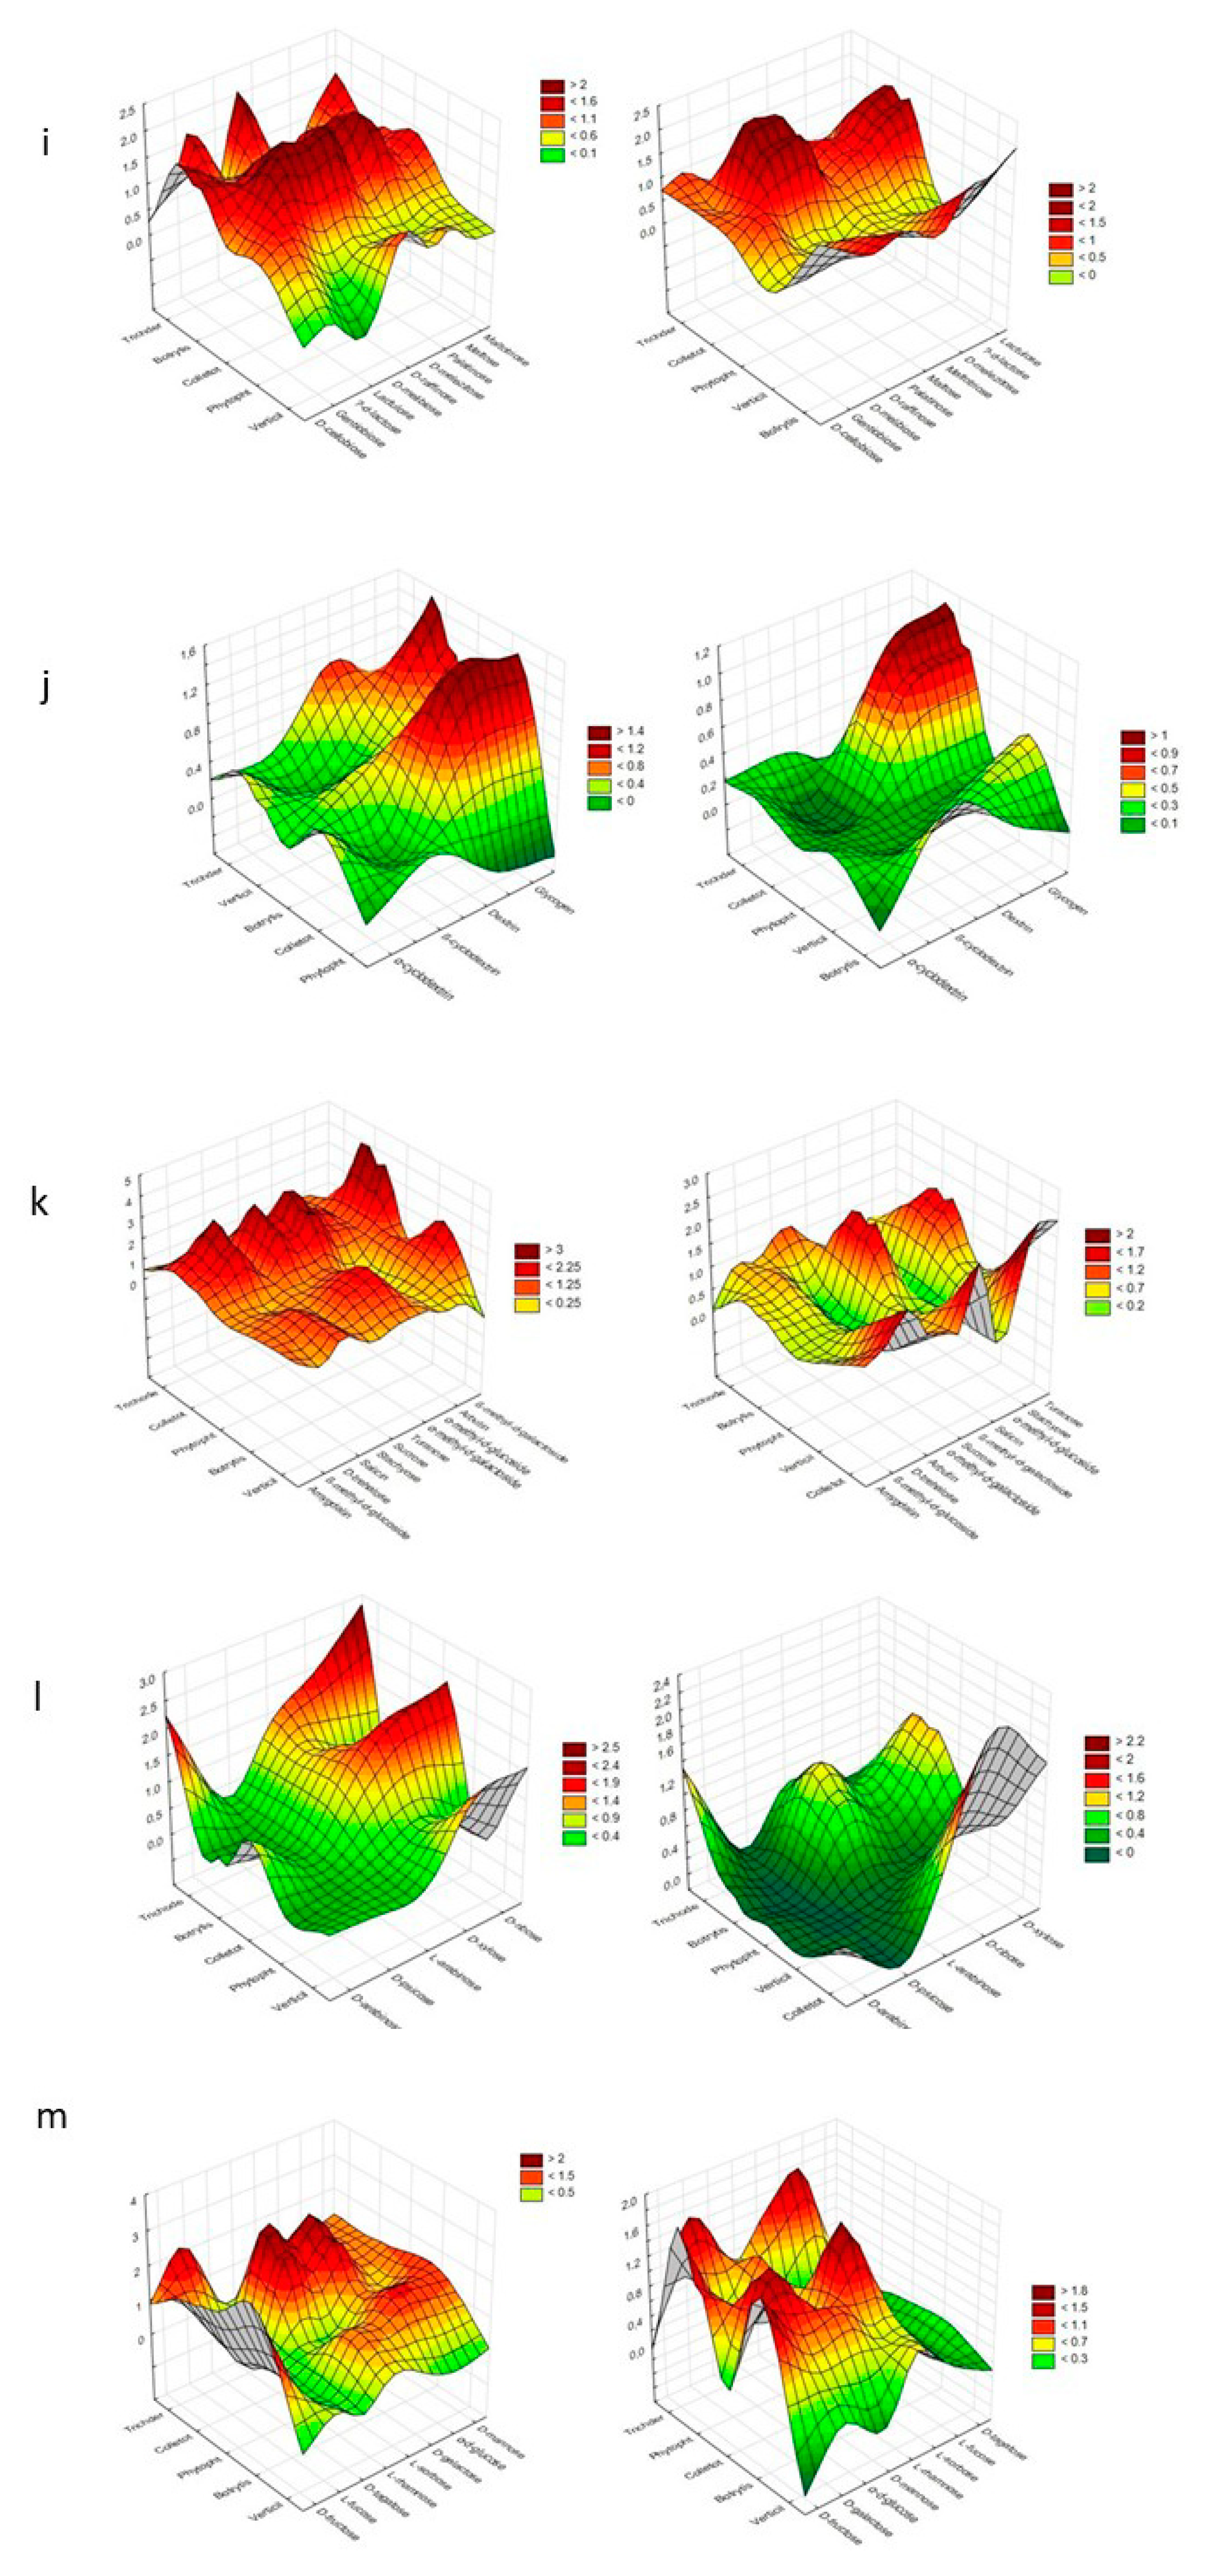
2. Results
3. Discussion
4. Materials and Methods
4.1. Fungal Strains
4.2. FF Plates® Preparation
4.3. Group of Substrate Use—Specific Phenotypic Profiles Based on Consumption and Growth Potentiates
4.4. Time Point Selection
4.5. Competition for Substrates Groups
4.6. Stressful Metabolic Situation
4.7. Substrate Usage Selectivity—Preferred and Non-Preferred Substrates
4.8. Saccharide Composition of Cell Wall Material from Strawberries
5. Conclusions
Author Contributions
Funding
Conflicts of Interest
Abbreviations
| FF | Filamentous Fungi |
| COMTRICH | Trichoderma Competitiveness Index |
| NOITOT | Total Niche Overlap index |
| AWCD | Average Well Colour Development |
| AWDD | Average Well Density Development |
| HPLC | High Performance Liquid Chromatography |
| PCA | Principal Component Analysis |
| PDA | Potato Dextrose Agar |
| TCA | Tricarboxylic Acid Cycle / Citric Acid Cycle |
| CWM | Cell Wall Material |
| TFA | Trifluoroacetic Acid |
| PMP | 1-Phenyl-3-methyl-5-pyrazolone |
| FF-IF | Biolog® Filamentous Fungi Inoculating Fluid |
| ITS | Internal Transcribed Spacer region |
| D2 LSU | D2 Region of the Large Subunit Ribosomal RNA Gene |
References
- Ceci, A.; Pinzari, F.; Russo, F.; Persiani, A.M.; Gadd, G.M. Roles of saprotrophic fungi in biodegradation or transformation of organic and inorganic pollutants in co-contaminated sites. Appl. Microb. Biotech. 2019, 103, 53–68. [Google Scholar] [CrossRef] [PubMed]
- Vega, D.; Gally, M.E.; Romero, A.M.; Poggio, S.L. Functional groups of plant pathogens in agroecosystems: A review. Eur. J. Plant Pathol. 2019, 153, 695–713. [Google Scholar] [CrossRef]
- Aladdin, A.; Dib, J.R.; Malek, R.A.; El Enshasy, H.A. Killer Yeast, a novel biological control of soilborne diseases for good agriculture practice. In Sustainable Technologies for the Management of Agricultural Wastes; Zakaria, Z.A., Ed.; Springer Singapore: Singapore, 2018; pp. 71–86. [Google Scholar] [CrossRef]
- Frąc, M.; Hannula, S.E.; Bełka, M.; Jędryczka, M. Fungal biodiversity and their role in soil health. Front. Microbiol. 2018, 9. [Google Scholar] [CrossRef] [PubMed]
- Malarczyk, D.; Panek, J.; Frac, M. Alternative molecular-based diagnostic methods of plant pathogenic fungi affecting berry crops—A Review. Molecules 2019, 24. [Google Scholar] [CrossRef]
- Szczałba, M.; Kopta, T.; Gąstoł, M.; Sękara, A. Comprehensive insight into arbuscular mycorrhizal fungi, Trichoderma spp. and plant multilevel interactions with emphasis on biostimulation of horticultural crops. J. Appl. Microb. 2019, 127, 630–647. [Google Scholar] [CrossRef]
- Pylak, M.; Oszust, K.; Frąc, M. Review report on the role of bioproducts, biopreparations, biostimulants and microbial inoculants in organic production of fruit. Rev. Environ. Sci. Bio Technol. 2019, 18, 597–616. [Google Scholar] [CrossRef]
- Weber, R.W.S.; Hahn, M. Grey mould disease of strawberry in northern Germany: Causal agents, fungicide resistance and management strategies. Appl. Microb. Biotech. 2019, 103, 1589–1597. [Google Scholar] [CrossRef]
- Fan, R.; Cockerton, H.M.; Armitage, A.D.; Bates, H.; Cascant-Lopez, E.; Antanaviciute, L.; Xu, X.; Hu, X.; Harrison, R.J. Vegetative compatibility groups partition variation in the virulence of Verticillium dahliae on strawberry. PLoS ONE 2018, 13, e0191824. [Google Scholar] [CrossRef]
- Nellist, C.F.; Vickerstaff, R.J.; Sobczyk, M.K.; Marina-Montes, C.; Wilson, F.M.; Simpson, D.W.; Whitehouse, A.B.; Harrison, R.J. Quantitative trait loci controlling Phytophthora cactorum resistance in the cultivated octoploid strawberry (Fragaria x ananassa). Hortic. Res. 2019, 6, 60. [Google Scholar] [CrossRef]
- Meszka, B.; Michalecka, M. Identification of Phytophthora spp. isolated from plants and soil samples on strawberry plantations in Poland. J. Plant Dis. Protect. 2016, 123, 29–36. [Google Scholar] [CrossRef]
- Ponisio, L.C.; Valdovinos, F.S.; Allhoff, K.T.; Gaiarsa, M.P.; Barner, A.; Guimarães, P.R.; Hembry, D.H.; Morrison, B.; Gillespie, R. A network perspective for community assembly. Front. Ecol. Evol. 2019, 7. [Google Scholar] [CrossRef]
- Kumar, A.; Verma, J.P. The role of microbes to improve crop productivity and soil health. In Ecological Wisdom Inspired Restoration Engineering; Achal, V., Mukherjee, A., Eds.; Springer Singapore: Singapore, 2019; pp. 249–265. [Google Scholar] [CrossRef]
- Latha, P.; Karthikeyan, M.; Rajeswari, E. Endophytic bacteria: Prospects and applications for the plant disease management. In Plant Health Under Biotic Stress: Volume 2: Microbial Interactions; Ansari, R.A., Mahmood, I., Eds.; Springer Singapore: Singapore, 2019; pp. 1–50. [Google Scholar] [CrossRef]
- Silva, R.N.; Monteiro, V.N.; Steindorff, A.S.; Gomes, E.V.; Noronha, E.F.; Ulhoa, C.J. Trichoderma/pathogen/plant interaction in pre-harvest food security. Fungal Biol. 2019, 123, 565–583. [Google Scholar] [CrossRef] [PubMed]
- Köhl, J.; Kolnaar, R.; Ravensberg, W.J. Mode of action of microbial biological control agents against plant diseases: Relevance beyond efficacy. Front. Plant. Sci. 2019, 10, 845. [Google Scholar] [CrossRef] [PubMed]
- Patel, J.; Teli, B.; Bajpai, R.; Meher, J.; Rashid, M.; Mukherjee, A.; Yadav, S.K. 13—Trichoderma-mediated biocontrol and growth promotion in plants: An endophytic approach. In Role of Plant Growth Promoting Microorganisms in Sustainable Agriculture and Nanotechnology; Kumar, A., Singh, A.K., Choudhary, K.K., Eds.; Woodhead Publishing: Cambridge, UK, 2019; pp. 219–239. [Google Scholar] [CrossRef]
- Blumenstein, K.; Albrectsen, B.R.; Martín, J.A.; Hultberg, M.; Sieber, T.N.; Helander, M.; Witzell, J. Nutritional niche overlap potentiates the use of endophytes in biocontrol of a tree disease. BioControl 2015, 60, 655–667. [Google Scholar] [CrossRef]
- Hewitt, S.K.; Foster, D.S.; Dyer, P.S.; Avery, S.V. Phenotypic heterogeneity in fungi: Importance and methodology. Fungal Biol. Rev. 2016, 30, 176–184. [Google Scholar] [CrossRef]
- Mikkelson, G.M. Niche-based vs. neutral models of ecological communities. Biol. Phil. 2005, 20, 557–566. [Google Scholar] [CrossRef]
- Oszust, K.; Panek, J.; Pertile, G.; Siczek, A.; Oleszek, M.; Frąc, M. Metabolic and genetic properties of petriella setifera precultured on waste. Front. Microb. 2018, 9. [Google Scholar] [CrossRef]
- Pawlik, A.; Ruminowicz-Stefaniuk, M.; Frąc, M.; Mazur, A.; Wielbo, J.; Janusz, G. The wood decay fungus Cerrena unicolor adjusts its metabolism to grow on various types of wood and light conditions. PLoS ONE 2019, 14, e0211744. [Google Scholar] [CrossRef]
- Wang, H.-C.; Li, L.-C.; Cai, B.; Cai, L.-T.; Chen, X.-J.; Yu, Z.-H.; Zhang, C.-Q. Metabolic phenotype characterization of Botrytis cinerea, the causal agent of gray mold. Front. Microb. 2018, 9. [Google Scholar] [CrossRef]
- Pertile, G.; Frąc, M.; Fornal, E.; Oszust, K.; Gryta, A.; Yaguchi, T. Molecular and metabolic strategies for postharvest detection of heat-resistant fungus Neosartorya fischeri and its discrimination from Aspergillus fumigatus. Postharv. Biol. Technol. 2020, 161, 111082. [Google Scholar] [CrossRef]
- Blumenstein, K.; Macaya-Sanz, D.; Martín, J.A.; Albrectsen, B.R.; Witzell, J. Phenotype MicroArrays as a complementary tool to next generation sequencing for characterization of tree endophytes. Front. Microb. 2015, 6. [Google Scholar] [CrossRef] [PubMed]
- Ceci, A.; Pinzari, F.; Riccardi, C.; Maggi, O.; Pierro, L.; Petrangeli Papini, M.; Gadd, G.M.; Persiani, A.M. Metabolic synergies in the biotransformation of organic and metallic toxic compounds by a saprotrophic soil fungus. Appl. Microb. Biotech. 2018, 102, 1019–1033. [Google Scholar] [CrossRef] [PubMed]
- Pertile, G.; Panek, J.; Oszust, K.; Siczek, A.; Frac, M. Intraspecific functional and genetic diversity of Petriella setifera. PeerJ 2018, 6, e4420. [Google Scholar] [CrossRef] [PubMed]
- Frąc, M.; Gryta, A.; Oszust, K.; Kotowicz, N. Fast and accurate microplate method (Biolog MT2) for detection of Fusarium fungicides resistance/sensitivity. Front. Microb. 2016, 7, 489. [Google Scholar] [CrossRef] [PubMed]
- Jeszka-Skowron, M.; Oszust, K.; Zgoła-Grześkowiak, A.; Frąc, M. Quality assessment of goji fruits, cranberries, and raisins using selected markers. Eur. Food Res. Technol. 2018, 244, 2159–2168. [Google Scholar] [CrossRef]
- Pinzari, F.; Maggi, O.; Lunghini, D.; Di Lonardo, D.P.; Persiani, A.M. A simple method for measuring fungal metabolic quotient and comparing carbon use efficiency of different isolates: Application to Mediterranean leaf litter fungi. Plant Biol. 2017, 151, 371–376. [Google Scholar] [CrossRef][Green Version]
- Oleszek, M.; Pecio, L.; Kozachok, S.; Lachowska-Filipiuk, Z.; Oszust, K.; Frac, M. Phytochemicals of apple pomace as prospect bio-fungicide agents against mycotoxigenic fungal species-in vitro experiments. Toxins 2019, 11. [Google Scholar] [CrossRef]
- Lopes, F.A.; Steindorff, A.S.; Geraldine, A.M.; Brandao, R.S.; Monteiro, V.N.; Lobo, M., Jr.; Coelho, A.S.; Ulhoa, C.J.; Silva, R.N. Biochemical and metabolic profiles of Trichoderma strains isolated from common bean crops in the Brazilian Cerrado, and potential antagonism against Sclerotinia sclerotiorum. Fungal Biol. 2012, 116, 815–824. [Google Scholar] [CrossRef]
- Mason, N.W.H.; de Bello, F.; Doležal, J.; Lepš, J. Niche overlap reveals the effects of competition, disturbance and contrasting assembly processes in experimental grassland communities. J. Ecol. 2011, 99, 788–796. [Google Scholar] [CrossRef]
- Dou, K.; Gao, J.; Zhang, C.; Yang, H.; Jiang, X.; Li, J.; Li, Y.; Wang, W.; Xian, H.; Li, S.; et al. Trichoderma biodiversity in major ecological systems of China. J. Microb. 2019, 57, 668–675. [Google Scholar] [CrossRef]
- Jaroszuk-Scisel, J.; Tyskiewicz, R.; Nowak, A.; Ozimek, E.; Majewska, M.; Hanaka, A.; Tyskiewicz, K.; Pawlik, A.; Janusz, G. Phytohormones (auxin, gibberellin) and ACC deaminase in vitro synthesized by the mycoparasitic Trichoderma DEMTkZ3A0 strain and changes in the level of auxin and plant resistance markers in wheat seedlings inoculated with this strain conidia. Int. J. Mol. Sci. 2019, 20. [Google Scholar] [CrossRef] [PubMed]
- Lozada-Gobilard, S.; Stang, S.; Pirhofer-Walzl, K.; Kalettka, T.; Heinken, T.; Schroder, B.; Eccard, J.; Joshi, J. Environmental filtering predicts plant-community trait distribution and diversity: Kettle holes as models of meta-community systems. Ecol. Evol. 2019, 9, 1898–1910. [Google Scholar] [CrossRef] [PubMed]
- Pryce, T.M.; Palladino, S.; Kay, I.D.; Coombs, G.W. Rapid identification of fungi by sequencing the ITS1 and ITS2 regions using an automated capillary electrophoresis system. Med. Mycol. 2003, 41, 369–381. [Google Scholar] [CrossRef] [PubMed]
- Rozynek, P.; Gilges, S.; Brüning, T.; Wilhelm, M. Quality test of the MicroSeq D2 LSU Fungal Sequencing Kit for the identification of fungi. Int. J. Hygiene Environ. Health 2004, 207, 297–299. [Google Scholar] [CrossRef]
- Frac, M.; Oszust, K.; Lipiec, J.; Jezierska-Tys, S.; Nwaichi, E.O. Soil microbial functional and fungal diversity as influenced by municipal sewage sludge accumulation. Int. J. Environ. Res. Public Health 2014, 11, 8891–8908. [Google Scholar] [CrossRef]
- Atanasova, L.; Druzhinina, I.S. Review: Global nutrient profiling by Phenotype MicroArrays: A tool complementing genomic and proteomic studies in conidial fungi. J. Zhejiang Univ. Sci. B 2010, 11, 151–168. [Google Scholar] [CrossRef]
- Pinzari, F.; Ceci, A.; Abu-Samra, N.; Canfora, L.; Maggi, O.; Persiani, A. Phenotype MicroArray system in the study of fungal functional diversity and catabolic versatility. Res. Microb. 2016, 167, 710–722. [Google Scholar] [CrossRef]
- Lee, H.B.; Magan, N. Environmental factors and nutritional utilization patterns affect niche overlap indices between Aspergillus ochraceus and other spoilage fungi. Lett. Appl. Microb. 1999, 28, 300–304. [Google Scholar] [CrossRef]
- Renard, C.M.G.C. Variability in cell wall preparations: Quantification and comparison of common methods. Carbohydr. Polym. 2005, 60, 515–522. [Google Scholar] [CrossRef]
- DuBois, M.; Gilles, K.A.; Hamilton, J.K.; Rebers, P.A.; Smith, F. Colorimetric method for determination of sugars and related substances. Anal. Chem. 1956, 28, 350–356. [Google Scholar] [CrossRef]
- Lv, Y.; Yang, X.; Zhao, Y.; Ruan, Y.; Yang, Y.; Wang, Z. Separation and quantification of component monosaccharides of the tea polysaccharides from Gynostemma pentaphyllum by HPLC with indirect UV detection. Food Chem. 2009, 112, 742–746. [Google Scholar] [CrossRef]


| Substrate Group | Substrate | PC1 | PC2 | PC1 | PC2 |
|---|---|---|---|---|---|
| 490 nm | 750 nm | ||||
| Biogenic and heterocyclic amines | 2-amino ethanol | 0.807 | 0.044 | 0.779 | 0.065 |
| Putrescine | 0.720 | 0.111 | 0.755 | 0.051 | |
| Adenosine | −0.517 | 0.825 | −0.091 | 0.719 | |
| Glucosides | D-trehalose | 0.740 | 0.073 | - | - |
| ß-methyl-D-glucoside | 0.828 | 0.143 | 0.744 | 0.148 | |
| Stachyose | 0.903 | −0.016 | 0.874 | −0.109 | |
| Hexoses | D-galactose | 0.821 | −0.315 | 0.785 | −0.341 |
| L-rhamnose | 0.774 | −0.143 | 0.777 | −0.198 | |
| L-amino acids | L-alanine | 0.722 | −0.024 | 0.771 | −0.043 |
| L-asparagine | 0.731 | 0.248 | 0.747 | 0.156 | |
| L-phenylalanine | 0.394 | 0.720 | - | - | |
| L-proline | - | - | 0.721 | −0.081 | |
| L-serine | 0.758 | 0.232 | 0.766 | 0.182 | |
| L-threonine | 0.848 | 0.356 | 0.858 | 0.272 | |
| γ-amino-butyric Acid | 0.735 | 0.445 | 0.805 | 0.245 | |
| Oligosaccharides | D-melibiose | 0.879 | −0.039 | 0.852 | 0.028 |
| D-raffinose | 0.817 | −0.171 | 0.793 | −0.275 | |
| Lactulose | 0.765 | −0.396 | 0.687 | −0.433 | |
| Palatinose | 0.748 | −0.487 | 0.726 | −0.482 | |
| α-D-lactose | 0.774 | −0.286 | 0.711 | −0.306 | |
| Others | p-hydroxyphenyl acetic acid | - | - | 0.745 | 0.111 |
| Quinic acid | 0.932 | 0.032 | 0.931 | 0.003 | |
| Succinic acid mono-methyl ester | 0.798 | 0.355 | 0.854 | 0.172 | |
| Pentoses | D-ribose | 0.842 | 0.344 | 0.861 | 0.268 |
| D-xylose | 0.880 | −0.157 | 0.873 | −0.338 | |
| Peptides | L-alanyl-glycine | 0.765 | 0.435 | 0.757 | 0.353 |
| Polyols | Adonitol | 0.717 | 0.324 | 0.706 | 0.328 |
| D-arabitol | 0.795 | 0.166 | 0.785 | 0.113 | |
| D-mannitol | 0.777 | 0.044 | 0.750 | 0.018 | |
| D-sorbitol | 0.744 | 0.055 | - | - | |
| Maltitol | 0.803 | −0.484 | 0.788 | −0.506 | |
| m-inositol | 0.820 | 0.226 | 0.793 | 0.185 | |
| Polysaccharides | Dextrin | 0.907 | 0.111 | 0.788 | 0.200 |
| Sugar acids | 2-keto-D-gluconic acid | 0.831 | 0.166 | 0.795 | 0.147 |
| D-galacturonic acid | 0.816 | −0.149 | 0.738 | −0.194 | |
| D-glucuronic acid | 0.836 | 0.205 | 0.841 | 0.155 | |
| TCA-cycle intermediates | Fumaric acid | - | - | 0.729 | 0.365 |
| α-keto-glutaric acid | 0.448 | 0.734 | 0.236 | 0.789 | |
| Substrate Group | Utilization (%) | |||||||||
|---|---|---|---|---|---|---|---|---|---|---|
| AWCD | AWDD | |||||||||
| Trichoderma | Botrytis | Colletotrichum | Phytophthora | Verticillium | Trichoderma | Botrytis | Colletotrichum | Phytophthora | Verticillium | |
| Polysaccharides | 75 | 100 | 75 | 50 | 75 | 50 | 50 | 50 | 0 | 25 |
| Biogenic and heterocyclic amines | 25 | 25 | 75 | 25 | 75 | 25 | 0 | 50 | 0 | 50 |
| Glucosides | 82 | 63 | 82 | 73 | 55 | 73 | 64 | 82 | 64 | 18 |
| Polyols | 100 | 78 | 100 | 89 | 67 | 89 | 78 | 100 | 78 | 22 |
| Aliphatic organic acids | 100 | 25 | 75 | 0 | 75 | 25 | 0 | 0 | 0 | 0 |
| L-amino acids | 100 | 83 | 100 | 42 | 83 | 83 | 67 | 92 | 8 | 67 |
| TCA-cycle intermediates | 100 | 80 | 100 | 40 | 100 | 40 | 0 | 60 | 0 | 40 |
| Sugar acids | 83 | 83 | 83 | 50 | 50 | 50 | 67 | 83 | 0 | 33 |
| Heptoses | 0 | 0 | 0 | 0 | 0 | 0 | 0 | 0 | 0 | 0 |
| Oligosaccharides | 100 | 100 | 100 | 100 | 80 | 80 | 100 | 100 | 100 | 70 |
| Hexosamines | 75 | 25 | 50 | 25 | 50 | 50 | 25 | 50 | 25 | 50 |
| Hexoses | 100 | 75 | 88 | 75 | 88 | 88 | 75 | 75 | 63 | 75 |
| Pentoses | 80 | 80 | 80 | 60 | 60 | 80 | 60 | 60 | 40 | 40 |
| Peptides | 100 | 100 | 100 | 0 | 100 | 100 | 50 | 100 | 0 | 100 |
| Others | 80 | 80 | 80 | 30 | 70 | 50 | 20 | 50 | 0 | 30 |
| Substrate Group | a NOITOT | b COMTRICH | ||||||||||||||
|---|---|---|---|---|---|---|---|---|---|---|---|---|---|---|---|---|
| AWCD | AWDD | AWCD | AWDD | |||||||||||||
| Botrytis | Colletotrichum | Phytophthora | Verticillium | Botrytis | Colletotrichum | Phytophthora | Verticillium | Botrytis | Colletotrichum | Phytophthora | Verticillium | Botrytis | Colletotrichum | Phytophthora | Verticillium | |
| Polysaccharides | 0.75 | 0.75 | 0.50 | 0.75 | 1.00 | 1.00 | - | 0.50 | 0.75 | 1.00 | 1.50 | 1.00 | 1.00 | 1.00 | - | 2.00 |
| Biogenic and heterocyclic amines | 0.25 | 0.25 | 0.25 | 0.25 | - | 1.00 | - | 1.00 | 1.00 | 0.33 | 1.00 | 0.33 | - | 2.00 | - | 2.00 |
| Glucosides | 0.64 | 0.82 | 0.73 | 0.55 | 0.88 | 1.00 | 0.88 | 0.25 | 1.29 | 1.00 | 1.13 | 1.50 | 1.14 | 0.89 | 1.14 | 4.00 |
| Polyols | 0.78 | 1.00 | 0.89 | 0.67 | 0.88 | 1.00 | 0.88 | 0.25 | 1.29 | 1.00 | 1.13 | 1.50 | 1.14 | 0.89 | 1.14 | 4.00 |
| Aliphatic organic acids | 0.25 | 0.75 | - | 0.75 | - | - | - | - | 4.00 | 1.33 | - | 1.33 | - | - | - | - |
| L-amino acids | 0.83 | 1.00 | 0.42 | 0.83 | 0.67 | 0.92 | 0.08 | 0.67 | 1.20 | 1.00 | 2.40 | 1.20 | 1.25 | 0.91 | 10.00 | 1.25 |
| TCA-cycle intermediates | 0.80 | 1.00 | 0.40 | 0.60 | - | 0.40 | - | 0.40 | 1.25 | 1.00 | 2.50 | 1.00 | - | 1.50 | - | 1.00 |
| Sugar acids | 0.83 | 0.83 | 0.50 | 0.50 | 0.50 | 0.50 | - | 0.33 | 1.00 | 1.00 | 1.67 | 1.67 | 0.75 | 0.80 | - | 1.50 |
| Heptose | - | - | - | - | - | - | - | - | - | - | - | - | - | - | - | - |
| Oligosaccharides | 1.00 | 1.00 | 1.00 | 0.80 | 0.80 | 0.80 | 0.80 | 0.70 | 1.00 | 1.00 | 1.00 | 1.25 | 0.80 | 0.80 | 0.80 | 1.14 |
| Hexosamines | 0.25 | 0.50 | 0.25 | 0.50 | 0.25 | 0.50 | 0.25 | 0.50 | 3.00 | 1.50 | 3.00 | 1.50 | 2.00 | 1.00 | 2.00 | 1.00 |
| Hexoses | 0.75 | 0.88 | 0.75 | 0.88 | 0.75 | 0.75 | 0.63 | 0.75 | 1.33 | 1.14 | 1.33 | 1.14 | 1.17 | 1.17 | 1.40 | 1.17 |
| Pentoses | 0.80 | 0.80 | 0.60 | 0.60 | 0.60 | 0.60 | 0.40 | 0.40 | 1.00 | 1.00 | 1.33 | 1.33 | 1.33 | 1.33 | 2.00 | 2.00 |
| Peptides | 1.00 | 1.00 | - | 1.00 | 0.50 | 1.00 | - | 1.00 | 1.00 | 1.00 | - | 1.00 | 2.00 | 1.00 | - | 1.00 |
| Others | 0.80 | 0.80 | 0.30 | 0.70 | 0.20 | 0.50 | - | 0.30 | 1.00 | 1.00 | 2.67 | 1.14 | 2.50 | 1.00 | - | 1.67 |
| Sugar Acid | Pentoses | Hexoses | ||||
|---|---|---|---|---|---|---|
| Galacturonic Acid | Arabinose | Xylose | Rhamnose | Galactose | Glucose | Mannose |
| 47.9 ± 0.3 | 12.1 ± 0.2 | 1.8 ± 0.1 | 3.0 ± 0.2 | 9.1 ± 0.2 | 24.2 ± 0.2 | 1.9 ± 0.1 |
© 2020 by the authors. Licensee MDPI, Basel, Switzerland. This article is an open access article distributed under the terms and conditions of the Creative Commons Attribution (CC BY) license (http://creativecommons.org/licenses/by/4.0/).
Share and Cite
Oszust, K.; Cybulska, J.; Frąc, M. How Do Trichoderma Genus Fungi Win a Nutritional Competition Battle against Soft Fruit Pathogens? A Report on Niche Overlap Nutritional Potentiates. Int. J. Mol. Sci. 2020, 21, 4235. https://doi.org/10.3390/ijms21124235
Oszust K, Cybulska J, Frąc M. How Do Trichoderma Genus Fungi Win a Nutritional Competition Battle against Soft Fruit Pathogens? A Report on Niche Overlap Nutritional Potentiates. International Journal of Molecular Sciences. 2020; 21(12):4235. https://doi.org/10.3390/ijms21124235
Chicago/Turabian StyleOszust, Karolina, Justyna Cybulska, and Magdalena Frąc. 2020. "How Do Trichoderma Genus Fungi Win a Nutritional Competition Battle against Soft Fruit Pathogens? A Report on Niche Overlap Nutritional Potentiates" International Journal of Molecular Sciences 21, no. 12: 4235. https://doi.org/10.3390/ijms21124235
APA StyleOszust, K., Cybulska, J., & Frąc, M. (2020). How Do Trichoderma Genus Fungi Win a Nutritional Competition Battle against Soft Fruit Pathogens? A Report on Niche Overlap Nutritional Potentiates. International Journal of Molecular Sciences, 21(12), 4235. https://doi.org/10.3390/ijms21124235