β3-Adrenoreceptor Blockade Reduces Hypoxic Myeloid Leukemic Cells Survival and Chemoresistance

 , , ,
, , ,  and
and 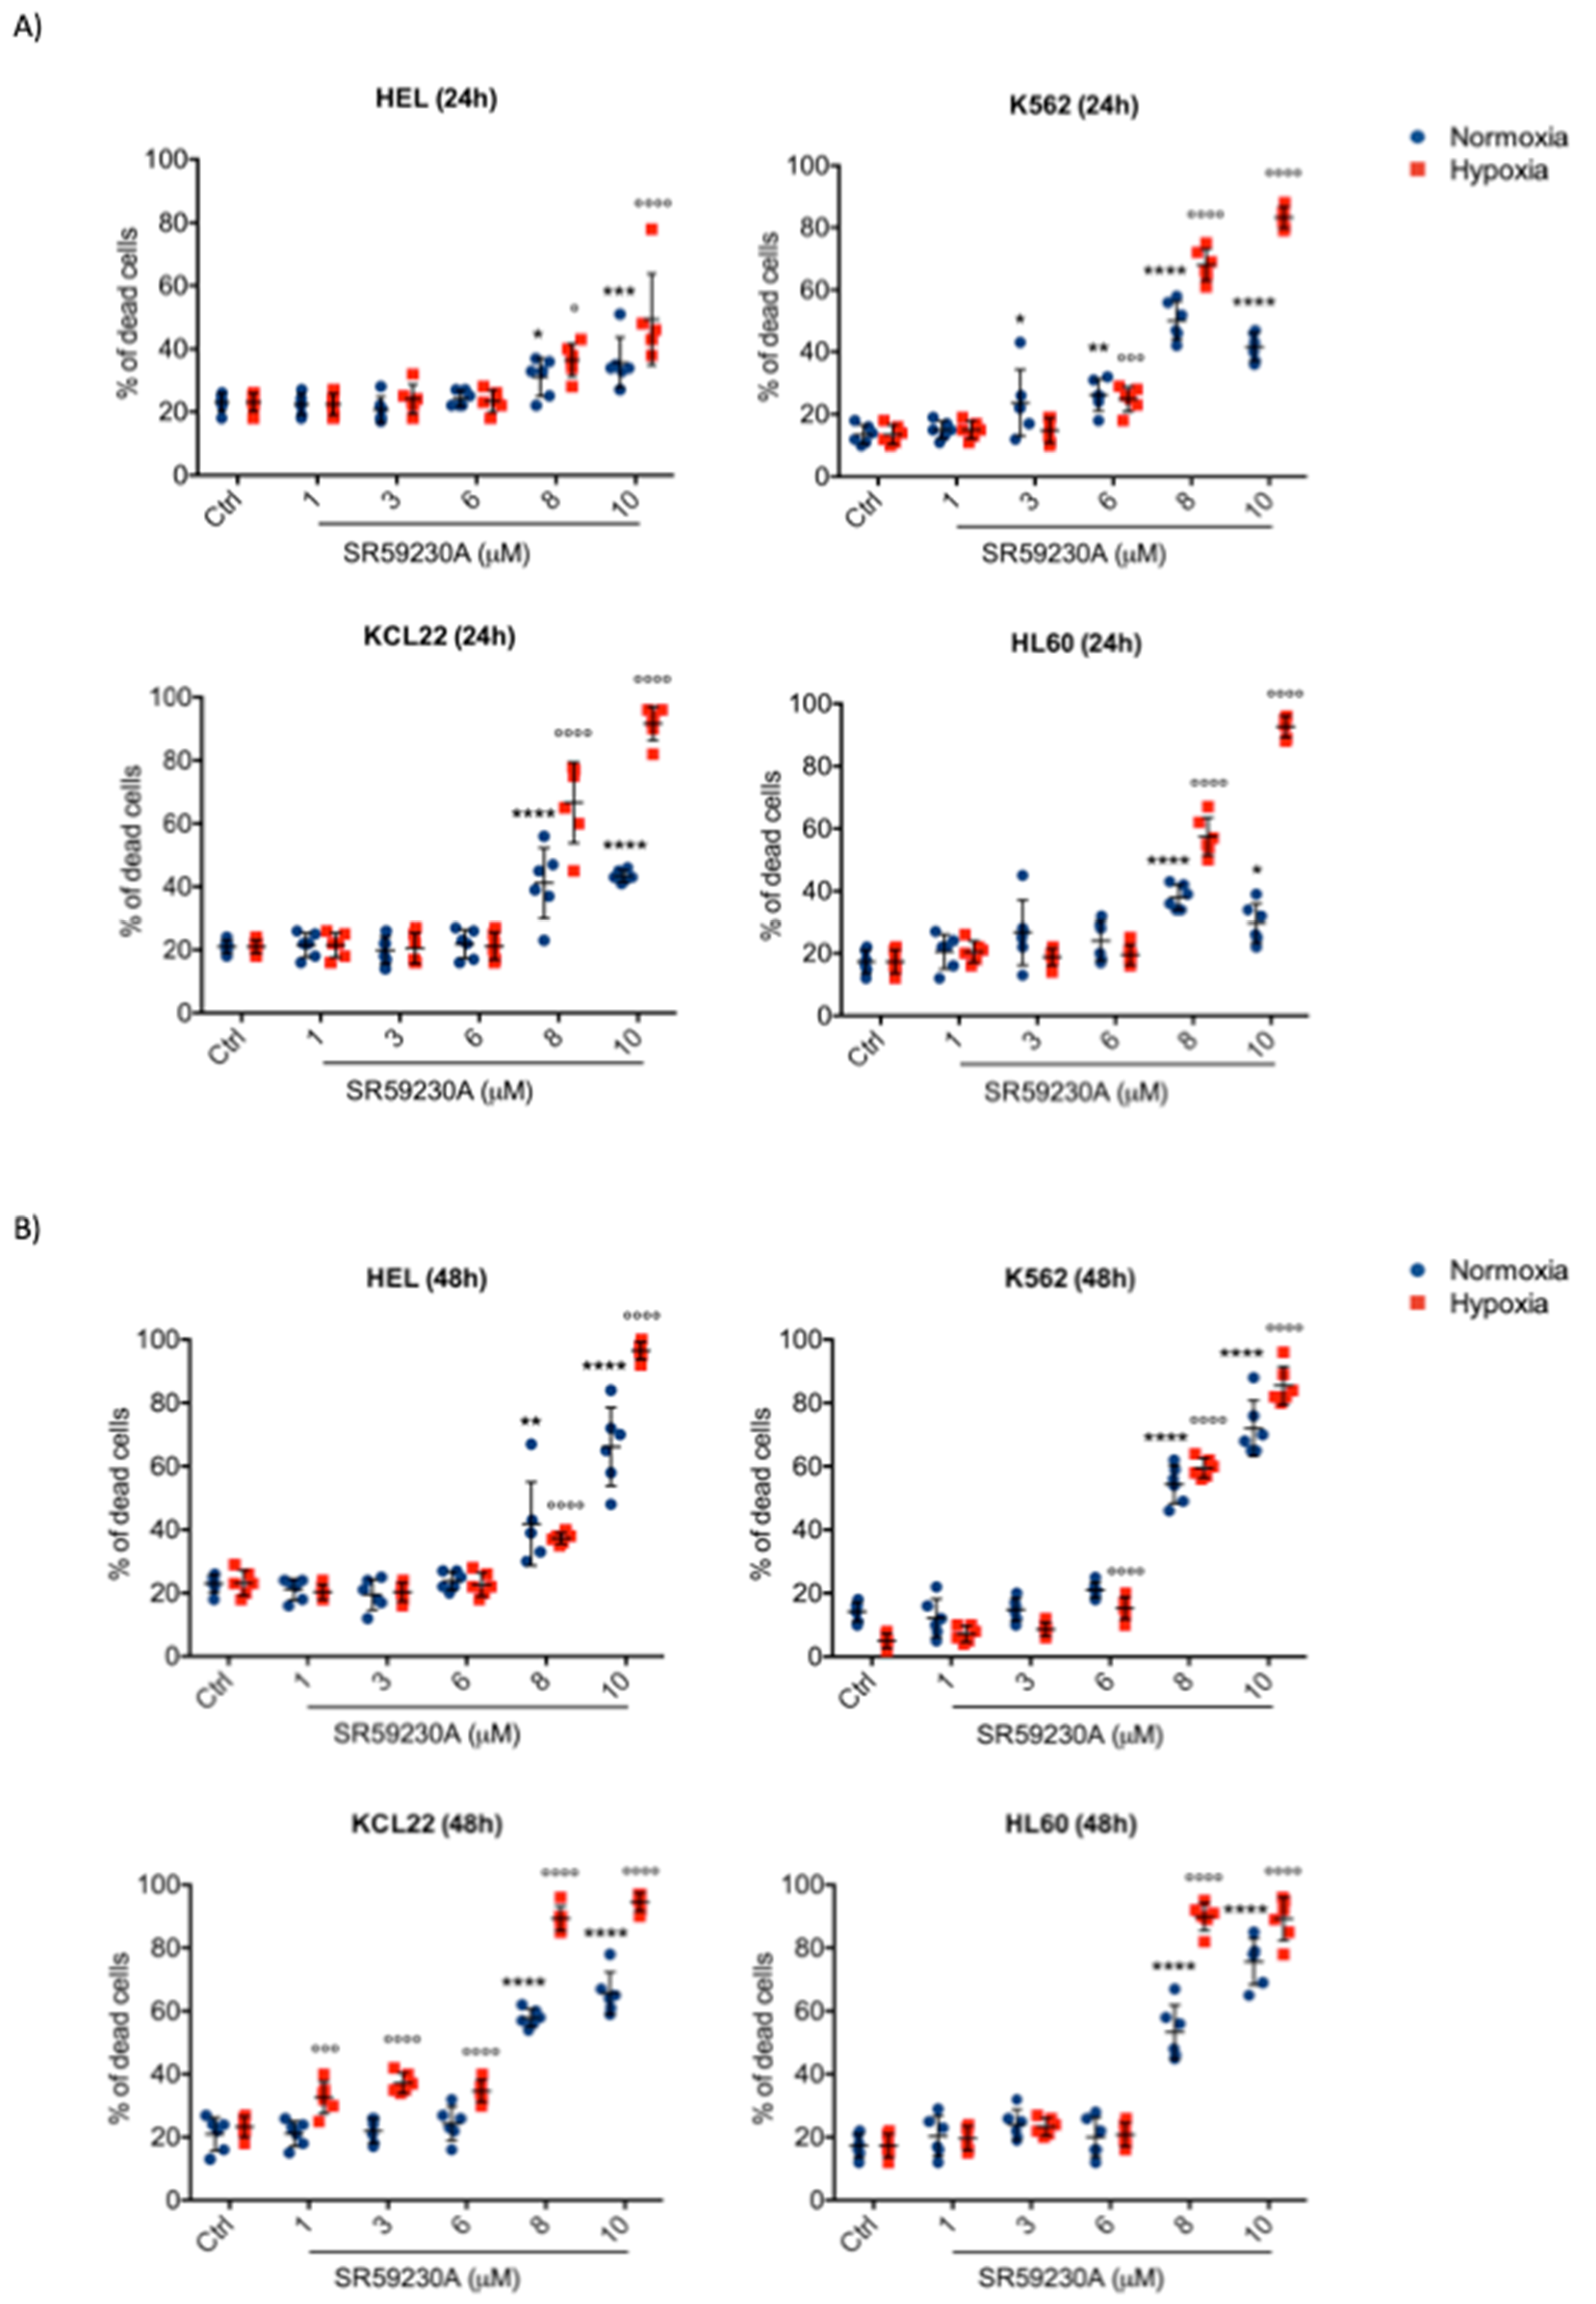
Abstract
1. Introduction
2. Results
2.1. SR59230A Promoted Apoptosis of Leukemia Cell Lines Preferentially in Hypoxia
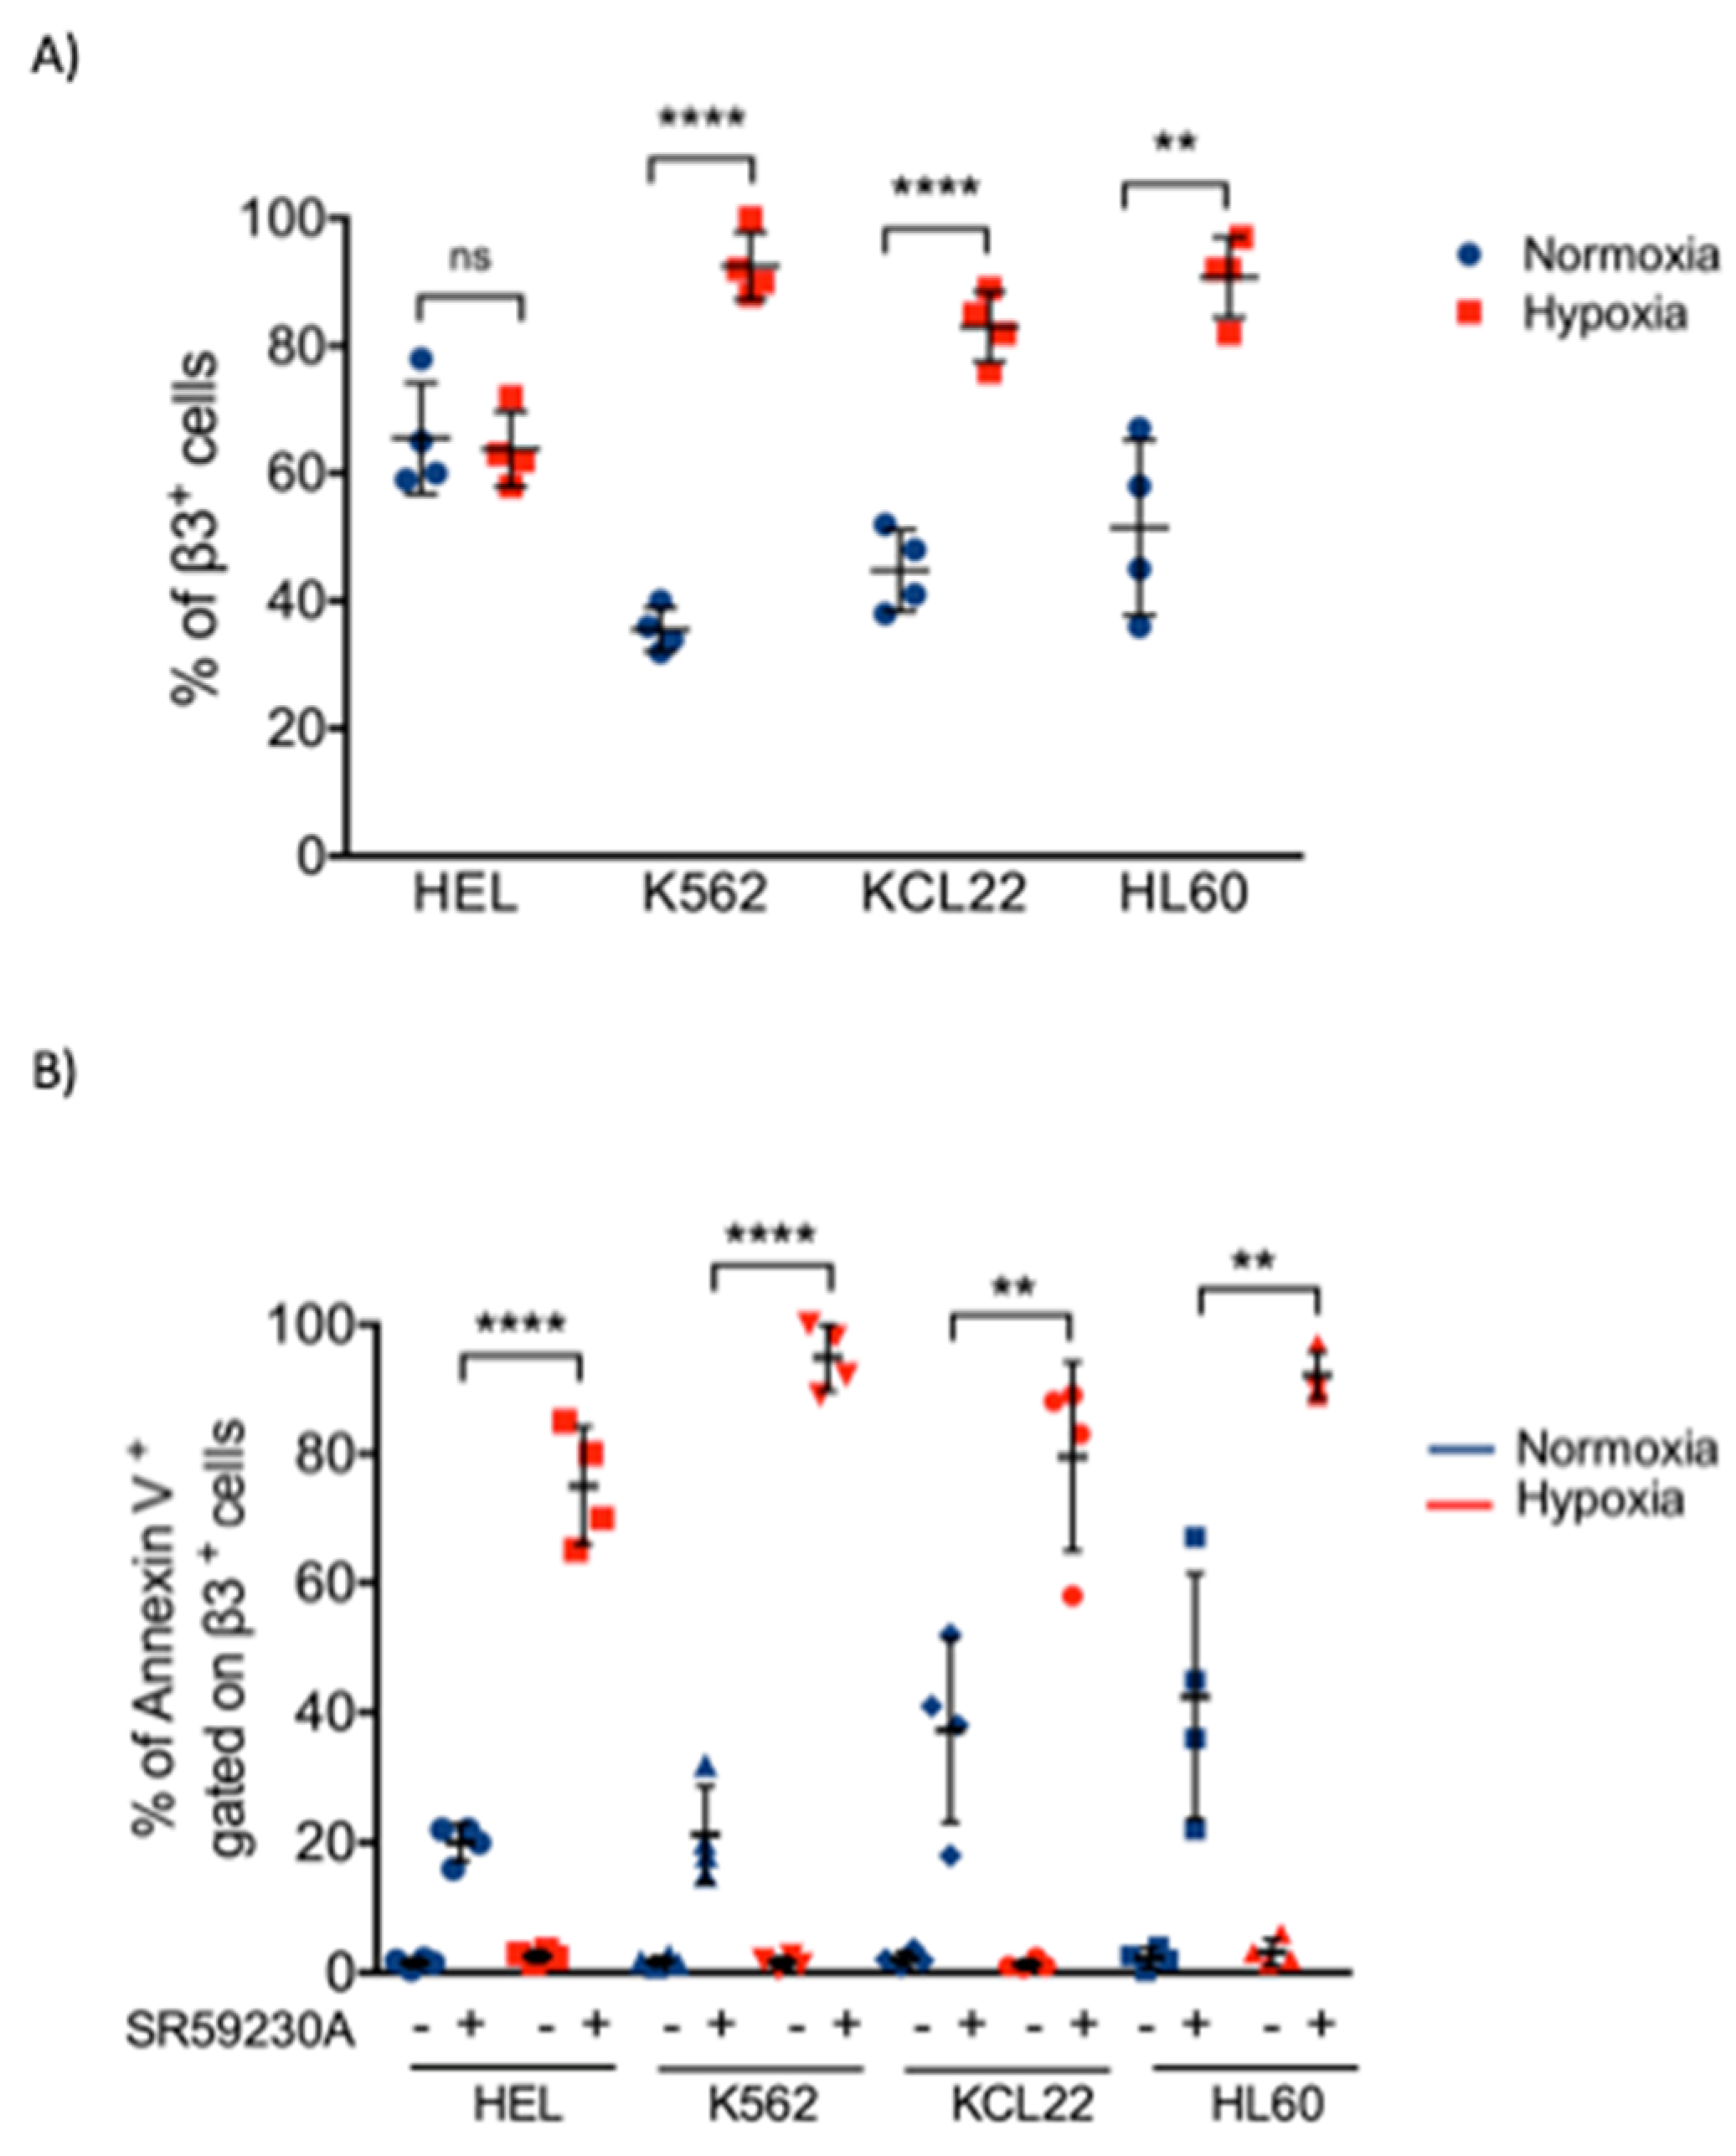
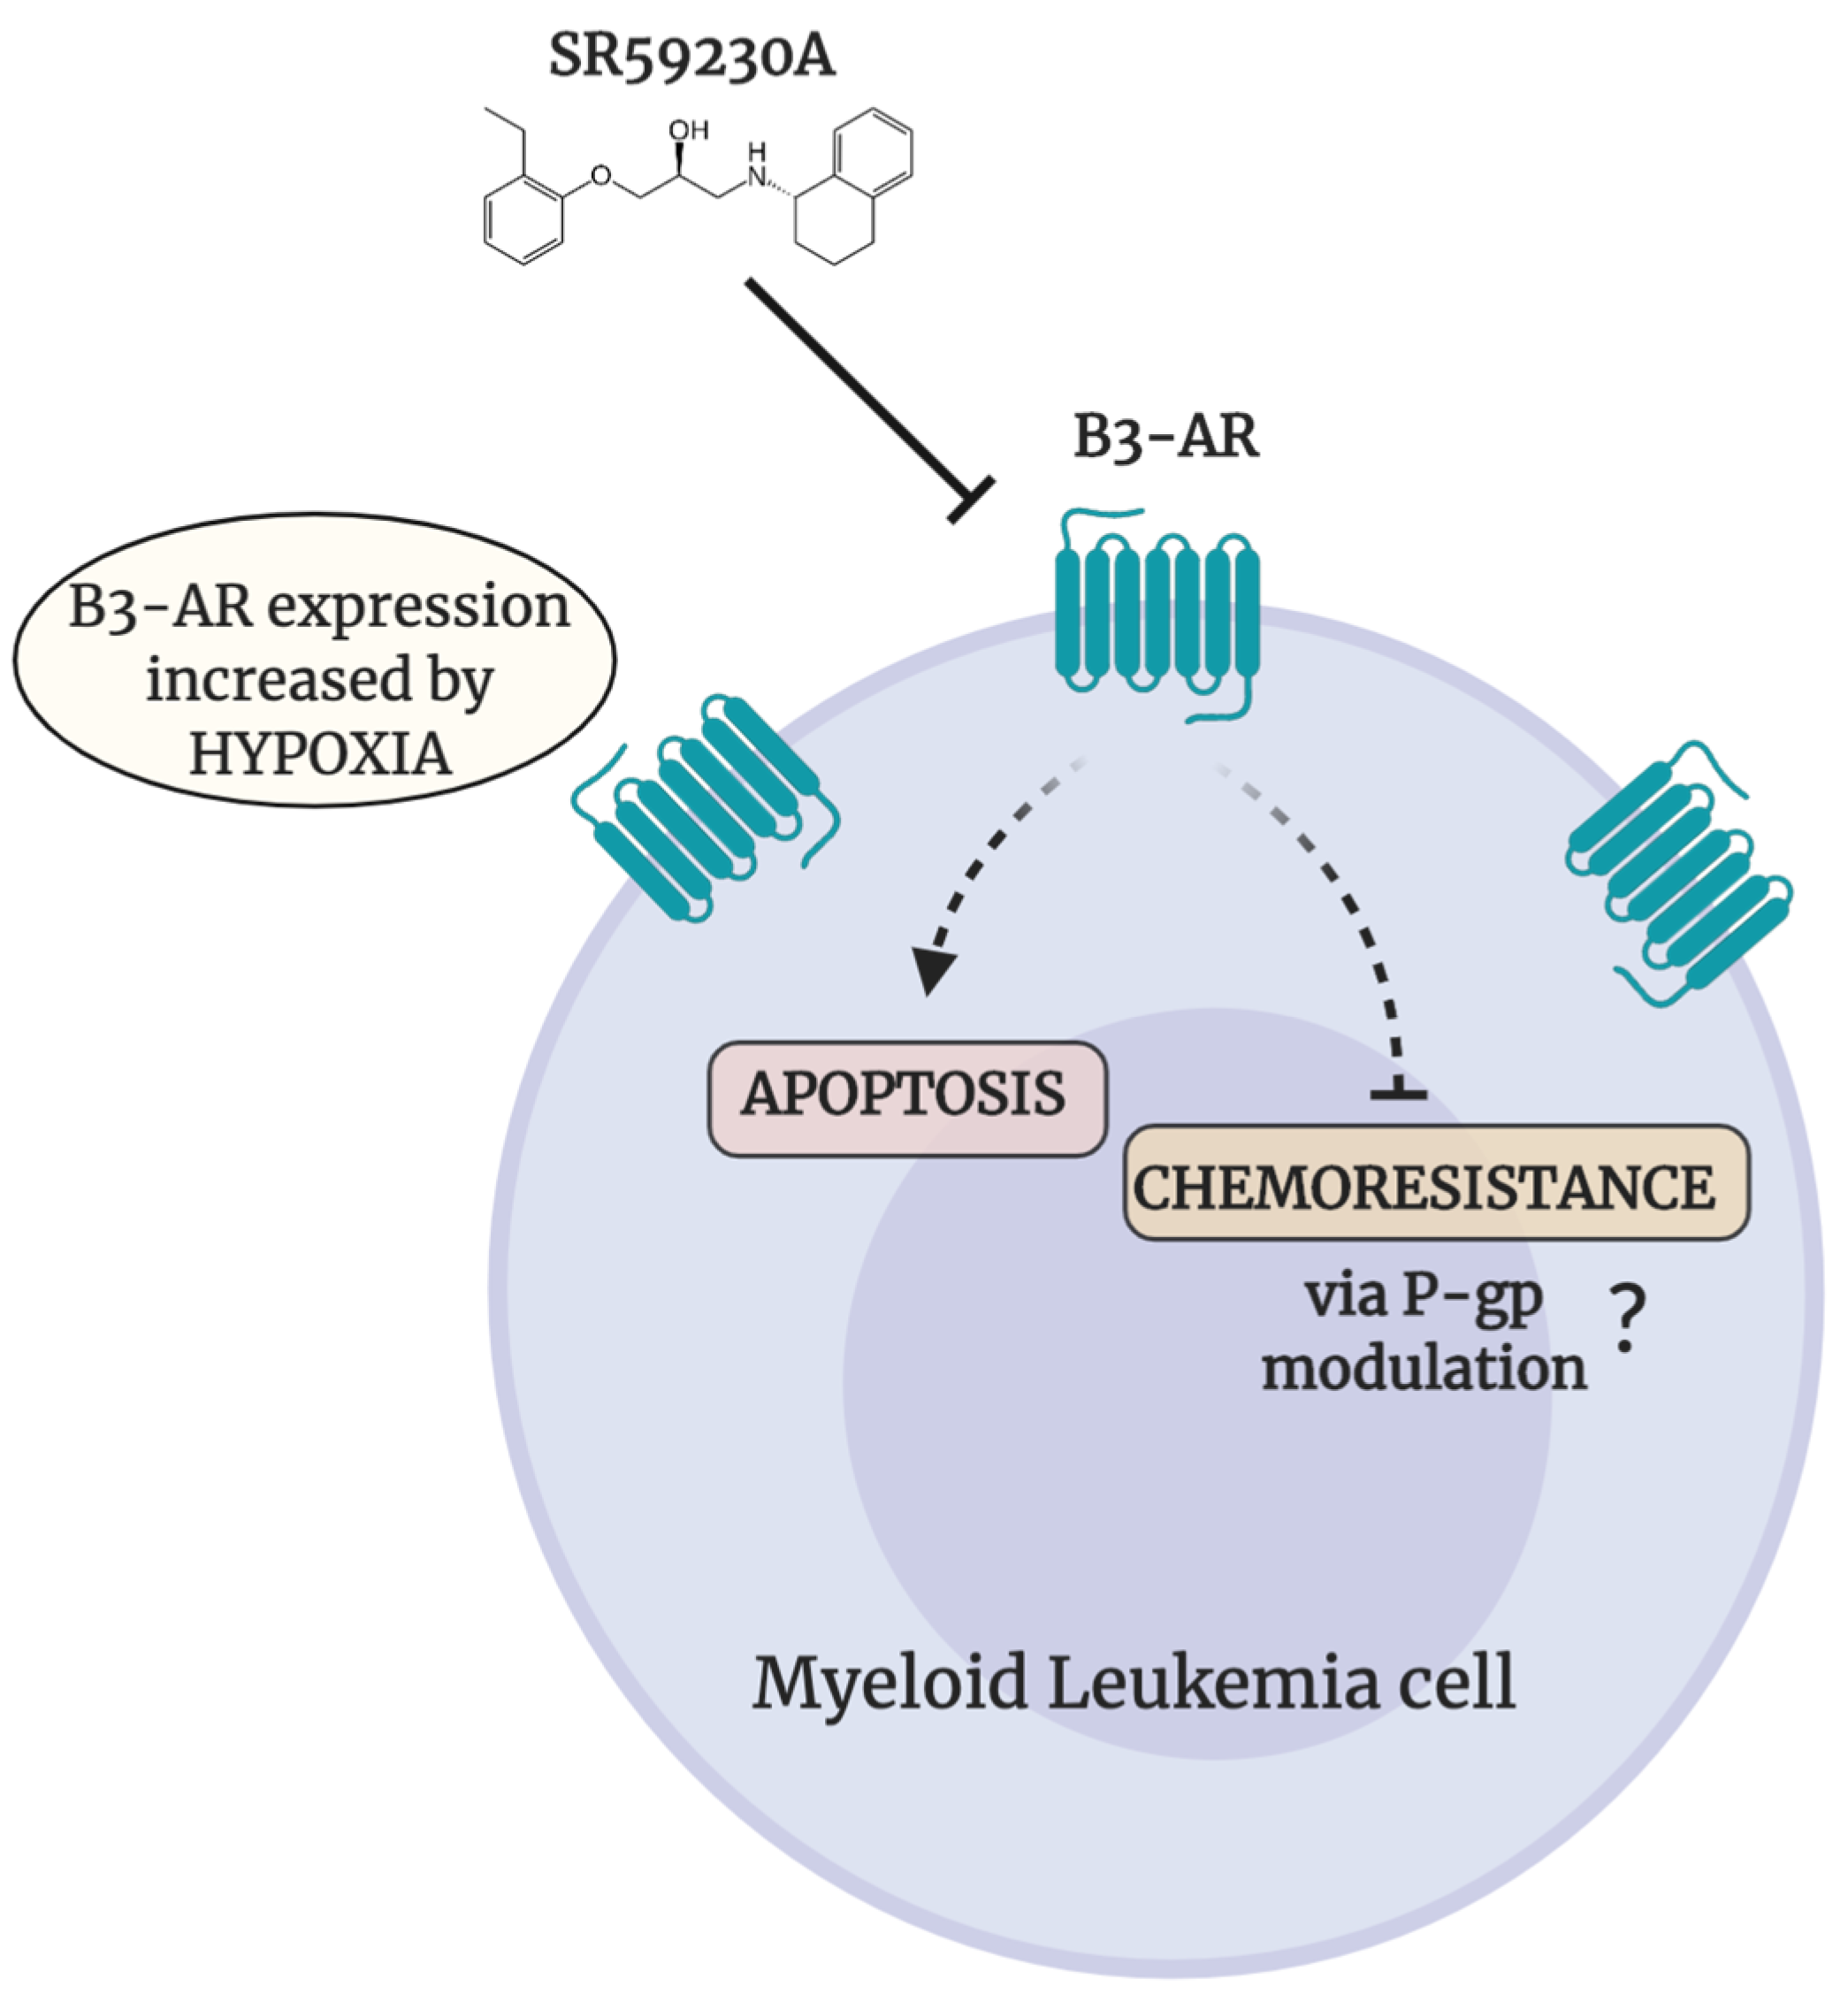
2.2. β3-AR Expression Increased under Hypoxia in Myeloid Leukemia Cell Lines
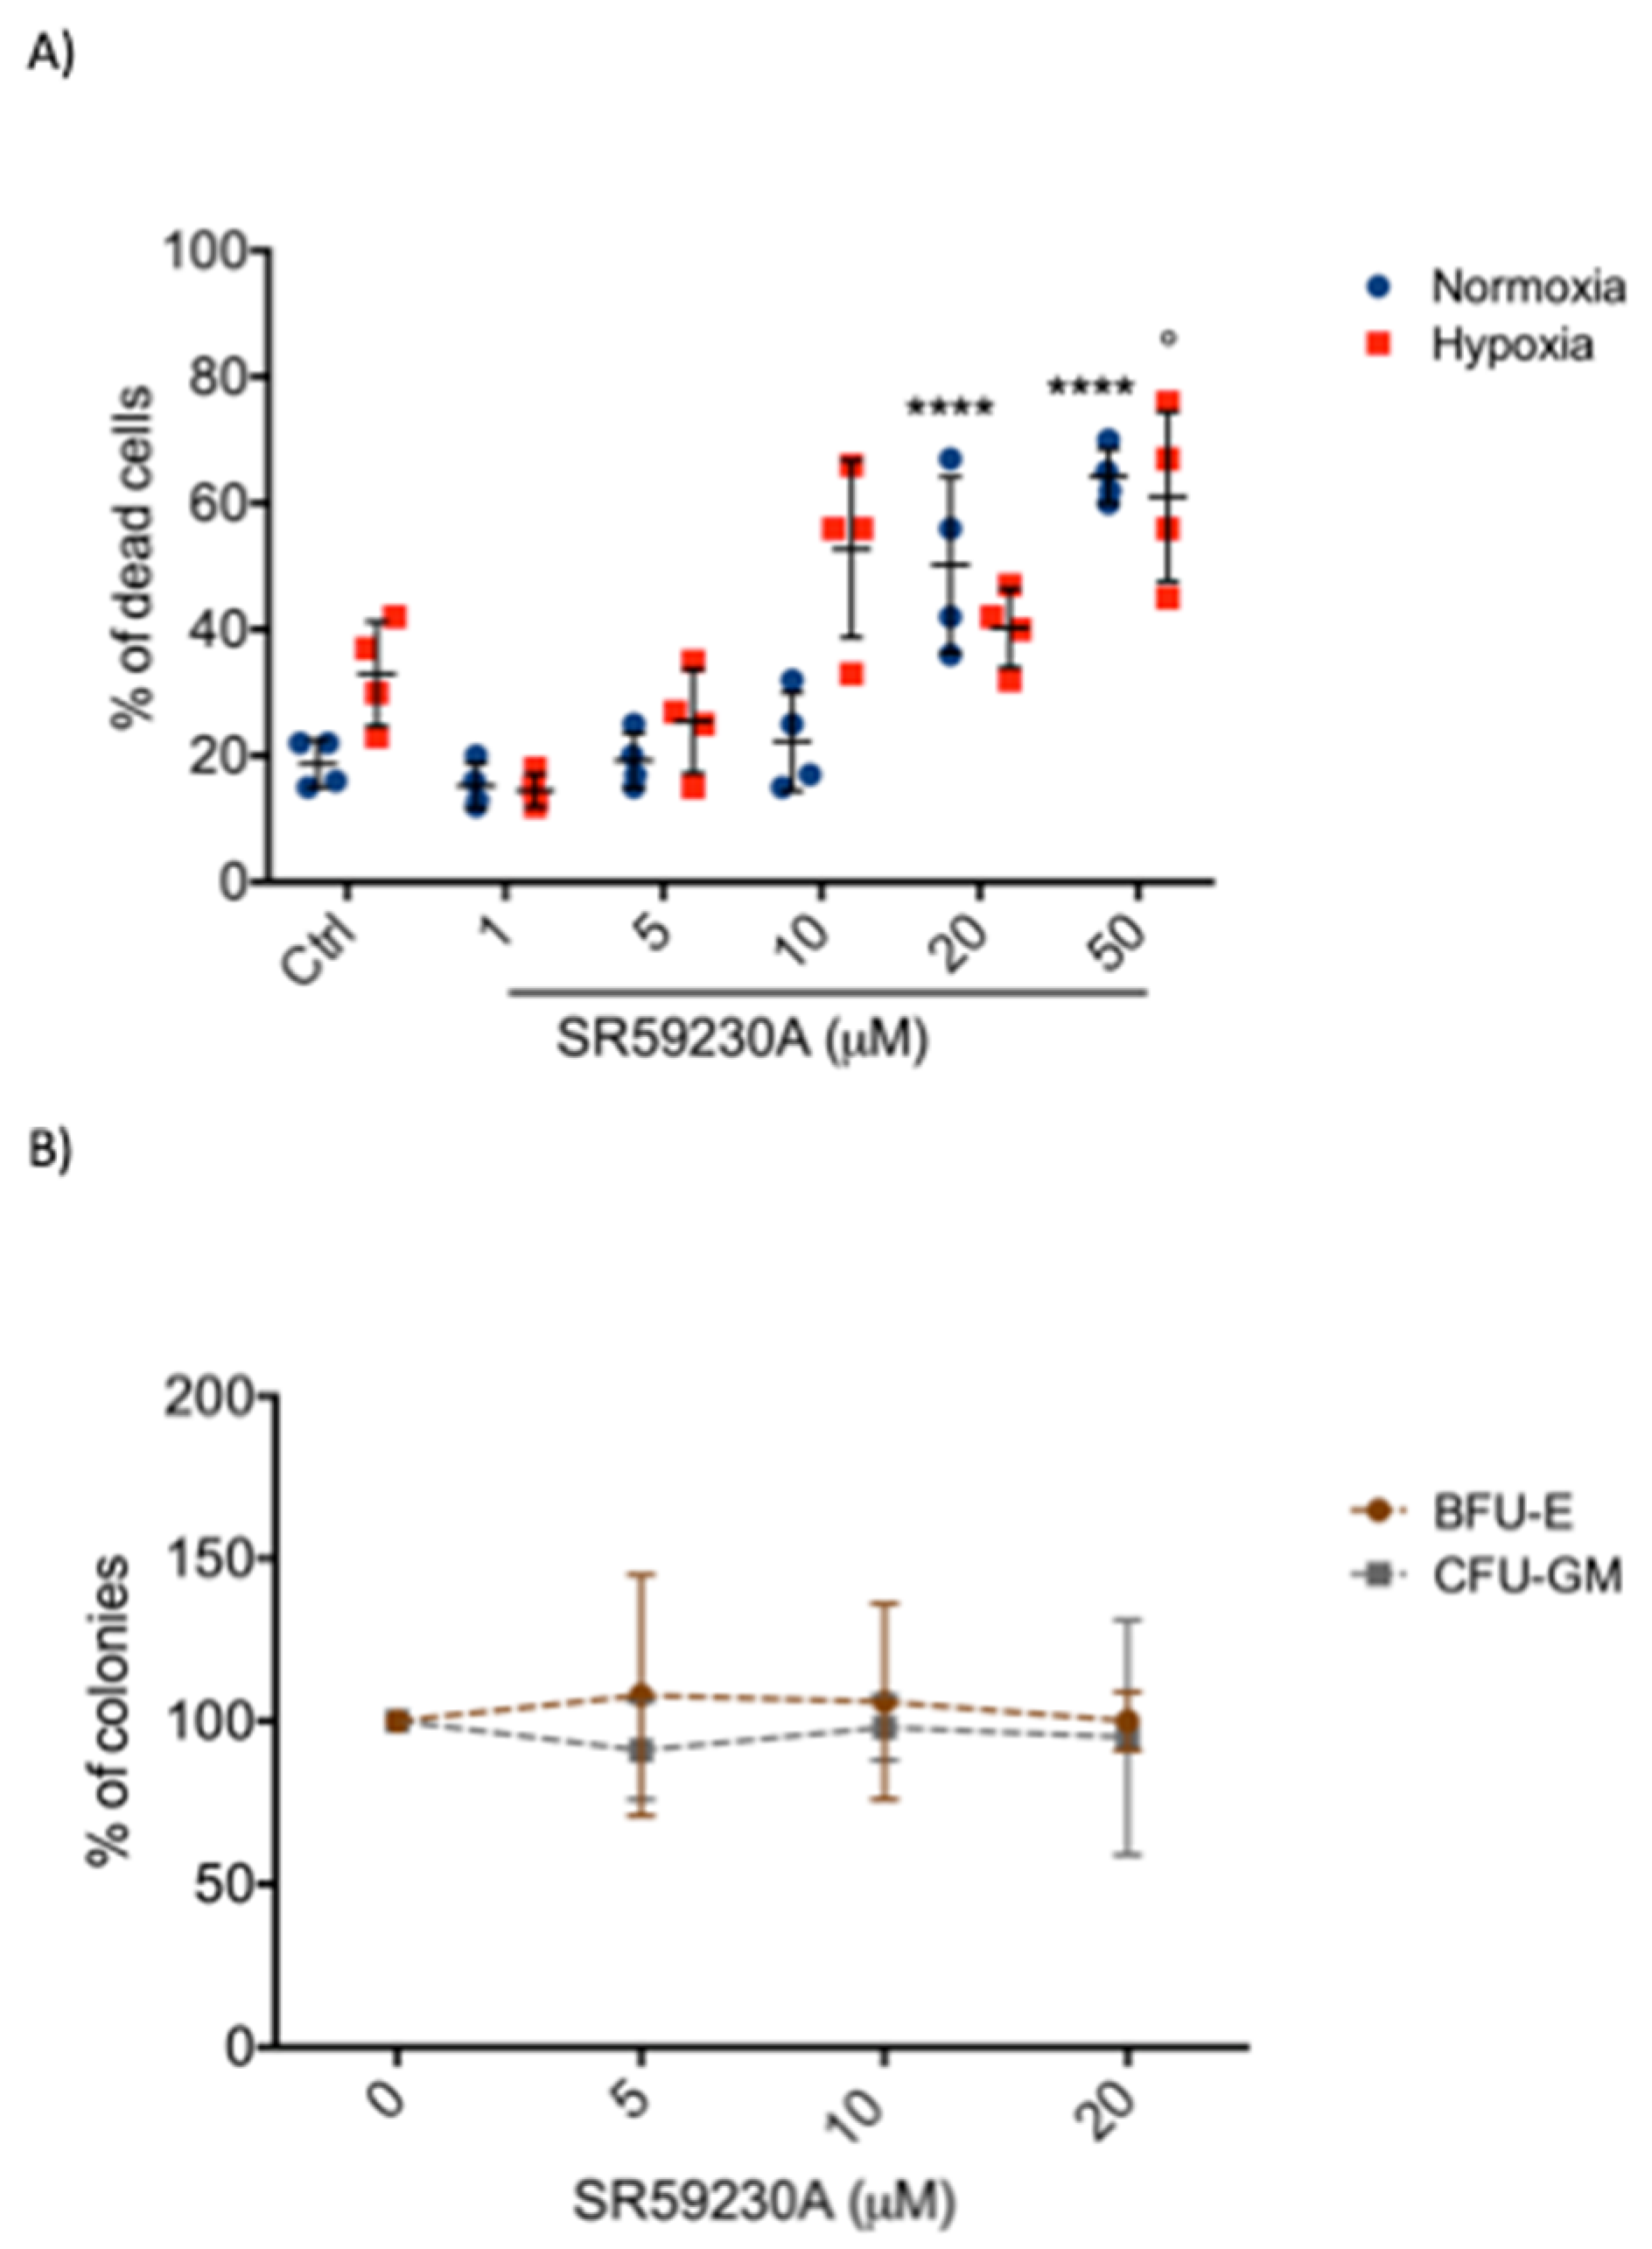
2.3. SR59230A Was not Toxic in Healthy Cell Lines
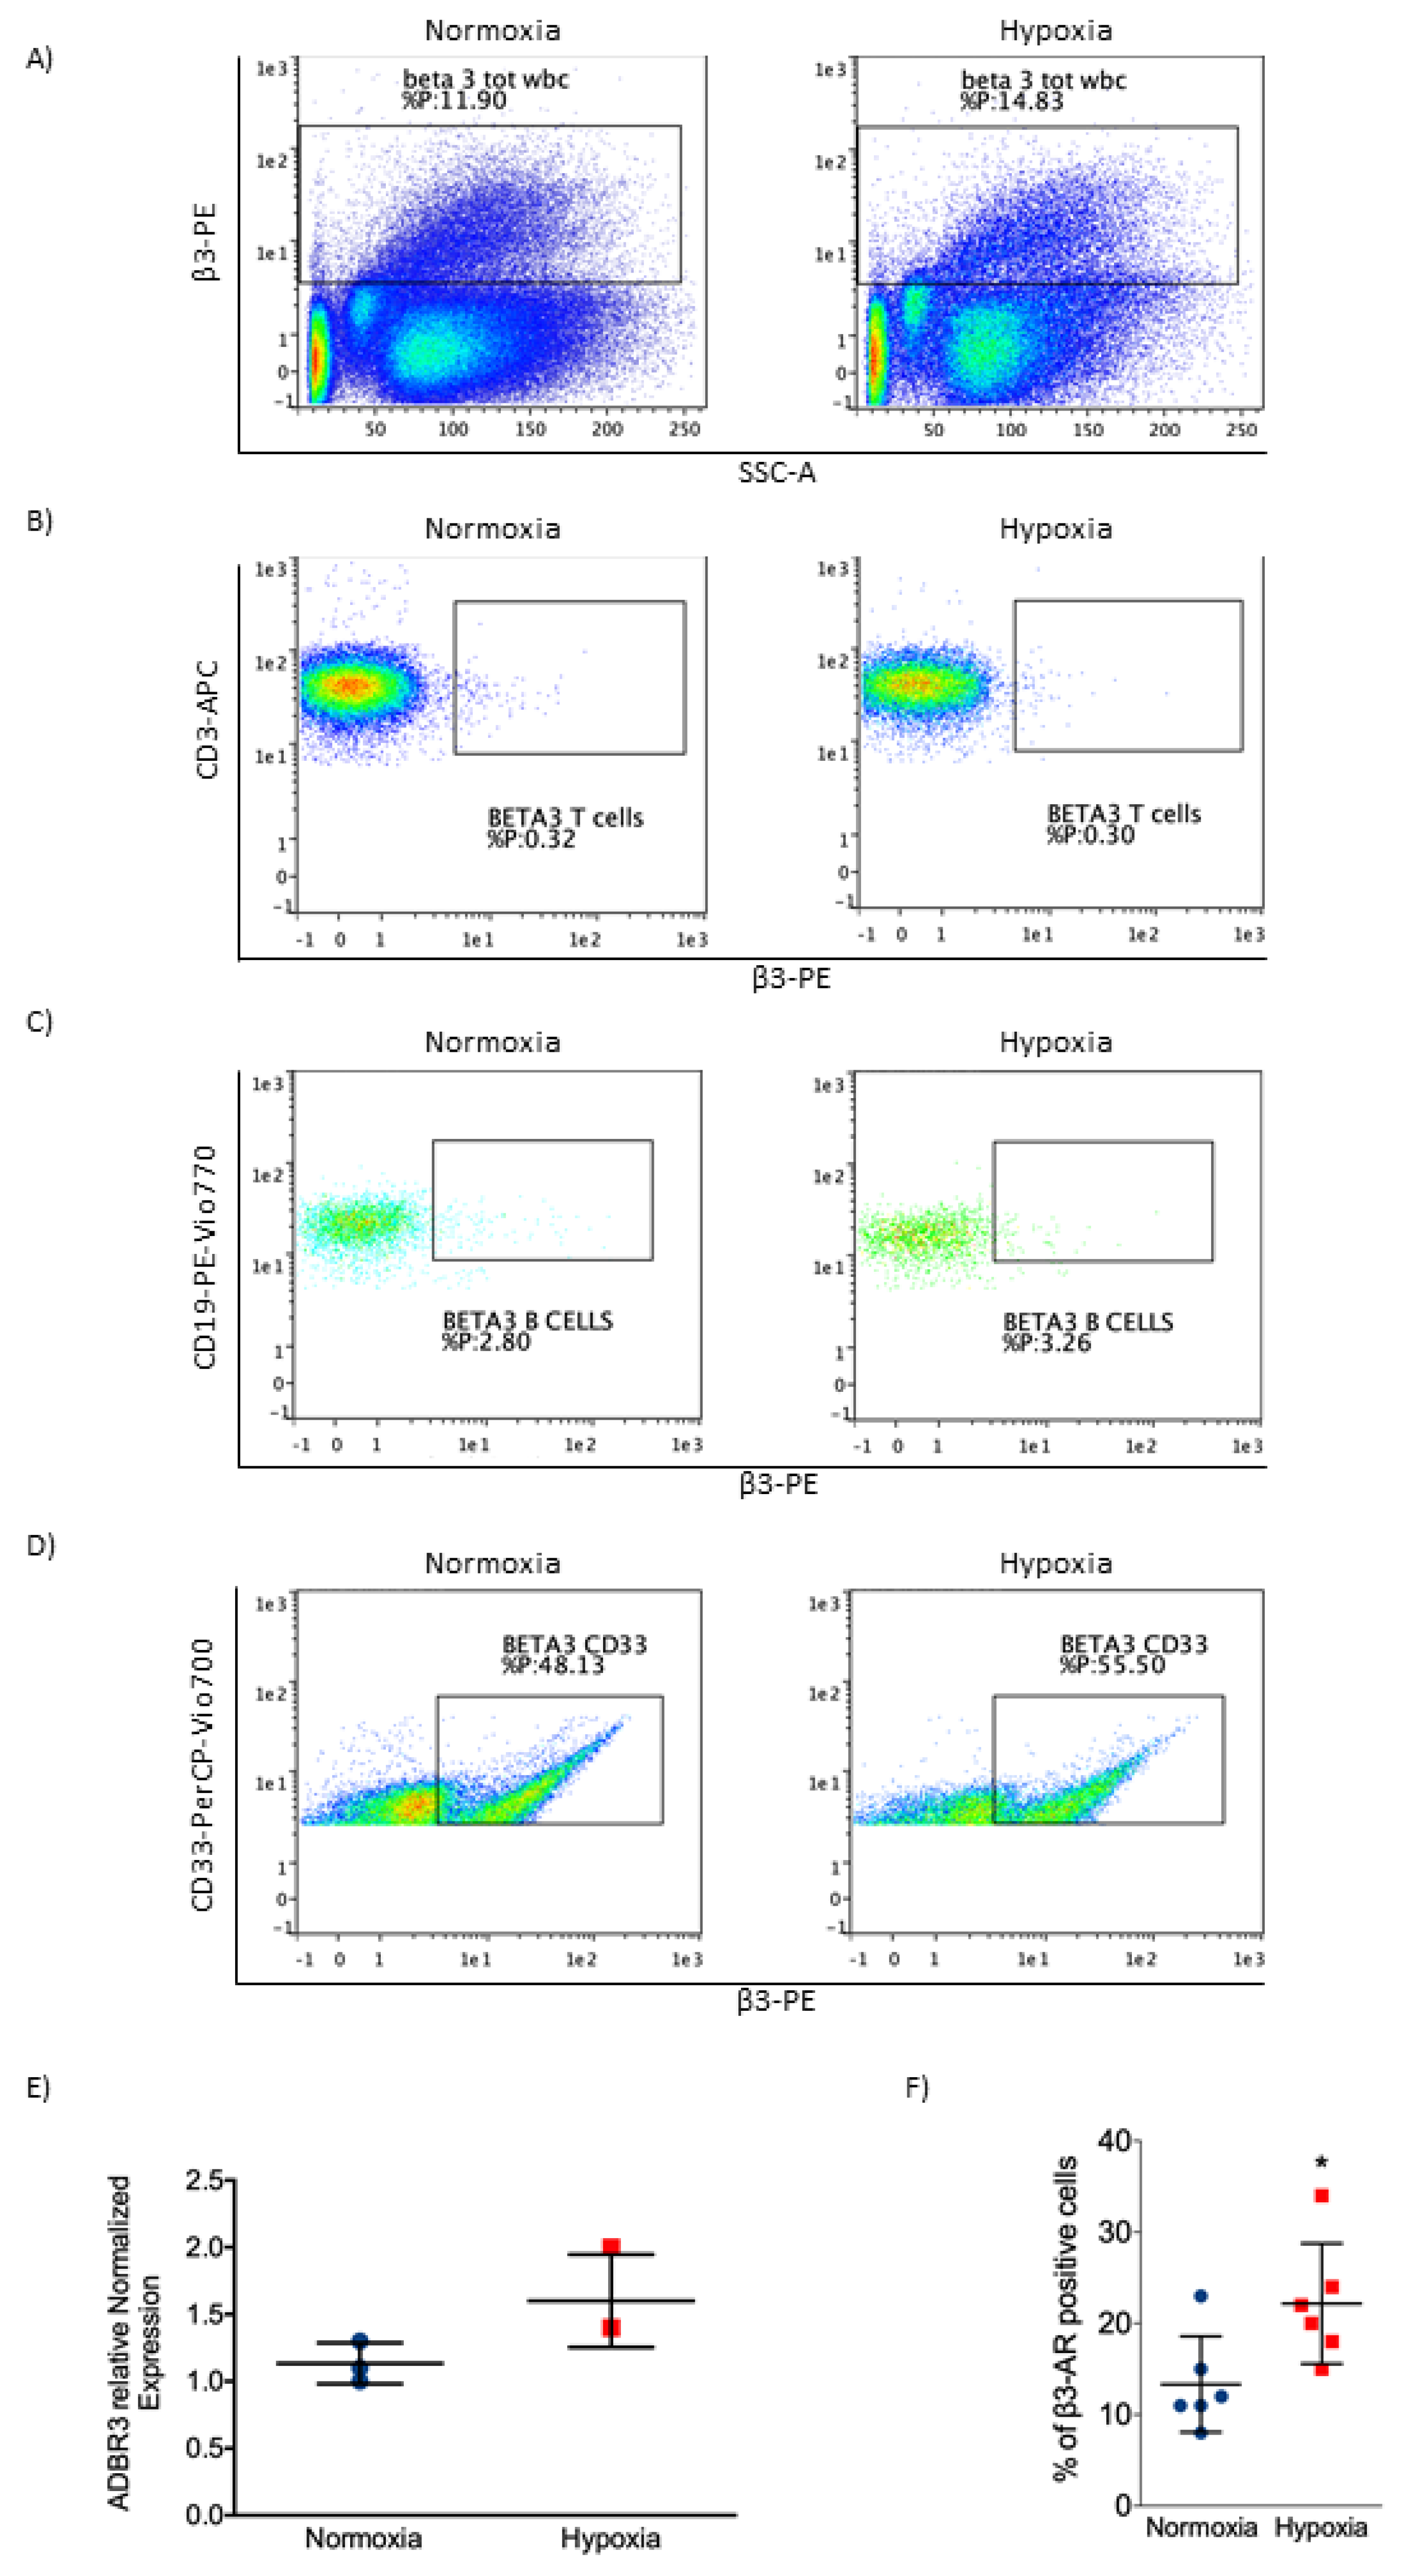
2.4. β3-AR Was Expressed at Low Levels in Healthy Cells
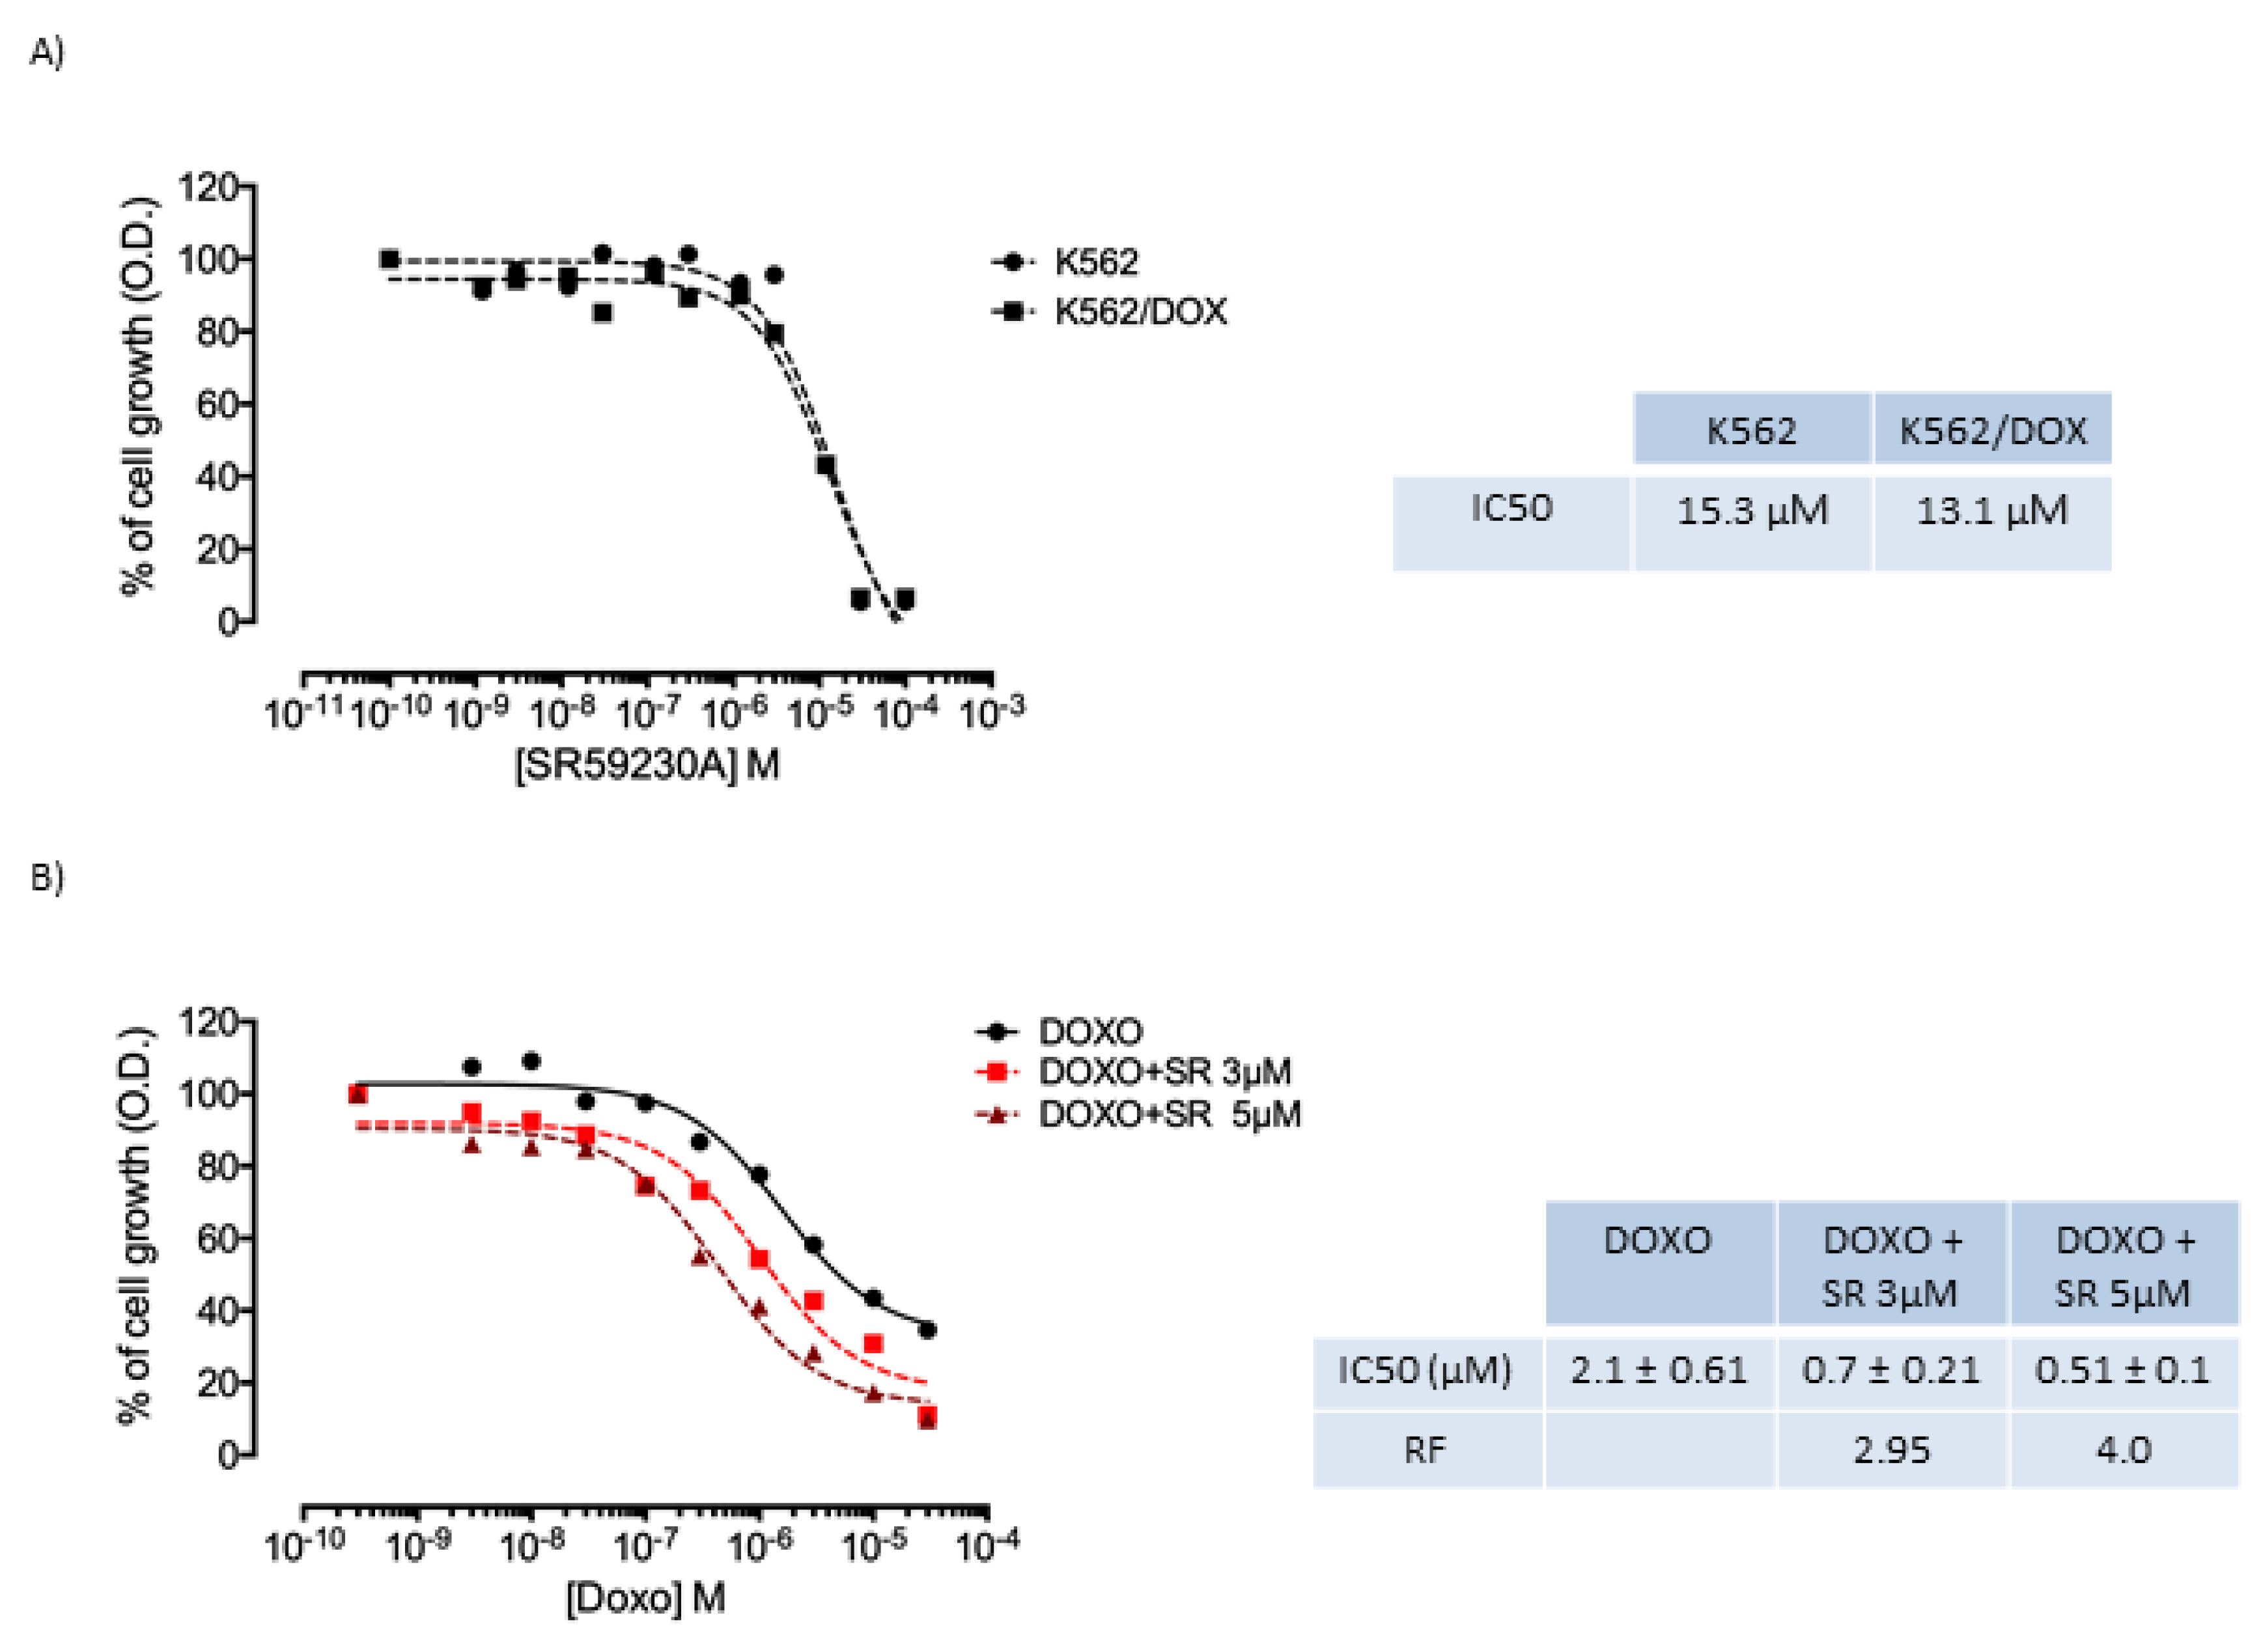
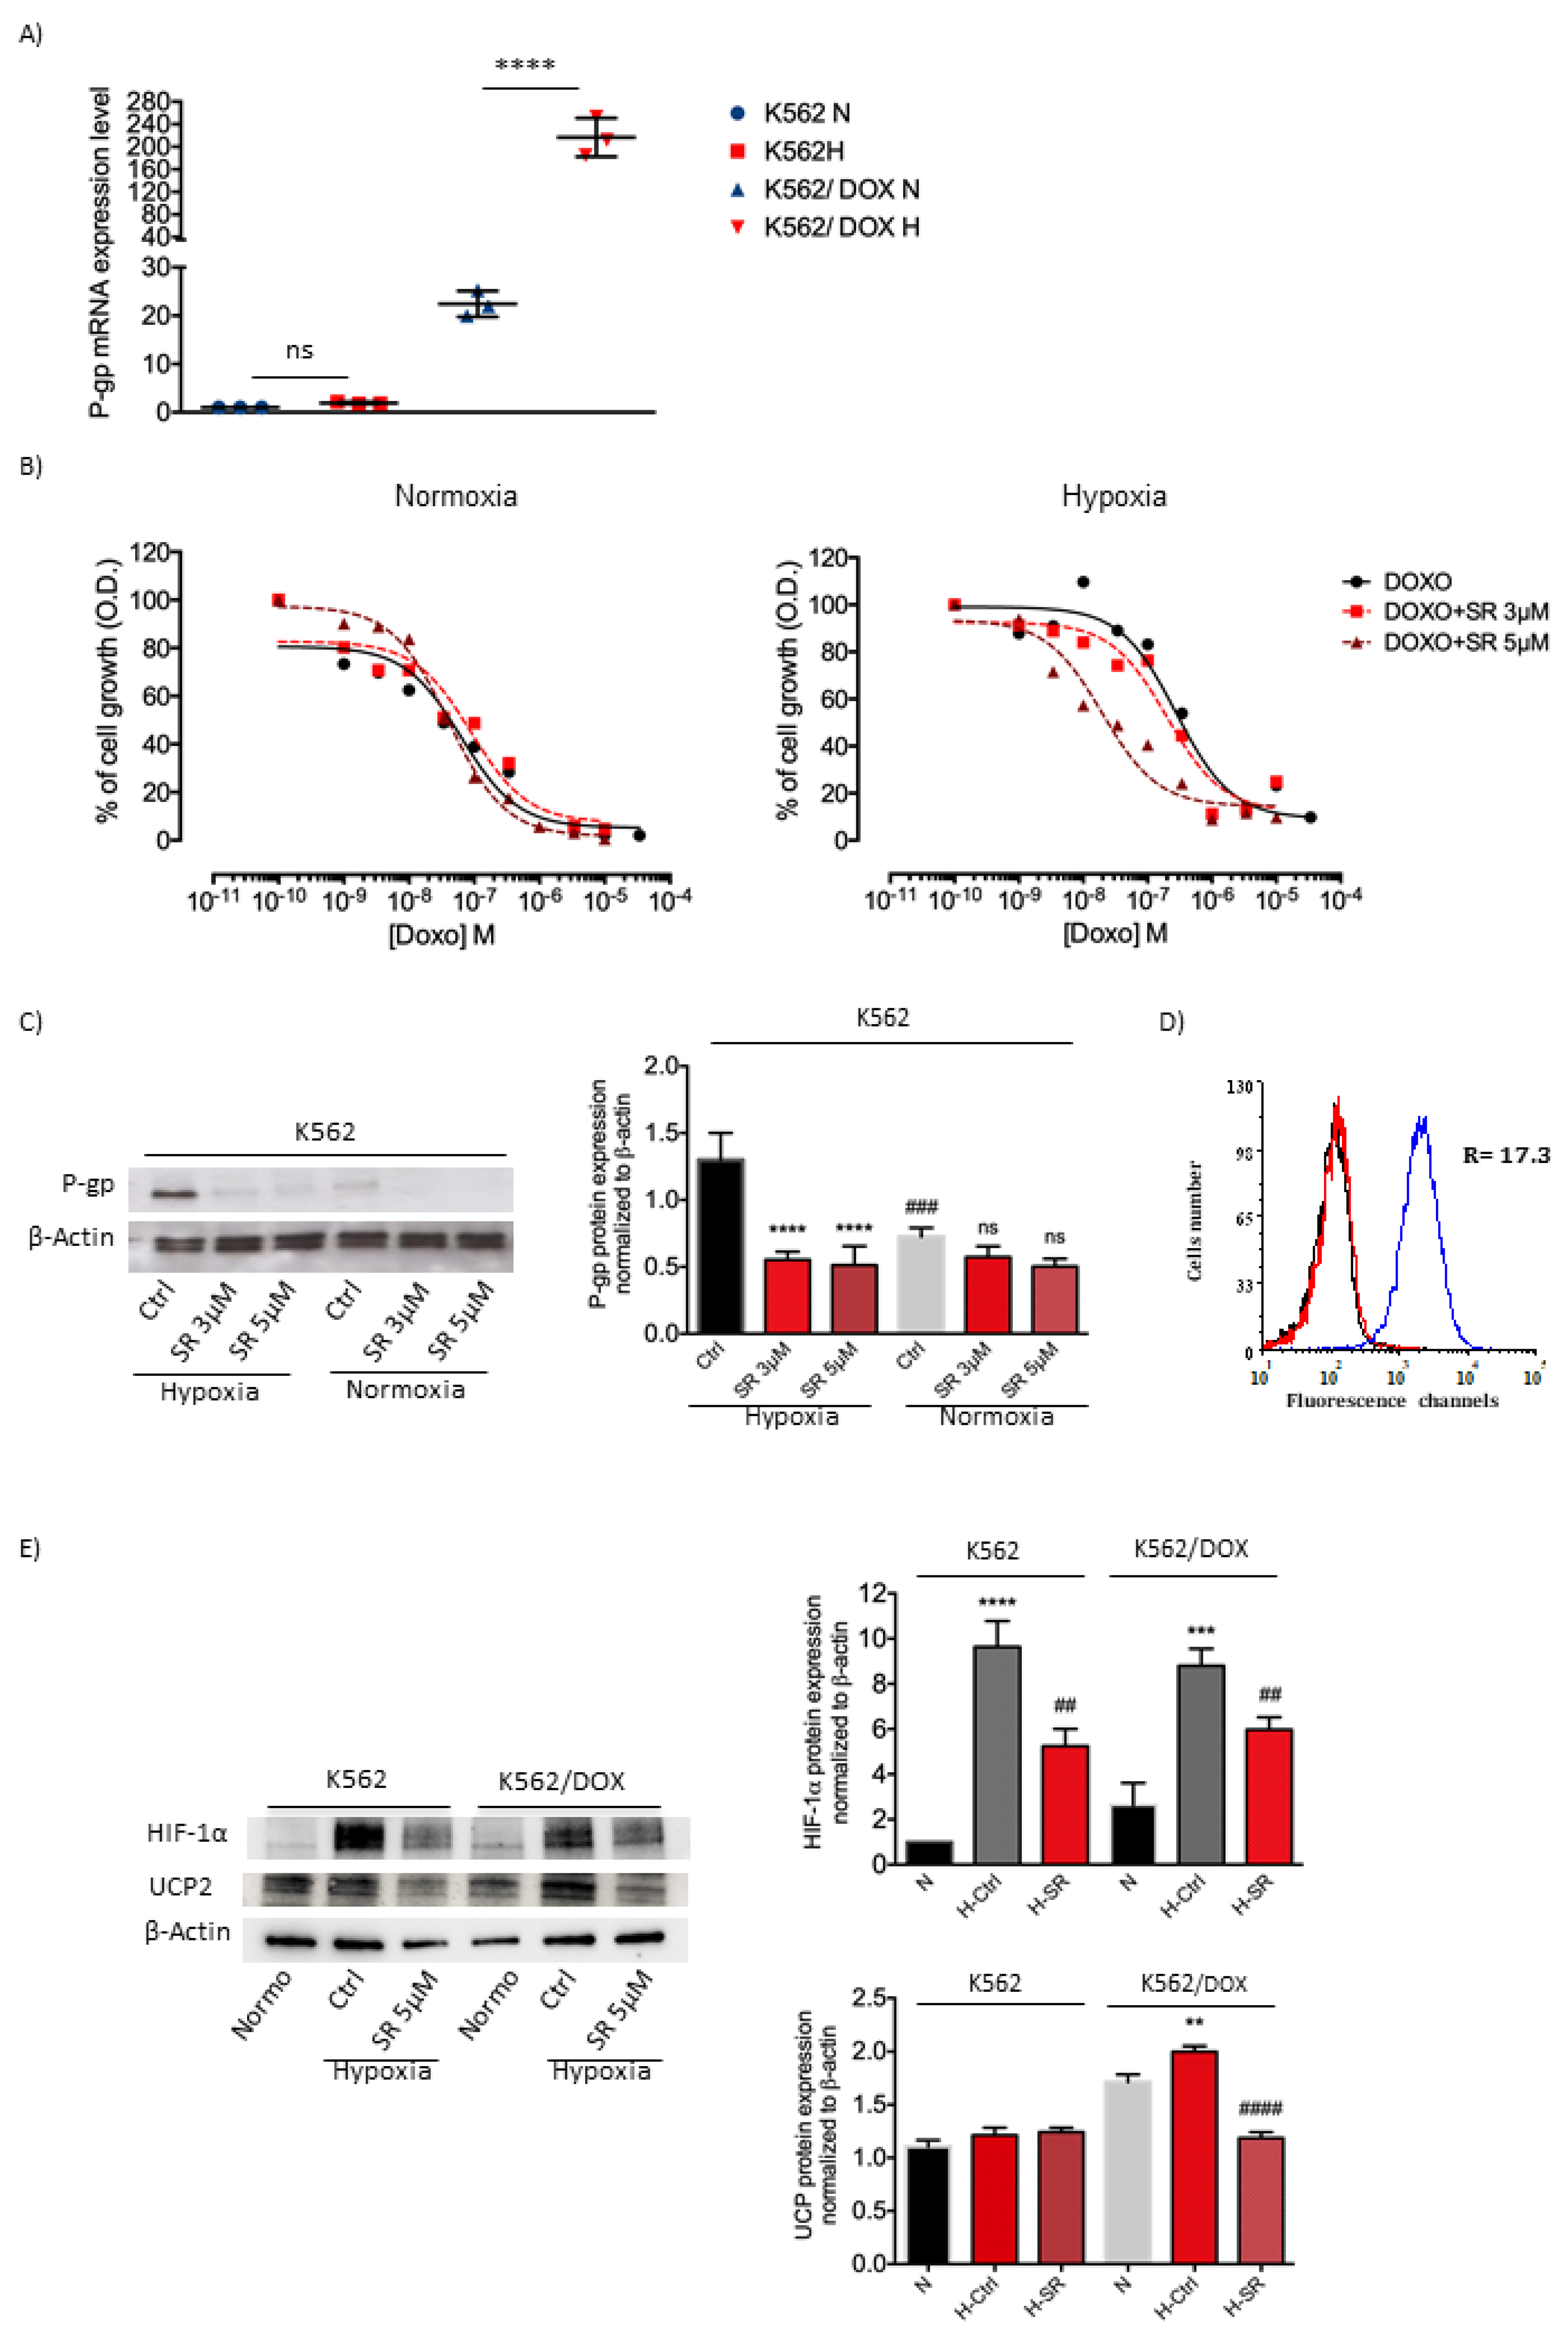
2.5. K562 Doxorubicin Resistant Cell Line and SR59230A Treatment
3. Discussion
4. Materials and Methods
4.1. Cell Lines and Culture Conditions
4.2. Intrinsic Cytotoxicity
4.3. Doxorubicin Toxicity
4.4. Reverse Transcription RT-PCR
4.5. BM and Culture Conditions
4.6. Flow Cytometric Analysis and Apoptosis Evaluation
4.7. Colony Formation Assay
4.8. Western Blot Analysis
4.9. Statistical Analysis
5. Conclusions
Supplementary Materials
Author Contributions
Funding
Acknowledgments
Conflicts of Interest
Abbreviations
| HSCs | Hematopoietic Stem Cells |
| P-gp | P-glycoprotein |
| ABC | ATP-binding Cassette |
| MDR1 | Multiple Drug Resistance gene |
| AML | Acute Myeloid Leukemia |
| β-ARs | beta-Adrenergic receptors |
| β1-ARs | beta1-adrenoreceptors |
| β2-ARs | beta2-adrenoreceptors |
| β3-AR | beta3-adrenoreceptor |
| BMCs | Bone Marrow Cells |
| PBMCs | Peripheral Blood Mononuclear Cells |
| RF | Reversal Fold |
| FBS | Fetal Bovine Serum |
| FCS | Fetal Calf Serum |
| DMSO | Dimethyl Sulfoxide |
| HEPES | 4-(2-hydro-xyethyl)-1-piperazineethanesulfonic acid |
| bFGF | basic Fibroblast Growth Factor |
References
- Khaled, S.A.A.; Nabih, O.; Abdel Aziz, N.M.; Mahran, D.G. Myeloid Leukemias: A Glance at Middle Eastern Centers. J. Blood Med. 2019, 10, 425–433. [Google Scholar] [CrossRef]
- Korn, C.; Méndez-Ferrer, S. Myeloid malignancies and the microenvironment. Blood 2017, 129, 811–822. [Google Scholar] [CrossRef]
- Wang, X.; Zhang, H.; Chen, X. Drug resistance and combating drug resistance in cancer. Cancer Drug Resist. 2019, 2, 141–160. [Google Scholar] [CrossRef]
- Zhang, J.; Gu, Y.; Chen, B. Mechanisms of drug resistance in acute myeloid leukemia. Onco Targets Ther. 2019, 12, 1937–1945. [Google Scholar] [CrossRef]
- Talati, C.; Pinilla-Ibarz, J. Resistance in chronic myeloid leukemia: Definitions and novel therapeutic agents. Curr. Opin. Hematol. 2018, 25, 154–161. [Google Scholar] [CrossRef] [PubMed]
- Soverini, S.; Mancini, M.; Bavaro, L.; Cavo, M.; Martinelli, G. Chronic myeloid leukemia: The paradigm of targeting oncogenic tyrosine kinase signaling and counteracting resistance for successful cancer therapy. Mol. Cancer 2018, 17, 49. [Google Scholar] [CrossRef] [PubMed]
- Nanayakkara, A.K.; Follit, C.A.; Chen, G.; Williams, N.S.; Vogel, P.D.; Wise, J.G. Targeted inhibitors of P-glycoprotein increase chemotherapeutic-induced mortality of multidrug resistant tumor cells. Sci. Rep. 2018, 8, 967. [Google Scholar] [CrossRef] [PubMed]
- Schaich, M.; Soucek, S.; Thiede, C.; Ehninger, G.; Illmer, T. SHG AML96 Study Group. MDR1 and MRP1 gene expression are independent predictors for treatment outcome in adult acute myeloid leukaemia. Br. J. Haematol. 2005, 128, 324–332. [Google Scholar] [CrossRef] [PubMed]
- Calvani, M.; Subbiani, A.; Vignoli, M.; Favre, C. Spotlight on ROS and β3-Adrenoreceptors Fighting in Cancer Cells. Oxid. Med. Cell. Longev. 2019, 2019, 6346529. [Google Scholar] [CrossRef]
- Cannavo, A.; Koch, W.J. Targeting β3-Adrenergic Receptors in the Heart: Selective Agonism and β-Blockade. J. Cardiovasc. Pharmacol. 2017, 69, 71–78. [Google Scholar] [CrossRef]
- Calvani, M.; Pelon, F.; Comito, G.; Taddei, M.L.; Moretti, S.; Innocenti, S.; Nassini, R.; Gerlini, G.; Borgognoni, L.; Bambi, F.; et al. Norepinephrine promotes tumor microenvironment reactivity through β3-adrenoreceptors during melanoma progression. Oncotarget 2015, 6, 4615–4632. [Google Scholar] [CrossRef] [PubMed]
- Lamkin, D.M.; Sloan, E.K.; Patel, A.J.; Chiang, B.S.; Pimentel, M.A.; Ma, J.C.; Arevalo, J.M.; Morizono, K.; Cole, S.W. Chronic stress enhances progression of acute lymphoblastic leukemia via β-adrenergic signaling. Brain Behav. Immun. 2012, 26, 635–641. [Google Scholar] [CrossRef] [PubMed]
- Cole, S.W.; Sood, A.K. Molecular pathways: Beta-adrenergic signaling in cancer. Clin. Cancer Res. 2012, 18, 1201–1206. [Google Scholar] [CrossRef]
- Chiarugi, P.; Filippi, L. β3-adrenoreceptor and tumor microenvironment: A new hub. Oncoimmunology 2015, 4, e1026532. [Google Scholar] [CrossRef] [PubMed]
- Calvani, M.; Cavallini, L.; Tondo, A.; Spinelli, V.; Ricci, L.; Pasha, A.; Bruno, G.; Buonvicino, D.; Bigagli, E.; Vignoli, M.; et al. β3-Adrenoreceptors Control Mitochondrial Dormancy in Melanoma and Embryonic Stem Cells. Oxid. Med. Cell. Longev. 2018, 6816508. [Google Scholar] [CrossRef] [PubMed]
- Dal Monte, M.; Casini, G.; Filippi, L.; Nicchia, G.P.; Svelto, M.; Bagnoli, P. Functional involvement of β3-adrenergic receptors in melanoma growth and vascularization. J. Mol. Med. (Berl). 2013, 91, 1407–1419. [Google Scholar] [CrossRef] [PubMed]
- Rains, S.L.; Amaya, C.N.; Bryan, B.A. Beta-adrenergic receptors are expressed across diverse cancers. Oncoscience 2017, 4, 95–105. [Google Scholar] [CrossRef] [PubMed]
- Comerford, K.M.; Wallace, T.J.; Karhausen, J.; Louis, N.A.; Montalto, M.C.; Colgan, S.P. Hypoxia-inducible Factor-1-dependent Regulation of the Multidrug Resistance (MDR1) Gene. Cancer Res. 2002, 62, 3387–3394. [Google Scholar]
- Braun, N.; Klumpp, D.; Hennenlotter, J.; Bedke, J.; Duranton, C.; Bleif, M.; Huber, S.M. UCP-3 uncoupling protein confers hypoxia resistance to renal epithelial cells and is upregulated in renal cell carcinoma. Sci. Rep. 2015, 5, 13450. [Google Scholar] [CrossRef] [PubMed]
- Dalla Pozza, E.; Fiorini, C.; Dando, I.; Menegazzi, M.; Sgarbossa, A.; Costanzo, C.; Palmieri, M.; Donadelli, M. Role of mitochondrial uncoupling protein 2 in cancer cell resistance to gemcitabine. Biochim. Biophys. Acta 2012, 1823, 1856–1863. [Google Scholar] [CrossRef]
- Quốc Lu’o’ng, K.V.; Nguyễn, L.T. The roles of beta-adrenergic receptors in tumorigenesis and the possible use of beta-adrenergic blockers for cancer treatment: Possible genetic and cell-signaling mechanisms. Cancer Manag. Res. 2012, 4, 431–445. [Google Scholar] [CrossRef] [PubMed]
- Montoya, A.; Varela-Ramirez, A.; Dickerson, E.; Pasquier, E.; Torabi, A.; Aguilera, R.; Nahleh, Z.; Bryan, B. The beta-adrenergic receptor antagonist propranolol alters mitogenic and apoptotic signaling in late stage breast cancer. Biomed. J. 2019, 42, 155–165. [Google Scholar] [CrossRef] [PubMed]
- Montoya, A.; Amaya, C.N.; Belmont, A.; Diab, N.; Trevino, R.; Villanueva, G.; Rains, S.; Sanchez, L.A.; Badri, N.; Otoukesh, S.; et al. Use of non-selective β-blockers is associated with decreased tumor proliferative indices in early stage breast cancer. Oncotarget 2017, 8, 6446–6460. [Google Scholar] [CrossRef] [PubMed]
- Méndez-Ferrer, S.; Lucas, D.; Battista, M.; Frenette, P.S. Haematopoietic stem cell release is regulated by circadian oscillations. Nature 2008, 452, 442–447. [Google Scholar] [CrossRef]
- Scadden, D.T. Circadian Rhythms: Stem cells traffic in time. Nature 2008, 452, 416–417. [Google Scholar] [CrossRef]
- Qinghong, S.; Shen, G.; Lina, S.; Yueming, Z.; Xiaoou, L.; Jianlin, W.; Chengyan, H.; Hongjun, L.; Haifeng, Z. Comparative proteomics analysis of differential proteins in respond to doxorubicin resistance in myelogenous leukemia cell lines. Proteome Sci. 2015, 13, 1. [Google Scholar] [CrossRef] [PubMed]
- Nobili, S.; Lapucci, A.; Landini, I.; Coronnello, M.; Roviello, G.; Mini, E. Role of ATP-binding cassette transporters in cancer initiation and progression. Semin. Cancer Biol. 2020, 60, 72–95. [Google Scholar] [CrossRef] [PubMed]
- Xie, J.; Li, D.W.; Chen, X.W.; Wang, F.; Dong, P. Expression and significance of hypoxia-inducible factor-1α and MDR1/P-glycoprotein in laryngeal carcinoma tissue and hypoxic Hep-2 cells. Oncol. Lett. 2013, 6, 232–238. [Google Scholar] [CrossRef]
- Ding, Z.; Yang, L.; Xie, X.; Xie, F.; Pan, F.; Li, J.; He, J.; Liang, H. Expression and significance of hypoxia-inducible factor-1 alpha and MDR1/P-glycoprotein in human colon carcinoma tissue and cells. J. Cancer Res. Clin. Oncol. 2010, 136, 1697–1707. [Google Scholar] [CrossRef] [PubMed]
- Chen, J.; Ding, Z.; Peng, Y.; Pan, F.; Li, J.; Zou, L.; Zhang, Y.; Liang, H. HIF-1α inhibition reverses multidrug resistance in colon cancer cells via downregulation of MDR1/P-glycoprotein. PLoS ONE 2014, 9, e98882. [Google Scholar] [CrossRef] [PubMed]
- Muz, B.; Kusdono, H.D.; Azab, F.; de la Puente, P.; Federico, C.; Fiala, M.; Vij, R.; Salama, N.N.; Azab, A.K. Tariquidar sensitizes multiple myeloma cells to proteasome inhibitors via reduction of hypoxia-induced P-gp-mediated drug resistance. Leuk. Lymphoma 2017, 58, 2916–2925. [Google Scholar] [CrossRef] [PubMed]
- Cui, X.Y.; Skrettin, G.; Jing, Y.; Sun, H.; Sandset, P.M.; Sun, L. Hypoxia influences stem cell-like properties in multidrug resistant K562 leukemic cells. Blood Cells Mol. Dis. 2013, 51, 177–184. [Google Scholar] [CrossRef] [PubMed]


© 2020 by the authors. Licensee MDPI, Basel, Switzerland. This article is an open access article distributed under the terms and conditions of the Creative Commons Attribution (CC BY) license (http://creativecommons.org/licenses/by/4.0/).
Share and Cite
Calvani, M.; Dabraio, A.; Bruno, G.; De Gregorio, V.; Coronnello, M.; Bogani, C.; Ciullini, S.; Marca, G.l.; Vignoli, M.; Chiarugi, P.; et al. β3-Adrenoreceptor Blockade Reduces Hypoxic Myeloid Leukemic Cells Survival and Chemoresistance. Int. J. Mol. Sci. 2020, 21, 4210. https://doi.org/10.3390/ijms21124210
Calvani M, Dabraio A, Bruno G, De Gregorio V, Coronnello M, Bogani C, Ciullini S, Marca Gl, Vignoli M, Chiarugi P, et al. β3-Adrenoreceptor Blockade Reduces Hypoxic Myeloid Leukemic Cells Survival and Chemoresistance. International Journal of Molecular Sciences. 2020; 21(12):4210. https://doi.org/10.3390/ijms21124210
Chicago/Turabian StyleCalvani, Maura, Annalisa Dabraio, Gennaro Bruno, Veronica De Gregorio, Marcella Coronnello, Costanza Bogani, Sara Ciullini, Giancarlo la Marca, Marina Vignoli, Paola Chiarugi, and et al. 2020. "β3-Adrenoreceptor Blockade Reduces Hypoxic Myeloid Leukemic Cells Survival and Chemoresistance" International Journal of Molecular Sciences 21, no. 12: 4210. https://doi.org/10.3390/ijms21124210
APA StyleCalvani, M., Dabraio, A., Bruno, G., De Gregorio, V., Coronnello, M., Bogani, C., Ciullini, S., Marca, G. l., Vignoli, M., Chiarugi, P., Nardi, M., Vannucchi, A. M., Filippi, L., & Favre, C. (2020). β3-Adrenoreceptor Blockade Reduces Hypoxic Myeloid Leukemic Cells Survival and Chemoresistance. International Journal of Molecular Sciences, 21(12), 4210. https://doi.org/10.3390/ijms21124210