Abstract
Parageobacillus thermoglucosidasius is a metabolically versatile, facultatively anaerobic thermophile belonging to the family Bacillaceae. Previous studies have shown that this bacterium harbours co-localised genes coding for a carbon monoxide (CO) dehydrogenase (CODH) and Ni-Fe hydrogenase (Phc) complex and oxidises CO and produces hydrogen (H2) gas via the water-gas shift (WGS) reaction. To elucidate the genetic events culminating in the WGS reaction, P. thermoglucosidasius DSM 6285 was cultivated under an initial gas atmosphere of 50% CO and 50% air and total RNA was extracted at ~8 (aerobic phase), 20 (anaerobic phase), 27 and 44 (early and late hydrogenogenic phases) hours post inoculation. The rRNA-depleted fraction was sequenced using Illumina NextSeq, v2.5, 1x75bp chemistry. Differential expression revealed that at 8 vs.. 20, 20 vs.. 27 and 27 vs.. 44 h post inoculation, 2190, 2118 and 231 transcripts were differentially (FDR < 0.05) expressed. Cluster analysis revealed 26 distinct gene expression trajectories across the four time points. Of these, two similar clusters, showing overexpression at 20 relative to 8 h and depletion at 27 and 44 h, harboured the CODH and Phc transcripts, suggesting possible regulation by O2. The transition between aerobic respiration and anaerobic growth was marked by initial metabolic deterioration, as reflected by up-regulation of transcripts linked to sporulation and down-regulation of transcripts linked to flagellar assembly and metabolism. However, the transcriptome and growth profiles revealed the reversal of this trend during the hydrogenogenic phase.
1. Introduction
Hydrogen gas (H2) has the highest energy per unit mass of all fuels (heating value of 141.9 MJ/kg) [1]. In contrast to traditional fuels, H2 is a zero-emission fuel when undergoing complete combustion in the presence of oxygen (2 H2 + O2 → 2 H2O) [2]. As such H2 has become prominent as a clean and sustainable alternative energy source [3]. Unlike industrial strategies for H2 production, such as coal gasification, steam reformation of natural gas and partial oxidation of oil, which require high energy inputs and rely on the use of non-renewable substrates [4], biohydrogen production is less energy intensive and the process results in almost zero waste products [4,5]. Biohydrogen is principally generated via biophotolysis of water by algae, and bacterial photo-fermentation and dark fermentation of organic substances [6]. However, these methods are constrained by both economic and technological limitations, including high costs of production and low yields [5]. Recently, there has been interest in biological production of H2 by microorganisms that couple hydrogenogenesis with the oxidation of carbon monoxide (CO) in the Water Gas Shift (WGS) reaction. A broad range of taxa including mesophilic anaerobes such as Rhodospirillum rubrum and Rhodopseudomonas palustris [7], thermophilic anaerobes such as Carboxydothermus hydrogenoformans, C. pertinax and Thermosinus carboxydivorans [8,9], and thermophilic archaea such as Thermococcus onnurineus [10] have been shown to tolerate high concentration of CO and oxidise this substrate via the WGS reaction [8,11].
The genus Parageobacillus comprises facultative anaerobic, obligate thermophilic (Topt 55–65 °C) and catabolically diverse bacilli [12,13]. Because of the intrinsic capability to survive as spores, members of this genus have been isolated from a wide range of environments, ranging from extremely hot to temperate environments [14]. Parageobacillus spp. are of biotechnological interest as sources of thermostable enzymes including amylases, lipases, proteases and xylanases [15,16,17,18,19] and as whole-cell biocatalysts for biofuel production [20,21,22] and bioremediation [23]. Recently, P. thermoglucosidasius was demonstrated to produce H2 via the WGS reaction: CO + H2O → CO2 + H2 [24]. A carbon monoxide dehydrogenase (CODH) oxidises carbon monoxide (CO) and the resultant electrons are used by a hydrogen-evolving hydrogenase for the reduction of protons, resulting in the production of H2 and energy. This feature has been linked to a genetic locus harbouring three CODH genes (cooCSF) and 12 distinct genes (phcA-L) that constitute the Ni-Fe group 4a hydrogenase (Phc) [24,25,26].
P. thermoglucosidasius represents the first facultative anaerobe in which the WGS reaction has been observed. The organism grows aerobically until O2 is depleted, where after there is a lag phase during which biomass decreases. If CO is supplied, H2 is produced with a concomitant increase in biomass [27].
Here, to better understand the gene expression dynamics during the aerobic, lag and hydrogenogenic phases, RNA-seq was performed to elucidate the pattern of gene expression in P. thermoglucosidasius DSM 6285 grown with an initial gas atmosphere of 50% CO and 50% air.
2. Results
2.1. Differential Gene Expression during Aerobic, Anaerobic and Hydrogenogenic Growth Phases in P. thermoglucosidasius
P. thermoglucosidasius DSM 6285 was cultivated with an initial gas atmosphere of 50% air and 50% CO. Total RNA was extracted from cells harvested at four time points: 8, 20, 27, and 44 h post-inoculation. These timepoints approximately coincide with the middle of the aerobic growth phase, the early anaerobic phase when O2 is exhausted, when H2 is first detected and in the middle of the WGS phase, respectively (Figure 1). A total of ~106 million reads (7.9 Gb) were generated using Illumina NextSeq, v2.5, 1x75bp chemistry. The average number of reads ranged from ~1.46 × 10⁷ (mid-aerobic phase) to ~7.4 × 10⁶ (mid-WGS). Between 93% and 98% of these reads were trimmed and aligned to 3888 protein coding regions in the draft genome of P. thermoglucosidasius DSM 6285 (Table S1). A multidimensional scaling (MDS) plot, used to assess pattern of gene expression across the four sampling points revealed a clear separation of transcripts between the samples and commonality of expression between biological replicates within the sample groups (Figure S1). These results suggest that the transcriptome datasets are sufficiently robust to validly assess transcript dynamics across the studied conditions.
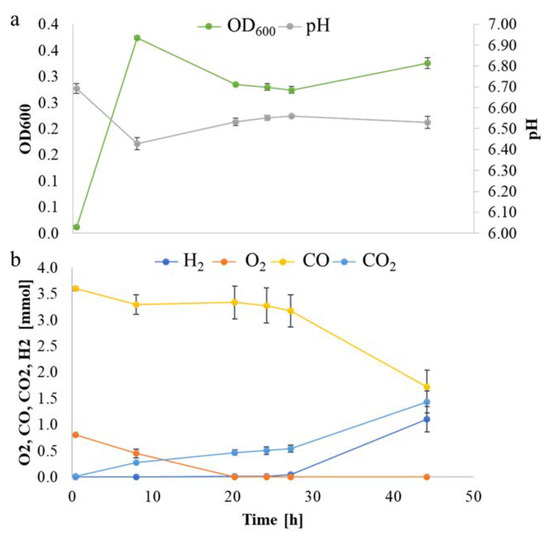
Figure 1.
P. thermoglucosidasius DSM 6285 grown with an initial gas atmosphere composition of 50% CO and 50% air. (a) Absorbance (OD600) and pH measurements. (b) Gas composition.
Comparisons of the expression profiles at the different time points revealed substantial differences between different phases. Comparison of the transcriptome profiles of P. thermoglucosidasius DSM 6285 at 8 and 20 h post-inoculation showed statistically significant (FDR < 0.05) differential expression of 2190 transcripts, of which ~67% and 33% were up- and down-regulated at 20 h, respectively (Figure 2a,b). In comparison to 20 h post-inoculation, 1024 and 1094 transcripts were significantly (FDR < 0.05) up- and down-regulated at 27 h, respectively (Figure 2a,c). By contrast, only 231 transcripts showed significant differential expression (FDR < 0.05) between the early (27 h) and late (44 h) WGS phases. Relative to 27 h, 84 and 147 transcripts were up- and down-regulated, respectively, at 44 h (Figure 2a,d).
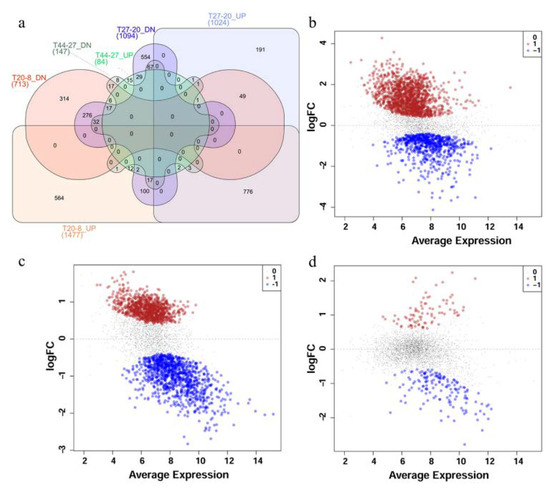
Figure 2.
Differential expression of transcripts in P. thermoglucosidasius DSM 6285 grown with an initial gas atmosphere composition of 50% CO and 50% air. (a) Venn diagram showing the number of up- and down-regulated (UP and DN) transcripts for time points 20 vs.. 8 h (T20-8), 27 vs.. 20 h (T27-20) and 44 vs.. 27 h (T44-27). (b) MDS plot showing differential expression of transcripts at 20 vs.. 8 h post-inoculation, (c) MDS plot showing differential expression of transcripts at 27 vs.. 20 h post-inoculation and (d) MDS plot showing differential expression of transcripts t 44 vs.. 27 h post-inoculation. Red, black and blue dots represent upregulated, non-differentially expressed and down-regulated transcripts, respectively.
2.2. Metabolic and Functional Shifts in Response to Changing Gas Atmosphere
To determine the functional implication of the observed differences in expression profiles during the different growth phases, gene ontology (GO) and KEGG orthologues of the proteome of P. thermoglucosidasius DSM 6285 were predicted based on annotation obtained from UniProt [28] and using BlastKOALA [29]. Approximately 54.8% and 57.6% of the 3888 P. thermoglucosidasius DSM proteins were assigned to GO terms or KEGG categories, respectively.
Evaluation of the up-regulated transcripts at 20 h (relative to 8 h) post-inoculation, revealed significant (FDR < 0.05) enrichment of genes of annotated with 14 GO terms including four biological processes (BP), seven cellular components (CC) and three molecular functions (MF) (Table S2). By contrast, the down-regulated transcripts are significantly (FDR < 0.05) predominated by GOs linked to 91 BP, 3 CC and 1 MF. Evaluation of the enriched functions showed that among the BPs, GOs of anion transport (GO:0006820), developmental processes (GO:0032502) and sporulation (GO:0043934) led the up-regulated terms while drug metabolic process (GO:0017144) and locomotion (GO:0040011) were among the top down-regulated functions. Additionally, the GOs nucleotide and ATP biosynthesis were also down-regulated at 20 h relative to 8 h. The differentially expressed transcripts were also evaluated for KEGG pathway enrichment. At 20 h relative to 8 h, differentially expressed transcripts were significantly associated with between 14 (q < 0.05) and 18 (p < 0.05) KEGG pathways (Table 1). Genes linked to amino acid metabolism (valine, leucine and isoleucine degradation), carbohydrate metabolism (citrate cycle, glycolysis / gluconeogenesis, pyruvate, propanoate and butanoate metabolism), cell motility (flagellar assembly), energy metabolism (oxidative phosphorylation), biosynthesis of antibiotics and secondary metabolites, metabolism of cofactors and vitamins and translation (ribosomes) were down-regulated while only one category, membrane transport (ABC transporters), was significantly (q < 0.05) up-regulated. In addition to various roles in wide range of cellular processes, including transport of molecules [30], ABC transporters overexpression has been observed in Mycobacterium smegmatis grown under oxygen starvation [31].

Table 1.
KEGG pathway enrichment of differentially expressed genes at 20 vs.. 8 h (P1), 27 vs.. 20 h (P2) and 44 vs.. 27 h (P3). Positive and negative statistical mean values indicate up- and down-regulated functions, respectively.
Considering the differentially expressed genes at 27 h relative to 20 h, the GO enrichment analysis showed 10 GOs including 3 BPs, 5 CCs and 2 MFs were significantly (FDR < 0.05) up-regulated, with GOs of transport (GO:0006810), spore germination (GO:0009847) and developmental process (GO:0032502) being the top up-regulated processes (Table S2). Conversely, 44 GOs were significantly (FDR < 0.05) depleted, including 28 BPs and 8 CCs and MFs each. Differentially expressed transcripts at 27 h (relative to 20 h) enrich between nine (q < 0.05) and 18 (p < 0.05) KEGG pathways (Table 1). These include 13 of the pathways that have been down-regulated at 20 h, including the TCA cycle, ABC transport, biosynthesis of amino acids, antibiotics, secondary metabolites; porphyrin and chlorophyll metabolism and ribosome synthesis. Additionally, transcripts associated with fatty acid metabolism, carbohydrate (glyoxylate and dicarboxylate metabolism) and energy (methane metabolism) metabolism, folding, sorting and degradation (RNA degradation) as well as translation (aminoacyl-tRNA biosynthesis) were also down-regulated. Based on the KEGG pathway enrichment analysis, however, no specific function was up-regulated at this point.
At the final stages of the experiment (44 vs.. 27 h), with cells undergoing the WGS reaction, 34 and one GOs were significantly (FDR < 0.05) enriched among the up- and down-regulated transcripts, respectively (Table S2). The most up-regulated function appeared to be translation (GO:0006412), while the alcohol catabolic process (GO:0046164) was down-regulated. Only one KEGG pathway, translation (ribosomes), was significantly (q < 0.05) up-regulated (Table 1).
Overall, the differential expression analysis provides some insight into the physiological adaptation of P. thermoglucosidasius DSM 6285 in response to changing gas atmospheres and shifts in metabolism. The observed up-regulation of sporulation transcripts (Table S2) and down-regulation of flagellar assembly (Table 1) at 20 h suggests a degree of metabolic shut-down in response to energy limitation and build-up of acid in the medium. At the 8 h time point, DSM 6285 attained the maximum OD600 of 0.37 while the medium pH dropped from 6.69 to 6.43 (Figure 1a), indicating the accumulation of acetic acid under aerobic conditions. This phenomenon is characteristic of the ‘overflow mechanism’ observed when bacteria are grown with excess carbon source as a strategy to fast track acetyl-coA metabolism and maximise ATP synthesis when the key enzymes of the TCA cycle are inhibited [32,33]. Aerobic acetate production has been reported in P. thermoglucosidasius M10EXG [34]. Although only 0.75 g L−1 of glucose was used in the current experiment, the presence of carbon monoxide (CO), which is known to inhibit aerobic respiration via the inactivation of enzymes of the TCA cycle and the respiratory chain [35,36], may have resulted in a backlog of glucose which is channelled to acetate.
Inhibition of the respiratory chains will also result in the excess of reducing equivalents [35,36]. For instance, Mycobacterium tuberculosis H37Rv was demonstrated to maintain the balance of redox intermediaries by utilizing oxygen and, in its absence, by either decreasing the reduction of cofactors like FAD, NAD and NADP or via using pathways that convert cofactors to their oxidized forms [37].
As observed from the growth curve and gas analysis (Figure 1a,b), P. thermoglucosidasius DSM 6285 renewed the growth between 27 and 44 h under WGS. This is supported by the observed induction of cellular protein metabolic process, ribosome, and translational activities (Table S2). Interestingly, there was gradual restoration of flagellar function at 27 h (Figure 3), as indicated by the overexpression of fliO, fliQ, fliP and fliR associated with the type III secretory system. Furthermore, transcripts of RNA polymerase sigma factor FliA and the switch mediator protein FliK were overexpressed at 44 h. FliA and its inhibitor, FlgM have been shown to play a central role in regulating the assembly of flagellum in bacteria [38].
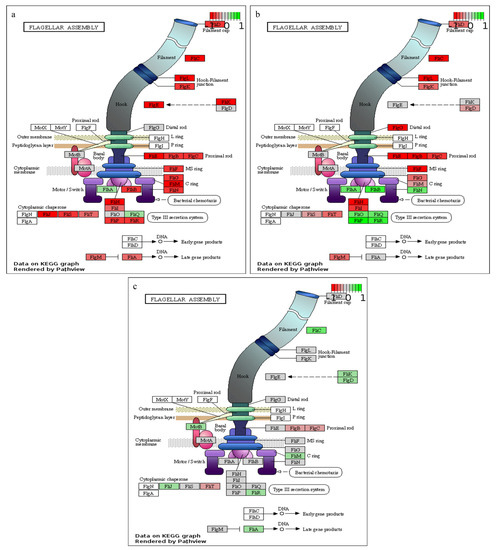
Figure 3.
KEGG pathway enrichment of flagellar assembly. (a) 20 vs.. 8 h, (b) 27 vs.. 20 h and (c) 44 vs.. 27 h post-inoculation. Green, grey and red colours represent up-regulated, non-differentially expressed and down-regulated transcripts, respectively.
2.3. Temporal Dynamics of P. thermoglucosidasius DSM 6285 Transcriptome between Aerobic Metabolism to Water Gas SHIFT reaction
Clustering of the 3055 normalised transcript counts showing differential expression in at least two consecutive condition sets revealed that the transcripts were grouped into 26 clusters with varying trajectories over the four time points (Figure S2). Of these, 11 clusters showing two distinct patterns of expression comprised over 75% of the analysed transcripts. Transcripts in first set of clusters (8, 11, 13, 18 and 19), comprising 1319 transcripts, were generally down-regulated at 8 h and up-regulated at 44 h, while the second set of 1031 transcripts (1, 3, 4, 9, 16 and 22) showed overexpression at 8 h and down-regulation at 44 h. GO enrichment analysis revealed that the first cluster set was dominated by transcripts associated with amino acid transport, cellular developmental and sporulation, while the second set was significantly enriched with transcripts of metabolic processes, including oxidation reduction, the tricarboxylic acid cycle and tetrapyrrole metabolism (Figure 4). KEGG enrichment analysis for these sets of clusters also revealed that only the ABC transporters were significantly (q < 0.05) enriched for the first set (Table 2). By contrast, significant (q < 0.05) enrichment of eleven pathways, biosynthesis of antibiotics and secondary metabolites, carbon metabolism and oxidative phosphorylation was observed for the second set of clusters.
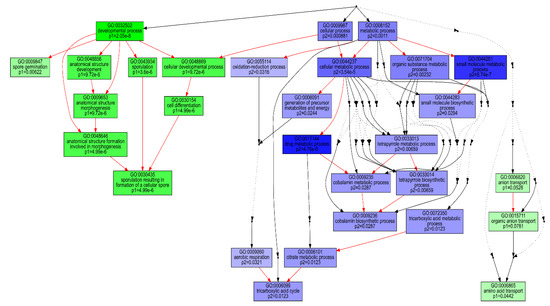
Figure 4.
Comparison of GO-enriched function among two predominant dp_gp_cluster trajectory sets. P1 (green boxes) comprises the pooled transcripts of clusters 8, 11, 13, 18 and 19 which are up-regulated at 44 relative to 8 h and P2 (blue boxes) includes transcripts of clusters 1, 3, 4, 9, 16 and 22, generally down-regulated at 44 relative to 8 h. The hierarchical relationships between different GO terms are represented by arrows. Red, black solid and black dashed arrows represent relationships, between two enriched GO terms, between enriched and unenriched terms and between two unenriched GO terms, respectively.
Table 2.
KEGG pathway enrichment among two predominant dp_gp_cluster trajectory sets. Cluster set 1 comprises the pooled transcripts of clusters 8, 11, 13, 18 and 19 which are up-regulated at 44 relative to 8 h and Cluster set 2 includes transcripts of clusters 1, 3, 4, 9, 16 and 22, generally down-regulated at 44 relative to 8 h.
While the clusters highlight the overall trend in terms of a shift in metabolism from aerobic processes to the anaerobic WGS-driven phase, it masks some of the nuances. For example, the significant down-regulation of some the pathways coincides with the up-regulation of specific transcripts for pathways that may be of interest for the metabolism of the organism during the WGS reaction. A specific example is the oxidative phosphorylation pathways, where transcripts for genes across the respiratory chain are generally down-regulated at 44 h post-inoculation relative to the aerobic phase (8 h). These include transcripts of genes involved in the synthesis of the NADH-quinone oxidoreductase (nuoB, nuoC, nuoD, nuoJ, nuoK, nuoN and ndhF), cytochrome bc1 complex (cytb, cyt1 and isp), cytochrome c oxidase caa3 (ctaA and ctaB) and the terminal cytochrome bd oxidase (cydA). Together, these changes suggest a shift from aerobic respiration to anaerobic fermentation (Figure 5).
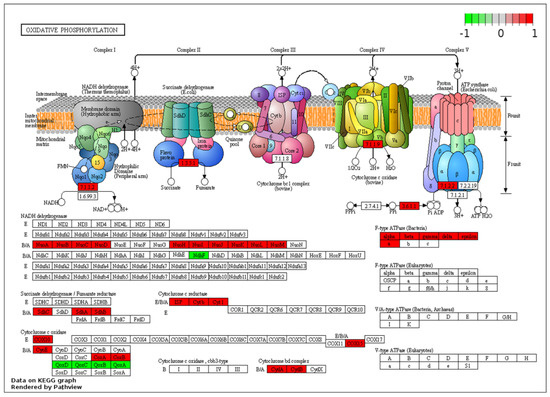
Figure 5.
KEGG pathway enrichment of oxidative phosphorylation for two predominant dp_gp_cluster trajectory sets. Enzymes highlighted in green are linked to the pooled transcripts of clusters 8, 11, 13, 18 and 19 which are up-regulated at 44 relative to 8 h and those in red are linked to transcripts of clusters 1, 3, 4, 9, 16 and 22, generally down-regulated at 44 relative to 8 h post-inoculation.
However, two transcripts, atpD and atpC, coding for the β and ε subunits of the F1F0-type ATP synthetase are significantly up-regulated at the 44h timepoint relative to the aerobic (8h) timepoint. A combined transcriptome and mutagenesis study of Listeria monocytogenes also showed up-regulation of these genes when this organism was grown under anaerobic conditions [39]. It has been postulated that, under anaerobic conditions, F1F0-ATPase functions in reverse to export protons at the expense of ATP. Proton export via the F1F0-ATPase may regulate the intracellular pH [39,40] in response to pH effects resulting from aerobic acetate accumulation. The DSM 6285 transcriptome profile also showed an up-regulation of acetate kinase (AckA) transcripts at time point 20 relative to 8 h and those of acetyl-CoA synthetase (ACS) at 27 relative to 20 h, suggesting a switch to acetate assimilation in response to acid accumulation. In E. coli, phosphotransacetylase Pta and the acetate kinase AckA have been shown to reversibly convert acetate to acetyl CoA [32,41]. This is also consistent with the observed up-regulation of the transcripts qoxA, qoxC and qoxA, which are upregulated in L. monocytogenes in response to acid stress [42].
2.4. Transcriptome Pattern of P. thermoglucosidasius DSM 6285 CODH and Hydrogenases
Evaluation of the gene expression profiles of the genes coding for the carbon monoxide dehydrogenase (CODH) and hydrogen evolving hydrogenase (Phc) [25] across the different points revealed that transcripts associated with CODH and Phc were more abundant at 8 and 20 h (aerobic phase) compared to 27 and 44 h (anaerobic and WGS phase; Figure 6a). Furthermore, the transcripts are generally up-regulated at time point 20 relative to 8 h and down-regulated at 27 relative to 20 h and at 44 relative to 27 h (Figure 6d). However, differential expression analysis revealed that only transcripts of cooF (coding for the CODH iron-sulphur protein) and phcABCE (coding for the Ni-Fe hydrogenase 4 B, C, E and D subunits, respectively) were significantly (FDR < 0.05) up-regulated at 20 h. By contrast, all transcripts except phcIKL (coding for the hydrogenase maturation protein, maturation nickel metallochaperone and accessory protein, respectively) were significantly (FDR < 0.05) down-regulated at 27 h. Cluster analysis showed that the CODH and Phc transcripts followed similar trajectories as depicted in clusters 9 and 7 (Figure S3). The trajectories of cooC and phcDFGHJ suggest that these genes were up-regulated at both timepoint 8 and 20 h, and down-regulated at 44 h. By contrast, cooSF and phcABCE show rapid up-regulation at timepoint 20 relative to 8 h and subsequent down-regulation at 44 h. The initial overexpression of the latter group of transcripts, however, coincides with the depletion of O2 at 20 h, suggesting that these genes may constitute an O2 sensing mechanism; ie., anaerobic CODH and Ni-Fe group 4a hydrogenase are O2-sensitive [43,44,45]. It may be significant that transcripts of two putative CO-sensing transcriptional factors (Crp/Fnr; WP_090948317.1 and WP_064552491.1) were up-regulated (cluster 7; Figure S3) only at 44 h relative to the three other time points. The two Crp/Fnr proteins share similar protein sizes (230-236 amino acids in length) and domain architecture (PR018490, IPR000595 and IPR012318) as the CooA protein (223 aa) of C. amalonaticus Y19 [46]. These genes occur ~0.3 Mb upstream the CODH-H2-evolving hydrogenase locus in the DSM 6285 genome.
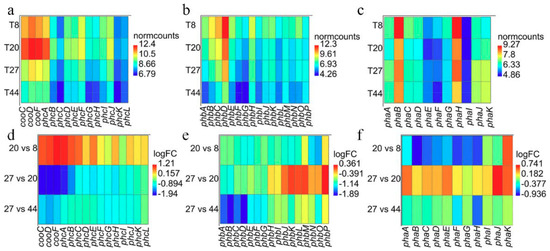
Figure 6.
Pattern of expression among transcripts for the CODH and H2-evolving hydrogenase Phc (a,d) and the uptake hydrogenases Pha (b,e) and Phb (c,f). (a–c) Heat maps of the normalised transcripts counts (‘normcounts’) across the four time points. (d–f) Heat maps showing pattern of differential expression (logFC) for the comparisons of time points 20 vs.. 8, 27 vs.. 20 and 44 vs.. 27 h.
In addition to the CODH-Phc complex, two loci coding for predicted uptake hydrogenases, Pha and Phb, have been previously predicted on the DSM 6285 genome [25]. These share orthology to the unidirectional uptake Ni-Fe group 1d hydrogenases and Ni-Fe group 2a hydrogenases, respectively [24,25]. Both uptake hydrogenases are found in aerobic and facultative anaerobic bacterial taxa, are O2 tolerant and play a role in recycling of H2 for use in aerobic and hydrogenotrophic respiration [43,44,47].
Transcripts of the Phb genes showed similar expression patterns as observed for the Phc genes, with general up-regulation at time point 8 h and down-regulation at time point 44 h (Figure 6b). However, differential expression analysis (Figure 6e) revealed significant (FDR < 0.05) down-regulation of all transcripts at time point 20 relative to 8 h. Only transcripts of phbABCEFG showed significant down-regulation at 27 compared to 20 h post-inoculation. Similarly, all transcripts were down-regulated at time point 44 relative to 27 h. All transcripts except phbJKLM showed similar trajectories depicting the pattern of expression observed above. Unlike most of the transcripts, phbJKLM appear to be constitutively expressed at 20 and 27 h and down-regulated like others Pha transcript at 44 h (Figure S3).
Pha transcripts showed the most diverse expression pattern (Figure 6c). While phaA showed the highest expression at 27 h, phaBCDEFGH had maximum expression at 8 h. By contrast, the maximum expression of phaIJK was observed at 27 and 44 h. Comparison of transcript profiles at the different time points revealed, however, that phaBCDFGH expression was significantly (FDR < 0.05) down-regulated at 20 relative to 8 h while only phaK was significantly (FDR < 0.05) up-regulated at this time (Figure 6f). Comparing time points 27 and 20 h, only transcripts of two genes phaJK showed significant (FDR < 0.05) up-regulation. No significant differentially gene expression was observed at time point 44 relative to 27 h. The overall expression profiles for Pha revealed that these transcripts follow four distinct trajectories (Figure S3).
The general trend suggests that the uptake hydrogenases Pha and Phb are active during aerobic phases of P. thermoglucosidasius growth as previously predicted [24]. However, the phaJK genes, which code for hydrogenase expression/formation proteins (HypD/HypE) are the only uptake hydrogenase transcripts with increased transcriptional activity under anaerobic conditions. This is perhaps surprising since HypD and HypE, which are involved in Ni incorporation and purine derivative binding, respectively, are part of the machinery that generates the matured hydrogenase [48].
3. Discussion
RNA-seq based transcriptome profiling of the facultative anaerobe P. thermoglucosidasius DSM 6285 growing under an initial gas atmosphere of 50% air and 50% CO revealed a metabolic flexibility reflective of its ability to switch between aerobic growth, anaerobic survival, and anaerobic growth to recovery via the WGS reaction. Annotation of differentially expressed transcripts using KEGG and GOs revealed the suppression of aerobic metabolism during O2 depletion [49], as indicated by downregulation of cytochrome oxidases and ATPase transcripts. Strikingly, transcripts of cytochrome aa3-600 menaquinol oxidases remained induced throughout the period of cultivation. Menaquinol oxidases serve as proton-pumping O2 reductases that oxidize membrane-bound quinols directly without the need for electrons from cytochrome c [50]. Although part of aerobic respiratory chains, their evolution has been predicted to predate atmospheric O2 [51] and it is therefore perhaps not surprising that they are induced under low O2 or anaerobic conditions in P. thermoglucosidasius.
Previous work in B. subtilis revealed that at least one quinol oxidase is essential for the formation of spores [52,53]. Indeed, the up-regulation of aa3-600 coincides with the up-regulation of predicted sporulation genes as P. thermoglucosidasius DSM 6285 transitions from aerobic growth to the anaerobic phase where initiation of spore formation may serve as a survival strategy under energy limitation. This is further supported by the observed down-regulation of motility. The change from motile to non-motile forms is typically observed in the transition between exponential and stationary phase and often the two phases coexist [54,55].
The up-regulation of transcripts of the anaerobic CODH and H2-evolving Phc seems to coincide with O2 depletion and the locus does not appear to be under the control of the putative CO-sensing transcriptional factor (Crp/Fnr) as reported for other carboxydotrophs [56]. Sensitivity of the anaerobic CODH to oxygen has been observed at both protein (enzymic activity) and genetic levels [57,58]. However, the precise regulation of the CODH genes in P. thermoglucosidasius DSM 6285 remains unclear as the current fermentation strategy, which was optimised for early hydrogen production, also incorporated CO from the inception. Further investigations should focus on elucidating the regulation of CODH loci in P. thermoglucosidasius DSM 6285.
The commencement of the biological WGS reaction after ~27 h, as indicated by the consumption of CO and evolution of H2, coincided with the resumption of several metabolic activities. Both GO and KEGG enrichment analyses showed that ribosome biosynthesis was more active at 44 compared to 27 h. Up-regulation of ribosome biosynthesis has been reported during recovery of Nitrosomonas europaea impaired by CeO2 nanoparticles [59]. Overexpression of ribosome biosynthesis has also been suggested as a means by which microorganisms compensate for low temperature-induced reduction in the rate of protein biosynthesis [60,61,62]. Although the current experiment did not directly quantify the amount of energy obtained by the organism via the WGS reaction, the up-regulation of genes coding for key central metabolic enzymes—e.g., ATP-dependent 6-phosphofructokinase and pyruvate, as well as the observable increase in biomass (Figure 1)—suggest that the WGS provides sufficient energy to support growth.
4. Materials and Methods
4.1. Microorganism and Media
P. thermoglucosidasius DSM 6285 was obtained from the Deutsche Sammlung von Mikroorganismen und Zellkulturen (DSMZ, Braunschweig, Germany) and stored at −80 °C in glycerol.
For cultivation of the pre-cultures, mLB (modified Luria-Bertani) medium was used as previously described [24]. The experiment was performed in a modified ammonium sulphate medium (ASM) [63], comprising 8.7 mM citric acid, 20.2 mM MgSO4, 10 mM K2SO4, 22.6 mM NaH2PO4, 0.8 mM CaCl2, 25 mM (NH4)2SO4, 4.16 mM glucose and 1 mL each of the filter-sterilized trace elements: 6 mM H2SO4, 0.1 mM CuSO4, 0.2 mM CoSO4, 0.5 mM ZnSO4, 2.29 mM FeSO4, 0.3 mM NiSO4, 0.9 mM MnSO4 and 0.1 mM H3BO3. The pH was adjusted to 6.8 with 4 M NaOH.
4.2. Experimental Set up and Analytical Methods
A two-step pre-culture system was used in the study. All pre-culture cultivation was carried out in 20 mL mLB medium. The first pre-culture was inoculated with 20 µL of a glycerol stock and cultured aerobically for 24 h at 55 °C, 120 rpm (Infors Thermotron, Infors AG, Bottmingen, Switzerland). Thereafter, a second pre-culture was inoculated to an OD600 of 0.1 and cultivated aerobically for 12 h (60 °C, 120 rpm). The experimental set-up (49 mL ASM medium) was inoculated with 1 mL of the second pre-cultures in 250-mL stoppered serum bottles with an initial gas atmosphere of 50% air and 50% CO. Samples for RNA-Seq analysis were taken in the aerobic phase (8 h), the anaerobic lag phase (20 h), the anaerobic phase prior to H2 production (27 h) and the H2-production phase (44 h). The experiment was conducted with two biological replicates, each comprised of six identical bottles. To obtain adequate amounts of RNA for sequencing, 4 mL of culture was collected from each bottle and pooled. Pressure was measured before and after every sample step using a manometer (GDH 14 AN, Greisinger electronic, Regenstauf, Germany). Absorbance (OD600) was measured as an indication of bacterial growth using an Ultrospec 1100 pro spectrophotometer (Amersham Biosciences, Picataway, NJ, USA) at each sample point. pH was monitored with a pH meter (Profilab pH 597, Xylem Analytics Germany Sales GmbH and Co. KG, WTW, Oberbayern, Germany). To determine the gas composition in the bottle, 4 mL gas samples were taken and injected to a 300 Micro GC gas analyzer (Inficon, Bad Ragaz, Switzerland). The calculation of the gas composition was carried out as previously described [24].
4.3. RNA Isolation, Library Preparation, and RNA-Seq
Total RNA extraction, rRNA depletion and sequencing were conducted by Microsynth AG (Balgach, Switzerland). Stranded, ribodepleted RNA libraries were prepared using MICROBExpress (Thermo Fisher, Balgach, Switzerland) according to the manufacturer’s instructions. Sequencing was performed using Illumina NextSeq, v2.5, 1x75bp chemistry. The reads were then demultiplexed and trimmed of Illumina adaptor residuals. All sequencing data obtained from this study have been deposited in the European Nucleotide Archive (ENA) under study accession number PRJEB36750.
4.4. RNA-Seq Data Analysis
The RNA-Seq reads were initially analysed using SPARTA [64] with default settings. Briefly, the reads were trimmed and analysed for quality using Trimmomatic [65] and FastQC [66], respectively. High-quality reads were mapped against the draft genome sequence of P. thermoglucosidasius DSM 6285 using Bowtie [67]. Transcript feature abundance was subsequently determined with HTSeq [68]. To determine overexpressed transcripts between time points, differential gene expression analysis was performed using edgeR [69]. The normalised counts obtained from edgeR [69] were used to profile the time-dependent expression of transcripts using DP_GP_cluster [70]. The draft genome sequence of P. thermoglucosidasius DSM 6285 was annotated using gene ontology (GO) and KEGG orthologues obtained from UniProt [28] and using BlastKOALA [29]. GOEAST [71] and Pathview Web [72] were used to predict the functions of overexpressed transcripts. MDS plots and heat maps were generated using edgeR [69] and PAST [73], respectively.
5. Conclusions
We analysed the genetic response of P. thermoglucosidasius DSM 6285 transitioning from aerobic respiration to anaerobic growth and supported by CO metabolism and the WGS reaction. The transcriptome data revealed no obvious impact of 50% CO in the atmosphere on the initial aerobic metabolic phase in the presence of O2 with P. thermoglucosidasius DSM 6285 only switching to CO metabolism after O2 depletion, possibly due to the O2-dependent inactivation of the WGS enzymes (CODH and hydrogenase) by O2. Furthermore, a shift from a motile to non-motile physiology, a reduction in metabolic activity and the activation of stress response and sporulation pathways are all observed once O2 is depleted, where P. thermoglucosidasius adapts to circumvent energy limitations through the WGS reaction. Overall, the data revealed a clear partitioning of transcripts which reflects a metabolic shift to cope with energy limitation and subsequent resumption of growth driven by the WGS reaction.
Supplementary Materials
The following are available online at https://www.mdpi.com/1422-0067/21/11/3870/s1, Figure S1: MDS plot showing pattern of transcripts expression in four RNA-seq samples of P. thermoglucosidasius DSM 6285 cultivated in two biological replicates (indicated by ‘_replicate number’) in stoppered serum bottles with an initial gas atmosphere composition of 50% CO and 50% air over four time points. Figure S2: DP_GP_cluster analysis of differentially expressed transcripts of P. thermoglucosidasius DSM 6285 cultivated in stoppered serum bottles with an initial gas atmosphere composition of 50% CO and 50% air and samples over four time points. Figure S 3. Trajectories of transcripts in the carbon monoxide dehydrogenase (CODH), uptake hydrogenase (Pha and Phb) and H2-evolving hydrogenase (Phc) loci. Table S1: Overview of RNA-seq read metrics of P. thermoglucosidasius DSM 6285. Culture were cultivated in two biological replicates in stoppered serum bottles with an initial gas atmosphere composition of 50% CO and 50% air over four time points. Table S2: Gene ontology (GO) enrichment of differentially Table S2: Gene ontology (GO) enrichment of differentially expressed genes of P. thermoglucosidasius DSM 6285 at 20 vs.. 8 h (P1), 27 vs.. 20 h (P2) and 44 vs.. 27 h (P3). The organism was grown with an initial gas atmosphere composition of 50% CO and 50% air genes at 20 vs.. 8 h (P1), 27 vs.. 20 h (P2) and 44 vs.. 27 h (P3).
Author Contributions
Conceptualization, A.N., D.C., H.A., P.d.M. and T.M.; Methodology, H.A. and T.M.; Formal Analysis, H.A.; Writing—Original Draft Preparation, H.A.; Review and Editing, A.N., D.C., H.A., P.d.M. and T.M.; Supervision and Project Administration, A.N., D.C., P.d.M.; Funding Acquisition, A.N., H.A. and P.d.M. All authors have read and agreed to the published version of the manuscript.
Funding
HA acknowledges funding from Alexander von Humboldt Foundation. TM was supported by the Federal Ministry of Education and Research (grant #031B0180). DAC and PdM acknowledge the funding support of the National Research Foundation.
Acknowledgments
We acknowledge support by Deutsche Forschungsgemeinschaft and Open Access Publishing Fund of Karlsruhe Institute of Technology.
Conflicts of Interest
The authors declare that they have no competing interests.
References
- Midilli, A.; Ay, M.; Dincer, I.; Rosen, M.A. On hydrogen and hydrogen energy strategies: I: Current status and needs. Renew. Sustain. Energy Rev. 2005, 9, 255–271. [Google Scholar] [CrossRef]
- Skinner, J.F. A spectacular demonstration: 2h2 + o2 -> 2h2o. J. Chem. Educ. 1987, 64, 545. [Google Scholar] [CrossRef]
- Nikolaidis, P.; Poullikkas, A. A comparative overview of hydrogen production processes. Renew. Sustain. Energy Rev. 2017, 67, 597–611. [Google Scholar] [CrossRef]
- Ball, M.; Weeda, M. The hydrogen economy—Vision or reality? Int. J. Hydrog. Energy 2015, 40, 7903–7919. [Google Scholar] [CrossRef]
- Kumar, G.R.; Chowdhary, N. Biotechnological and bioinformatics approaches for augmentation of biohydrogen production: A review. Renew. Sustain. Energy Rev. 2016, 56, 1194–1206. [Google Scholar] [CrossRef]
- Barnard, D.; Casanueva, A.; Tuffin, M.; Cowan, D. Extremophiles in biofuel synthesis. Environ. Technol. 2010, 31, 871–888. [Google Scholar] [CrossRef]
- Diender, M.; Stams, A.; Sousa, D. Pathways and bioenergetics of anaerobic carbon monoxide fermentation. Front. Microbiol. 2015, 6, 1275. [Google Scholar] [CrossRef]
- Oelgeschläger, E.; Rother, M. Carbon monoxide-dependent energy metabolism in anaerobic bacteria and archaea. Arch. Microbiol. 2008, 190, 257–269. [Google Scholar] [CrossRef]
- Yoneda, Y.; Yoshida, T.; Kawaichi, S.; Daifuku, T.; Takabe, K.; Sako, Y. Carboxydothermus pertinax sp. Nov., a thermophilic, hydrogenogenic, fe(iii)-reducing, sulfur-reducing carboxydotrophic bacterium from an acidic hot spring. Int. J. Syst. Evol. Microbiol. 2012, 62, 1692–1697. [Google Scholar] [CrossRef]
- Kim, S.M.; Bae, S.S.; Kim, Y.J.; Kim, T.W.; Lim, J.K.; Lee, S.H.; Choi, A.R.; Jeon, J.H.; Lee, J.-H.; Lee, H.S. Co-dependent h2 production by genetically engineered thermococcus onnurineus na1. Appl. Environ. Microbiol. 2013, 79, 2048–2053. [Google Scholar] [CrossRef]
- Sokolova, T.; Lebedinsky, A. Thermophilic microbes in environmental and industrial biotechnology. Biotechnol. Thermophiles 2013. [Google Scholar] [CrossRef]
- McMullan, G.; Christie, J.; Rahman, T.; Banat, I.; Ternan, N.; Marchant, R. Habitat, applications and genomics of the aerobic, thermophilic genus Geobacillus. Biochem. Soc. Trans. 2004, 32, 214–217. [Google Scholar] [CrossRef] [PubMed]
- Nazina, T.; Tourova, T.; Poltaraus, A.; Novikova, E.; Grigoryan, A.; Ivanova, A.; Lysenko, A.; Petrunyaka, V.; Osipov, G.; Belyaev, S. Taxonomic study of aerobic thermophilic bacilli: Descriptions of Geobacillus subterraneus gen. Nov., sp. Nov. And Geobacillus uzenensis sp. Nov. From petroleum reservoirs and transfer of Bacillus stearothermophilus, Bacillus thermocatenulatus, Bacillus thermoleovorans, Bacillus kaustophilus, Bacillus thermodenitrificans to Geobacillus as the new combinations G. stearothermophilus, g. Th. Int. J. Syst. Evol. Microbiol. 2001, 51, 433–446. [Google Scholar] [PubMed]
- Zeigler, D.R. The Geobacillus paradox: Why is a thermophilic bacterial genus so prevalent on a mesophilic planet? Microbiology 2014, 160. [Google Scholar] [CrossRef]
- Huang, Z.; Liu, X.; Zhang, S.; Liu, Z. Gh52 xylosidase from Geobacillus stearothermophilus: Characterization and introduction of xylanase activity by site-directed mutagenesis of tyr509. J. Ind. Microbiol. Biotechnol. 2014, 41, 65–74. [Google Scholar]
- Jiang, T.; Cai, M.; Huang, M.; He, H.; Lu, J.; Zhou, X.; Zhang, Y. Characterization of a thermostable raw-starch hydrolyzing α-amylase from deep-sea thermophile Geobacillus sp. Protein Expr. Purif. 2015, 114, 15–22. [Google Scholar] [CrossRef]
- Mok, S.-C.; Teh, A.-H.; Saito, J.A.; Najimudin, N.; Alam, M. Crystal structure of a compact α-amylase from Geobacillus thermoleovorans. Enzym. Microb. Technol. 2013, 53, 46–54. [Google Scholar] [CrossRef]
- Abdel-Fattah, Y.R.; Gaballa, A.A. Identification and over-expression of a thermostable lipase from geobacillus thermoleovorans toshki in Escherichia coli. Microbiol. Res. 2008, 163, 13–20. [Google Scholar] [CrossRef]
- Zhu, W.; Cha, D.; Cheng, G.; Peng, Q.; Shen, P. Purification and characterization of a thermostable protease from a newly isolated Geobacillus sp. Ymtc 1049. Enzym. Microb. Technol. 2007, 40, 1592–1597. [Google Scholar] [CrossRef]
- Christopher, L.P.; Zambare, V.P.; Zambare, A.; Kumar, H.; Malek, L. A thermo-alkaline lipase from a new thermophile Geobacillus thermodenitrificans av-5 with potential application in biodiesel production. J. Chem. Technol. Biotechnol. 2015, 90, 2007–2016. [Google Scholar] [CrossRef]
- De Maayer, P.; Brumm, P.J.; Mead, D.A.; Cowan, D.A. Comparative analysis of the Geobacillus hemicellulose utilization locus reveals a highly variable target for improved hemicellulolysis. BMC Genom. 2014, 15, 836. [Google Scholar] [CrossRef] [PubMed]
- Lin, P.P.; Rabe, K.S.; Takasumi, J.L.; Kadisch, M.; Arnold, F.H.; Liao, J.C. Isobutanol production at elevated temperatures in thermophilic Geobacillus thermoglucosidasius. Metab. Eng. 2014, 24. [Google Scholar] [CrossRef] [PubMed]
- Peeples, T.L. 10 bioremediation using extremophiles. In Microbial Biodegradation and Bioremediation; Elsevier: Amsterdam, The Netherlands, 2014; pp. 251–268. [Google Scholar]
- Mohr, T.; Aliyu, H.; Küchlin, R.; Polliack, S.; Zwick, M.; Neumann, A.; Cowan, D.; de Maayer, P. Co-dependent hydrogen production by the facultative anaerobe Parageobacillus thermoglucosidasius. Microb. Cell Factories 2018, 17, 108. [Google Scholar] [CrossRef] [PubMed]
- Mohr, T.; Aliyu, H.; Küchlin, R.; Zwick, M.; Cowan, D.; Neumann, A.; de Maayer, P. Comparative genomic analysis of Parageobacillus thermoglucosidasius strains with distinct hydrogenogenic capacities. BMC Genom. 2018, 19, 880. [Google Scholar] [CrossRef]
- Antonopoulou, G.; Ntaikou, I.; Stamatelatou, K.; Lyberatos, G. Biological and fermentative production of hydrogen. In Handbook of Biofuels Production; Elsevier: Amsterdam, The Netherlands, 2011; pp. 305–346. [Google Scholar]
- Mohr, T.; Aliyu, H.; Biebinger, L.; Gödert, R.; Hornberger, A.; Cowan, D.; de Maayer, P.; Neumann, A. Effects of different operating parameters on hydrogen production by Parageobacillus thermoglucosidasius dsm 6285. AMB Express 2019, 9, 207. [Google Scholar] [CrossRef]
- Uniprot. Uniprot: The universal protein knowledgebase. Nucleic Acids Res. 2017, 45, D158–D169. [Google Scholar] [CrossRef]
- Kanehisa, M.; Sato, Y.; Morishima, K. Blastkoala and ghostkoala: Kegg tools for functional characterization of genome and metagenome sequences. J. Mol. Biol. 2016, 428, 726–731. [Google Scholar] [CrossRef]
- Higgins, C.F. Abc transporters: Physiology, structure and mechanism—An overview. Res. Microbiol. 2001, 152, 205–210. [Google Scholar] [CrossRef]
- Murugasu-Oei, B.; Tay, A.; Dick, T. Upregulation of stress response genes and abc transporters in anaerobic stationary-phase Mycobacterium smegmatis. Mol. Gen. Genet. MGG 1999, 262, 677–682. [Google Scholar] [CrossRef]
- Pinhal, S.; Ropers, D.; Geiselmann, J.; de Jong, H. Acetate metabolism and the inhibition of bacterial growth by acetate. J. Bacteriol. 2019, 201, e00147-19. [Google Scholar] [CrossRef]
- Majewski, R.A.; Domach, M.M. Simple constrained-optimization view of acetate overflow in E. coli. Biotechnol. Bioeng. 1990, 35, 732–738. [Google Scholar] [CrossRef] [PubMed]
- Tang, Y.J.; Sapra, R.; Joyner, D.; Hazen, T.C.; Myers, S.; Reichmuth, D.; Blanch, H.; Keasling, J.D. Analysis of metabolic pathways and fluxes in a newly discovered thermophilic and ethanol-tolerant Geobacillus strain. Biotechnol. Bioeng. 2009, 102, 1377–1386. [Google Scholar] [CrossRef]
- Cypionka, H.; Meyer, O. Carbon monoxide-insensitive respiratory chain of Pseudomonas carboxydovorans. J. Bacteriol. 1983, 156, 1178–1187. [Google Scholar] [CrossRef] [PubMed]
- Wareham, L.K.; Begg, R.; Jesse, H.E.; van Beilen, J.W.A.; Ali, S.; Svistunenko, D.; McLean, S.; Hellingwerf, K.J.; Sanguinetti, G.; Poole, R.K. Carbon monoxide gas is not inert, but global, in its consequences for bacterial gene expression, iron acquisition, and antibiotic resistance. Antioxid. Redox Signal. 2016, 24, 1013–1028. [Google Scholar]
- Fang, X.; Wallqvist, A.; Reifman, J. Modeling phenotypic metabolic adaptations of Mycobacterium tuberculosis h37rv under hypoxia. PLoS Comput. Biol. 2012, 8, e1002688. [Google Scholar] [CrossRef]
- Osterman, I.A.; Dikhtyar, Y.Y.; Bogdanov, A.A.; Dontsova, O.A.; Sergiev, P.V. Regulation of flagellar gene expression in bacteria. Biochemistry (Moscow) 2015, 80, 1447–1456. [Google Scholar] [CrossRef]
- Müller-Herbst, S.; Wüstner, S.; Mühlig, A.; Eder, D.; Fuchs, T.M.; Held, C.; Ehrenreich, A.; Scherer, S. Identification of genes essential for anaerobic growth of Listeria monocytogenes. Microbiology 2014, 160, 752–765. [Google Scholar] [CrossRef]
- Cotter, P.D.; Hill, C. Surviving the acid test: Responses of gram-positive bacteria to low ph. Microbiol. Mol. Biol. Rev. 2003, 67, 429–453. [Google Scholar] [CrossRef]
- Wolfe, A.J. The acetate switch. Microbiol. Mol. Biol. Rev. 2005, 69, 12–50. [Google Scholar] [CrossRef]
- Horlbog, J.A.; Stevens, M.J.A.; Stephan, R.; Guldimann, C. Global transcriptional response of three highly acid-tolerant field strains of listeria monocytogenes to hcl stress. Microorganisms 2019, 7, 455. [Google Scholar] [CrossRef]
- Vignais, P.M.; Billoud, B. Occurrence, classification, and biological function of hydrogenases: An overview. Chem. Rev. 2007, 107, 4206–4272. [Google Scholar] [CrossRef] [PubMed]
- Greening, C.; Biswas, A.; Carere, C.R.; Jackson, C.J.; Taylor, M.C.; Stott, M.B.; Cook, G.M.; Morales, S.E. Genomic and metagenomic surveys of hydrogenase distribution indicate h 2 is a widely utilised energy source for microbial growth and survival. ISME J. 2016, 10, 761–777. [Google Scholar] [CrossRef] [PubMed]
- Merrouch, M.; Hadj-Saïd, J.; Domnik, L.; Dobbek, H.; Léger, C.; Dementin, S.; Fourmond, V. O2 inhibition of ni-containing co dehydrogenase is partly reversible. Chem. A Eur. J. 2015, 21, 18934–18938. [Google Scholar] [CrossRef] [PubMed]
- Ainala, S.K.; Seol, E.; Sekar, B.S.; Park, S. Improvement of carbon monoxide-dependent hydrogen production activity in Citrobacter amalonaticus y19 by over-expressing the co-sensing transcriptional activator, cooa. Int. J. Hydrog. Energy 2014, 39, 10417–10425. [Google Scholar] [CrossRef]
- Dutta, D.; De, D.; Chaudhuri, S.; Bhattacharya, S.K. Hydrogen production by cyanobacteria. Microb. Cell Factories 2005, 4, 36. [Google Scholar] [CrossRef] [PubMed]
- Casalot, L.; Rousset, M. Maturation of the [nife] hydrogenases. Trends Microbiol. 2001, 9, 228–237. [Google Scholar] [CrossRef]
- Jabłońska, J.; Tawfik, D.S. The number and type of oxygen-utilizing enzymes indicates aerobic vs. Anaerobic phenotype. Free Radic. Biol. Med. 2019, 140, 84–92. [Google Scholar] [CrossRef]
- Xu, J.; Ding, Z.; Liu, B.; Sophia, M.Y.; Li, J.; Zhang, Z.; Liu, Y.; Li, J.; Liu, L.; Zhou, A. Structure of the cytochrome aa3-600 heme-copper menaquinol oxidase bound to inhibitor hqno shows tm0 is part of the quinol binding site. Proc. Natl. Acad. Sci. USA 2020, 117, 872–876. [Google Scholar] [CrossRef]
- Castresana, J.; Lübben, M.; Saraste, M.; Higgins, D.G. Evolution of cytochrome oxidase, an enzyme older than atmospheric oxygen. EMBO J. 1994, 13, 2516–2525. [Google Scholar] [CrossRef]
- Winstedt, L.; von Wachenfeldt, C. Terminal Oxidases of Bacillus subtilis Strain 168: One Quinol Oxidase, Cytochromeaa 3 or Cytochrome bd, Is Required for Aerobic Growth. J. Bacteriol. 2000, 182, 6557. [Google Scholar] [CrossRef]
- Zamboni, N.; Sauer, U. Knockout of the high-coupling cytochrome aa3 oxidase reduces tca cycle fluxes in Bacillus subtilis. FEMS Microbiol. Lett. 2003, 226, 121–126. [Google Scholar] [CrossRef]
- Pesavento, C.; Becker, G.; Sommerfeldt, N.; Possling, A.; Tschowri, N.; Mehlis, A.; Hengge, R. Inverse regulatory coordination of motility and curli-mediated adhesion in escherichia coli. Genes Dev. 2008, 22, 2434–2446. [Google Scholar]
- Belas, R. Biofilms, flagella, and mechanosensing of surfaces by bacteria. Trends Microbiol. 2014, 22, 517–527. [Google Scholar] [CrossRef] [PubMed]
- Ragsdale, S.W. Life with carbon monoxide. Crit. Rev. Biochem. Mol. Biol. 2004, 39, 165–195. [Google Scholar] [CrossRef]
- Kim, J.-R.; Oh, Y.-K.; Yoon, Y.-J.; Lee, E.-Y.; Park, S. Oxygen sensitivity of carbon monoxide-dependent hydrogen production activity in citrobacter sp. J. Microbiol. Biotechnol. 2003, 13, 717–724. [Google Scholar]
- Xavier, J.C.; Preiner, M.; Martin, W.F. Something special about co-dependent co2 fixation. FEBS J. 2018, 285, 4181–4195. [Google Scholar] [CrossRef]
- Wu, J.; Zhan, M.; Chang, Y.; Gao, H.; Ye, J.; Yu, R.; Ding, Z. Mechanistic insights into stress response and metabolic activity resilience of Nitrosomonas europaea cultures to long-term ceo 2 nanoparticle exposure. Environ. Sci. Nano 2019, 6, 2215–2227. [Google Scholar] [CrossRef]
- Rossoni, A.W.; Schönknecht, G.; Lee, H.J.; Rupp, R.L.; Flachbart, S.; Mettler-Altmann, T.; Weber, A.P.M.; Eisenhut, M. Cold acclimation of the thermoacidophilic red alga Galdieria sulphuraria: Changes in gene expression and involvement of horizontally acquired genes. Plant Cell Physiol. 2018, 60, 702–712. [Google Scholar] [CrossRef]
- Jones, P.G.; Inouye, M. The cold-shock response—A hot topic. Mol. Microbiol. 1994, 11, 811–818. [Google Scholar] [CrossRef]
- Tai, S.L.; Daran-Lapujade, P.; Walsh, M.C.; Pronk, J.T.; Daran, J.-M. Acclimation of Saccharomyces cerevisiae to low temperature: A chemostat-based transcriptome analysis. Mol. Biol. Cell 2007, 18, 5100–5112. [Google Scholar] [CrossRef]
- Singleton, C.; Gilman, J.; Rollit, J.; Zhang, K.; Parker, D.A.; Love, J. A design of experiments approach for the rapid formulation of a chemically defined medium for metabolic profiling of industrially important microbes. PLoS ONE 2019, 14, e0218208. [Google Scholar] [CrossRef] [PubMed]
- Johnson, B.K.; Scholz, M.B.; Teal, T.K.; Abramovitch, R.B. Sparta: Simple program for automated reference-based bacterial rna-seq transcriptome analysis. BMC Bioinform. 2016, 17, 66. [Google Scholar] [CrossRef] [PubMed]
- Bolger, A.M.; Lohse, M.; Usadel, B. Trimmomatic: A flexible trimmer for illumina sequence data. Bioinformatics 2014, 30, 2114–2120. [Google Scholar] [CrossRef]
- Andrews, S. Fastqc: A Quality Control Tool for High Throughput Sequence Data; Babraham Bioinformatics, Babraham Institute: Cambridge, UK, 2010. [Google Scholar]
- Langmead, B. Aligning short sequencing reads with bowtie. Curr. Protoc. Bioinform. 2010, 32, 11.7.1–11.7.14. [Google Scholar] [CrossRef] [PubMed]
- Anders, S.; Pyl, P.T.; Huber, W. Htseq—A python framework to work with high-throughput sequencing data. Bioinformatics 2015, 31, 166–169. [Google Scholar] [CrossRef] [PubMed]
- Robinson, M.D.; McCarthy, D.J.; Smyth, G.K. Edger: A bioconductor package for differential expression analysis of digital gene expression data. Bioinformatics 2010, 26, 139–140. [Google Scholar] [CrossRef] [PubMed]
- McDowell, I.C.; Manandhar, D.; Vockley, C.M.; Schmid, A.K.; Reddy, T.E.; Engelhardt, B.E. Clustering gene expression time series data using an infinite gaussian process mixture model. PLoS Comput. Biol. 2018, 14, e1005896. [Google Scholar] [CrossRef]
- Zheng, Q.; Wang, X.-J. Goeast: A web-based software toolkit for gene ontology enrichment analysis. Nucleic Acids Res. 2008, 36, W358–W363. [Google Scholar] [CrossRef]
- Luo, W.; Pant, G.; Bhavnasi, Y.K.; Blanchard, S.G., Jr.; Brouwer, C. Pathview web: User friendly pathway visualization and data integration. Nucleic Acids Res. 2017, 45, W501–W508. [Google Scholar] [CrossRef]
- Hammer-Muntz, O.; Harper, D.; Ryan, P. Past: Paleontological statistics software package for education and data analysis version 3.26. 2001. Available online: https://palaeo-electronica.org/2001_1/past/issue1_01.htm (accessed on 20 May 2020).


© 2020 by the authors. Licensee MDPI, Basel, Switzerland. This article is an open access article distributed under the terms and conditions of the Creative Commons Attribution (CC BY) license (http://creativecommons.org/licenses/by/4.0/).