Transglutaminase 2 Has Metabolic and Vascular Regulatory Functions Revealed by In Vivo Activation of Alpha1-Adrenergic Receptor


 and
and 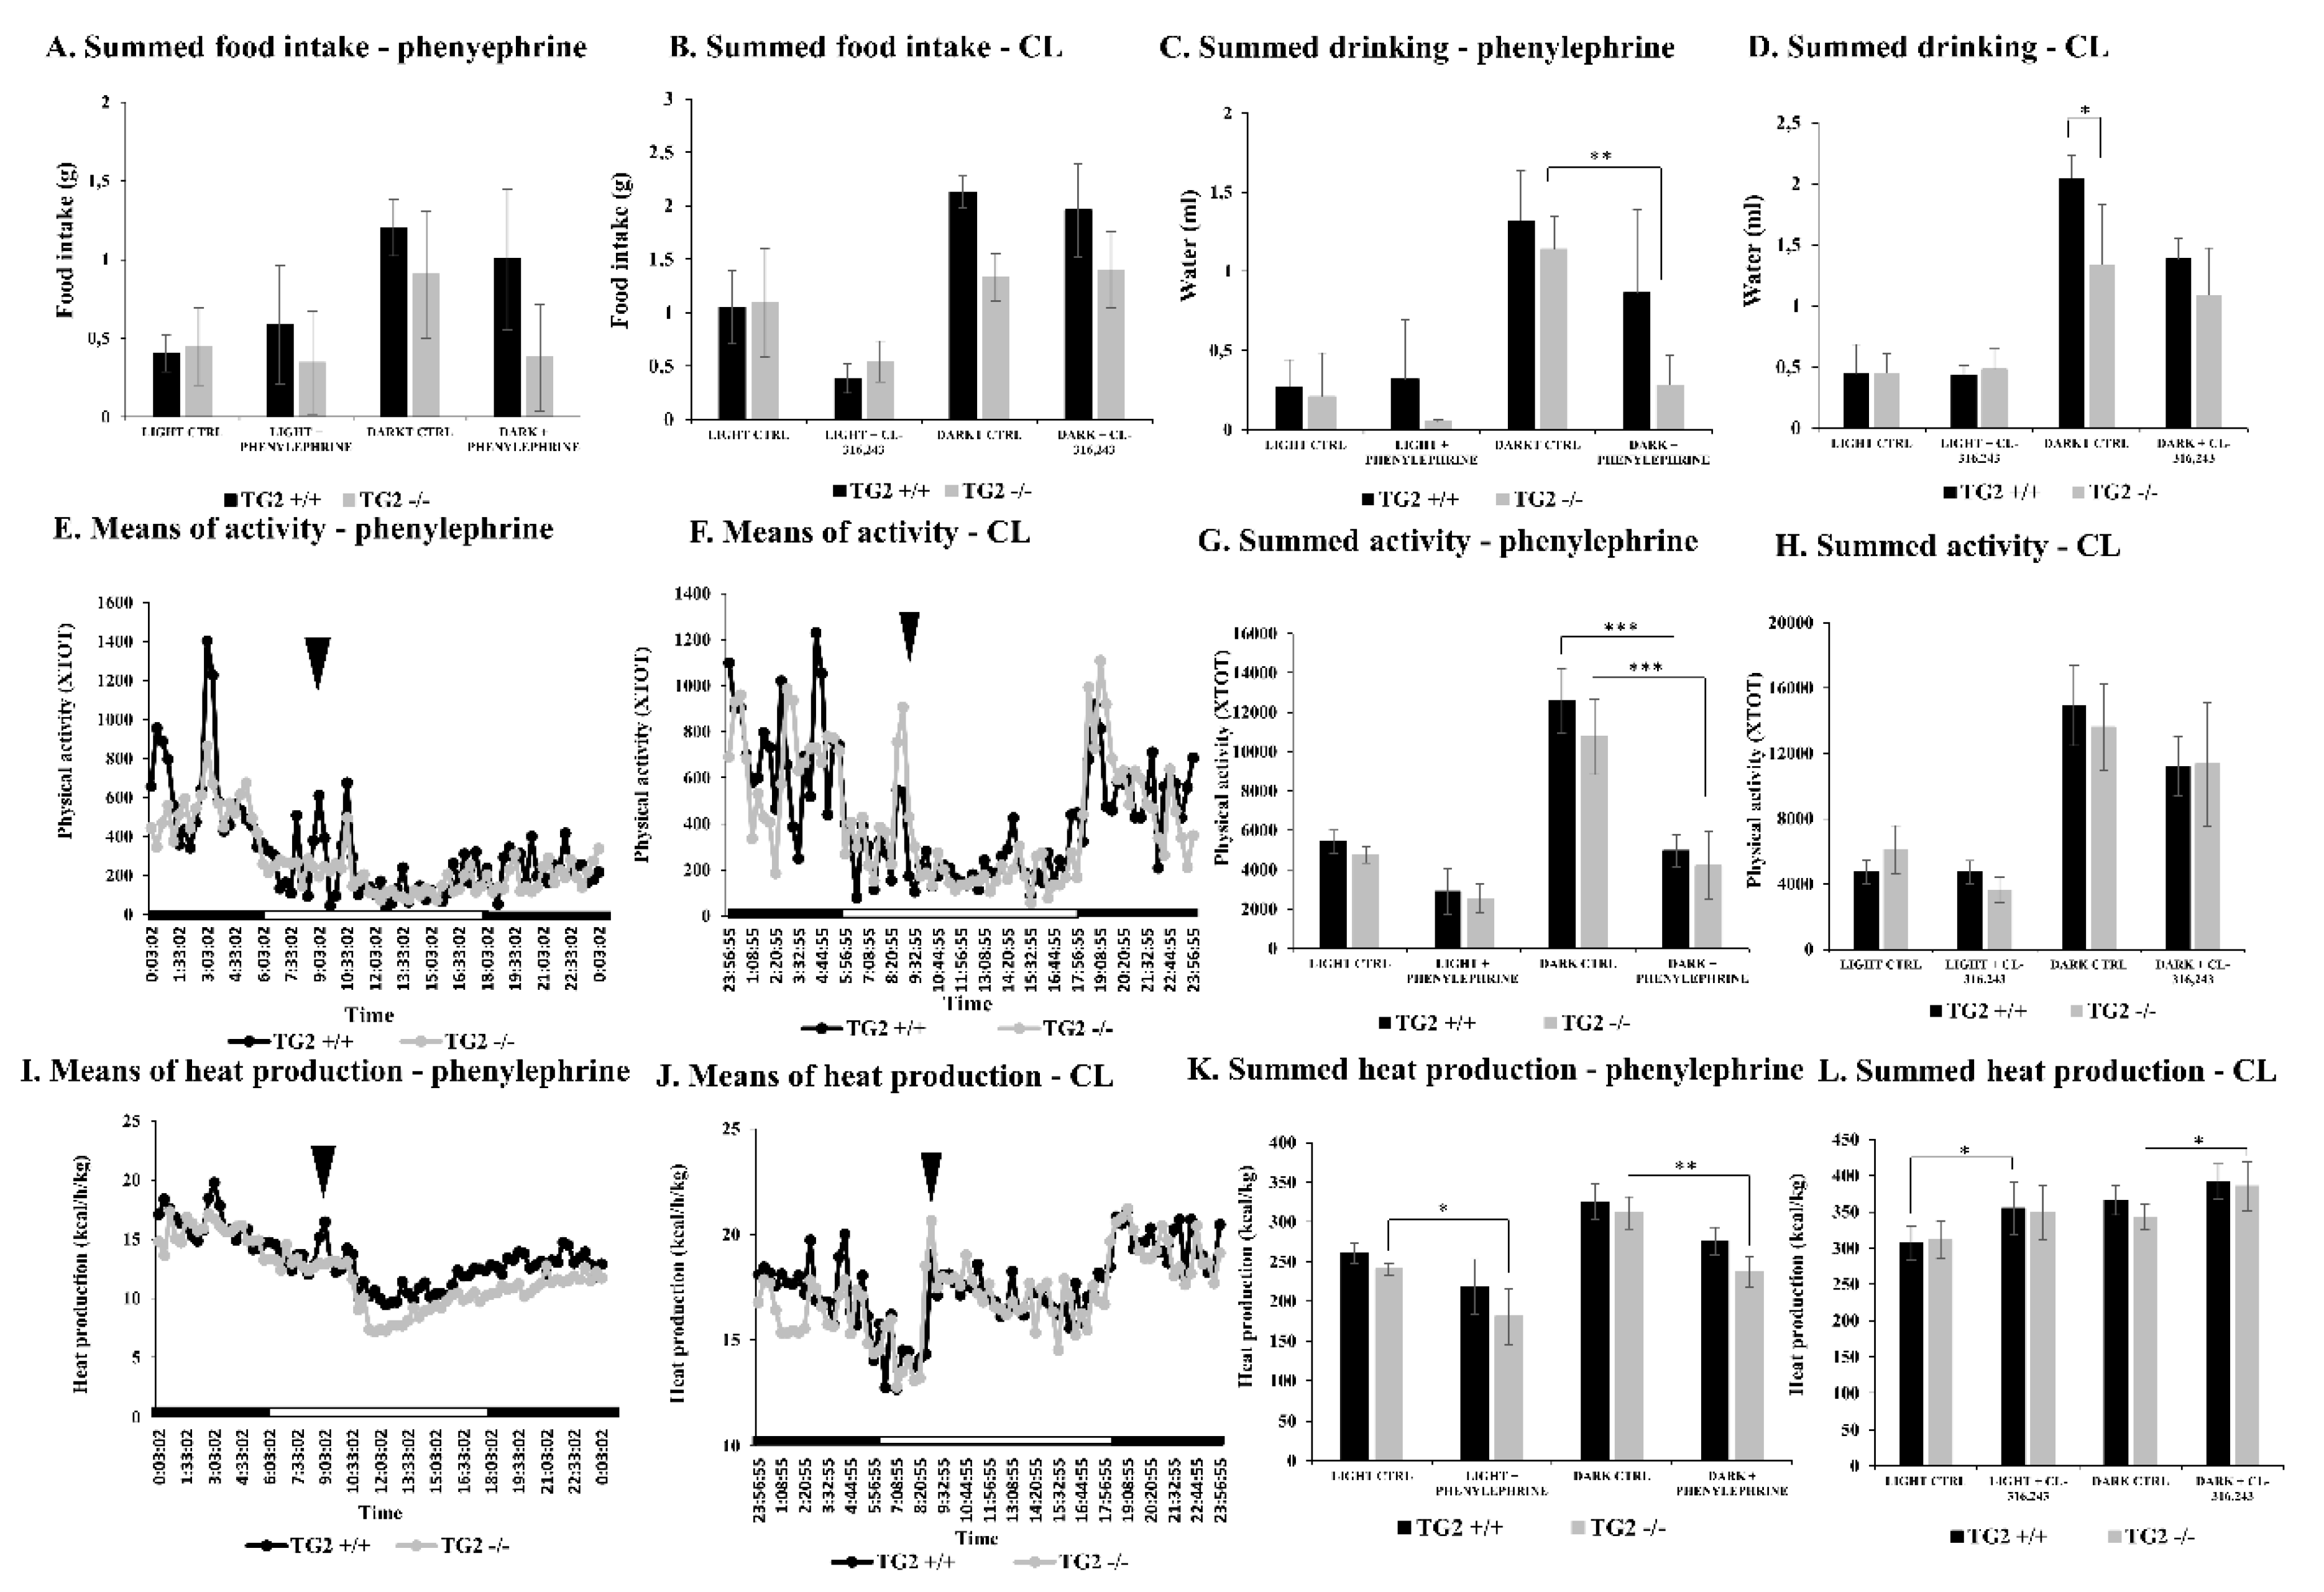
Abstract
1. Introduction
2. Results
2.1. Alpha1 But Not Beta3 AR Agonist Treatment Leads to Decreased Physical Activity in Both TG2+/+ and TG2-/- Mice
2.2. Alpha1 But Not Beta3-AR Agonist Treatment Results in a Decrease of the Respiratory Exchange Ratio in TG2-/- Mice Compared to TG2+/+ Animals
2.3. Alpha1-AR Agonist Treatment Results in Lower Blood Lactate Levels in TG2-/- Mice
2.4. Alpha1-AR Agonist Has a Lowering Effect on Tail Blood Pressure of TG2+/+ But Not TG2-/- Mice
2.5. Alpha1-AR Agonist Evokes a Higher Level of Tissue Damages Monitored by Lactate Dehydrogenase (LDH) Release in TG2+/+ than in TG2-/- Mice
3. Discussion
4. Materials and Methods
4.1. Materials
4.2. Mice, Treatments and Obtained Samples
4.3. Indirect Calorimetry
4.4. Blood Pressure Measurement
4.5. Detection of Blood Metabolic Parameters
4.6. Detection of LDH and CK-MB
4.7. Statistical Analyses
5. Conclusions
Author Contributions
Funding
Acknowledgments
Conflicts of Interest
Abbreviations
| AC | adenylyl cyclase |
| ACC | acetyl-CoA carboxylase |
| AMPK | AMP-activated protein kinase |
| AR | adrenoreceptor |
| BP | blood pressure |
| C | total cholesterol |
| CK-MB | creatine kinase isoenzyme |
| CL | CL-316,243 |
| CLAMS | Comprehensive Lab Animal Monitoring System |
| CPT1 | carnitine palmitoyltransferase 1 |
| FFA | free fatty acid |
| GPCR | G-protein-coupled receptor |
| GTP | guanosine-triphosphate |
| HDL | high-density lipoprotein |
| HR | heart rate |
| IFCC | International Federation of Clinical Chemistry and Laboratory Medicine |
| KO | knock-out |
| LDH | lactate dehydrogenase |
| LDL | low-density lipoprotein |
| PLCδ1 | phospholipase Cδ1 |
| RER | respiratory exchange ratio |
| TBP | tail blood pressure |
| TG | triglyceride |
| TG2 | tissue transglutaminase |
| VCO2 | carbon dioxide production |
| VO2 | oxygen consumption |
| VPR | volume pressure recording |
| WT | wild type |
| XTOT | total X plane cage movements |
References
- Eckert, R.L.; Kaartinen, M.T.; Nurminskaya, M.; Belkin, A.M.; Colak, G.; Johnson, G.V.; Mehta, K. Transglutaminase regulation of cell function. Physiol. Rev. 2014, 94, 383–417. [Google Scholar] [CrossRef] [PubMed]
- Fesus, L.; Piacentini, M. Transglutaminase 2: An enigmatic enzyme with diverse functions. Trends Biochem. Sci. 2002, 10, 534–539. [Google Scholar] [CrossRef]
- Katt, W.P.; Antonyak, M.A.; Cerione, R.A. Opening up about tissue transglutaminase: When conformation matters more than enzymatic activity. Med. One 2018, 3, e180011. [Google Scholar] [PubMed]
- Folk, J.E.; Finlayson, J.S. The epsilon-(gamma-glutamyl) lysine crosslink and the catalytic role of transglutaminases. In Advances in Protein Chemistry; Academic Press: Cambridge, MA, USA, 1977; Volume 31, pp. 1–133. [Google Scholar]
- Lee, K.N.; Birckbichler, P.J.; Patterson, M.K. GTP hydrolysis by guinea pig liver transglutaminase. Biochem. Biophys. Res. Commun. 1989, 162, 1370–1375. [Google Scholar] [CrossRef]
- Datta, S.; Antonyak, M.A.; Cerione, R.A. GTP-binding-defective forms of tissue transglutaminase trigger cell death. Biochemistry 2007, 46, 14819–14829. [Google Scholar] [CrossRef] [PubMed][Green Version]
- Pinkas, D.M.; Strop, P.; Brunger, A.T.; Khosla, C. Transglutaminase 2 undergoes a large conformational change upon activation. PLoS Biol. 2007, 5, e327. [Google Scholar] [CrossRef]
- Gundemir, S.; Colak, G.; Tucholski, J.; Johnson, G.V. Transglutaminase 2: A molecular Swiss army knife. Biochim. Biophys. Acta 2012, 1823, 406–419. [Google Scholar] [CrossRef]
- Hasegawa, G.; Suwa, V.; Ichikawa, Y.; Ohtsuka, T.; Kumagai, S.; Kikuchi, M.; Sato, Y.; Saito, Y. A novel function of tissue-type transglutaminase: Protein disulphide isomerase. Biochem. J. 2003, 373, 793–803. [Google Scholar] [CrossRef]
- Mishra, S.; Saleh, A.; Espino, P.S.; Davie, J.R.; Murphy, L.J. Phosphorylation of histones by tissue transglutaminase. J. Biol. Chem. 2006, 281, 5532–5538. [Google Scholar] [CrossRef]
- Mishra, S.; Murphy, L.J. The p53 oncoprotein is a substrate for tissue transglutaminase kinase activity. Biochem. Biophys. Res. Commun. 2006, 339, 726–730. [Google Scholar] [CrossRef]
- Kiraly, R.; Thangaraju, K.; Nagy, Z.; Collighan, R.; Nemes, Z.; Griffin, M.; Fesüs, L. Isopeptidase activity of human transglutaminase 2: Disconnection from transamidation and characterization by kinetic parameters. Amino Acids 2016, 48, 31–40. [Google Scholar] [CrossRef] [PubMed]
- Iismaa, S.E.; Mearns, B.M.; Lorand, L.; Graham, R.M. Transglutaminases and disease: Lessons from genetically engineered mouse models and inherited disorders. Physiol. Rev. 2009, 89, 991–1023. [Google Scholar] [CrossRef] [PubMed]
- Wang, Z.; Griffin, M. TG2, a novel extracellular protein with multiple functions. Amino Acids 2012, 42, 939–949. [Google Scholar] [CrossRef] [PubMed]
- Lesort, M.; Attanavanich, K.; Zhang, J.; Johnson, G.V. Distinct nuclear localization and activity of tissue transglutaminase. J. Biol. Chem. 1998, 273, 11991–11994. [Google Scholar] [CrossRef]
- Muma, N.A. Transglutaminase in receptor and neurotransmitter-regulated functions. Med. One 2018, 3, e180012. [Google Scholar]
- Szondy, Z.; Korponay-Szabó, I.; Király, R.; Sarang, Z.; Tsay, G.J. Transglutaminase 2 in human diseases. Biomedicine 2017, 7, 15. [Google Scholar] [CrossRef]
- Mangala, L.S.; Mehta, K. Tissue transglutaminase (TG2) in cancer biology. Prog. Exp. Tumor Res. 2005, 38, 125–138. [Google Scholar]
- Johnson, T.S.; Knight CR, L.; El-Alaoui, S.; Mian, S.; Rees, R.C.; Gentile, V.; Davies, P.J.A.; Griffin, M. Transfection of tissue transglutaminase into a highly malignant hamster fibrosarcoma leads to a reduced incidence of primary tumour growth. Oncogene 1994, 9, 2935–2942. [Google Scholar]
- Mehta, K.; Kumar, A.; Kim, H.I. Transglutaminase 2: A multi-tasking protein in the complex circuitry of inflammation and cancer. Biochem. Pharmacol. 2010, 80, 1921–1929. [Google Scholar]
- Mangala, L.S.; Fok, J.Y.; Zorrilla-Calancha, I.R.; Verma, A.; Mehta, K. Tissue transglutaminase expression promotes cell attachment, invasion and survival in breast cancer cells. Oncogene 2007, 26, 2459–2470. [Google Scholar] [CrossRef]
- Porzio, O.; Massa, O.; Cunsolo, V.; Colombo, C.; Malaponti, M.; Bertuzzi, F.; Hansen, T.; Johansen, A.; Pedersen, O.; Meschi, F.; et al. Missense mutations in theTGM2 gene encoding transglutaminase 2 are found in patients with early-onset type 2 diabetes. Hum. Mutat. 2007, 28, 1150. [Google Scholar] [CrossRef] [PubMed]
- Ishizawa, T.; Mattila, P.; Davies, P.; Wang, D.; Dickson, D.W. Colocalization of tau and alpha-synuclein epitopes in Lewy bodies. J. Neuropathol. Exp. Neurol. 2003, 62, 389–397. [Google Scholar] [CrossRef] [PubMed]
- Wang, W.X.; Rajeev, B.W.; Stromberg, A.J.; Ren, N.; Tang, G.; Huang, Q.; Rigoutsos, I.; Nelson, P.T. The expression of microRNA miR-107 decreases early in Alzheimer’s disease and may accelerate disease progression through regulation of beta-site amyloid precursor protein-cleaving enzyme 1. J. Neurosci. 2008, 28, 1213–1223. [Google Scholar] [PubMed]
- Dudek, S.M.; Johnson, G.V.W. Transglutaminase facilitates the formation of polymers of the beta-amyloid peptide. Brain Res. 1994, 651, 129–133. [Google Scholar] [CrossRef]
- Norlund, M.A.; Lee, J.M.; Zainelli, G.M.; Muma, N.A. Elevated transglutaminase-induced bonds in PHF tau in Alzheimer’s disease. Brain Res. 1999, 851, 154–163. [Google Scholar] [CrossRef]
- Dieterich, W.; Ehnis, T.; Bauer, M.; Donner, P.; Volta, U.; Riecken, E.O.; Schuppan, D. Identification of tissue transglutaminase as the autoantigen of celiac disease. Nat. Med. 1997, 3, 797–801. [Google Scholar] [CrossRef]
- Nakaoka, H.; Perez, D.M.; Baek, K.J.; Das, T.; Husain, A.; Misono, K.; Im, M.J.; Graham, R.M. Gh: A GTP binding protein with transglutaminase activity and receptor signaling function. Science 1994, 254, 1593–1596. [Google Scholar] [CrossRef]
- Feng, J.F.; Rhee, S.G.; Im, M.J. Evidence that phospholipase delta-1 is the effector in the Gh (transglutaminase II)-mediated signalling. J. Biol. Chem. 1996, 271, 16451–16454. [Google Scholar]
- Baek, K.J.; Das, T.; Gray, C.D.; Desai, S.; Hwang, K.C.; Gacchui, R.; Ludwig, M.; Im, M.J. A 50 KDa protein modulates guanine nucleotide binding of transglutaminase II. Biochemistry 1996, 35, 2651–2657. [Google Scholar]
- Park, H.; Won, J.H.; Han, K.J.; Suh, P.G.; Ryu, S.H.; Lee, H.S.; Yun, H.-Y.; Kwon, N.S.; Baek, K.J. Phospholipase C-δ1 and oxytocin receptor signaling: Evidence of its role as an effector. Biochem. J. 1998, 331, 283–289. [Google Scholar]
- Vezza, R.; Habib, A.; FitzGerald, G.A. Differential signaling by the thromboxane receptor isoforms via the novel GTP-binding protein, Gh. J. Biol. Chem. 1999, 274, 12774–12779. [Google Scholar] [CrossRef]
- Lin, Y.F.; Tseng, M.J.; Hsu, H.L.; Wu, Y.W.; Lee, Y.H.; Tsai, Y.H. A novel follicle-stimulating hormone-induced Gh/phospholipase C-1 signaling pathway mediating rat Sertoli cell Ca2+-influx. Mol. Endocrinol. 2006, 20, 2514–2527. [Google Scholar] [CrossRef] [PubMed]
- Feng, J.F.; Grays, C.; Im, M.J. alpha1B–adrenoreceptor interacts with multiple sites of transglutaminase II: Characteristics of the interaction in binding and activation. Biochemistry 1999, 38, 10743–10749. [Google Scholar] [PubMed]
- Griffin, M.; Casadio, R.; Bergamini, C.M. Transglutaminases: Nature’s biological glues. Biochem. J. 2002, 368, 377–396. [Google Scholar] [CrossRef]
- Kim, S.-Y.; Jeitner, T.M.; Steinert, P.M. Transglutaminases in disease. Neurochem. Int. 2002, 40, 85–103. [Google Scholar] [CrossRef]
- Lorand, L.; Graham, R.M. Transglutaminases: Crosslinking enzymes with pleiotropic functions. Nat. Rev. Mol. Cell. Biol. 2003, 4, 140–156. [Google Scholar]
- Gentile, V.; Porta, R.; Chiosi, E.; Spina, A.; Valente, F.; Pezone, R.; Davies, P.J.; Alaadik, A.; Illiano, G. Tissue transglutaminase and adenylate cyclase interactions in Balb-C 3T3 fibroblast membranes. Biochim. Biophys. Acta 1997, 1357, 115–122. [Google Scholar] [CrossRef]
- Lee, M.-Y.; Chung, S.; Bang, H.-W.; Baek, K.-J.; Uhm, D.-Y. Modulation of large conductance Ca2+-activated K+ channel by Gah (transglutaminase II) in the vascular smooth muscle cell. Eur. J. Physiol. 1997, 433, 671–673. [Google Scholar] [CrossRef]
- Song, M.; Hwang, H.; Im, C.Y.; Kim, S.Y. Recent progress in the development of transglutaminase 2 (TGase2) inhibitors. J. Med. Chem. 2017, 60, 554–567. [Google Scholar] [CrossRef]
- Keillor, J.W.; Apperley, K.Y. Transglutaminase inhibitors: A patent review. Expert Opin. Ther. Pat. 2016, 26, 49–63. [Google Scholar]
- Facchiano, A.; Facchiano, F. Transglutaminases and their substrates in biology and human diseases: 50 years of growing. Amino Acids 2009, 36, 599–614. [Google Scholar] [CrossRef] [PubMed]
- Csosz, E.; Mesko, B.; Fésüs, L. Transdab wiki: The interactive transglutaminase substrate database on web 2.0 surface. Amino Acids 2009, 36, 615–617. [Google Scholar] [PubMed]
- De Laurenzi, V.; Melino, G. Gene disruption of tissue transglutaminase. Mol. Cell. Biol. 2001, 21, 148–155. [Google Scholar] [CrossRef] [PubMed]
- Nanda, N.; Iismaa, S.E.; Owens, W.A.; Husain, A.; Mackay, F.; Graham, R.M. Targeted inactivation of Gh/tissue transglutaminase II. J. Biol. Chem. 2001, 276, 20673–20678. [Google Scholar] [PubMed]
- Sarang, Z.; Madi, A.; Koy, C.; Varga, S.; Glocker, M.O.; Ucker, D.S.; Kuchay, S.; Chishti, A.H.; Melino, G.; Fesus, L.; et al. Tissue transglutaminase (TG2) facilitates phosphatidylserine exposure and calpain activity in calcium-induced death of erythrocytes. Cell Death Differ. 2007, 14, 1842–1844. [Google Scholar]
- Szondy, Z.; Sarang, Z.; Molnar, P.; Nemeth, T.; Piacentini, M.; Mastroberardino, P.G.; Falasca, L.; Aeschlimann, D.; Kovacs, J.; Kiss, I.; et al. Transglutaminase 2−/− mice reveal a phagocytosis-associated crosstalk between macrophages and apoptotic cells. Proc. Natl. Acad. Sci. USA 2003, 100, 7812–7817. [Google Scholar] [CrossRef]
- Tóth, B.; Garabuczi, E.; Sarang, Z.; Vereb, G.; Vámosi, G.; Aeschlimann, D.; Blaskó, B.; Bécsi, B.; Erdõdi, F.; Lacy-Hulbert, A.; et al. Transglutaminase 2 is needed for the formation of an efficient phagocyte portal in macrophages engulfing apoptotic cells. J. Immunol. 2009, 82, 2084–2092. [Google Scholar]
- Balajthy, Z.; Csomós, K.; Vámosi, G.; Szántó, A.; Lanotte, M.; Fésüs, L. Tissue-transglutaminase contributes to neutrophil granulocyte differentiation and functions. Blood 2006, 108, 2045–2054. [Google Scholar] [CrossRef]
- Csomos, K.; Nemet, I.; Fesus, L.; Balajthy, Z. Tissue transglutaminase contributes to the all-trans-retinoic acid-induced differentiation syndrome phenotype in the NB4 model of acute promyelocytic leukemia. Blood 2010, 116, 3933–3943. [Google Scholar] [CrossRef]
- Sarang, Z.; Tóth, B.; Balajthy, Z.; Köröskényi, K.; Garabuczi, E.; Fésüs, L.; Szondy, Z. Some lessons from the tissue transglutaminase knockout mouse. Amino Acids 2009, 36, 625–631. [Google Scholar] [CrossRef]
- Sarang, Z.; Köröskényi, K.; Pallai, A.; Duro, E.; Melino, G.; Griffin, M.; Fesus, L.; Szondy, Z. Transglutaminase 2 null macrophages respond to lipopolysaccharide stimulation by elevated proinflammatory cytokine production due to an enhanced αvβ3 integrin-induced Src tyrosine kinase signaling. Immunol. Lett. 2011, 138, 71–78. [Google Scholar] [PubMed]
- Bernassola, F.; Federici, M.; Corazzari, M.; Terrinoni, A.; Hribal, M.L.; De Laurenzi, V.; Ranalli, M.; Massa, O.; Sesti, G.; McLean, W.H.; et al. Role of transglutaminase 2 in glucose tolerance: Knockout mice studies and a putative mutation in a MODY patient. FASEB J. 2002, 16, 1371–1378. [Google Scholar] [PubMed]
- Mádi, A.; Cuaranta-Monroy, I.; Lénárt, K.; Pap, A.; Mezei, Z.A.; Kristóf, E.; Oláh, A.; Vámosi, G.; Bacsó, Z.; Bai, P.; et al. Browning deficiency and low mobilization of fatty acids in gonadal white adipose tissue leads to decreased cold tolerance of transglutaminase 2 knock-out mice. Biochim. Biophys. Acta Mol. Cell Biol. Lipids 2017, 1862, 1575–1586. [Google Scholar] [CrossRef] [PubMed]
- Wang, Q.A.; Tao, C.; Gupta, R.K.; Scherer, P.E. Tracking adipogenesis during white adipose tissue development, expansion and regeneration. Nat. Med. 2013, 19, 1338–1344. [Google Scholar] [CrossRef] [PubMed]
- Ye, L.; Kleiner, S.; Wu, J.; Sah, R.; Gupta, R.K.; Banks, A.S.; Cohen, P.; Khandekar, M.J.; Boström, P.; Mepani, R.J.; et al. TRPV4 is a regulator of adipose oxidative metabolism, inflammation, and energy homeostasis. Cell 2012, 151, 96–110. [Google Scholar] [CrossRef]
- Taguchi, K.; Yang, M.; Goepel, M.; Michel, M.C. Comparison of human alpha1-adrenoceptor subtype coupling to protein kinase C activation and related signalling pathways. Naunyn Schmiedebergs Arch Pharmacol. 1998, 357, 100–110. [Google Scholar] [CrossRef]
- Nurminskaya, M.V.; Belkin, A.M. Cellular functions of tissue transglutaminase. In International Review of Cell and Molecular Biology; Academic Press: Cambridge, MA, USA, 2012; Volume 294, pp. 1–97. [Google Scholar]
- Siegl, P.K.; McNeill, J.H. Comparison of the alpha-adrenergic agonists, phenylephrine and methoxamine in rabbit papillary muscles. Res. Commun. Chem. Pathol. Pharmacol. 1980, 30, 221–231. [Google Scholar] [PubMed]
- Bloom, J.D.; Dutia, M.D.; Johnson, B.D.; Wissner, A.; Burns, M.G.; Largis, E.E.; Dolan, J.A.; Claus, T.H. Disodium (R,R)-5-[2-[[2-(3-Chlorophenyl)-2-hydroxymethyl]-amino]propyl]-1,3-benzodioxole-2,2-dicarboxylate (CL 316,243). A potent β-adrenergic agonist virtually specific for β3-adrenoceptors. A promising antidiabetic and antiobesity agent. J. Med. Chem. 1992, 35, 3081–3084. [Google Scholar] [CrossRef]
- Ueta, C.B.; Olivares, E.L.; Bianco, A.C. Responsiveness to thyroid hormone and to ambient temperature underlies differences between brown adipose tissue and skeletal muscle thermogenesis in a mouse model of diet-induced obesity. Endocrinology 2011, 152, 3571–3581. [Google Scholar] [CrossRef][Green Version]
- Ahlquist, R.P. Present state of alpha and beta-adrenergic drugs. II. The adrenergic blocking agents. Am. Heart J. 1976, 92, 804–807. [Google Scholar]
- Chen, Z.J.; Minneman, K.P. Recent progress in alpha1-adrenergic receptor research. Acta Pharmacol. Sin. 2005, 26, 1281–1287. [Google Scholar] [CrossRef]
- Chen, S.; Lin, F.; Iismaa, S.; Lee, K.N.; Birckbichler, P.J.; Graham, R.M. Alpha1-adrenergic receptor signaling via Gh is subtype-specific and independent of its transglutaminase activity. J. Biol. Chem. 1996, 271, 32385–32391. [Google Scholar] [CrossRef] [PubMed][Green Version]
- Simonson, D.C.; DeFronzo, R.A. Indirect calorimetry: Methodological and interpretative problems. Am. J. Physiol. 1990, 258, E399–E412. [Google Scholar] [CrossRef] [PubMed]
- Shi, T.; Papay, R.S.; Perez, D.M. The role of α1-adrenergic receptors in regulating metabolism: Increased glucose tolerance, leptin secretion and lipid oxidation. J. Recept. Signal. Transduct. Res. 2017, 37, 124–132. [Google Scholar] [CrossRef] [PubMed]
- Ferrer-Lorente, R.; Cabot, C.; Fernández-López, J.A.; Alemany, M. Combined effects of oleoyl-estrone and a beta3-adrenergic agonist (CL316,243) on lipid stores of diet-induced overweight male Wistar rats. Life Sci. 2005, 77, 2051–2058. [Google Scholar] [CrossRef]
- Blaak, E.E.; Van Baak, M.A.; Kemerink, G.J.; Pakbiers, M.T.; Heidendal, G.A.; Saris, W.H. Beta-Adrenergic stimulation of skeletal muscle metabolism in relation to weight reduction in obese men. Am. J. Physiol. 1994, 267, 316–322. [Google Scholar] [CrossRef] [PubMed]
- Rosen, E.D.; Spiegelman, B.M. What we talk about when we talk about fat. Cell 2014, 156, 20–44. [Google Scholar] [CrossRef]
- Ballou, L.M.; Tian, P.Y.; Lin, H.Y.; Jiang, Y.P.; Lin, R.Z. Dual regulation of glycogen synthase kinase-3beta by the alpha1A-adrenergic receptor. J. Biol. Chem. 2001, 276, 40910–40916. [Google Scholar] [CrossRef]
- Burcelin, R.; Uldry, M.; Foretz, M.; Perrin, C.; Dacosta, A.; Nenniger-Tosato, M.; Seydoux, J.; Cotecchia, S.; Thorens, B. Impaired glucose homeostasis in mice lacking the alpha1b-adrenergic receptor subtype. J. Biol. Chem. 2004, 279, 1108–1115. [Google Scholar] [CrossRef]
- Sánchez-Andrés, J.V.; Gomis, A.; Valdeolmillos, M. The electrical activity of mouse pancreatic beta-cells recorded in vivo shows glucose-dependent oscillations. J. Physiol. 1995, 486, 223–228. [Google Scholar] [CrossRef]
- Skoglund, G.; Lundquist, I.; Ahrén, B. Alpha 1- and alpha 2-adrenoceptor activation increases plasma glucagon levels in the mouse. Eur. J. Pharmacol. 1987, 143, 83–88. [Google Scholar] [CrossRef]
- Gelotte, C.K.; Zimmerman, B.A. Pharmacokinetics, safety, and cardiovascular tolerability of phenylephrine HCl 10, 20, and 30 mg after a single oral administration in healthy volunteers. Clin. Drug Investig. 2015, 35, 547–558. [Google Scholar] [CrossRef] [PubMed]
- Raffel, D.M.; Corbett, J.R.; del Rosario, R.B.; Gildersleeve, D.L.; Chiao, P.C.; Schwaiger, M.; Wieland, D.M. Clinical evaluation of carbon-11-phenylephrine: MAO-sensitive marker of cardiac sympathetic neurons. J. Nucl. Med. 1996, 37, 1923–1931. [Google Scholar] [PubMed]
- Minokoshi, Y.; Kim, Y.B.; Peroni, O.D.; Fryer, L.G.; Müller, C.; Carling, D.; Kahn, B.B. Leptin stimulates fatty-acid oxidation by activating AMP-activated protein kinase. Nature 2002, 415, 339–343. [Google Scholar] [CrossRef] [PubMed]
- Minokoshi, Y.; Toda, C.; Okamoto, S. Regulatory role of leptin in glucose and lipid metabolism in skeletal muscle. Indian J. Endocrinol. Metab. 2012, 16 (Suppl. 3), S562–S568. [Google Scholar] [CrossRef]
- Cooper, B.E. Review and update on inotropes and vasopressors. AACN Adv. Crit. Care 2008, 19, 5–13. [Google Scholar]
- Motta, M.M.; Coblentz, J.; Fernandes, B.F.; Burnier, M.N. Mydriatic and cardiovascular effects of phenylephrine 2.5% versus phenylephrine 10%, both associated with tropicamide 1%. Ophthalmic Res. 2009, 42, 87–89. [Google Scholar] [CrossRef]
- Dubroca, C.; Lacombe, P.; Domenga, V.; Maciazek, J.; Levy, B.; Tournier-Lasserve, E.; Joutel, A.; Henrion, D. Impaired vascular mechanotransduction in a transgenic mouse model of CADASIL arteriopathy. Stroke 2005, 36, 113–117. [Google Scholar] [CrossRef]
- Cavalli, A.; Lattion, A.L.; Hummler, E.; Nenniger, M.; Pedrazzini, T.; Aubert, J.F.; Michel, M.C.; Yang, M.; Lembo, G.; Vecchione, C.; et al. Decreased blood pressure response in mice deficient of the alpha1b-adrenergic receptor. Proc. Natl. Acad. Sci. USA 1997, 94, 11589–11594. [Google Scholar] [CrossRef]
- Baek, K.J.; Kang, S.; Damron, D.; Im, M. Phospholipase C delta1 is a guanine nucleotide exchanging factor for transglutaminase II (Galpha h) and promotes alpha 1B-adrenoreceptor-mediated GTP binding and intracellular calcium release. J. Biol. Chem. 2001, 276, 5591–5597. [Google Scholar] [CrossRef]
- Kang, S.K.; Kim, D.K.; Damron, D.S.; Baek, K.J.; Im, M.J. Modulation of intracellular Ca2+ via alpha(1B)-adrenoreceptor signaling molecules, G alpha(h) (transglutaminase II) and phospholipase C-delta 1. Biochem. Biophys. Res. Commun. 2002, 293, 383–390. [Google Scholar] [CrossRef]
- Kang, S.K.; Yi, K.S.; Kwon, N.S.; Park, K.H.; Kim, U.H.; Baek, K.J.; Im, M.J. Alpha1B-adrenoceptor signaling and cell motility: GTPase function of Gh/transglutaminase 2 inhibits cell migration through interaction with cytoplasmic tail of integrin alpha subunits. J. Biol. Chem. 2004, 279, 36593–36600. [Google Scholar] [CrossRef]
- Steppan, J.; Bergman, Y.; Viegas, K.; Armstrong, D.; Tan, S.; Wang, H.; Melucci, S.; Hori, D.; Park, S.Y.; Barreto, S.F.; et al. Tissue transglutaminase modulates vascular stiffness and function through crosslinking-dependent and crosslinking-independent functions. J. Am. Heart Assoc. 2017, 6, e004161. [Google Scholar] [PubMed]
- Burd, J.F.; Usategui-Gomez, M. A colorimetric assay for serum lactate dehydrogenase. Clin. Chim. Acta 1973, 46, 223–227. [Google Scholar] [CrossRef]
- Chan, F.K.; Moriwaki, K.; De Rosa, M.J. Detection of necrosis by release of lactate dehydrogenase activity. Methods Mol. Biol. 2013, 979, 65–70. [Google Scholar] [PubMed]
- Stahl, F.R.; Jung, R.; Jazbutyte, V.; Ostermann, E.; Tödter, S.; Brixel, R.; Kemmer, A.; Halle, S.; Rose-John, S.; Messerle, M.; et al. Laboratory diagnostics of murine blood for detection of mouse cytomegalovirus (MCMV)-induced hepatitis. Sci. Rep. 2018, 8, 14823. [Google Scholar] [CrossRef] [PubMed]
- Yasuda, J.; Tateyama, K.; Syut, B.; Too, K. Lactate dehydrogenase and creatine phosphokinase isoenzymes in tissues of laboratory animals. Jpn. J. Vet. Res. 1990, 38, 19–29. [Google Scholar]
- Guzy, P.M. Creatine phosphokinase-MB (CPK-MB) and the diagnosis of myocardial infarction. West. J. Med. 1977, 127, 455–460. [Google Scholar]
- Sarang, Z.; Molnár, P.; Németh, T.; Gomba, S.; Kardon, T.; Melino, G.; Cotecchia, S.; Fésüs, L.; Szondy, Z. Tissue transglutaminase (TG2) acting as G protein protects hepatocytes against Fas-mediated cell death in mice. Hepatology 2005, 42, 578–587. [Google Scholar] [CrossRef]
- MacPherson, R.E.; Castellani, L.; Beaudoin, M.S.; Wright, D.C. Evidence for fatty acids mediating CL 316,243-induced reductions in blood glucose in mice. Am. J. Physiol. Endocrinol. Metab. 2014, 307, E563–E570. [Google Scholar] [CrossRef]
- Rajbhandari, P.; Thomas, B.J.; Feng, A.C.; Hong, C.; Wang, J.; Vergnes, L.; Sallam, T.; Wang, B.; Sandhu, J.; Seldin, M.M.; et al. IL-10 signaling remodels adipose chromatin architecture to limit thermogenesis and energy expenditure. Cell 2018, 172, 218–233. [Google Scholar] [PubMed]
- Wang, Y.; Thatcher, S.E.; Cassis, L.A. Measuring blood pressure using a noninvasive tail cuff method in mice. In The Renin-Angiotensin-Aldosterone System; Thatcher, S., Ed.; Humana Press: New York, NY, USA, 2017; Volume 1614. [Google Scholar]
- Daugherty, A.; Rateri, D.; Hong, L.; Balakrishnan, A. Measuring blood pressure in mice using volume pressure recording, a tail-cuff method. J. Vis. Exp. 2009, 27, 1291. [Google Scholar] [CrossRef] [PubMed]
- Nishida, H.I.; Arai, H.; Nishida, T. Cholesterol ester transfer mediated by lipid transfer protein as influenced by changes in the charge characteristics of plasma lipoproteins. J. Biol. Chem. 1993, 268, 16352–16360. [Google Scholar] [PubMed]
- Hron, W.T.; Menahan, L.A. A sensitive method for the determination of free fatty acids in plasma. J. Lipid Res. 1981, 22, 377–381. [Google Scholar]
- Van der Heiden, C.; Bais, R.; Gerhardt, W.; Lorentz, K.; Rosalki, S. Approved recommendation on IFCC methods for the measurement of catalytic concentration of enzymes. Part 8. IFCC method for lactate dehydrogenase. Eur. J. Clin. Chem. Clin. Biochem. 1994, 32, 639–655. [Google Scholar]
- Schumann, G.; Bonora, R.; Ceriotti, F.; Clerc-Renaud, P.; Ferrero, C.A.; Ferard, G.; Franck, P.F.H.; Gella, F.-J.; Hoelzel, W.; Kanno, T.; et al. IFCC primary reference procedures for the measurement of catalytic activity concentrations of enzymes at 37 °C—Part 2. Reference procedure for the measurement of catalytic concentration of creatine kinase. Clin. Chem. Lab. Med. 2002, 40, 635–642. [Google Scholar] [PubMed]
- Mathieu, M.; Bretaudiere, J.P.; Galteau, M.M.; Guidollet, J.; Lalegerie, P.; Bailly, M.; Buret, P.; Dorche, C.; Louisot, P.; Schiele, F. Recommendations for measuring the catalytic concentration of creatine kinase in human serum at 30 °C. Ann. Biol. Clin. 1982, 40, 138–149. [Google Scholar]
- Dietz, A.A.; Lubrano, T. Separation and quantification of lactic dehydrogenase isoenzymes by disc electrophoresis. Anal. Biochem. 1967, 20, 246–257. [Google Scholar] [CrossRef]


© 2020 by the authors. Licensee MDPI, Basel, Switzerland. This article is an open access article distributed under the terms and conditions of the Creative Commons Attribution (CC BY) license (http://creativecommons.org/licenses/by/4.0/).
Share and Cite
Lénárt, K.; Pap, A.; Pórszász, R.; V. Oláh, A.; Fésüs, L.; Mádi, A. Transglutaminase 2 Has Metabolic and Vascular Regulatory Functions Revealed by In Vivo Activation of Alpha1-Adrenergic Receptor. Int. J. Mol. Sci. 2020, 21, 3865. https://doi.org/10.3390/ijms21113865
Lénárt K, Pap A, Pórszász R, V. Oláh A, Fésüs L, Mádi A. Transglutaminase 2 Has Metabolic and Vascular Regulatory Functions Revealed by In Vivo Activation of Alpha1-Adrenergic Receptor. International Journal of Molecular Sciences. 2020; 21(11):3865. https://doi.org/10.3390/ijms21113865
Chicago/Turabian StyleLénárt, Kinga, Attila Pap, Róbert Pórszász, Anna V. Oláh, László Fésüs, and András Mádi. 2020. "Transglutaminase 2 Has Metabolic and Vascular Regulatory Functions Revealed by In Vivo Activation of Alpha1-Adrenergic Receptor" International Journal of Molecular Sciences 21, no. 11: 3865. https://doi.org/10.3390/ijms21113865
APA StyleLénárt, K., Pap, A., Pórszász, R., V. Oláh, A., Fésüs, L., & Mádi, A. (2020). Transglutaminase 2 Has Metabolic and Vascular Regulatory Functions Revealed by In Vivo Activation of Alpha1-Adrenergic Receptor. International Journal of Molecular Sciences, 21(11), 3865. https://doi.org/10.3390/ijms21113865