CSI NGS Portal: An Online Platform for Automated NGS Data Analysis and Sharing

 ,
,  ,
, 
Abstract

1. Introduction
2. Results
2.1. Website Framework
2.2. Upload
2.3. Annotate
2.4. Submit
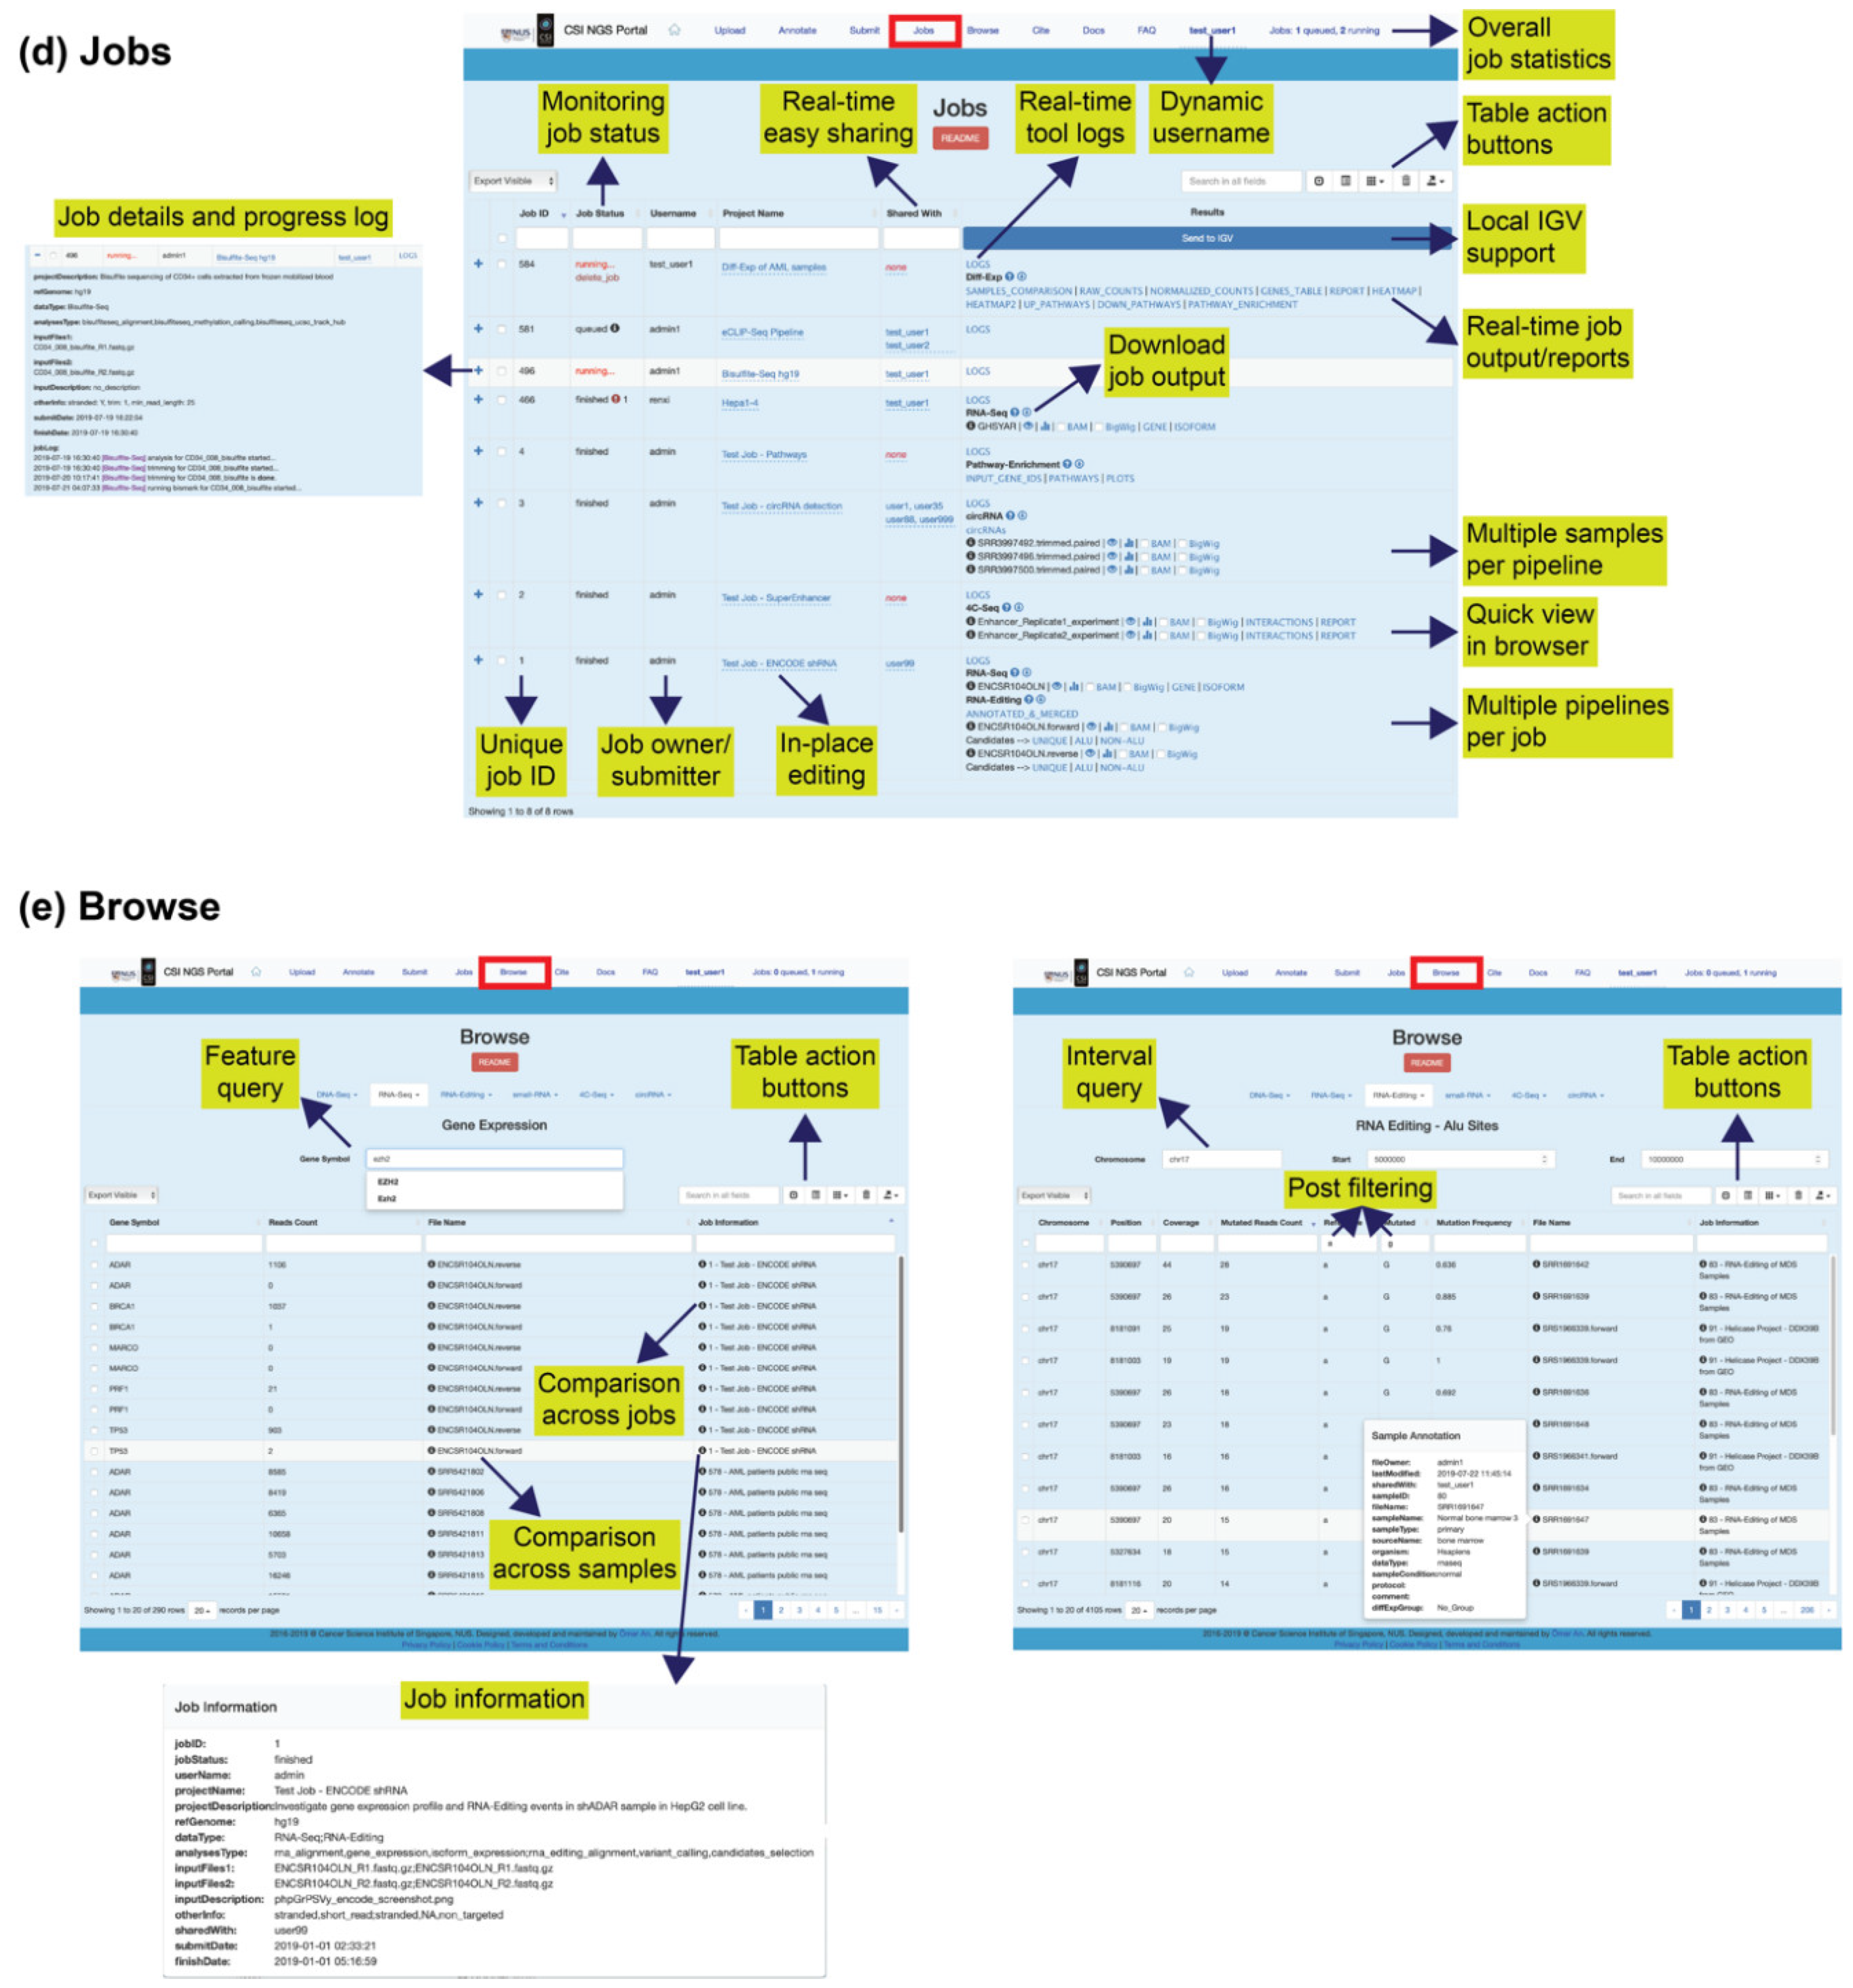
2.5. Jobs
- (a)
- check submitted job details to make sure everything is correct,
- (b)
- delete the entire job or the individual samples anytime,
- (c)
- monitor the job status if it is queued, running or finished,
- (d)
- monitor the job progress via real-time log with timestamp,
- (e)
- access the output files in real-time for view/download,
- (f)
- share/unshare job results with other users anytime.
2.6. Browse
2.7. Portal Features
2.8. Comparison to Similar Platforms
3. Discussion
4. Materials and Methods
4.1. Portal Implementation
4.2. Website Usage
5. Maintenance
- (a)
- enhance user experience,
- (b)
- improve portal performance,
- (c)
- reduce common user mistakes,
- (d)
- fix potential bugs,
- (e)
- prevent abuse.
6. User Privacy and Data Security
- -
- No record of real user information, e.g., no signup or password requirement, usage of dynamic usernames for data sharing, optional e-mail address used only for job notification,
- -
- Cryptographically secure and randomly generated cookies for user recognition and data authorisation,
- -
- Encrypted internet connection via https protocol,
- -
- Server protection by a strict firewall,
- -
- User-restricted data access and full control upon sharing, i.e., unshare and delete,
- -
- Restriction of sensitive functions to data owner, such as delete, edit, and share,
- -
- Back-end control functions to prevent potential user mistakes,
- -
- Backup of non-physical data i.e., sample annotations,
- -
- Constant monitoring of website usage to prevent abuse.
- -
- Avoid leaving computer unattended to prevent cookie theft,
- -
- Download the results as soon as the job is finished and delete from the website,
- -
- Share data with trusted people and with caution, e.g., a simple typo may cause sharing data with another user not intended,
- -
- Report bugs as soon as encountered.
7. Conclusions
Supplementary Materials
Author Contributions
Funding
Acknowledgments
Conflicts of Interest
References
- Afgan, E.; Baker, D.; Batut, B.; van den Beek, M.; Bouvier, D.; Cech, M.; Chilton, J.; Clements, D.; Coraor, N.; Grüning, B.A.; et al. The Galaxy platform for accessible, reproducible and collaborative biomedical analyses: 2018 update. Nucleic Acids Res. 2018, 46, W537–W544. [Google Scholar] [PubMed]
- Kinjo, S.; Monma, N.; Misu, S.; Kitamura, N.; Imoto, J.; Yoshitake, K.; Gojobori, T.; Ikeo, K. Maser: One-stop platform for NGS big data from analysis to visualization. Database (Oxford) 2018, bay027. [Google Scholar] [CrossRef] [PubMed]
- Cock, P.J.; Fields, C.J.; Goto, N.; Heuer, M.L.; Rice, P.M. The Sanger FASTQ file format for sequences with quality scores, and the Solexa/Illumina FASTQ variants. Nucleic Acids Res. 2010, 38, 1767–1771. [Google Scholar] [PubMed]
- Bolger, A.M.; Lohse, M.; Usadel, B. Trimmomatic: A flexible trimmer for Illumina sequence data. Bioinformatics 2014, 30, 2114–2120. [Google Scholar] [CrossRef] [PubMed]
- Love, M.I.; Huber, W.; Anders, S. Moderated estimation of fold change and dispersion for RNA-seq data with DESeq2. Genome Biol. 2014, 15, 550. [Google Scholar]
- Li, H.; Durbin, R. Fast and accurate short read alignment with Burrows-Wheeler transform. Bioinformatics 2009, 25, 1754–1760. [Google Scholar] [CrossRef]
- McKenna, A.; Hanna, M.; Banks, E.; Sivachenko, A.; Cibulskis, K.; Kernytsky, A.; Garimella, K.; Altshuler, D.; Gabriel, S.; Daly, M.; et al. The Genome Analysis Toolkit: A MapReduce framework for analyzing next-generation DNA sequencing data. Genome Res. 2010, 20, 1297–1303. [Google Scholar]
- Cibulskis, K.; Lawrence, M.S.; Carter, S.L.; Sivachenko, A.; Jaffe, D.; Sougnez, C.; Gabriel, S.; Meyerson, M.; Lander, E.S.; Getz, G. Sensitive detection of somatic point mutations in impure and heterogeneous cancer samples. Nat. Biotechnol. 2013, 31, 213–219. [Google Scholar] [CrossRef]
- Wang, K.; Li, M.; Hakonarson, H. ANNOVAR: Functional annotation of genetic variants from high-throughput sequencing data. Nucleic Acids Res. 2010, 38, e164. [Google Scholar] [CrossRef]
- Dobin, A.; Davis, C.A.; Schlesinger, F.; Drenkow, J.; Zaleski, C.; Jha, S.; Batut, P.; Chaisson, M.; Gingeras, T.R. STAR: Ultrafast universal RNA-seq aligner. Bioinformatics 2013, 29, 15–21. [Google Scholar]
- Anders, S.; Pyl, P.T.; Huber, W. HTSeq-a Python framework to work with high-throughput sequencing data. Bioinformatics 2015, 31, 166–169. [Google Scholar] [CrossRef]
- Patro, R.; Duggal, G.; Love, M.I.; Irizarry, R.A.; Kingsford, C. Salmon provides fast and bias-aware quantification of transcript expression. Nat. Methods 2017, 14, 417–419. [Google Scholar] [CrossRef] [PubMed]
- Collado-Torres, L.; Jaffe, A.E.; Leek, J.T. RegionReport: Interactive reports for region-level and feature-level genomic analyses. F1000Res 2015, 4, 105. [Google Scholar] [CrossRef] [PubMed]
- Barter, R.L.; Yu, B. Superheat: An R package for creating beautiful and extendable heatmaps for visualizing complex data. J. Comput. Graph. Stat. 2018, 27, 910–922. [Google Scholar] [CrossRef] [PubMed]
- Yu, G.; He, Q.Y. ReactomePA: An R/Bioconductor package for reactome pathway analysis and visualization. Mol. Biosyst. 2016, 12, 477–479. [Google Scholar] [CrossRef] [PubMed]
- Subramanian, A.; Tamayo, P.; Mootha, V.K.; Mukherjee, S.; Ebert, B.L.; Gillette, M.A.; Paulovich, A.; Pomeroy, S.L.; Golub, T.R.; Lander, E.S.; et al. Gene set enrichment analysis: A knowledge-based approach for interpreting genome-wide expression profiles. Proc. Natl. Acad. Sci. USA 2005, 102, 15545–15550. [Google Scholar] [CrossRef] [PubMed]
- Anders, S.; Reyes, A.; Huber, W. Detecting differential usage of exons from RNA-seq data. Genome Res. 2012, 22, 2008–2017. [Google Scholar] [CrossRef]
- Yu, G.; Wang, L.G.; Yan, G.R.; He, Q.Y. DOSE: An R/Bioconductor package for disease ontology semantic and enrichment analysis. Bioinformatics 2015, 31, 608–609. [Google Scholar] [CrossRef]
- Li, H.; Handsaker, B.; Wysoker, A.; Fennell, T.; Ruan, J.; Homer, N.; Marth, G.; Abecasis, G.; Durbin, R. 1000 Genome Project Data Processing Subgroup, The Sequence Alignment/Map format and SAMtools. Bioinformatics 2009, 25, 2078–2079. [Google Scholar] [CrossRef]
- Ramaswami, G.; Zhang, R.; Piskol, R.; Keegan, L.P.; Deng, P.; O’Connell, M.A.; Li, J.B. Identifying RNA editing sites using RNA sequencing data alone. Nat. Methods 2013, 10, 128–132. [Google Scholar] [CrossRef]
- Roth, S.H.; Levanon, E.Y.; Eisenberg, E. Genome-wide quantification of ADAR adenosine-to-inosine RNA editing activity. Nat. Methods 2019, 16, 1131–1138. [Google Scholar] [CrossRef] [PubMed]
- Thongjuea, S.; Stadhouders, R.; Grosveld, F.G.; Soler, E.; Lenhard, B. r3Cseq: An R/Bioconductor package for the discovery of long-range genomic interactions from chromosome conformation capture and next-generation sequencing data. Nucleic Acids Res. 2013, 41, e132. [Google Scholar] [CrossRef] [PubMed]
- Langmead, B.; Salzberg, S.L. Fast gapped-read alignment with Bowtie 2. Nat. Methods 2012, 9, 357–359. [Google Scholar] [CrossRef] [PubMed]
- Zhang, Y.; Liu, T.; Meyer, C.A.; Eeckhoute, J.; Johnson, D.S.; Bernstein, B.E.; Nusbaum, C.; Myers, R.M.; Brown, M.; Li, W.; et al. Model-based analysis of ChIP-Seq (MACS). Genome Biol. 2008, 9, R137. [Google Scholar] [CrossRef] [PubMed]
- Heinz, S.; Benner, C.; Spann, N.; Bertolino, E.; Lin, Y.C.; Laslo, P.; Cheng, J.X.; Murre, C.; Singh, H.; Glass, C.K. Simple combinations of lineage-determining transcription factors prime cis-regulatory elements required for macrophage and B cell identities. Mol. Cell 2010, 38, 576–589. [Google Scholar] [CrossRef]
- Flynn, R.A.; Zhang, Q.C.; Spitale, R.C.; Lee, B.; Mumbach, M.R.; Chang, H.Y. Transcriptome-wide interrogation of RNA secondary structure in living cells with icSHAPE. Nat. Protoc. 2016, 11, 273–290. [Google Scholar] [CrossRef] [PubMed]
- Lorenz, R.; Hofacker, I.L.; Stadler, P.F. RNA folding with hard and soft constraints. Algorithms Mol. Biol. 2016, 11, 8. [Google Scholar] [CrossRef]
- Lorenz, R.; Bernhart, S.H.; Honer Zu Siederdissen, C.; Tafer, H.; Flamm, C.; Stadler, P.F.; Hofacker, I.L. ViennaRNA Package 2.0. Algorithms Mol. Biol. 2011, 6, 26. [Google Scholar] [CrossRef]
- Shen, S.; Park, J.W.; Lu, Z.X.; Lin, L.; Henry, M.D.; Wu, Y.N.; Zhou, Q.; Xing, Y. rMATS: Robust and flexible detection of differential alternative splicing from replicate RNA-Seq data. Proc. Natl. Acad. Sci. USA 2014, 111, E5593–E5601. [Google Scholar] [CrossRef]
- Van Nostrand, E.L.; Pratt, G.A.; Shishkin, A.A.; Gelboin-Burkhart, C.; Fang, M.Y.; Sundararaman, B.; Blue, S.M.; Nguyen, T.B.; Surka, C.; Elkins, K.; et al. Robust transcriptome-wide discovery of RNA-binding protein binding sites with enhanced CLIP (eCLIP). Nat. Methods. 2016, 13, 508–514. [Google Scholar] [CrossRef]
- Van Nostrand, E.L.; Nguyen, T.B.; Gelboin-Burkhart, C.; Wang, R.; Blue, S.M.; Pratt, G.A.; Louie, A.L.; Yeo, G.W. Robust, Cost-Effective Profiling of RNA Binding Protein Targets with Single-end Enhanced Crosslinking and Immunoprecipitation (seCLIP). Methods Mol. Biol. 2017, 1648, 177–200. [Google Scholar] [PubMed]
- Lovci, M.T.; Ghanem, D.; Marr, H.; Arnold, J.; Gee, S.; Parra, M.; Liang, T.Y.; Stark, T.J.; Gehman, L.T.; Hoon, S.; et al. Rbfox proteins regulate alternative mRNA splicing through evolutionarily conserved RNA bridges. Nat. Struct. Mol. Biol. 2013, 20, 1434–1442. [Google Scholar] [CrossRef] [PubMed]
- Krueger, F.; Andrews, S.R. Bismark: A flexible aligner and methylation caller for Bisulfite-Seq applications. Bioinformatics 2011, 27, 1571–1572. [Google Scholar] [CrossRef] [PubMed]
- Juhling, F.; Kretzmer, H.; Bernhart, S.H.; Otto, C.; Stadler, P.F.; Hoffmann, S. Metilene: Fast and sensitive calling of differentially methylated regions from bisulfite sequencing data. Genome Res. 2016, 26, 256–262. [Google Scholar] [CrossRef] [PubMed]
- Shen, L.; Shao, N.; Liu, X.; Nestler, E. ngs.plot: Quick mining and visualization of next-generation sequencing data by integrating genomic databases. BMC Genomics 2014, 15, 284. [Google Scholar] [CrossRef] [PubMed]
- Ramirez, F.; Ryan, D.P.; Gruning, B.; Bhardwaj, V.; Kilpert, F.; Richter, A.S.; Heyne, S.; Dundar, F.; Manke, T. DeepTools2: A next generation web server for deep-sequencing data analysis. Nucleic Acids Res. 2016, 44, W160–W165. [Google Scholar] [CrossRef] [PubMed]
- Robinson, J.T.; Thorvaldsdottir, H.; Winckler, W.; Guttman, M.; Lander, E.S.; Getz, G.; Mesirov, J.P. Integrative genomics viewer. Nat. Biotechnol 2011, 29, 24–26. [Google Scholar] [CrossRef]
- Raney, B.J.; Dreszer, T.R.; Barber, G.P.; Clawson, H.; Fujita, P.A.; Wang, T.; Nguyen, N.; Paten, B.; Zweig, A.S.; Karolchik, D.; et al. Track data hubs enable visualization of user-defined genome-wide annotations on the UCSC Genome Browser. Bioinformatics 2014, 30, 1003–1005. [Google Scholar] [CrossRef]
- Reich, M.; Liefeld, T.; Gould, J.; Lerner, J.; Tamayo, P.; Mesirov, J.P. GenePattern 2.0. Nat. Genet. 2006, 38, 500–501. [Google Scholar] [CrossRef]
- Severin, J.; Lizio, M.; Harshbarger, J.; Kawaji, H.; Daub, C.O.; Hayashizaki, Y.; Consortium, F.; Bertin, N.; Forrest, A.R. Interactive visualization and analysis of large-scale sequencing datasets using ZENBU. Nat. Biotechnol. 2014, 32, 217–219. [Google Scholar] [CrossRef]
- D’Antonio, M.; D’Onorio De Meo, P.; Pallocca, M.; Picardi, E.; D’Erchia, A.M.; Calogero, R.A.; Castrignano, T.; Pesole, G. RAP: RNA-Seq Analysis Pipeline, a new cloud-based NGS web application. BMC Genomics 2015, 16, S3. [Google Scholar] [CrossRef] [PubMed]
- Fehlmann, T.; Backes, C.; Kahraman, M.; Haas, J.; Ludwig, N.; Posch, A.E.; Wurstle, M.L.; Hubenthal, M.; Franke, A.; Meder, B.; et al. Web-based NGS data analysis using miRMaster: A large-scale meta-analysis of human miRNAs. Nucleic Acids Res. 2017, 45, 8731–8744. [Google Scholar] [CrossRef] [PubMed]
- Dorff, K.C.; Chambwe, N.; Zeno, Z.; Simi, M.; Shaknovich, R.; Campagne, F. GobyWeb: Simplified management and analysis of gene expression and DNA methylation sequencing data. PLoS ONE 2013, 8, e69666. [Google Scholar] [CrossRef] [PubMed]
- Jourdren, L.; Bernard, M.; Dillies, M.A.; Le Crom, S. Eoulsan: A cloud computing-based framework facilitating high throughput sequencing analyses. Bioinformatics 2012, 28, 1542–1543. [Google Scholar] [PubMed]
- Desvillechabrol, D.; Legendre, R.; Rioualen, C.; Bouchier, C.; van Helden, J.; Kennedy, S.; Cokelaer, T. Sequanix: A dynamic graphical interface for Snakemake workflows. Bioinformatics 2018, 34, 1934–1936. [Google Scholar] [CrossRef] [PubMed]
- Wolstencroft, K.; Haines, R.; Fellows, D.; Williams, A.; Withers, D.; Owen, S.; Soiland-Reyes, S.; Dunlop, I.; Nenadic, A.; Fisher, P.; et al. The Taverna workflow suite: Designing and executing workflows of Web Services on the desktop, web or in the cloud. Nucleic Acids Res. 2013, 41, W557–W561. [Google Scholar] [CrossRef]
- Cervera, A.; Rantanen, V.; Ovaska, K.; Laakso, M.; Nunez-Fontarnau, J.; Alkodsi, A.; Casado, J.; Facciotto, C.; Hakkinen, A.; Louhimo, R.; et al. Anduril 2: Upgraded large-scale data integration framework. Bioinformatics 2019, 35, 3815–3817. [Google Scholar] [CrossRef]
- Yao, L.; Wang, H.; Song, Y.; Sui, G. BioQueue: A novel pipeline framework to accelerate bioinformatics analysis. Bioinformatics 2017, 33, 3286–3288. [Google Scholar]
- Yukselen, O.; Turkyilmaz, O.; Ozturk, A.R.; Garber, M.; Kucukural, A. DolphinNext: A distributed data processing platform for high throughput genomics. BMC Genomics 2020, 21, 310. [Google Scholar]
 : Logical flow;
  : Automated step;
  : Page function.
: Logical flow; : Automated step; : Page function.
: Page function.
: Logical flow; : Automated step; : Page function.


| Bioinformatics Pipeline | Analysis Steps | Tools and Packages | Sequencing Types | Normal/Control/Reference Samples | Replicate Samples a | Overall Runtime |
|---|---|---|---|---|---|---|
| 1. DNA-Seq | Genome alignment | BWA (mem) [6] | Single/Paired end | Optional b | NA | ~1 day |
| Mutation calling | GATK4 Mutect2 [7,8] | |||||
| Mutation annotation | ANNOVAR [9] | |||||
| 2. RNA-Seq | Genome alignment | STAR [10] | Single/Paired end | NA | NA | ~2 h |
| Gene expression | HTSeq-count [11] | |||||
| Isoform expression | Salmon [12] | |||||
| Alternative splicing | in-house Perl | |||||
| 3. Diff-Exp | Genes table | Bioconductor DESeq2 [5] | Single/Paired end c | Required | Required (min 2 samples) | ~10 min |
| Genes report | Bioconductor regionReport [13] | |||||
| Heatmap | Superheat [14] | |||||
| Volcano | ggplot2 (Wickham 2016) | |||||
| Pathway enrichment | Bioconductor ReactomePA [15] | |||||
| Gene set enrichment analysis | GSEA [16] | |||||
| Isoforms report | Bioconductor DEXSeq [17] | |||||
| 4. Pathway-Enrichment | Enrichment plots | Bioconductor ReactomePA [15], enrichplot [18] | NA | NA | NA | ~1 min |
| 5. RNA-Editing | Genome alignment | BWA (mem) [6] | Single/Paired end | NA | NA | ~7 h |
| Variant calling | Samtools mpileup [19] | |||||
| Candidates selection | adapted from [20] | |||||
| AEI calculation | RNAEditingIndexer [21] | |||||
| UCSC track hub | in-house Bash | |||||
| 6. smallRNA | Genome alignment | NovoAlign | Single/Paired end | NA | NA | ~1 h |
| smallRNA expression | in-house Perl | |||||
| 7. 4C-Seq | Genome alignment | BWA (mem) [6] | Single/Paired end | Optional | Optional (2 samples) | ~10 min |
| Interactions | Bioconductor r3Cseq [22] | |||||
| Report | Bioconductor r3Cseq [22] | |||||
| 8. ChIP-Seq | Genome alignment | Bowtie2 [23] | Single/Paired end | Required | NA | ~2 h |
| Peak calling | MACS2 [24] | |||||
| Motif enrichment | HOMER [25] | |||||
| UCSC track hub | in-house Bash | |||||
| 9. RIP-Seq | Genome alignment | STAR [10] | Paired end | Required | Optional (2–10 samples) | ~8 h |
| Peak calling | in-house Bash | |||||
| UCSC track hub | in-house Bash | |||||
| 10. SHAPE-Seq | Transcriptome alignment | Bowtie2 [23] | Single/Paired end | Required | NA | ~10 h |
| Reactivity calculation | icSHAPE [26] | |||||
| Structure prediction | RNAfold [27,28] | |||||
| 11. rMATS | Genome alignment | STAR [10] | Single/Paired end | Required | Required(2–10 samples) | ~2 h |
| Alternative splicing | rMATS [29] | |||||
| 12. circRNA | Genome alignment | STAR [10] | Single/Paired end | NA | NA | ~1 h |
| circRNA expression | in-house Perl | |||||
| 13. eCLIP-Seq | Demultiplexing | eclipdemux [30,31] | Single/Paired end | Required | NA | ~1 day |
| Mapping | STAR [10] | |||||
| Peak calling | clipper [32] | |||||
| Peak normalisation | eCLIP [30,31] | |||||
| Peak annotation | HOMER [25] | |||||
| Motif enrichment | HOMER [25] | |||||
| UCSC track hub | in-house Bash | |||||
| 14. Bisulfite-Seq | Genome alignment | bowtie2 [23] | Single/Paired end | NA | NA | ~3 days |
| Methylation calling | Bismark [33] | |||||
| UCSC track hub | in-house Bash | |||||
| DMRs | metilene [34] | |||||
| 15. scRNA-Seq | Genome alignment | STAR [10] | Paired end | NA | NA | ~4 h |
| Single cell analysis | Cell Ranger (10× Genomics) | |||||
| 16. ngsplot-deepTools | Genome alignment | STAR [10], Bowtie2 [23] | Single/Paired end | NA | NA | ~4 h |
| Plots | ngsplot [35] | |||||
| Plots | deepTools [36] |
 | Full-automation | All the pipelines run from input to output without intervention with minimal user input. |
 | Usability | User-friendly and simple design with interactive tables having search, filter, sort, edit, export and share options. |
 | Modularity | Repertoire of pipelines is easy to expand complying with the existing website framework. |
 | Flexibility | Pipelines written in virtually any script language can be integrated independently of the website code. |
 | Transparency | The pipelines documentation are available online with the descriptions and the code. |
 | Responsive design | The website can be functionally displayed on multiple devices and platforms with different window/screen sizes. |
 | Quality control | FastQC report is auto-generated upon file upload, sequence and quality trimming are optionally available with multiple options. |
 | User privacy | No personal information is collected, secure, random cookies for authorisation and dynamic usernames for data sharing are used. |
 | Data privacy | Data can be edited, deleted or shared only by the owner, expired data are completely removed from the server. |
 | Data sharing | Uploaded raw FASTQ files are private to the user, results can be optionally shared/unshared with other users any time. |
 | Data availability | Data is fully accessible via the portal until expiry (10 days, subject to revision upon usage and server capacity). |
 | Data download | All the data can be downloaded to local computer with a few clicks via browser and command line. |
 | IGV-integrated | Alignment (.bam, .bigwig) and mutation (.vcf) data can be viewed in local IGV without downloading the original files. |
 | UCSC-integrated | Peak regions (.bigbed, .bigwig) and sites from supported pipelines can be viewed in UCSC Genome Browser online as a track hub. |
 | Real-time logging | Real-time overall job progress log and individual tool log files are generated useful for tracking and debugging. |
 | E-mail notification | User is notified upon job completion if e-mail address is provided during job submission (optional). |
 | Parallelisation | Jobs are parallelised by multi-threading and by simultaneous run of multiple samples wherever possible. |
 | New pipelines | Popular and established bioinformatics pipelines for new data types are continuously added. |
 | Up-to-date | All the tools and packages are regularly updated to the latest stable versions available. |
| Platform Name | Number of Pipelines/ NGS Data Types | Full Pipelines | Data Visualisation | Data Sharing | Custom Workflow Building | Code Availability | Local Installation | Registration/Login |
|---|---|---|---|---|---|---|---|---|
| CSI NGS Portal | 16 a | Yes | Static f | Yes | No | Pipeline level | In progress | Not required |
| Galaxy | Multiple b | No | Dynamic | Yes | Yes | Source level | Yes | Required |
| Maser | 7 c | Yes | Dynamic | Yes | Limited | No | No | Required |
| RAP | 1 d | Yes | Static | No | No | No | No | Required |
| miRMaster | 1 e | Yes | Static | No | No | No | No | Not required |
© 2020 by the authors. Licensee MDPI, Basel, Switzerland. This article is an open access article distributed under the terms and conditions of the Creative Commons Attribution (CC BY) license (http://creativecommons.org/licenses/by/4.0/).
Share and Cite
An, O.; Tan, K.-T.; Li, Y.; Li, J.; Wu, C.-S.; Zhang, B.; Chen, L.; Yang, H. CSI NGS Portal: An Online Platform for Automated NGS Data Analysis and Sharing. Int. J. Mol. Sci. 2020, 21, 3828. https://doi.org/10.3390/ijms21113828
An O, Tan K-T, Li Y, Li J, Wu C-S, Zhang B, Chen L, Yang H. CSI NGS Portal: An Online Platform for Automated NGS Data Analysis and Sharing. International Journal of Molecular Sciences. 2020; 21(11):3828. https://doi.org/10.3390/ijms21113828
Chicago/Turabian StyleAn, Omer, Kar-Tong Tan, Ying Li, Jia Li, Chan-Shuo Wu, Bin Zhang, Leilei Chen, and Henry Yang. 2020. "CSI NGS Portal: An Online Platform for Automated NGS Data Analysis and Sharing" International Journal of Molecular Sciences 21, no. 11: 3828. https://doi.org/10.3390/ijms21113828
APA StyleAn, O., Tan, K.-T., Li, Y., Li, J., Wu, C.-S., Zhang, B., Chen, L., & Yang, H. (2020). CSI NGS Portal: An Online Platform for Automated NGS Data Analysis and Sharing. International Journal of Molecular Sciences, 21(11), 3828. https://doi.org/10.3390/ijms21113828