Article

Granulosa-Lutein Cell Sirtuin Gene Expression Profiles Differ between Normal Donors and Infertile Women

by
Rebeca González-Fernández
1,
Rita Martín-Ramírez
1,
Deborah Rotoli
1,2,
Jairo Hernández
3,
Frederick Naftolin
4,
Pablo Martín-Vasallo
1,
Angela Palumbo
3,4 and
Julio Ávila
1,*
1
Laboratorio de Biología del Desarrollo, UD de Bioquímica y Biología Molecular and Centro de Investigaciones Biomédicas de Canarias (CIBICAN), Universidad de La Laguna, Av. Astrofísico Sánchez s/n, 38206 La Laguna, Tenerife, Spain
2
Institute of Endocrinology and Experimental Oncology (IEOS), CNR-National Research Council, 80131 Naples, Italy
3
Centro de Asistencia a la Reproducción Humana de Canarias, 38202 La Laguna, Tenerife, Spain
4
Department of Obstetrics and Gynecology, New York University, New York, NY 10016, USA
*
Author to whom correspondence should be addressed.
Int. J. Mol. Sci. 2020, 21(1), 295; https://doi.org/10.3390/ijms21010295
Submission received: 13 November 2019 / Revised: 27 December 2019 / Accepted: 29 December 2019 / Published: 31 December 2019

Abstract

:
Sirtuins are a family of deacetylases that modify structural proteins, metabolic enzymes, and histones to change cellular protein localization and function. In mammals, there are seven sirtuins involved in processes like oxidative stress or metabolic homeostasis associated with aging, degeneration or cancer. We studied gene expression of sirtuins by qRT-PCR in human mural granulosa-lutein cells (hGL) from IVF patients in different infertility diagnostic groups and in oocyte donors (OD; control group). Study 1: sirtuins genes’ expression levels and correlations with age and IVF parameters in women with no ovarian factor. We found significantly higher expression levels of SIRT1, SIRT2 and SIRT5 in patients ≥40 years old than in OD and in women between 27 and 39 years old with tubal or male factor, and no ovarian factor (NOF). Only SIRT2, SIRT5 and SIRT7 expression correlated with age. Study 2: sirtuin genes’ expression in women poor responders (PR), endometriosis (EM) and polycystic ovarian syndrome. Compared to NOF controls, we found higher SIRT2 gene expression in all diagnostic groups while SIRT3, SIRT5, SIRT6 and SIRT7 expression were higher only in PR. Related to clinical parameters SIRT1, SIRT6 and SIRT7 correlate positively with FSH and LH doses administered in EM patients. The number of mature oocytes retrieved in PR is positively correlated with the expression levels of SIRT3, SIRT4 and SIRT5. These data suggest that cellular physiopathology in PR’s follicle may be associated with cumulative DNA damage, indicating that further studies are necessary.

Graphical Abstract

1. Introduction

Sirtuins (silent information regulator proteins) were initially defined as an evolutionarily conserved family of class III nicotinamide adenine dinucleotide+ (NAD+)-dependent histone deacetylases that can also have mono-ADP-ribosyltransferase activity [1,2]. These enzymes cleave an acetyl group from acetyl-lysine residues in histones, although they can also act in nonhistone proteins, such us structural proteins, metabolic enzymes or transcriptional factors [1,2]. However, recent studies demonstrate that sirtuin family gene products catalyze additional reactions and enzymatic activities, including mono-ADP-ribosyltransferase, deacylase, deacetylase, desuccinylase, demalonylase, demyristoylase and depalmitoylase activities [2,3,4].
Sirtuins are implicated in aging, oxidative stress, maintenance of metabolic homeostasis, DNA repair and mitochondrial function [5,6] through the regulation of specific genes’ expression and activation or deactivation of other proteins [7,8].
In mammals, seven sirtuin isoforms have so far been described (SIRT1SIRT7). These possess a conserved catalytic domain but differ in their amino and carboxyl terminal that confers specificity in cellular location and function [9].
SIRT1 is the most studied member of the sirtuin family, it is located mainly in the nucleus, although it shuttles to the cytosol in response to environmental signals [10]. SIRT1 has been implicated in processes such as inflammation, by reducing NF-κB activity [11,12], apoptosis by inhibiting p53-dependent transcription [13,14] and in energy metabolism through effects on regulators of metabolic enzymes such as PPAR-γ [15]. Yeast Sir2 gene is a SIRT1 homolog that is involved in yeast life span extension, nonetheless, but a similar role for SIRT1 has been refuted [16]. In the reproductive system, SIRT1 plays a role in apoptosis of granulosa cells during follicular atresia [17,18] and has been related to preservation of follicular reserve and extension of ovarian lifespan [19].
SIRT2 is located in the cytoplasm [9]. It transiently migrates into the nucleus to deacetylate α-tubulin and to modulate chromatin condensation and cell cycle regulation by deacetylating H3 and H4 histones [20,21]. SIRT2 deacetylates transcriptional factors like Foxo, p53 or NF-κB [4,22,23,24].
SIRT3 resides in the mitochondria [9] and participates in the regulation of energy metabolism [25,26] and apoptosis [27] and in reactive oxygen species (ROS) detoxification [28,29]. SIRT3 has been involved in age-associated oxidative stress and infertility [30,31,32].
SIRT4 located in the mitochondria [9] regulates lipid metabolism promoting fatty acid oxidation and inhibiting lipogenesis [33,34]. The effects of SIRT3 and SIRT4 on glutamate dehydrogenase are opposite: while SIRT4 represses GDH activity, deacetylation by SIRT3 activates GDH [35,36].
SIRT5 in mitochondria [9,37] has been reported to possess low deacetylase activity compared to the other members of the family. In contrast, SIRT5 possesses high desuccinylation, demalonylation and deglutarylation activities [4]. It activates the urea cycle by deacetylating carbamoyl phosphate synthetase 1 [38]. SIRT5 desuccinylates isocitrate dehydrogenase 2 and deglutarylates glucose-6-phosphate dehydrogenase, which protect cells from oxidative damage by activating NADPH-producing enzymes [39]. In women, SIRT5 expression decreases along with ovarian reserve as maternal age increases [40].
SIRT6, nuclear [10], is implicated in telomeres stabilization, DNA double strand break repair and regulation of transcription [41,42,43,44]. SIRT6 overexpression increases lifespan in male mice by ~15% [45]. Regarding fertility, SIRT6 has been associated with follicle reserve preservation and increase of ovarian function lifespan [19].
SIRT7, predominantly localized in the nucleolus [9], co-activates ribosomal DNA transcription by association with RNA polymerase I complex [46,47]. In addition, SIRT7 interacts with chromatin remodeling complexes by association and deacetylation of the B-WICH component [48] and plays a role in stress resistance to hypoxia, osmotic stress, ER-stress or genomic stress [49,50,51].
The aim of this study was to investigate the expression of the genes coding for the 7 sirtuins in human granulosa–lutein (hGL) cells from in vitro fertilization (IVF) patients with different infertility diagnoses, aging women and oocyte donors (young controls) in order to seek differences in gene expression levels and possible correlation with clinical parameters.

2. Results

2.1. Descriptive Statistics and Clinical Variables

Significant differences in age distribution were found between OD (oocyte donors between 18 and 27 yo) and all other groups (p = 0.000) and between ≥40 yo (women ≥ 40 yo with tubal or male factor and no ovarian factor) and all other groups (p = 0.000). No age difference was observed between NOF (women between 27 and 39 yo with tubal or male factor and no ovarian factor), PCOS (polycystic ovarian syndrome), EM (endometriosis) and PR (women < 40 yo defined as poor responders) (Table 1).
While agonist and antagonist protocols were differently represented between diagnostic groups, within each group there were no statistically significant differences in gene expression between the 2 protocols.
Regarding the amount of exogenous gonadotropins used for ovulation induction, PCOS, OD and NOF groups received significantly lower doses compared to EM, PR and ≥40 yo (p = 0.000). The number of total and mature oocytes retrieved varied between groups: significant differences are shown in Table 1. No statistically significant differences in mean E2 peak value were observed among groups.

2.2. Sirtuin Gene Expression

2.2.1. Study 1: Sirtuin Gene Expression Level and Correlations with Age and IVF Parameters in Women with No Ovarian Factor

All sirtuin family members were expressed in human granulosa-lutein cells, Table 2. SIRT1 and SIRT2 were the most expressed. SIRT3, SIRT5 and SIRT7 showed an intermediate expression and SIRT4 and SIRT6 the least expression.
Comparing expression between different IVF diagnostic groups gene expression was higher in ≥40 yo patients than in other groups for SIRT1 (OD: p = 0.008; NOF: p = 0.000), SIRT2 (OD: p = 0.000; NOF: p = 0.000) and SIRT5 (OD: p = 0.032; NOF: p = 0.014). With the exception of SIRT2 and SIRT7 the NOF group did not differ from the controls, Figure 1.
Sirtuins and age—When all women with no ovarian factor (OD, NOF and ≥40 yo) were analyzed, we observed that only SIRT2, SIRT5 and SIRT7 expression correlated with age (r = 0.350, p < 0.01; r = 0.324, p < 0.05 and r = 303, p < 0.05) (Figure 2).
Sirtuins and IVF parameters—When different groups were analyzed, no correlation was found between NOF or ≥40 yo with any IVF parameters. The ovum donor controls showed a negative correlation between SIRT2, SIRT3, SIRT4 and SIRT6 and administered gonadotrophin doses (p < 0.01) and a negative correlation between SIRT7 and FSH doses (p < 0.05). In addition, SIRT2, SIRT4, SIRT6, SIRT7 expression also correlated negatively with total treatment days (p < 0.05).

2.2.2. Study 2: Correlations between Sirtuin Gene Expression and IVF Parameters in Women with Different Infertility Diagnosis compared to NOF.
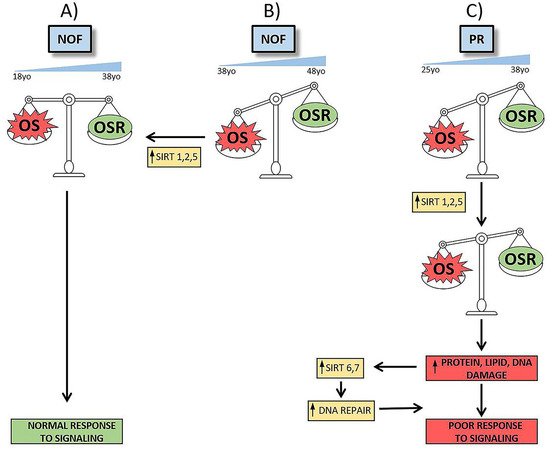
Comparing expression between different groups (Table 2), no significant difference was observed in SIRT1 and SIRT4 gene expression level among any group. Expression levels of SIRT2 were statistically higher in EM (p = 0.000), PR (p = 0.000) and PCOS (p = 0.010) patients compared to NOF. However, PR present the higher expression level, statistically different from PCOS (p = 0.008), while EM has an intermediary value that did not differ from any other group, Figure 3. SIRT3, SIRT5 and SIRT7 gene expression was statistically higher in PR than in NOF (p = 0.029; p = 0.011; p = 0.003). PCOS and EM present an intermedia expression value that did not differ from NOF or PR (Figure 3). SIRT6 expression was statistically higher in PR patients than in all other groups (NOF: p = 0.002; EM: p = 0.045; PCOS: p = 0.008) (Figure 3).
When different diagnostic groups were analyzed, we observed that in PR, ≥40 yo and PCOS groups no correlation was found between sirtuin gene expression and gonadotrophin doses. Only in EM patients did SIRT1, SIRT6 and SIRT7 correlate positively with FSH and LH doses administered. Interestingly, these correlations with SIRT6 and SIRT7 were opposite to those found in control OD.
With the exception of a negative correlation for SIRT4 in PCOS patients, no correlations were found between sirtuin expression and number of days of treatment in the analyzed groups.
There was a positive correlation between mitochondrial sirtuins and mature oocytes retrieved in PR patients.

3. Discussion

3.1. These Are Novel Findings Regarding the Possible Role of the Sirtuin Gene Family in Reproductive Failure

In view of their NAD+ dependence [51], there may be a role for sirtuins in intrafollicular cell redox balance and antioxidant response.
This article reports the expression levels of the seven sirtuin genes presently known in post-ovarian stimulation and human chorionic gonadotrophin treated human hGL cells and establishes correlations among sirtuin gene expression and clinical status: age, clinical diagnosis, specific ovulation induction and response to treatment; Table 1. Notably, the average estradiol level in the PR group is relatively elevated. We defined PR based on the Bologna criteria [52], but excluding the advanced maternal age subjects, which represent a separate group in our study. The stimulation protocol was adjusted to furnish satisfactory serum estradiol levels prior to hCG injection. We used an antagonist protocol with high doses of LH and FSH based on the expected poor response and the high estradiol levels obtained in some patients probably reflect the high dose of LH used for ovulation induction. Interestingly, our group of poor responders does not include patients >40; the patients’ age range is 28–39, which may have positively affected the ability of granulosa cells to produce estrogen. Our results are in agreement with the paper by Ku et al. [53], which showed higher estradiol levels in patients treated with a combination of FSH and LH. However, Ku el al. used an ultralong protocol, which may be responsible for lower estradiol levels in their patients.
IVF patients with no ovarian factor (OD, NOF and ≥40 yo) showed a direct correlation between their hGL cell sirtuin 2, 5 and 7 gene expression and age. This could be a means of maintenance of energy homeostasis, glucose metabolism and reactive oxygen species detoxification, DNA repair and other cell repair mechanism that decrease with age and could result is poor response to ovarian stimulation and compromised oocytes [54,55].
The positive correlation of SIRT2 expression levels with age (p < 0.01) in women with no ovarian factor shows a pronounced increase at 40 years old, as shown in Figure 2 scatter plot. The expression levels of SIRT2 in the PR and EM groups of patients resemble those of ≥40 yo women, Table 2. The higher expression levels of SIRT2 gene in women older than 40 yo than in the OD and NOF groups supports the hypothesis that SIRT2 expression increases most notably after forty years [56,57,58], always within the age limits or our study.
Summary—Taken together, these findings imply a feedback loop that induces sirtuin 2, 5 and 7 expression with (ovarian) aging and in relation to disease states that foster the presence of reactive oxygen species in or around the ovary. However, these descriptive studies were not designed to test such relationships.

3.2. These Findings Have Implications for Ovarian Aging.

Fertility decreases from age 35 and reaches a clinically perilous point in most women by age 40. In our study, SIRT1 gene expression levels were higher in women older than 40 yo than in OD and NOF patients (Figure 1). These data are in agreement with those of Di Emidio et al. [30], who reported higher levels of SIRT1 mRNA in aged mouse oocytes and a decreased ability to react to H2O2 addition as a sign of increased oxidative stress (OS). This coincides well with the increase of SIRT1 expression in response to age dependent OS. A direct correlation between aging and OS increase has been reported with aging-related decay of fertility [59], and our laboratory reported an increased expression levels of the oxidative stress response gene ALDH3A2 in granulosa-lutein cells that is related to age and infertility diagnosis [60,61].
SIRT5 gene expression level is significantly higher in ≥40 yo than in OD and NOF (p = 0.045 and p = 0.010, respectively). SIRT5, localized in the mitochondrial matrix, regulates mitochondrial activity and function [62] by succinylating [63] or acetylating proteins such as cytochrome C, which is pivotal in oxidative metabolism and the apoptosis processes [36].
These studies closely link sirtuins to the aging ovary. The increase in expression of SIRT5 gene in women older than 40 years old could represent a feedback loop that is related to the presence of oxidative species.
Other studies of the sirtuin family and the ovary—There have been other studies of SIRT5 in human granulosa-lutein cells. Pacella-Ince et al. [40] reported a lower gene expression level in women of advanced maternal age and reduced ovarian reserve compared to younger women, which is apparently opposite to our results. However, in the article by Pacella-Ince et al., the patients’ distributions within each age group include no ovarian factor women as well as different infertility diagnoses. Furthermore, the different infertility diagnoses are not represented in all groups and percentages among them are notably variable; as a result, the amount of SIRT5 gene expression given is not specific for age, but just an average of the combined groups [40].
While convincing of differences in mural hGL cells, these findings do not reveal sirtuin family expression in the cumulus cells that are directly in apposition to the oocyte/embryo. We have shown that there are important biochemical differences between mural and cumulus cells [64,65]. Additionally, there have been reports of miRNA differences in poor responders [66] and other genes’ expression in cumulus cells from obese women [67,68]; the possibility of mural vs. cumulus differences is on the list for further study.
Summary—The human ovarian follicle, represented by post-ovulatory luteinized granulosa cells, expresses all known members of the sirtuin family of genes. We have proposed a feedback mechanism related to the presence of inflammation/reactive oxygen species/aging that drives expression of sirtuins as a defensive/protective mechanism. SIRT6 and SIRT7 functions include regulation of DNA-repair mechanisms [43,44,50,69]. The overexpression of SIRT6 and SIRT7 in the PR group of patients might be indicative of the role of these sirtuins in an attempt to repair accumulated damage to DNA caused by a deficient response to cellular genotoxic stress [45,69]. However, in NOF and ≥40 yo, the expression levels of these sirtuins do not differ from those observed in younger women (OD) (Table 2). This suggests that in PR the DNA damage is mainly due to genomic instability and not affected by aging [54]. In the case of patients suffering from EM or PCOS, the slight increase expression of SIRT7 gene observed may be an effect of incorrect balance between redox response mechanisms and the higher oxidative stress described for these pathologies.
The diverse expression patterns of sirtuins among groups reveals not only a clinical, diagnosis-specific profile, but also an age dependent feature. Figure 4 presents a scheme of alterations and proposed compensatory responses by sirtuin expression in aging and in environmental and metabolic circumstances reflecting pathological and physiological conditions.

4. Materials and Methods

4.1. Patients

Under a protocol approved by the Ethics Committee of the Universidad de La Laguna, women undergoing ovulation induction for oocyte donation or IVF consented to join this study. Upon reaching the target follicle sizes and receiving 250 µg of hCG, the harvesting of oocytes was by standard methods, see below. After removal of the oocyte from the petri dish, the accompanying mural granulosa-lutein cells were set aside for evaluation, see below. Clinical information included the doses of exogenous follicle stimulating hormone (FSH) and luteinizing hormone (LH) administered, and IVF parameters related to ovarian response to ovulation induction (number of total and mature oocytes retrieved, estradiol concentration on the last day of stimulation, and total number of days of stimulation).

4.1.1. Study 1: Women with No Ovarian Factor

Fifty-six women between 18 and 44 years of age (yo) with no ovarian factor were grouped as: women between 27 and 39 yo with tubal or male factor and no ovarian factor (NOF; n = 24); women ≥40 yo with tubal or male factor and no ovarian factor (≥40 yo; n = 15); and oocyte donors between 18 and 27 yo (OD, n = 17).

4.1.2. Study 2: Women with Different Infertility Diagnosis Compared to NOF

Seventy-four patients were grouped as being between 27 and 39 yo with tubal or male factor and no ovarian factor (NOF; n = 24); women <40 yo defined as poor responders according to the European Society of Human Reproduction and Embryology (ESHRE) criteria [52] (PRs; n = 16); women with American Society for Reproductive Medicine (ASRM) [70] stages III and IV endometriosis, with histologic diagnosis (EM; n = 18); polycystic ovarian syndrome (PCOS; n = 16) was defined according to the Rotterdam criteria [71]. Patient demographics and the most relevant clinical characteristics of these sub-groups are shown in Table 1.

4.2. Ovulation Induction and Intracytoplasmic Sperm Injection (ICSI)

Ovarian stimulation was carried out with an agonist or antagonist protocol using recombinant FSH (Gonal F, Serono, Madrid, Spain), combined with recombinant LH (Luveris, Serono, Madrid, Spain) or human menopausal gonadotropins (hMG,Lepori; Farma-Lepori, Madrid, Spain or Menopur, Ferring, Madrid, Spain). Initial doses were chosen based on patients’ age and infertility diagnosis. Ovulation induction was monitored by serial ultrasounds and serum estradiol and progesterone levels. Doses were adjusted to the individual patient’s response. Ultrasound-guided egg retrieval was performed 36 h after administration of 250 µg of recombinant human chorionic gonadotropin (hCG; Serono, Madrid, Spain) or 10,000 IU of urinary hCG (Farma-Lepori, Madrid, Spain). In all cases, the fertilization method for the mature oocytes retrieved was intracytoplasmic sperm injection. Embryo transfer was carried out with a Wallace catheter under ultrasound guidance. All retrievals were performed by the same experienced operator.

4.3. Isolation of hGL Cells

Mural hGL cells were collected from follicular fluid (FF) obtained during ultrasound-guided transvaginal oocyte retrieval. After removal of the oocyte, FFs from each patient were pooled, and the hGL cells lightly centrifuged. Cells were then washed in “isolation medium” (Medium 199 (Sigma-Aldrich, Missouri, MI, USA), supplemented with sodium bicarbonate (3.7 g/L) (Sigma-Aldrich), penicillin (59 mg/L) (Sigma-Aldrich), streptomycin (100 mg/L) (Sigma-Aldrich), amphotericin B (25 mg/L) (Sigma-Aldrich), L-glutamine (0.29 g/L) (Sigma-Aldrich), and bovine serum albumin (0.1%) (Sigma-Aldrich) and separated from red blood cells using a 50% Percoll (Sigma-Aldrich) gradient. Leukocytes were removed using anti-CD45-coated magnetic beads (Dynabeads M-450 CD45; Dynal ASA, Oslo, Norway) and cellular viability was confirmed by trypan blue exclusion. In all cases, it was greater than 95%.

4.4. Extraction of RNA

Total RNA from individual patients was extracted using Aurum total RNA mini kit (Bio-Rad Laboratories, California, CA, USA) following the manufacturer’s instructions.

4.5. Synthesis of Complementary DNA

RNA was reverse transcribed using “iScript cDNA Synthesis kit” (Bio-Rad Laboratories) following the manufacturer’s instructions. Total RNA was reverse transcribed in 20 µL as follows: 25 °C for 5 min and 42 °C for 30 min. The reverse transcriptase was inactivated by heating at 85 °C for 5 min.

4.6. Quantitative Reverse Transcription Polymerase Chain Reaction

Quantitative reverse transcription polymerase chain reaction of complementary DNA (PCR) was employed to study the relative expression of sirtuin genes in hGL cells. All PCR was carried out using a BioRad CFX96 real-time PCR system (Bio-Rad Laboratories). The specific primers used for each sirtuin gene and the housekeeping β-actin gene used as a reference for mRNA quantification are listed in Table 3. The amplification reactions were performed in a 10 µL final volume containing 2× SsoFast EvaGreen Supermix (100 mmol/L KCl, 40 mmol/L Tris- HCl pH 8.4, 0.4 mmol/L of each nucleoside triphosphate, iTaq DNA polymerase 50 U/mL, 6 mmol/L MgCl2, SYBR Green I, 20 nmol/L fluorescein, and stabilizers (Bio-Rad Laboratories) and 0.4 µmol/L of each primer.
Each sample was analyzed in triplicate, and multiple water blanks were included in the analysis. The thermal profile used for the analysis was as follows: after a 3-min denaturation at 95 °C, 40 cycles of PCR were performed at 95 °C for 5 s and 59 °C for 5 s. Finally, a melting curve program at 65 °C to 95 °C was carried out with a heating rate of 0.1 °C/s and read every 0.5 °C. Expression levels of the genes studied are presented as individual data points as 2−ΔCT [72]. Gene expression values are expressed as x105 relative to β-actin expression.

4.7. Statistical Analysis

Statistical analysis was performed with SPSS 23 software (IBM, New York, NY, USA). Descriptive statistics (mean and standard error (SE) are reported. One-way ANOVA followed by Tukey and Bonferroni post hoc tests were used to carry out comparisons between diagnostic groups. A Spearman rank correlation coefficient was used to assess the relationship between continuous variables. An experiment-wise α of 0.05 was chosen.

Author Contributions

J.Á. designed the study; was responsible for interpreting the results and writing the manuscript. A.P. recruited and managed the patients; supervised the clinical activities and was responsible for interpreting the results and writing the manuscript. R.G.-F. performed experimental procedures; analyzed the data and performed the statistical analysis and contributed to writing the manuscript. D.R. performed experimental procedures. R.M.-R. performed experimental procedures; analyzed the data and performed the statistical analysis. J.H. collected clinical data and IVF laboratory samples from patients. P.M.-V. and F.N., contributed to the interpretation of the results and final review of the manuscript. All authors discussed the results and implications of the study. All authors revised, edited and approved the manuscript and revisions.

Funding

This research was funded by Instituto de Salud Carlos III, grant number PI12/00729, by Universidad de La Laguna, grant Proyecto Puente al Plan Estatal 2018, and by a FPI PhD fellowship from the Agencia Canaria de Investigación, Innovación y Sociedad de la Información (ACIISI) cofounded by the European Social Found, to R.M-R.

Acknowledgments

The authors thank the collaboration of the laboratory and paramedical staff of Centro de Asistencia a la Reproducción Humana de Canarias.

Conflicts of Interest

The authors declare no conflict of interest. The funders had no role in the design of the study; in the collection, analyses, or interpretation of data; in the writing of the manuscript, or in the decision to publish the results.

Abbreviations

DaysTotal number of days of stimulation
FFFollicular fluid
FSHFollicle stimulating hormone
hCGHuman chorionic gonadotropin
hGLHuman granulosa-lutein cells
hMGHuman menopausal gonadotropins
ICSIIntracytoplasmic sperm injection
IVFIn vitro fertilization
LHLuteinizing hormone
ODOocyte donors
NOFWomen with no ovarian factor
PCOSPolycystic ovarian syndrome
Peak E2Estradiol concentration on the last day of stimulation
PRPoor responders
rFSHRecombinant follicle stimulating hormone
rLHRecombinant luteinizing hormone
SIRTSirtuin
UIInternational unit
≥40 yoWomen ≥40 years old with tubal or male factor and no ovarian factor

References

  1. Morris, B.J. Seven sirtuins for seven deadly diseases of aging. Free Radic. Biol. Med. 2013, 56, 133–171. [Google Scholar] [CrossRef]
  2. Schemies, J.; Uciechowska, U.; Sippl, W.; Jung, M. NAD (+) -dependent histone deacetylases (sirtuins) as novel therapeutic targets. Med. Res. Rev. 2010, 30, 861–889. [Google Scholar] [CrossRef] [PubMed]
  3. Van de Ven, R.A.H.; Santos, D.; Haigis, M.C. Mitochondrial Sirtuins and Molecular Mechanisms of Aging. Trends Mol. Med. 2017, 23, 320–331. [Google Scholar] [CrossRef] [PubMed] [Green Version]
  4. Roessler, C.; Tuting, C.; Meleshin, M.; Steegborn, C.; Schutkowski, M. A Novel Continuous Assay for the Deacylase Sirtuin 5 and Other Deacetylases. J. Med. Chem. 2015, 58, 7217–7223. [Google Scholar] [CrossRef] [PubMed]
  5. Alageel, A.; Tomasi, J.; Tersigni, C.; Brietzke, E.; Zuckerman, H.; Subramaniapillai, M.; Lee, Y.; Iacobucci, M.; Rosenblat, J.D.; Mansur, R.B.; et al. Evidence supporting a mechanistic role of sirtuins in mood and metabolic disorders. Prog. Neuropsychopharmacol. Biol. Psychiatry 2018, 86, 95–101. [Google Scholar] [CrossRef] [PubMed]
  6. Mei, Z.; Zhang, X.; Yi, J.; Huang, J.; He, J.; Tao, Y. Sirtuins in metabolism, DNA repair and cancer. J. Exp. Clin. Cancer Res. 2016, 35, 182. [Google Scholar] [CrossRef] [Green Version]
  7. Parodi-Rullan, R.M.; Chapa-Dubocq, X.R.; Javadov, S. Acetylation of Mitochondrial Proteins in the Heart: The Role of SIRT3. Front. Physiol. 2018, 9, 1094. [Google Scholar] [CrossRef] [Green Version]
  8. Pinho, A.V.; Mawson, A.; Gill, A.; Arshi, M.; Warmerdam, M.; Giry-Laterriere, M.; Eling, N.; Lie, T.; Kuster, E.; Camargo, S.; et al. Sirtuin 1 stimulates the proliferation and the expression of glycolysis genes in pancreatic neoplastic lesions. Oncotarget 2016, 7, 74768–74778. [Google Scholar] [CrossRef] [Green Version]
  9. Michishita, E.; Park, J.Y.; Burneskis, J.M.; Barrett, J.C.; Horikawa, I. Evolutionarily conserved and nonconserved cellular localizations and functions of human SIRT proteins. Mol. Biol. Cell 2005, 16, 4623–4635. [Google Scholar] [CrossRef] [Green Version]
  10. Tanno, M.; Sakamoto, J.; Miura, T.; Shimamoto, K.; Horio, Y. Nucleocytoplasmic shuttling of the NAD+-dependent histone deacetylase SIRT1. J. Biol. Chem. 2007, 282, 6823–6832. [Google Scholar] [CrossRef] [Green Version]
  11. Yeung, F.; Hoberg, J.E.; Ramsey, C.S.; Keller, M.D.; Jones, D.R.; Frye, R.A.; Mayo, M.W. Modulation of NF-kappaB-dependent transcription and cell survival by the SIRT1 deacetylase. EMBO J. 2004, 23, 2369–2380. [Google Scholar] [CrossRef] [PubMed] [Green Version]
  12. Zhang, Z.; Lowry, S.F.; Guarente, L.; Haimovich, B. Roles of SIRT1 in the acute and restorative phases following induction of inflammation. J. Biol. Chem. 2010, 285, 41391–41401. [Google Scholar] [CrossRef] [PubMed] [Green Version]
  13. Tran, D.; Bergholz, J.; Zhang, H.; He, H.; Wang, Y.; Zhang, Y.; Li, Q.; Kirkland, J.L.; Xiao, Z.X. Insulin-like growth factor-1 regulates the SIRT1-p53 pathway in cellular senescence. Aging Cell 2014, 13, 669–678. [Google Scholar] [CrossRef] [PubMed]
  14. Vaziri, H.; Dessain, S.K.; Ng, E.E.; Imai, S.I.; Frye, R.A.; Pandita, T.K.; Guarente, L.; Weinberg, R.A. hSIR2 (SIRT1) functions as an NAD-dependent p53 deacetylase. Cell 2001, 107, 149–159. [Google Scholar] [CrossRef] [Green Version]
  15. Picard, F.; Kurtev, M.; Chung, N.; Topark-Ngarm, A.; Senawong, T.; De Machado, O.R.; Leid, M.; McBurney, M.W.; Guarente, L. Sirt1 promotes fat mobilization in white adipocytes by repressing PPAR-gamma. Nature 2004, 429, 771–776. [Google Scholar] [CrossRef] [PubMed]
  16. Burnett, C.; Valentini, S.; Cabreiro, F.; Goss, M.; Somogyvari, M.; Piper, M.D.; Hoddinott, M.; Sutphin, G.L.; Leko, V.; McElwee, J.J.; et al. Absence of effects of Sir2 overexpression on lifespan in C. elegans and Drosophila. Nature 2011, 477, 482–485. [Google Scholar] [CrossRef] [Green Version]
  17. Fu, H.; Wada-Hiraike, O.; Hirano, M.; Kawamura, Y.; Sakurabashi, A.; Shirane, A.; Morita, Y.; Isono, W.; Oishi, H.; Koga, K.; et al. SIRT3 positively regulates the expression of folliculogenesis- and luteinization-related genes and progesterone secretion by manipulating oxidative stress in human luteinized granulosa cells. Endocrinology 2014, 155, 3079–3087. [Google Scholar] [CrossRef] [Green Version]
  18. Zhao, F.; Zhao, W.; Ren, S.; Fu, Y.; Fang, X.; Wang, X.; Li, B. Roles of SIRT1 in granulosa cell apoptosis during the process of follicular atresia in porcine ovary. Anim. Reprod. Sci. 2014, 151, 34–41. [Google Scholar] [CrossRef]
  19. Zhang, X.M.; Li, L.; Xu, J.J.; Wang, N.; Liu, W.J.; Lin, X.H.; Fu, Y.C.; Luo, L.L. Rapamycin preserves the follicle pool reserve and prolongs the ovarian lifespan of female rats via modulating mTOR activation and sirtuin expression. Gene 2013, 523, 82–87. [Google Scholar] [CrossRef]
  20. Hsu, W.W.; Wu, B.; Liu, W.R. Sirtuins 1 and 2 Are Universal Histone Deacetylases. ACS Chem. Biol. 2016, 11, 792–799. [Google Scholar] [CrossRef]
  21. Skoge, R.H.; Dolle, C.; Ziegler, M. Regulation of SIRT2-dependent alpha-tubulin deacetylation by cellular NAD levels. DNA Repair 2014, 23, 33–38. [Google Scholar] [CrossRef] [PubMed]
  22. Hoffmann, G.; Breitenbucher, F.; Schuler, M.; Ehrenhofer-Murray, A.E. A novel sirtuin 2 (SIRT2) inhibitor with p53-dependent pro-apoptotic activity in non-small cell lung cancer. J. Biol. Chem. 2014, 289, 5208–5216. [Google Scholar] [CrossRef] [PubMed] [Green Version]
  23. Wang, F.; Nguyen, M.; Qin, F.X.; Tong, Q. SIRT2 deacetylates FOXO3a in response to oxidative stress and caloric restriction. Aging Cell 2007, 6, 505–514. [Google Scholar] [CrossRef] [PubMed]
  24. Wang, F.; Chan, C.H.; Chen, K.; Guan, X.; Lin, H.K.; Tong, Q. Deacetylation of FOXO3 by SIRT1 or SIRT2 leads to Skp2-mediated FOXO3 ubiquitination and degradation. Oncogene 2012, 31, 1546–1557. [Google Scholar] [CrossRef]
  25. Ahn, B.H.; Kim, H.S.; Song, S.; Lee, I.H.; Liu, J.; Vassilopoulos, A.; Deng, C.X.; Finkel, T. A role for the mitochondrial deacetylase Sirt3 in regulating energy homeostasis. Proc. Natl. Acad. Sci. USA 2008, 105, 14447–14452. [Google Scholar] [CrossRef] [Green Version]
  26. Rardin, M.J.; Newman, J.C.; Held, J.M.; Cusack, M.P.; Sorensen, D.J.; Li, B.; Schilling, B.; Mooney, S.D.; Kahn, C.R.; Verdin, E.; et al. Label-free quantitative proteomics of the lysine acetylome in mitochondria identifies substrates of SIRT3 in metabolic pathways. Proc. Natl. Acad. Sci. USA 2013, 110, 6601–6606. [Google Scholar] [CrossRef] [Green Version]
  27. Alhazzazi, T.Y.; Kamarajan, P.; Xu, Y.; Ai, T.; Chen, L.; Verdin, E.; Kapila, Y.L. A Novel Sirtuin-3 Inhibitor, LC-0296, Inhibits Cell Survival and Proliferation, and Promotes Apoptosis of Head and Neck Cancer Cells. Anticancer Res. 2016, 36, 49–60. [Google Scholar]
  28. Chen, Y.; Zhang, J.; Lin, Y.; Lei, Q.; Guan, K.L.; Zhao, S.; Xiong, Y. Tumour suppressor SIRT3 deacetylates and activates manganese superoxide dismutase to scavenge ROS. EMBO Rep. 2011, 12, 534–541. [Google Scholar] [CrossRef]
  29. McDonnell, E.; Peterson, B.S.; Bomze, H.M.; Hirschey, M.D. SIRT3 regulates progression and development of diseases of aging. Trends Endocrinol. Metab. 2015, 26, 486–492. [Google Scholar] [CrossRef] [Green Version]
  30. Di, E.G.; Falone, S.; Vitti, M.; D’Alessandro, A.M.; Vento, M.; Di, P.C.; Amicarelli, F.; Tatone, C. SIRT1 signalling protects mouse oocytes against oxidative stress and is deregulated during aging. Hum. Reprod. 2014, 29, 2006–2017. [Google Scholar]
  31. Liu, M.; Yin, Y.; Ye, X.; Zeng, M.; Zhao, Q.; Keefe, D.L.; Liu, L. Resveratrol protects against age-associated infertility in mice. Hum. Reprod. 2013, 28, 707–717. [Google Scholar] [CrossRef] [PubMed] [Green Version]
  32. Pacella-Inc, L.; Zander-Fox, D.L.; Lan, M. Mitochondrial SIRT3 and its target glutamate dehydrogenase are altered in follicular cells of women with reduced ovarian reserve or advanced maternal age. Hum. Reprod. 2014, 29, 1490–1499. [Google Scholar] [CrossRef] [PubMed] [Green Version]
  33. Laurent, G.; German, N.J.; Saha, A.K.; de Boer, V.C.; Davies, M.; Koves, T.R.; Dephoure, N.; Fischer, F.; Boanca, G.; Vaitheesvaran, B.; et al. SIRT4 coordinates the balance between lipid synthesis and catabolism by repressing malonyl CoA decarboxylase. Mol. Cell 2013, 50, 686–698. [Google Scholar] [CrossRef] [PubMed] [Green Version]
  34. Nasrin, N.; Wu, X.; Fortier, E.; Feng, Y.; Bare, O.C.; Chen, S.; Ren, X.; Wu, Z.; Streeper, R.S.; Bordone, L. SIRT4 regulates fatty acid oxidation mitochondrial gene expression in liver muscle cells. J. Biol. Chem. 2010, 285, 31995–32002. [Google Scholar] [CrossRef] [PubMed] [Green Version]
  35. Haigis, M.C.; Mostoslavsky, R.; Haigis, K.M.; Fahie, K.; Christodoulou, D.C.; Murphy, A.J.; Valenzuela, D.M.; Yancopoulos, G.D.; Karow, M.; Blander, G.; et al. SIRT4 inhibits glutamate dehydrogenase and opposes the effects of calorie restriction in pancreatic beta cells. Cell 2006, 126, 941–954. [Google Scholar] [CrossRef] [PubMed] [Green Version]
  36. Schlicker, C.; Gertz, M.; Papatheodorou, P.; Kachholz, B.; Becker, C.F.; Steegborn, C. Substrates and regulation mechanisms for the human mitochondrial sirtuins Sirt3 and Sirt5. J. Mol. Biol. 2008, 382, 790–801. [Google Scholar] [CrossRef]
  37. Gertz, M.; Steegborn, C. Function and regulation of the mitochondrial sirtuin isoform Sirt5 in Mammalia. Biochim. Biophys. Acta 2010, 1804, 1658–1665. [Google Scholar] [CrossRef]
  38. Nakagawa, T.; Guarente, L. Urea cycle regulation by mitochondrial sirtuin, SIRT5. Aging 2009, 1, 578–581. [Google Scholar] [CrossRef] [Green Version]
  39. Zhou, L.; Wang, F.; Sun, R.; Chen, X.; Zhang, M.; Xu, Q.; Wang, Y.; Wang, S.; Xiong, Y.; Guan, K.L.; et al. SIRT5 promotes IDH2 desuccinylation and G6PD deglutarylation to enhance cellular antioxidant defense. EMBO Rep. 2016, 17, 811–822. [Google Scholar] [CrossRef]
  40. Pacella-Inc, L.; Zander-Fox, D.L.; Lane, M. Mitochondrial SIRT5 is present in follicular cells and is altered by reduced ovarian reserve and advanced maternal age. Reprod. Fertil. Dev. 2014, 26, 1072–1083. [Google Scholar] [CrossRef]
  41. Cea, M.; Cagnetta, A.; Adamia, S.; Acharya, C.; Tai, Y.T.; Fulciniti, M.; Ohguchi, H.; Munshi, A.; Acharya, P.; Bhasin, M.K.; et al. Evidence for a role of the histone deacetylase SIRT6 in DNA damage response of multiple myeloma cells. Blood 2016, 127, 1138–1150. [Google Scholar] [CrossRef] [PubMed] [Green Version]
  42. Kawahara, T.L.; Rapicavoli, N.A.; Wu, A.R.; Qu, K.; Quake, S.R.; Chang, H.Y. Dynamic chromatin localization of Sirt6 shapes stress- and aging-related transcriptional networks. PLoS Genet. 2011, 7, e1002153. [Google Scholar] [CrossRef] [PubMed] [Green Version]
  43. McCord, R.A.; Michishita, E.; Hong, T.; Berber, E.; Boxer, L.D.; Kusumoto, R.; Guan, S.; Shi, X.; Gozani, O.; Burlingame, A.L.; et al. SIRT6 stabilizes DNA-dependent protein kinase at chromatin for DNA double-strand break repair. Aging 2009, 1, 109–121. [Google Scholar] [CrossRef] [PubMed] [Green Version]
  44. Nagai, K.; Matsushita, T.; Matsuzaki, T.; Takayama, K.; Matsumoto, T.; Kuroda, R.; Kurosaka, M. Depletion of SIRT6 causes cellular senescence, DNA damage, and telomere dysfunction in human chondrocytes. Osteoarthr. Cartil. 2015, 23, 1412–1420. [Google Scholar] [CrossRef] [PubMed] [Green Version]
  45. Kanfi, Y.; Naiman, S.; Amir, G.; Peshti, V.; Zinman, G.; Nahum, L.; Bar-Joseph, Z.; Cohen, H.Y. The sirtuin SIRT6 regulates lifespan in male mice. Nature 2012, 483, 218–221. [Google Scholar] [CrossRef] [PubMed]
  46. Ford, E.; Voit, R.; Liszt, G.; Magin, C.; Grummt, I.; Guarente, L. Mammalian Sir2 homolog SIRT7 is an activator of RNA polymerase I transcription. Genes Dev. 2006, 20, 1075–1080. [Google Scholar] [CrossRef] [Green Version]
  47. Grob, A.; Roussel, P.; Wright, J.E.; McStay, B.; Hernandez-Verdun, D.; Sirri, V. Involvement of SIRT7 in resumption of rDNA transcription at the exit from mitosis. J. Cell Sci. 2009, 122, 489–498. [Google Scholar] [CrossRef] [Green Version]
  48. Percipalle, P.; Fomproix, N.; Cavellan, E.; Voit, R.; Reimer, G.; Kruger, T.; Thyberg, J.; Scheer, U.; Grummt, I.; Farrants, A.K. The chromatin remodelling complex WSTF-SNF2h interacts with nuclear myosin 1 and has a role in RNA polymerase I transcription. EMBO Rep. 2006, 7, 525–530. [Google Scholar] [CrossRef]
  49. Hubbi, M.E.; Hu, H.; Kshitiz Gilkes, D.M.; Semenza, G.L. Sirtuin-7 inhibits the activity of hypoxia-inducible factors. J. Biol. Chem. 2013, 288, 20768–20775. [Google Scholar] [CrossRef] [Green Version]
  50. Kiran, S.; Oddi, V.; Ramakrishna, G. Sirtuin 7 promotes cellular survival following genomic stress by attenuation of DNA damage, SAPK activation and p53 response. Exp. Cell Res. 2015, 331, 123–141. [Google Scholar] [CrossRef]
  51. Shin, J.; He, M.; Liu, Y.; Paredes, S.; Villanova, L.; Brown, K.; Qiu, X.; Nabavi, N.; Mohrin, M.; Wojnoonski, K.; et al. SIRT7 represses Myc activity to suppress ER stress and prevent fatty liver disease. Cell Rep. 2013, 5, 654–665. [Google Scholar] [CrossRef] [PubMed] [Green Version]
  52. Ferraretti, A.P.; La, M.A.; Fauser, B.C.; Tarlatzis, B.; Nargund, G.; Gianaroli, L. ESHRE consensus on the definition of ‘poor response’ to ovarian stimulation for in vitro fertilization: The Bologna criteria. Hum. Reprod. 2011, 26, 1616–1624. [Google Scholar] [CrossRef] [PubMed] [Green Version]
  53. Ku, S.Y.; Suh, C.S.; Kim, S.H.; Choi, Y.M.; Kim, J.G.; Moon, S.Y. A pilot study of the use of low dose human menopausal gonadotropin in ovulation induction. Eur. J. Obstet. Gynecol. Reprod. Biol. 2003, 109, 55–59. [Google Scholar] [CrossRef]
  54. Lopez-Otin, C.; Blasco, M.A.; Partridge, L.; Serrano, M.; Kroemer, G. The hallmarks of aging. Cell 2013, 153, 1194–1217. [Google Scholar] [CrossRef] [PubMed] [Green Version]
  55. Vijg, J.; Kennedy, B.K. The Essence of Aging. Gerontology 2016, 62, 381–385. [Google Scholar] [CrossRef] [Green Version]
  56. Qiu, D.; Hou, X.; Han, L.; Li, X.; Ge, J.; Wang, Q. Sirt2-BubR1 acetylation pathway mediates the effects of advanced maternal age on oocyte quality. Aging Cell 2018, 17, 10. [Google Scholar] [CrossRef] [Green Version]
  57. Tatone, C.; Di, E.G.; Barbonetti, A.; Carta, G.; Luciano, A.M.; Falone, S.; Amicarelli, F. Sirtuins in gamete biology and reproductive physiology: Emerging roles and therapeutic potential in female and male infertility. Hum. Reprod. Update 2018, 24, 267–289. [Google Scholar] [CrossRef]
  58. Zhang, L.; Hou, X.; Ma, R.; Moley, K.; Schedl, T.; Wang, Q. Sirt2 functions in spindle organization and chromosome alignment in mouse oocyte meiosis. FASEB J. 2014, 28, 1435–1445. [Google Scholar] [CrossRef] [Green Version]
  59. Tatone, C.; Di, E.G.; Vitti, M.; Di, C.M.; Santini, S., Jr.; D’Alessandro, A.M.; Falone, S.; Amicarelli, F. Sirtuin Functions in Female Fertility: Possible Role in Oxidative Stress and Aging. Oxid. Med. Cell Longev. 2015. [Google Scholar] [CrossRef] [Green Version]
  60. Avila, J.; Gonzalez-Fernandez, R.; Rotoli, D.; Hernandez, J.; Palumbo, A. Oxidative Stress in Granulosa-Lutein Cells From In Vitro Fertilization Patients. Reprod. Sci. 2016, 23, 1656–1661. [Google Scholar] [CrossRef]
  61. Gonzalez-Fernandez, R.; Hernandez, J.; Martin-Vasallo, P.; Puopolo, M.; Palumbo, A.; Avila, J. Expression Levels of the Oxidative Stress Response Gene ALDH3A2 in Granulosa-Lutein Cells Are Related to Female Age and Infertility Diagnosis. Reprod. Sci. 2016, 23, 604–609. [Google Scholar] [CrossRef] [PubMed]
  62. Guedouari, H.; Daigle, T.; Scorrano, L.; Hebert-Chatelain, E. Sirtuin 5 protects mitochondria from fragmentation and degradation during starvation. Biochim. Biophys. Acta Mol. Cell Res. 2017, 1864, 169–176. [Google Scholar] [CrossRef] [PubMed]
  63. Park, J.; Chen, Y.; Tishkoff, D.X.; Peng, C.; Tan, M.; Dai, L.; Xie, Z.; Zhang, Y.; Zwaans, B.M.; Skinner, M.E.; et al. SIRT5-mediated lysine desuccinylation impacts diverse metabolic pathways. Mol. Cell 2013, 50, 919–930. [Google Scholar] [CrossRef] [PubMed] [Green Version]
  64. Acosta, E.; Peña, O.; Naftolin, F.; Avila, J.; Palumbo, A. Angiotensin II induces apoptosis in human mural granulosa-lutein cells, but not in cumulus cells. Fertil. Steril. 2009, 91, 1984–1989. [Google Scholar] [CrossRef]
  65. Peña, O.; Palumbo, A.; González-Fernández, R.; Hernández, J.; Naftolin, F.; Avila, J. Expression of angiotensin II type 1 (AT1) and angiotensin II type 2 (AT2) receptors in human granulosa-lutein (GL) cells: Correlation with infertility diagnoses. Fertil. Steril. 2010, 93, 1601–1608. [Google Scholar] [CrossRef]
  66. Karakaya, C.; Guzeloglu-Kayisli, O.; Uyar, A.; Kallen, A.N.; Babayev, E.; Bozkurt, N.; Unsal, E.; Karabacak, O.; Seli, E. Poor ovarian response in women undergoing in vitro fertilization is associated with altered microRNA expression in cumulus cells. Fertil. Steril. 2015, 103, 1469–1476. [Google Scholar] [CrossRef] [Green Version]
  67. Burnik Papler, T.; Vrtačnik Bokal, E.; Prosenc Zmrzljak, U.; Stimpfel, M.; Laganà, A.S.; Ghezzi, F.; Jančar, N. PGR and PTX3 gene expression in cumulus cells from obese and normal weighting women after administration of long-acting recombinant follicle-stimulating hormone for controlled ovarian stimulation. Arch. Gynecol. Obstet. 2019, 299, 863–871. [Google Scholar] [CrossRef]
  68. Snider, A.P.; Wood, J.R. Obesity Induces Ovarian Inflammation and Reduces Oocyte Quality. Reproduction 2019, 158, R79–R90. [Google Scholar] [CrossRef] [Green Version]
  69. Vazquez, B.N.; Thackray, J.K.; Serrano, L. Sirtuins and DNA damage repair: SIRT7 comes to play. Nucleus 2017, 8, 107–115. [Google Scholar] [CrossRef] [Green Version]
  70. Revised American Society for Reproductive Medicine classification of endometriosis. Fertil. Steril. 1997, 67, 817–821. [CrossRef]
  71. Revised 2003 consensus on diagnostic criteria and long-term health risks related to polycystic ovary syndrome (PCOS). Hum. Reprod. 2004, 19, 41–47. [CrossRef] [PubMed] [Green Version]
  72. Schmittgen, T.D.; Livak, K.J. Analyzing real-time PCR data by the comparative C (T) method. Nat. Protoc. 2008, 3, 1101–1108. [Google Scholar] [CrossRef] [PubMed]
Figure 1. Histogram representation of expression levels of sirtuin genes in OD, NOF and >40 groups. Statistically significant different means (optical densities) compared to the control group are marked by an asterisk (*).
Ijms 21 00295 g001
Figure 2. Graphic representation of correlation between SIRT2, SIRT5 and SIRT7 and age.
Ijms 21 00295 g002
Figure 3. Histogram representation of expression levels of sirtuin-1–7 gene expression in NOF, EM, PR and PCOS groups. Statistically significant different means with respect to the NOF group are marked by an asterisk (*).
Ijms 21 00295 g003
Figure 4. Scheme of alterations in NOF and PR groups and possible sirtuins’ roles. According to our studies, NOF women between 18 to 38 years old may avoid OS damage by OSR, triggering a normal signaling response and maintaining an equilibrated OS/OSR status (A). It is possible that this equilibrium favors OS during pre-menopausal aging (B). In that case, OSR are not sufficient to protect cells from OS actions and SIRT1, SIRT2 and SIRT5 gene expression increase would be required to recover homeostasis. Failing this response, women poor responders show a different sirtuin pattern (C). In this group, women between 25 to 38 years old have an imbalance between OS and OSR similar to older NOF women. Cellular attempts to reach homeostasis by increasing SIRT1, SIRT2 and SIRT5 gene expression are insufficient and it is necessary activate protein, lipid and DNA repair mechanisms and others sirtuins’ expression. Despite the fact that SIRT6 and SIRT7 gene expression increase, cells cannot response to signaling and homeostasis cannot be recovered, leading to a clinically poor response to follicle stimulation.
Ijms 21 00295 g004
Table 1. Clinical and IVF cycle parameters are shown per group.
ParametersOD≥40 yoNOFEMPRPCOS
N of patients171524181616
Age22 ± 1 a41 ± 1 b34 ± 1 c36 ± 1 c36 ± 1 c33 ± 1 c
Days11 ± 1 a11 ± 1 a11 ± 1 a11 ± 1 a11 ± 1 a10 ± 1 a
rFSH (IU)2812 ± 255 a5750 ± 560 b3199 ± 391 a5622 ± 442 b6154 ± 397 b1723 ± 143 a
rLH (IU)1081 ± 161 a2645 ± 335 b1115 ± 13 a2606 ± 263 b2981 ± 274 b430 ± 70 a
Peak E2 (pg/mL)3171 ± 307 a2797 ± 188 a3054 ± 230 a2763 ± 298 a2032 ± 214 a2901 ± 321 a
Total oocytes25 ± 2 a13 ± 2 c/d17 ± 2 b/c9 ± 1 c/d6 ± 1 d21 ± 2 a/b
Mature oocytes20 ± 2 a11 ± 2 c/d13 ± 1 b/c8 ± 1 c/d5 ± 1 d18 ± 2 a/b
Results are expressed as mean ± standard error. Different lowercase letters (a, b, c and d) represent statistically significant different means. OD (oocyte donors between 18 and 27 yo), ≥40 yo (women ≥40 yo with tubal or male factor and no ovarian factor), NOF (women between 27 and 39 yo with tubal or male factor and no ovarian factor), EM (endometriosis), PR (women < 40 yo defined as poor responders) and PCOS (polycystic ovarian syndrome).
Table 2. Expression levels of sirtuin-1–7 genes by diagnostic group.
Study 1Study 2
GeneODNOF≥40NOFEMPRPCOS
SIRT1225.2 ± 46.0 a169.1 ± 11.7 a478.3 ± 111.1 b169.1 ± 11.7 a139.3 ± 16.2 a166.4 ± 30.2 a138.5 ± 36.4 a
SIRT2271.4 ± 36.6 a161 ± 16.1 a600.1 ± 97.0 b161 ± 16.1 a637.5 ± 57.1 b/c793.0 ± 97.7 b460.4 ± 68.5 c
SIRT370.8 ± 8.9 a72.1 ± 3.1 a115.3 ± 27.6 a72.1 ± 3.1 a117.7 ± 14.7 a/b150.9 ± 34.3 b84.3 ± 14.3 a/b
SIRT42.5 ± 0.6 a4.3 ± 0.3 a2.7 ± 0.9 a4.3 ± 0.3 a1.9 ± 0.2 a3.6 ± 0.9 a2.01 ± 0.6 a
SIRT583.2 ±10.5 a79.2 ± 4.9 a171.6 ± 37.2 b79.2 ± 4.9 a143.8 ± 18.1 a/b169.7 ± 22.2 b146.8 ± 20.3 a/b
SIRT63.2 ± 0.7 a4.4 ± 0.5 a2.5 ± 0.5 a4.4 ± 0.5 a6.3 ± 1.3 a13.8 ± 3.8 b4.7 ± 1.6 a
SIRT732.7 ± 7.3 a68.6 ± 8.8 a66.5 ± 14.5 a68.6 ± 8.8 a104.9 ± 11.3 a151.2 ± 30.8 b91.4 ± 17.2 a/b
Results were determined by qRT-PCR and are expressed as mean ± standard error. Different lowercase letters (a, b and c) represent statistically significant differences of the means in each study. Gene expression values are ×105 relative to β-actin expression.
Table 3. RT-PCR primers for sirtuin genes (1–7) and β-actin.
GeneOligonucleotideSequence (5′→3′)Tm (°C)
SIRT1SIRT1-FCTATACCCAGAACATAGACACG54.1
SIRT1-RACAAATCAGGCAAGATGC54.5
SIRT2SIRT2-FCCATCTGTCACTACTTCATGC55.8
SIRT2-RAAGTCCTCCTGTTCCAGC55.1
SIRT3SIRT3-FGCTGGACAGAAGAGATGC54.1
SIRT3-RGTGGATGTCTCCTATGTTACC47.6
SIRT4SIRT4-FCAGATGTCGTTTTCTTCG44.4
SIRT4-RCCAGAGTATACCTGCAAGG52.6
SIRT5SIRT5-FCCCAGAACATCGATGAGC55.6
SIRT5-RGCCACAACTCCACAAGAGG57.9
SIRT6SIRT6-FAGGGACAAACTGGCAGAGC60.4
SIRT6-RTTAGCCACGGTGCAGAGC61.1
SIRT7SIRT7-FGCAGAGCAGACACCATCC57.7
SIRT7-RGTTCACGATGTAAAGCTTCG56.1
β-ActinACTB-FCTTCCTTCCTGGGCATGG61.6
ACTB-RGCCGCCAGACAGCACTGT63.7

