Non-Linear Quantitative Structure–Activity Relationships Modelling, Mechanistic Study and In-Silico Design of Flavonoids as Potent Antioxidants


Abstract
:
1. Introduction
2. Results and Discussion
2.1. Linear PLS-QSAR Model
2.2. Interpretation of the PLS-QSAR Model
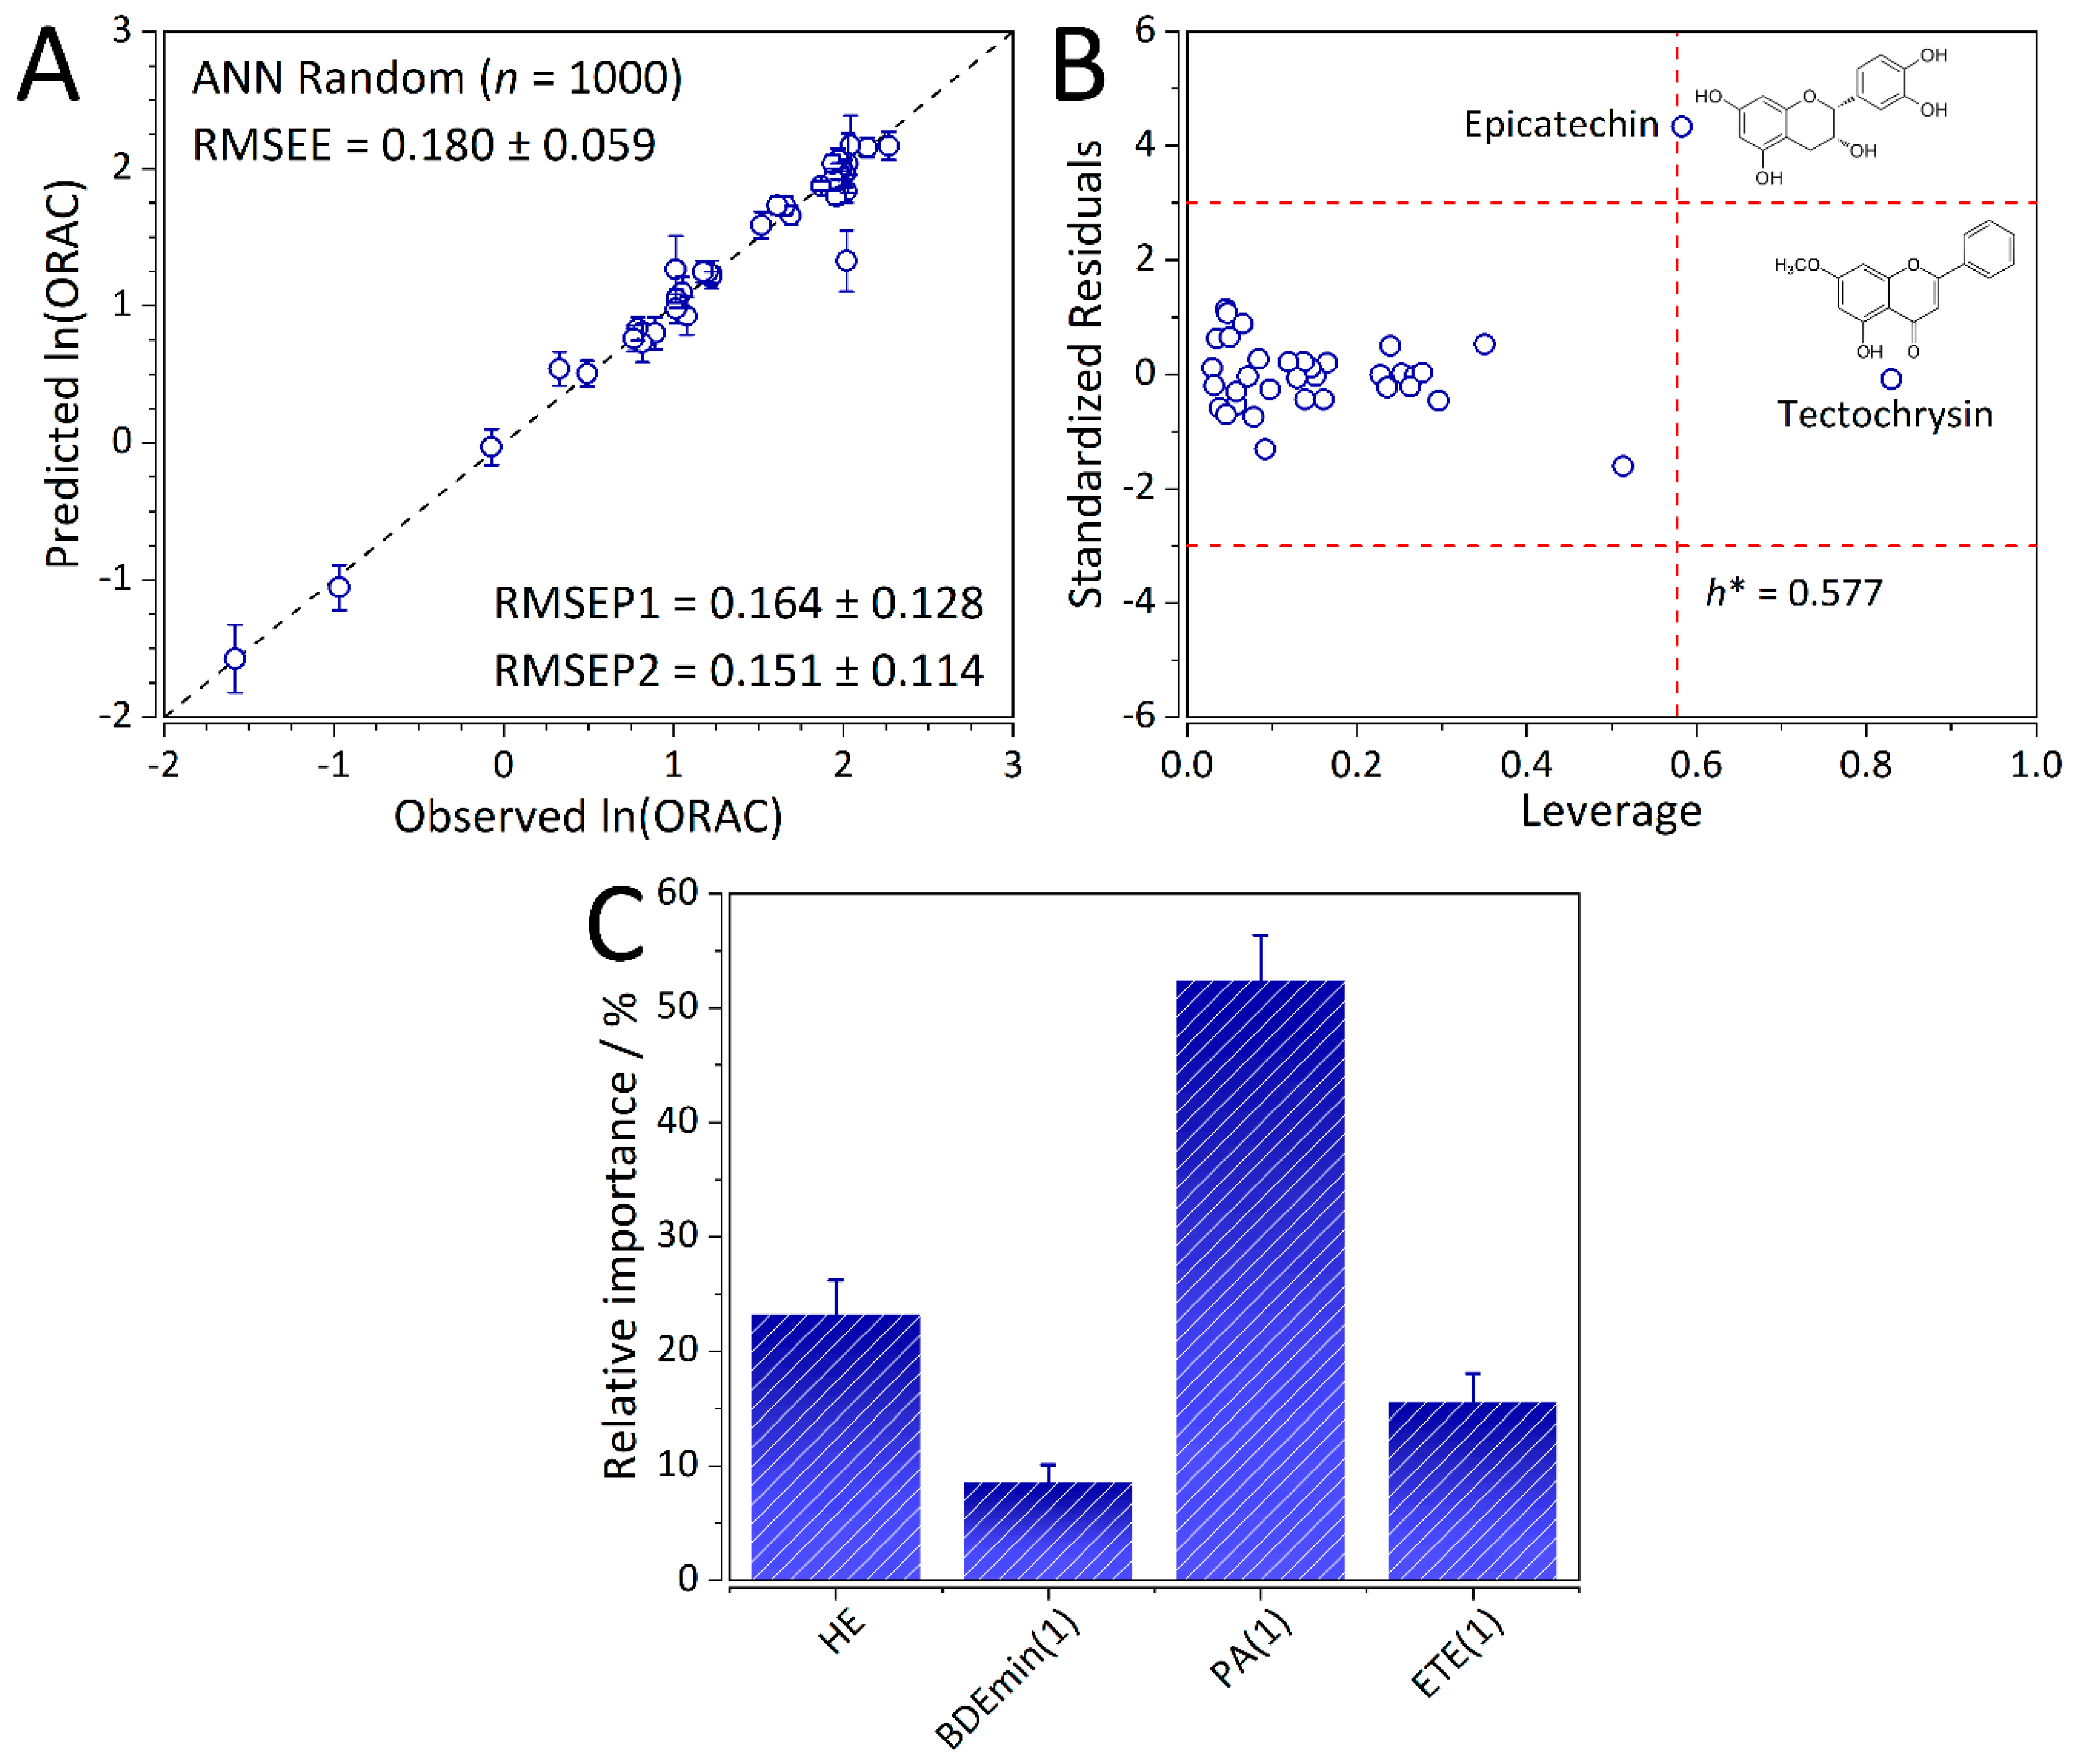
2.3. Non-Linear ANN-QSAR Model
2.4. Validation of the ANN-QSAR Model
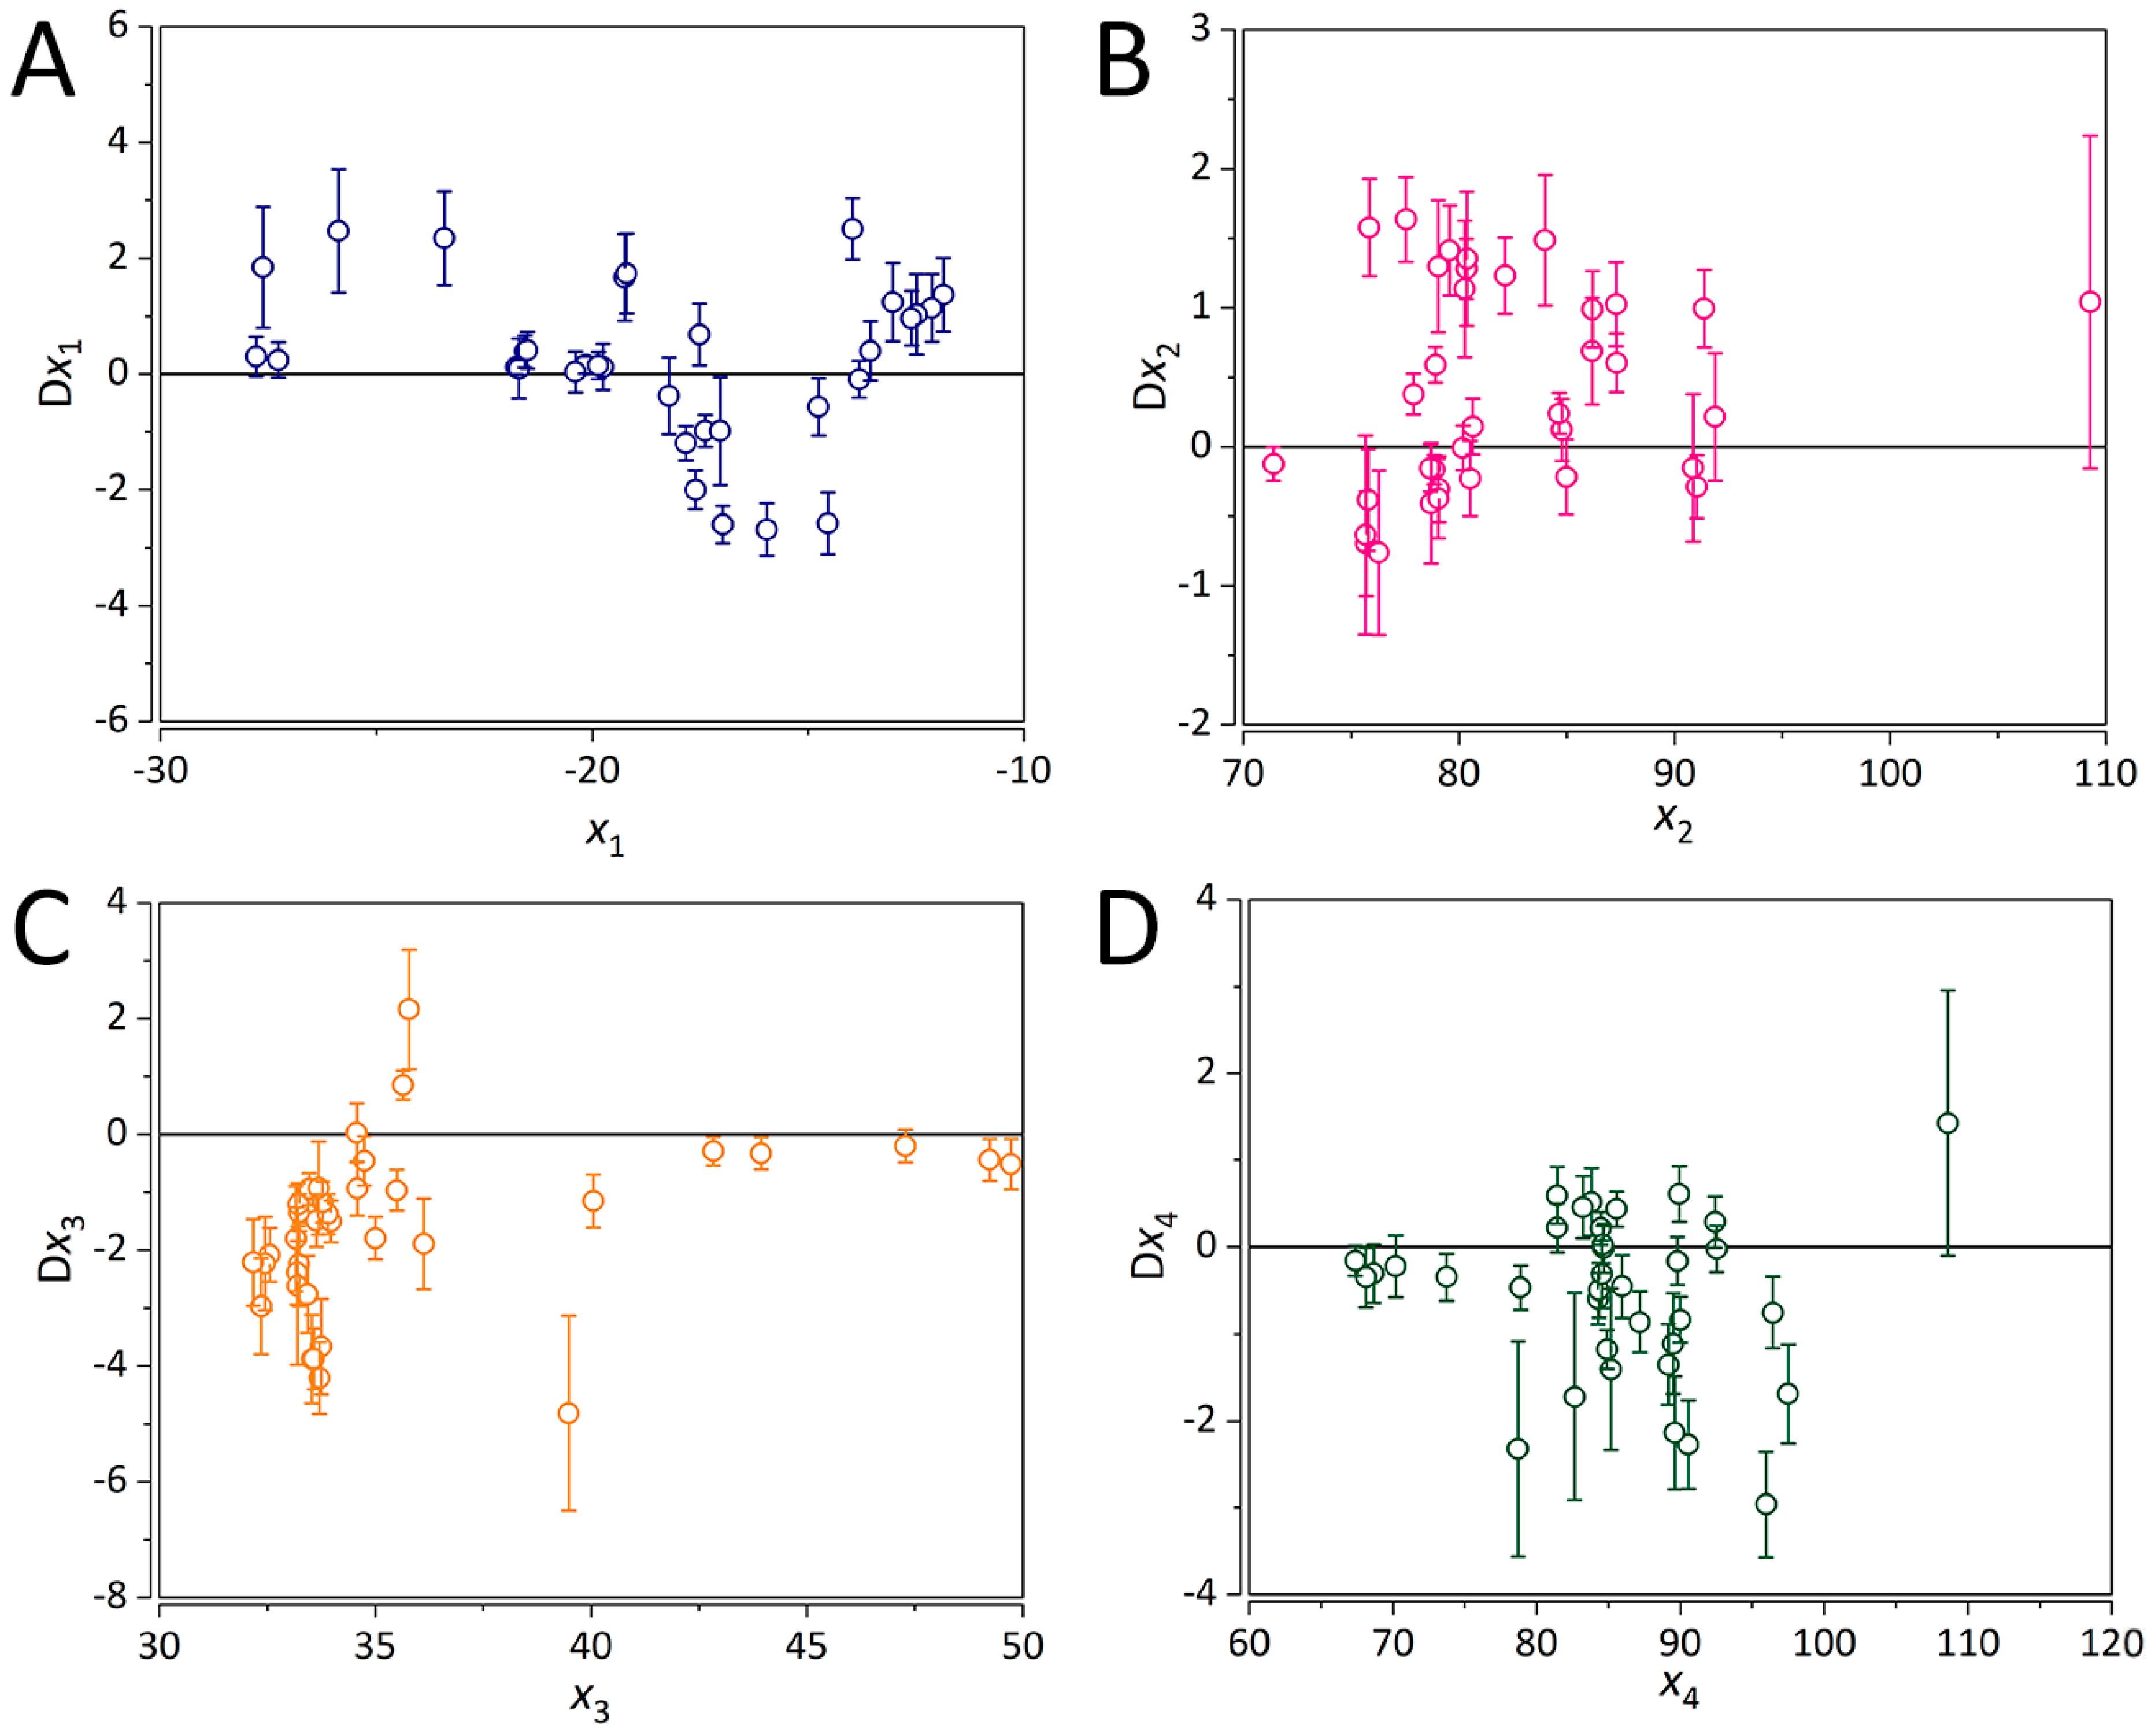
2.5. Interpretation of the ANN-QSAR Model
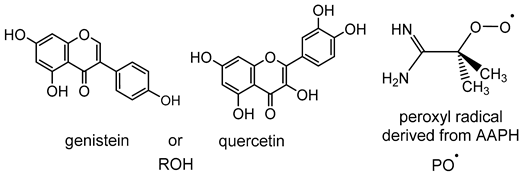
2.6. Mechanism of Hydrogen Abstraction Transfer by Peroxyl Radical
2.7. In-Silico Design of Potent Flavonoid-Based Antioxidants
3. Materials and Methods
3.1. Chemicals and Instruments
3.2. Preparation of Standards and Solutions
3.3. Automatic ORAC Assay
3.4. QSAR model Development
3.4.1. Molecular Descriptors
3.4.2. Conformational Analysis and Geometry Optimization
3.4.3. Selection of Molecular Descriptors for QSAR Modelling
3.5. QSAR Model Development
3.6. QSAR Model Validation
3.7. In-Silico Design of Potent Flavonoid-Based Antioxidants
3.8. Theoretical Methods
3.8.1. Partial Least Squares (PLS)
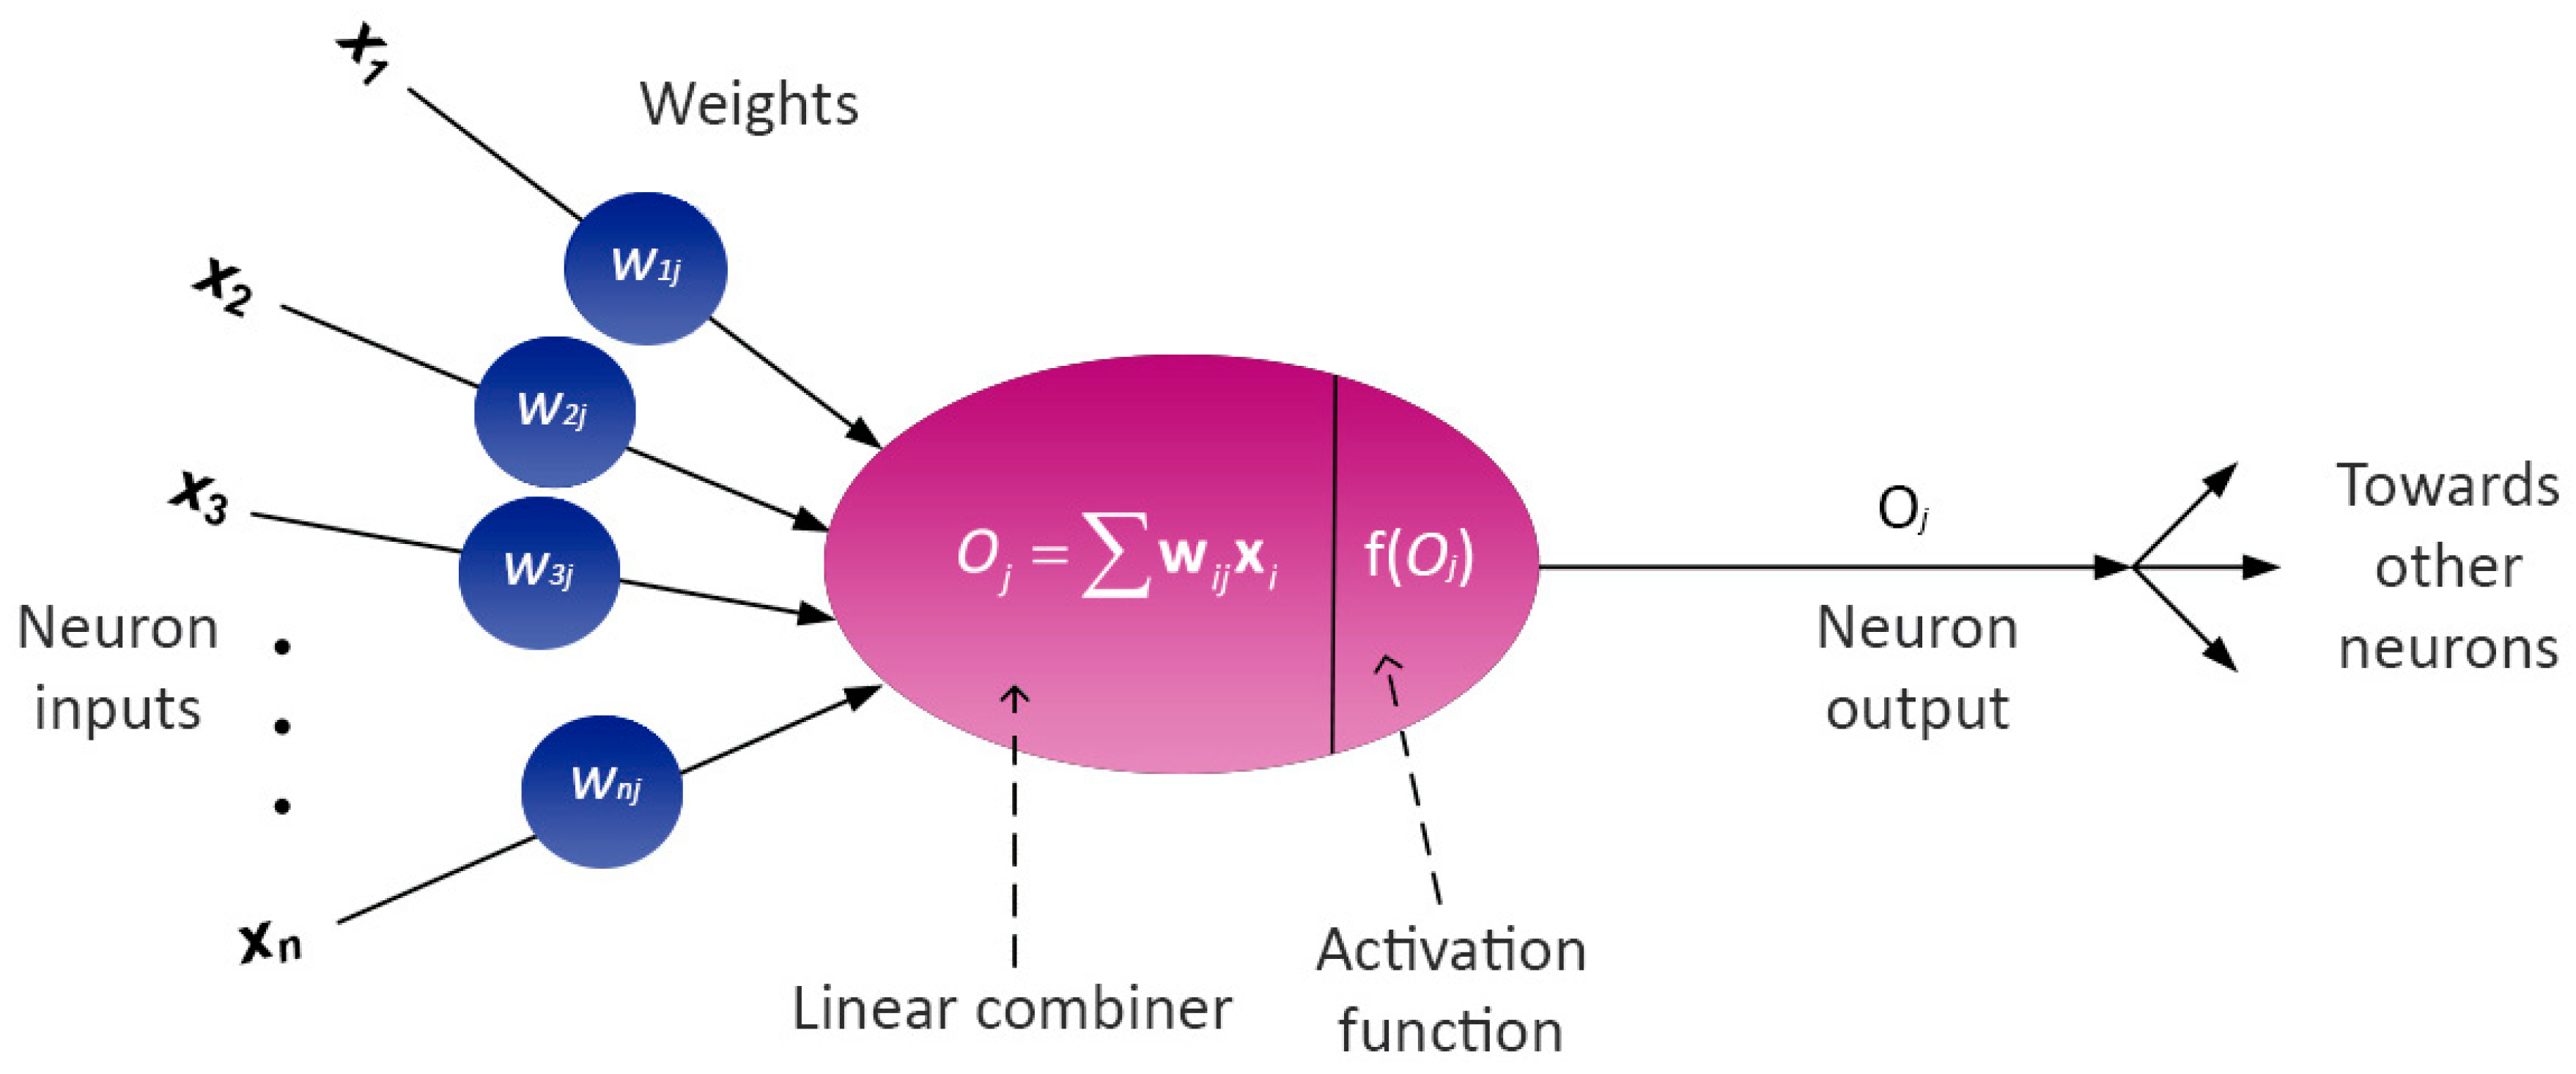
3.8.2. Artificial Neural Networks (ANNs)
Partial Derivative (PaD) Method
4. Conclusions
Supplementary Materials
Author Contributions
Funding
Conflicts of Interest
References
- Williams, C.A.; Grayer, R.J. Anthocyanins and Other Flavonoids. Nat. Prod. Rep. 2004, 21, 539–573. [Google Scholar] [CrossRef]
- Rice-Evans, C.; Miller, N.; Paganga, G. Antioxidant Properties of Phenolic Compounds. Trends Plant Sci. 1997, 2, 152–159. [Google Scholar] [CrossRef]
- Amic, D.; Davidovic-Amic, D.; Beslo, D.; Rastija, V.; Lucic, B.; Trinajstic, N. SAR and QSAR of the Antioxidant Activity of Flavonoids. Curr. Med. Chem. 2007, 14, 827–845. [Google Scholar] [CrossRef] [PubMed]
- Rahman, K. Studies on Free Radicals, Antioxidants, and Co-Factors. Clin. Interv. Aging 2007, 2, 219–236. [Google Scholar]
- Pietta, P.-G. Flavonoids as Antioxidants. J. Nat. Prod. 2000, 63, 1035–1042. [Google Scholar] [CrossRef]
- Hansch, C.; Kurup, A.; Garg, R.; Gao, H. Chem-Bioinformatics and QSAR: A Review of QSAR Lacking Positive Hydrophobic Terms. Chem. Rev. 2001, 101, 619–672. [Google Scholar] [CrossRef]
- Lien, E.J.; Ren, S.; Bui, H.-H.; Wang, R. Quantitative Structure-Activity Relationship Analysis of Phenolic Antioxidants. Free Radic. Biol. Med. 1999, 26, 285–294. [Google Scholar] [CrossRef]
- Amić, D.; Davidović-Amić, D.; Bešlo, D.; Trinajstić, N. Structure-Radical Scavenging Activity Relationships of Flavonoids. Croat. Chem. Acta 2003, 76, 55–61. [Google Scholar]
- Rasulev, B.F.; Abdullaev, N.D.; Syrov, V.N.; Leszczynski, J. A Quantitative Structure-Activity Relationship (QSAR) Study of the Antioxidant Activity of Flavonoids. QSAR Comb. Sci. 2005, 24, 1056–1065. [Google Scholar] [CrossRef]
- Ray, S.; Sengupta, C.; Roy, K. QSAR Modeling of Antiradical and Antioxidant Activities of Flavonoids Using Electrotopological State (E-State) Atom Parameters. Open Chem. 2007, 5, 1094–1113. [Google Scholar] [CrossRef]
- OECD. Guidance Document on the Validation of (Quantitative) Structure-Activity Relationship [(Q)SAR] Models; OECD Publishing: Paris, France, 2007. [Google Scholar]
- Žuvela, P.; David, J.; Wong, M.W. Interpretation of ANN-Based QSAR Models for Prediction of Antioxidant Activity of Flavonoids. J. Comput. Chem. 2018, 39, 953–963. [Google Scholar] [CrossRef]
- De Jong, S. SIMPLS: An Alternative Approach to Partial Least Squares Regression. Chemom. Intell. Lab. Syst. 1993, 18, 251–263. [Google Scholar] [CrossRef]
- Farkas, O.; Jakus, J.; Héberger, K. Quantitative Structure—Antioxidant Activity Relationships of Flavonoid Compounds. Molecules 2004, 9, 1079–1088. [Google Scholar] [CrossRef]
- Dimopoulos, Y.; Bourret, P.; Lek, S. Use of Some Sensitivity Criteria for Choosing Networks with Good Generalization Ability. Neural Process. Lett. 1995, 2, 1–4. [Google Scholar] [CrossRef]
- Hohenberg, P.; Kohn, W. Inhomogeneous Electron Gas. Phys. Rev. 1964, 136, B864–B871. [Google Scholar] [CrossRef]
- Kohn, W.; Sham, L.J. Self-Consistent Equations Including Exchange and Correlation Effects. Phys. Rev. 1965, 140, 1133–1138. [Google Scholar] [CrossRef]
- Huang, D.; Ou, B.; Prior, R.L. The Chemistry behind Antioxidant Capacity Assays. J. Agric. Food Chem. 2005, 53, 1841–1856. [Google Scholar] [CrossRef]
- Zhang, D.; Liu, Y.; Chu, L.; Wei, Y.; Wang, D.; Cai, S.; Zhou, F.; Ji, B. Relationship Between the Structures of Flavonoids and Oxygen Radical Absorbance Capacity Values: A Quantum Chemical Analysis. J. Phys. Chem. A 2013, 117, 1784–1794. [Google Scholar] [CrossRef]
- Litwinienko, G.; Ingold, K.U. Abnormal Solvent Effects on Hydrogen Atom Abstraction. 2. Resolution of the Curcumin Antioxidant Controversy. The Role of Sequential Proton Loss Electron Transfer. J. Org. Chem. 2004, 69, 5888–5896. [Google Scholar] [CrossRef]
- Musialik, M.; Kuzmicz, R.; Pawłowski, T.S.; Litwinienko, G. Acidity of Hydroxyl Groups: An Overlooked Influence on Antiradical Properties of Flavonoids. J. Org. Chem. 2009, 74, 2699–2709. [Google Scholar] [CrossRef]
- Levenberg, K. A Method for the Solution of Certain Non-Linear Problems in Least Squares. Q. Appl. Math. 1944, 2, 164–168. [Google Scholar] [CrossRef]
- Marquardt, D.W. An Algorithm for Least-Squares Estimation of Nonlinear Parameters. J. Soc. Ind. Appl. Math. 1963, 11, 431–441. [Google Scholar] [CrossRef]
- Huang, D.; Ou, B.; Hampsch-Woodill, M.; Flanagan, J.A.; Prior, R.L. High-Throughput Assay of Oxygen Radical Absorbance Capacity (ORAC) Using a Multichannel Liquid Handling System Coupled with a Microplate Fluorescence Reader in 96-Well Format. J. Agric. Food Chem. 2002, 50, 4437–4444. [Google Scholar] [CrossRef]
- Bartmess, J.E. Thermodynamics of the Electron and the Proton. J. Phys. Chem. 1994, 98, 6420–6424. [Google Scholar] [CrossRef]
- Rimarčík, J.; Lukeš, V.; Klein, E.; Ilčin, M. Study of the Solvent Effect on the Enthalpies of Homolytic and Heterolytic N–H Bond Cleavage in P-Phenylenediamine and Tetracyano-p-Phenylenediamine. J. Mol. Struct. THEOCHEM 2010, 952, 25–30. [Google Scholar] [CrossRef]
- Wilhelm, E.; Battino, R. Thermodynamic Functions of the Solubilities of Gases in Liquids at 25.Deg. Chem. Rev. 1973, 73, 1–9. [Google Scholar] [CrossRef]
- Halgren, T.A. Merck Molecular Force Field. I. Basis, Form, Scope, Parameterization, and Performance of MMFF94. J. Comput. Chem. 1996, 17, 490–519. [Google Scholar] [CrossRef]
- Halgren, T.A. MMFF VI. MMFF94s Option for Energy Minimization Studies. J. Comput. Chem. 1999, 20, 720–729. [Google Scholar] [CrossRef]
- Dewar, M.J.S.; Zoebisch, E.G.; Healy, E.F.; Stewart, J.J.P. Development and Use of Quantum Mechanical Molecular Models. 76. AM1: A New General Purpose Quantum Mechanical Molecular Model. J. Am. Chem. Soc. 1985, 107, 3902–3909. [Google Scholar] [CrossRef]
- Chai, J.-D.; Head-Gordon, M. Long-Range Corrected Hybrid Density Functionals with Damped Atom–atom Dispersion Corrections. Phys. Chem. Chem. Phys. 2008, 10, 6615–6620. [Google Scholar] [CrossRef]
- Rassolov, V.A.; Ratner, M.A.; Pople, J.A.; Redfern, P.C.; Curtiss, L.A. 6-31G*basis Set for Third-Row Atoms. J. Comput. Chem. 2001, 22, 976–984. [Google Scholar] [CrossRef]
- Marenich, A.V.; Cramer, C.J.; Truhlar, D.G. Universal Solvation Model Based on Solute Electron Density and on a Continuum Model of the Solvent Defined by the Bulk Dielectric Constant and Atomic Surface Tensions. J. Phys. Chem. B 2009, 113, 6378–6396. [Google Scholar] [CrossRef]
- Cao, G.; Alessio, H.M.; Cutler, R.G. Oxygen-Radical Absorbance Capacity Assay for Antioxidants. Free Radic. Biol. Med. 1993, 14, 303–311. [Google Scholar] [CrossRef]
- Kennard, R.W.; Stone, L.A. Computer Aided Design of Experiments. Technometrics 1969, 11, 137–148. [Google Scholar] [CrossRef]
- Haykin, S. Neural Networks: A Comprehensive Foundation; Macmillan: New York, NY, USA, 1994. [Google Scholar]
- Massart, D.L.; Vandeginste, B.G.M.; Buydens, L.M.C.; de Jong, S.; Lewi, P.J.; Smeyers-Verberke, J. Handbook of Chemometrics and Qualimetrics; Elsevier: Amsterdam, The Netherlands, 1997; Volume 20B. [Google Scholar]
- Gramatica, P. Principles of QSAR Models Validation: Internal and External. QSAR Comb. Sci. 2007, 26, 694–701. [Google Scholar] [CrossRef]
- Žuvela, P.; Liu, J.J.; Macur, K.; Bączek, T. Molecular Descriptor Subset Selection in Theoretical Peptide Quantitative Structure–Retention Relationship Model Development Using Nature-Inspired Optimization Algorithms. Anal. Chem. 2015, 87, 9876–9883. [Google Scholar] [CrossRef]
- Wold, H. Estimation of Principal Components and Related Models by Iterative Least Squares. In Multivariate Analysis; Krishnaiah, P.K., Ed.; Academic Press: New York, NY, USA, 1966; pp. 391–420. [Google Scholar]
- Eriksson, L.; Trygg, J.; Wold, S. CV-ANOVA for Significance Testing of PLS and OPLS® Models. J. Chemom. 2008, 22, 594–600. [Google Scholar] [CrossRef]
- Hornik, K. Approximation Capabilities of Multilayer Feedforward Networks. Neural Netw. 1991, 4, 251–257. [Google Scholar] [CrossRef]
- Rumelhart, D.E.; Hinton, G.E.; Williams, R.J. Learning Representations by Back-Propagating Errors. Nature 1986, 323, 533–536. [Google Scholar] [CrossRef]
- Žuvela, P.; Macur, K.; Liu, J.J.; Bączek, T. Exploiting Non-Linear Relationships between Retention Time and Molecular Structure of Peptides Originating from Proteomes and Comparing Three Multivariate Approaches. J. Pharm. Biomed. Anal. 2016, 127, 94–100. [Google Scholar] [CrossRef]
- Gevrey, M.; Dimopoulos, I.; Lek, S. Review and Comparison of Methods to Study the Contribution of Variables in Artificial Neural Network Models. Ecol. Model. 2003, 160, 249–264. [Google Scholar] [CrossRef]
- Arts, M.J.; Dallinga, J.S.; Voss, H.P.; Haenen, G.R.; Bast, A. A critical appraisal of the use of the antioxidant capacity (TEAC) assay in defining optimal antioxidant structures. Food Chem. 2003, 80, 409–414. [Google Scholar] [CrossRef]
- Arts, M.J.; Haenen, G.R.; Voss, H.P.; Bast, A. Antioxidant capacity of reaction products limits the applicability of the Trolox Equivalent Antioxidant Capacity (TEAC) assay. Food Chem. Toxicol. 2004, 42, 45–49. [Google Scholar] [CrossRef]


 | ||||
|---|---|---|---|---|
| Genistein | Quercetin | |||
| Gas Phase | Water | Gas Phase | Water | |
| Overall reaction | ||||
| ROH + PO•→RO• + POH | 5.6 | 0.8 | −3.1 | −5.6 |
| HAT mechanism | ||||
| ROH→RO• + H• | 83.8 | 85.3 | 75.1 | 78.9 |
| PO• + H•→POH | −78.2 | −84.5 | −78.2 | −84.5 |
| SPLET mechanism | ||||
| ROH + PO•→RO− + POH•+ | 134.2 | 32.9 | 126.8 | 31.9 |
| RO− + POH•+→RO• + POH | −128.6 | −32.1 | −129.8 | −37.5 |
| SETPL mechanism | ||||
| ROH + PO•→ROH•+ + PO− | 144.6 | 32.6 | 137.6 | 28.0 |
| ROH•+ + PO−→RO• + POH | −138.9 | −31.7 | −140.7 | −33.6 |
| R1 | R2 | R3 | R4 | R5 | R6 | R7 | R8 | R1′ | R2′ | R3′ | R4′ | R5′ | R6′ |
|---|---|---|---|---|---|---|---|---|---|---|---|---|---|
| Top 55 compounds (ORAC > 5) | |||||||||||||
| 0 | 0 | 11 | 1 | 7 | 20 | 19 | 17 | 0 | 20 | 20 | 18 | 16 | 7 |
| Bottom 18 compounds (ORAC < 2) | |||||||||||||
| 0 | 0 | 0 | 5 | 0 | 9 | 5 | 0 | 2 | 0 | 5 | 2 | 3 | 2 |
| # | Name | Molecular Structure | ln (ORAC) | PLS | ANN |
|---|---|---|---|---|---|
| 1 | Genistein | 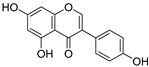 | 2.267 ± 0.008 | 0.953 | 2.165 ± 0.101 |
| 2 | Naringenin |  | 2.141 ± 0.014 | 0.939 | 2.152 ± 0.072 |
| 3 | Scutellarin | 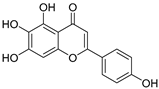 | 2.042 ± 0.014 | 1.567 | 2.171 ± 0.216 |
| 4 | 3,5,7,8,3′,4′-Hexahydroxyflavone |  | 2.026 ± 0.001 | 1.944 | 2.038 ± 0.216 |
| 5 | Epicatechin |  | 2.018 ± 0.004 | 1.579 | 1.326 ± 0.222 |
| 6 | Kaempferol | 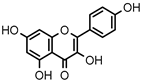 | 2.018 ± 0.018 | 1.331 | 1.836 ± 0.085 |
| 7 | Eriodictyol |  | 2.013 ± 0.006 | 1.473 | 1.962 ± 0.098 |
| 8 | Apigenin | 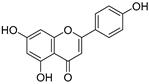 | 2.010 ± 0.000 | 0.796 | 1.968 ± 0.097 |
| 9 | Quercetin | 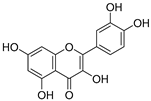 | 1.970 ± 0.003 | 1.525 | 1.979 ± 0.059 |
| 10 | Liquiritigenin |  | 1.970 ± 0.003 | 0.948 | 2.062 ± 0.081 |
| 11 | Fisetin |  | 1.959 ± 0.022 | 1.368 | 1.798 ± 0.060 |
| 12 | Taxifolin |  | 1.942 ± 0.004 | 1.570 | 1.922 ± 0.081 |
| 13 | Hesperetin | 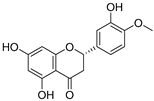 | 1.938 ± 0.014 | 1.239 | 2.035 ± 0.062 |
| 14 | 3,3′,4′-Trihydroxyflavone | 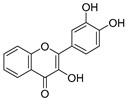 | 1.869 ± 0.019 | 1.143 | 1.873 ± 0.033 |
| 15 | 7,3′,4′-Trihydroxyflavone |  | 1.691 ± 0.016 | 1.368 | 1.658 ± 0.068 |
| 16 | Diosmetin | 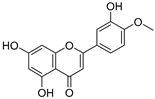 | 1.656 ± 0.001 | 1.069 | 1.728 ± 0.066 |
| 17 | Luteolin | 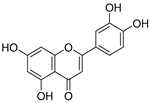 | 1.611 ± 0.013 | 1.322 | 1.730 ± 0.065 |
| 18 | Morin | 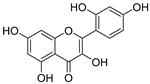 | 1.517 ± 0.006 | 1.424 | 1.588 ± 0.095 |
| 19 | Epigallocatechin | 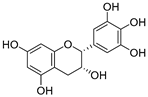 | 1.225 ± 0.020 | 1.932 | 1.227 ± 0.101 |
| 20 | 5,3′,4′-Trihydroxyflavone |  | 1.223 ± 0.038 | 1.141 | 1.206 ± 0.041 |
| 21 | Ampelopsin |  | 1.204 ± 0.038 | 1.842 | 1.245 ± 0.080 |
| 22 | Myricetin |  | 1.173 ± 0.000 | 1.721 | 1.248 ± 0.077 |
| 23 | Wogonin |  | 1.077 ± 0.000 | 0.697 | 0.924 ± 0.137 |
| 24 | 7,8-Dihydroxyflavone |  | 1.051 ± 0.002 | 1.322 | 1.097 ± 0.112 |
| 25 | Chrysin | 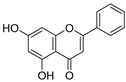 | 1.016 ± 0.001 | 0.226 | 1.051 ± 0.068 |
| 26 | Pinocembrin | 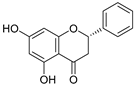 | 1.013 ± 0.011 | 0.225 | 0.978 ± 0.105 |
| 27 | Catechin | 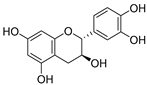 | 1.012 ± 0.018 | 1.597 | 1.266 ± 0.243 |
| 28 | Eupatilin |  | 0.891 ± 0.013 | 0.556 | 0.799 ± 0.119 |
| 29 | Baicalein | 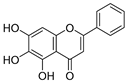 | 0.816 ± 0.003 | 1.382 | 0.730 ± 0.139 |
| 30 | Pectolinarigenin |  | 0.788 ± 0.023 | 0.515 | 0.832 ± 0.084 |
| 31 | 3,5-Dihydroxyflavone |  | 0.767 ± 0.046 | 0.846 | 0.761 ± 0.095 |
| 32 | Alpinetin |  | 0.492 ± 0.009 | 0.410 | 0.505 ± 0.095 |
| 33 | Galangin |  | 0.328 ± 0.030 | 1.063 | 0.539 ± 0.123 |
| 34 | Genkwanin |  | −0.072 ± 0.058 | 0.667 | −0.031 ± 0.131 |
| 35 | Primuletin | 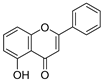 | −0.969 ± 0.004 | 0.044 | −1.055 ± 0.164 |
| 36 | Tectochrysin | 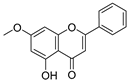 | −1.581 ± 0.079 | −1.306 | −1.575 ± 0.247 |
| # | Compound Name | n (OH) | ETE (1) | PA (1) | BDEmin (1) | HE |
|---|---|---|---|---|---|---|
| 1 | Genistein | 3 | 89.175 | 33.630 | 83.987 | −17.606 |
| 2 | Naringenin | 3 | 90.557 | 33.240 | 84.979 | −19.251 |
| 3 | Scutellarin | 4 | 78.864 | 35.648 | 75.694 | −17.513 |
| 4 | 3,5,7,8,3′,4′-Hexahydroxyflavone | 6 | 67.389 | 42.831 | 71.402 | −20.148 |
| 5 | Epicatechin | 5 | 68.664 | 49.233 | 79.080 | −27.271 |
| 6 | Kaempferol | 4 | 84.259 | 33.472 | 78.913 | −17.382 |
| 7 | Eriodictyol | 4 | 84.665 | 33.190 | 79.037 | −21.559 |
| 8 | Apigenin | 3 | 89.514 | 35.499 | 86.196 | −18.219 |
| 9 | Quercetin | 5 | 83.812 | 32.554 | 77.549 | −19.749 |
| 10 | Liquiritigenin | 2 | 89.619 | 33.975 | 84.776 | −19.203 |
| 11 | Fisetin | 4 | 84.471 | 33.907 | 79.560 | −19.860 |
| 12 | Taxifolin | 5 | 85.166 | 32.360 | 78.708 | −23.422 |
| 13 | Hesperetin | 3 | 85.930 | 33.240 | 80.352 | −17.828 |
| 14 | 3,3′,4′-Trihydroxyflavone | 3 | 73.742 | 43.939 | 78.863 | −13.813 |
| 15 | 7,3′,4′-Trihydroxyflavone | 3 | 84.339 | 34.749 | 80.271 | −21.503 |
| 16 | Diosmetin | 3 | 87.176 | 33.782 | 82.141 | −16.976 |
| 17 | Luteolin | 4 | 84.601 | 34.584 | 80.367 | −20.391 |
| 18 | Morin | 5 | 70.199 | 47.284 | 78.665 | −21.759 |
| 19 | Epigallocatechin | 6 | 78.699 | 35.785 | 75.666 | −27.626 |
| 20 | 5,3′,4′-Trihydroxyflavone | 3 | 84.893 | 34.572 | 80.647 | −15.957 |
| 21 | Ampelopsin | 6 | 82.652 | 32.448 | 76.283 | −25.878 |
| 22 | Myricetin | 6 | 81.442 | 33.218 | 75.843 | −21.695 |
| 23 | Wogonin | 2 | 89.929 | 33.535 | 84.646 | −11.865 |
| 24 | 7,8-Dihydroxyflavone | 2 | 84.537 | 32.175 | 77.894 | −14.759 |
| 25 | Chrysin | 2 | 96.442 | 33.750 | 91.375 | −13.037 |
| 26 | Pinocembrin | 2 | 97.500 | 33.197 | 91.879 | −13.970 |
| 27 | Catechin | 5 | 68.136 | 49.725 | 79.043 | −27.785 |
| 28 | Eupatilin | 2 | 92.534 | 33.579 | 87.295 | −13.554 |
| 29 | Baicalein | 3 | 81.439 | 33.164 | 75.786 | −12.133 |
| 30 | Pectolinarigenin | 2 | 92.425 | 33.712 | 87.319 | −12.482 |
| 31 | 3,5-Dihydroxyflavone | 2 | 83.211 | 36.125 | 80.518 | −7.727 |
| 32 | Alpinetin | 1 | 95.985 | 33.690 | 90.857 | −17.037 |
| 33 | Galangin | 3 | 85.569 | 33.430 | 80.181 | −12.605 |
| 34 | Genkwanin | 2 | 89.997 | 35.002 | 86.181 | −14.537 |
| 35 | Primuletin | 1 | 89.804 | 40.053 | 91.039 | −8.315 |
| 36 | Tectochrysin | 1 | 108.611 | 39.485 | 109.278 | −9.220 |
© 2019 by the authors. Licensee MDPI, Basel, Switzerland. This article is an open access article distributed under the terms and conditions of the Creative Commons Attribution (CC BY) license (http://creativecommons.org/licenses/by/4.0/).
Share and Cite
Žuvela, P.; David, J.; Yang, X.; Huang, D.; Wong, M.W. Non-Linear Quantitative Structure–Activity Relationships Modelling, Mechanistic Study and In-Silico Design of Flavonoids as Potent Antioxidants. Int. J. Mol. Sci. 2019, 20, 2328. https://doi.org/10.3390/ijms20092328
Žuvela P, David J, Yang X, Huang D, Wong MW. Non-Linear Quantitative Structure–Activity Relationships Modelling, Mechanistic Study and In-Silico Design of Flavonoids as Potent Antioxidants. International Journal of Molecular Sciences. 2019; 20(9):2328. https://doi.org/10.3390/ijms20092328
Chicago/Turabian StyleŽuvela, Petar, Jonathan David, Xin Yang, Dejian Huang, and Ming Wah Wong. 2019. "Non-Linear Quantitative Structure–Activity Relationships Modelling, Mechanistic Study and In-Silico Design of Flavonoids as Potent Antioxidants" International Journal of Molecular Sciences 20, no. 9: 2328. https://doi.org/10.3390/ijms20092328
APA StyleŽuvela, P., David, J., Yang, X., Huang, D., & Wong, M. W. (2019). Non-Linear Quantitative Structure–Activity Relationships Modelling, Mechanistic Study and In-Silico Design of Flavonoids as Potent Antioxidants. International Journal of Molecular Sciences, 20(9), 2328. https://doi.org/10.3390/ijms20092328