Abstract
Boron (B) is a micronutrient for plant development, and its deficiency alters many physiological processes. However, the current knowledge on how plants are able to sense the B-starvation signal is still very limited. Recently, it has been reported that B deprivation induces an increase in cytosolic calcium concentration ([Ca2+]cyt) in Arabidopsis thaliana roots. The aim of this work was to research in Arabidopsis whether [Ca2+]cyt is restored to initial levels when B is resupplied and elucidate whether apoplastic Ca2+ is the major source for B-deficiency-induced rise in [Ca2+]cyt. The use of chemical compounds affecting Ca2+ homeostasis showed that the rise in root [Ca2+]cyt induced by B deficiency was predominantly owed to Ca2+ influx from the apoplast through plasma membrane Ca2+ channels in an IP3-independent manner. Furthermore, B resupply restored the root [Ca2+]cyt. Interestingly, expression levels of genes encoding Ca2+ transporters (ACA10, plasma membrane PIIB-type Ca2+-ATPase; and CAX3, vacuolar cation/proton exchanger) were upregulated by ethylene glycol tetraacetic acid (EGTA) and abscisic acid (ABA). The results pointed out that ACA10, and especially CAX3, would play a major role in the restoration of Ca2+ homeostasis after 24 h of B deficiency.
1. Introduction
Plant ability to respond appropriately to variations in soil nutrient concentrations is of essential relevance for plant survival. Nutrients such as nitrate, phosphate, potassium, sulfate, and iron act as signals that can be perceived by plants [1]. Thus, in vascular plants, complex signaling pathways have evolved to sense their nutrient availability and, consequently, trigger a response that allows them to adapt to a changing environment [2]. Calcium (Ca2+) is likely the best-known second messenger that plays a major role in plant responses to diverse stresses and nutrient availability. Multiple stimuli induce specific spatio-temporal changes in cytosolic Ca2+ levels ([Ca2+]cyt), termed as “Ca2+ signatures” [3]. The precise shape of Ca2+ signatures is generated by Ca2+ movements between cytosol and specific cellular compartments, such as apoplasts, vacuoles (where Ca2+ concentration can reach mM values [4]), and the endoplasmic reticulum, through several Ca2+ channels and transporters. Ca2+ channels allow Ca2+ influx into the cytosol, while Ca2+ transporters are involved in Ca2+ efflux into particular reservoirs and apoplasts [3,5,6,7]. Ca2+ influx is performed by several categories of Ca2+-permeable channels, cyclic nucleotide-gated ion channels (CNGCs) being one of these types [8]. Although most of the CNGCs are localized in the plasma membrane [3,9,10], CNGC19 localizes to the tonoplast in Arabidopsis [11]. However, Ca2+-ATPase (ACAs) and Ca2+/H+ antiporters (CAXs) are the two main types of Ca2+ efflux systems that transport Ca2+ out of the cytosol, either to the apoplast or to intracellular reservoirs, against its electrochemical potential gradient [12].
Boron (B) is an essential element for plant development [13]. Its soil availability is an important factor that limits crop productivity and quality in different regions of the world [14,15]. Boron deprivation has been reported in nearly 90 countries affecting more than 100 plant species [16]. In fact, B availability causes important alterations in root and shoot growth at both vegetative and reproductive stages [17,18]. However, mechanisms through which B is involved in these developmental processes are not well-known. Nevertheless, the main function of this micronutrient is its structural role in the cell wall where borate forms a diester bond between apiose residues of two rhamnogalacturonan II monomers, providing an enhanced firmness to the cell wall [19,20]. Moreover, B deprivation does not only affect the cell wall but also disturbs many metabolic and physiological processes such as membrane and cytoskeleton structure and function, oxidative stress and secondary metabolism, nitrogen assimilation, and gene expressions, among others [14,18,21,22,23,24,25,26,27,28].
An issue of increasing interest is how plants sense B availability. Ca2+ has been involved in signaling process associated with the sensing of B deficiency by plants. BY-2 tobacco cells subjected to short-term B deprivation showed an increased Ca2+ uptake, likely via mechanosensitive Ca2+ channels [29]. In addition, B starvation enhanced [Ca2+]cyt as well as the expression of Ca2+-related genes such as CNGC19 (Ca2+ channel), several ACAs (Ca2+-ATPases), CAX3 (Ca2+/H+ antiporter), various CMLs (calmodulin-like proteins), and CDPKs (Ca2+-dependent protein kinases) in Arabidopsis roots [30]. Furthermore, very recently it has been reported that B deficiency enlarged [Ca2+]cyt in the Malus domestica pollen tube tip [31]. Although these findings suggest that Ca2+ is involved in a signaling pathway triggered by B deficiency, currently, precise mechanisms underlying this route remain unknown. Therefore, the aim of this work was to analyze whether a B resupply provokes a restoration of [Ca2+]cyt, and elucidate whether the rise in [Ca2+]cyt triggered by B deprivation is due to a Ca2+ influx from the extracellular medium or from intracellular Ca2+ reservoirs. For these purposes, in vivo fluorescence measurements of [Ca2+]cyt in Arabidopsis seedlings subjected to B starvation and, subsequently, resupply experiments were performed. In addition, [Ca2+]cyt was determined in the presence of several chemical agents known to affect calcium homeostasis.
2. Results and Discussion
2.1. Cytosolic Calcium Levels Are Restored When Boron (B) Is Resupplied
It was described that B starvation induced overexpression of stress-responsive genes in tobacco BY-2 cells and a higher Ca2+ influx when compared to control cells [29]. These results were consistent with the increased root [Ca2+]cyt and expression of Ca2+-related genes described in Arabidopsis plants upon 6 and 24 h of B deficiency [30]. With the aim to analyze whether B resupply can restore [Ca2+]cyt to initial levels prior to B starvation stimulus, Arabidopsis seedlings expressing YC3.6 were subjected to B deprivation for 24 h and, subsequently, were grown with 2 µM B for 1, 3, 6, or 24 h. At indicated times, fluorescence measurements were performed in Arabidopsis roots. Interestingly, a gradual decrease in fluorescence signal and, hence, in [Ca2+]cyt was observed when plants were resupplied with 2 µM B (Figure 1A–E). However, when seedlings were maintained with 2 µM B, no significant changes in fluorescence levels were detected (Figure 1F–J). These data support not only that B deficiency rose [Ca2+]cyt (Figure 1A,F; [30]), but also that this effect could be reversed by B resupply. Taken together, these findings suggested that root [Ca2+]cyt was a significant parameter for the signaling of B deprivation.
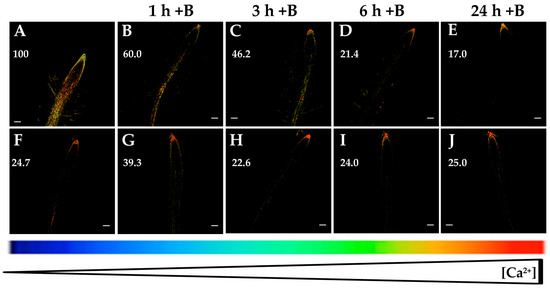
Figure 1.
Fluorescence images of roots from Arabidopsis seedlings expressing the fluorescence resonance energy transfer (FRET)-based Ca2+ sensor UbiQ10:YC3.6-bar#22-2. Seedlings were subjected to boron (B) deprivation for 24 h (A) and, subsequently, they were transferred to media supplemented with 2 µM B for 1 h (B), 3 h (C), 6 h (D), and 24 h (E). In addition, seedlings grown with 2 µM B (F) were transferred to the same media (2 µM B) for 1 h (G), 3 h (H), 6 h (I), and 24 h (J), as a control. Fluorescence was monitored using settings for cpVenus excitation and emission. Increase in the FRET reflects higher [Ca2+]cyt levels. For more details see Materials and Methods. Representative images: (A) n = 12 roots; (B) n = 5 roots; (C) n = 5 roots; (D) n = 7 roots; (E) n = 8 roots; (F) n = 12 roots; (G) n = 4 roots; (H) n = 4 roots; (I) n = 4 roots; and (J) n = 4 roots. Data are from a representative experiment that was repeated twice with very similar results. Scale bars represent 100 µm. Numbers indicate raw integrated density (%), obtained from ImageJ software, compared to the maximum fluorescence level (Figure 1A).
To ascertain whether root B concentration in the Arabidopsis Col-0 wild type and the line expressing Yellow Cameleon 3.6 (YC3.6) could be differently affected by B deficiency, total root B contents were determined. There was a remarkable decrease in the root B concentration in Col-0 wild type and seedlings expressing YC3.6 after 24 h of B deprivation (Figure 2). Furthermore, both lines had similar root B contents in the two B treatments, so that there were no statistically significant differences compared to each B treatment (Figure 2). These results supported that the findings shown in Figure 1 were regulated by B availability.
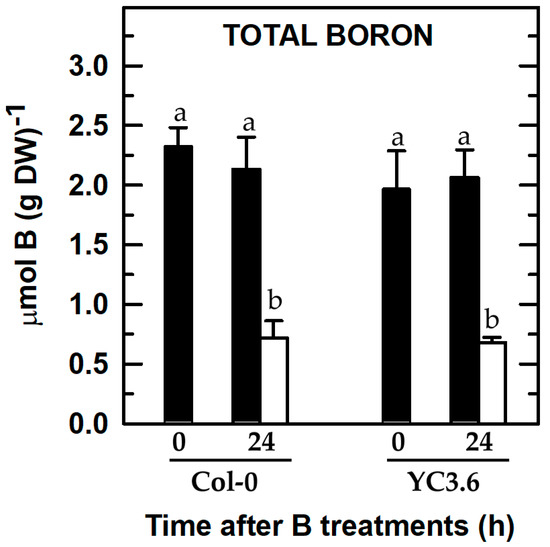
Figure 2.
Total B concentration of roots from Arabidopsis Col-0 wild type and seedlings expressing the FRET-based Ca2+ sensor UbiQ10:YC3.6-bar#22-2. Seedlings were subjected (open bars) or not (filled bars) to B deprivation for 24 h. For more details see Materials and Methods. The results are given as means ± SD (n = 4 separate pools). Different letters have been used to designate statistically significant differences between Col-0 and/or YC3.6 seedlings subjected or not to B deficiency. Statistical analyses were performed according to ANOVA with Tukey’s HSD test (p < 0.05).
2.2. Apoplastic Calcium Is the Major Source for the Rise in Cytosolic Calcium Levels Induced by B Deficiency
It is widely known that temporal increases in [Ca2+]cyt are performed through the calcium influx from several cellular compartments such as the vacuole, endoplasmic reticulum, and also from the apoplast [5,6]. These changes in [Ca2+]cyt have been observed in response to a wide variety of abiotic stresses [5,6,32].
B deficiency induced an increase in the root [Ca2+]cyt (Figure 1A,F; [30]), which was visualized as fluorescence level changes, where the root apical area did not show significant changes when Arabidopsis seedlings were subjected to B deprivation (Figure 1, Figure 3, Figure 4, Figure 5 and Figure 6; [30]). With the objective to determine whether this rise could be due to a calcium influx from the apoplast or intracellular organelles, fluorescence measurements in the presence of several agents affecting Ca2+ homeostasis were carried out. Interestingly, the membrane-impermeable calcium chelator EGTA highly reduced the increase in [Ca2+]cyt that occurred in response to 6 and 24 h of B deprivation (Figure 3). These results pointed out that the rise in [Ca2+]cyt induced by B deficiency would mostly be caused by calcium influx from the apoplast. Similar results were obtained in M. domestica pollen tube tips when these plants were subjected to B deprivation. Under this condition, a higher extracellular Ca2+ influx took place and brought about an increase in [Ca2+]cyt in the pollen tube tip [31]. It was worth noting that EGTA treatment did not completely quench the fluorescence signal in 24 h-B-deficient seedlings (Figure 3H), which suggested that, even though Ca2+ influx from the apoplast was the main source for the rise in [Ca2+]cyt induced by B deprivation, some influx from internal organelles was also present.
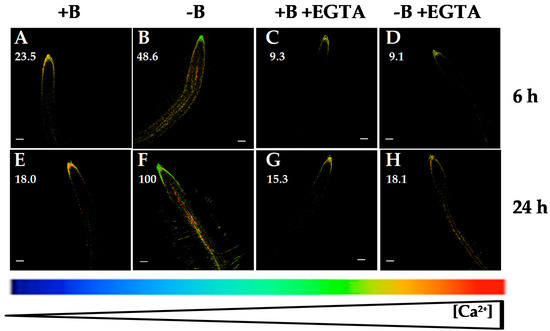
Figure 3.
Fluorescence images of roots from Arabidopsis seedlings expressing the FRET-based Ca2+ sensor UbiQ10:YC3.6-bar#22-2 and treated or not with 1 mM ethylene glycol tetraacetic acid (EGTA). Seedlings were subjected (B,D,F,H) or not (A,C,E,G) to B deficiency for 6 (A–D) or 24 h (E–H) in the absence (A,B,E,F) or presence (C,D,G,H) of 1 mM EGTA. Fluorescence was monitored using settings for cpVenus excitation and emission. Increase in the FRET reflects higher [Ca2+]cyt levels. For more details see Materials and Methods. Representative images: (A) n = 12 roots; (B) n = 12 roots; (C) n = 5 roots; (D) n = 6 roots; (E) n = 12 roots; (F) n = 12 roots; (G) n = 5 roots; and (H) n = 6 roots. Data are from a representative experiment that was repeated twice with very similar results. Scale bars represent 100 µm. Numbers indicate raw integrated density (%), obtained from ImageJ software, compared to the maximum fluorescence level (Figure 3F).
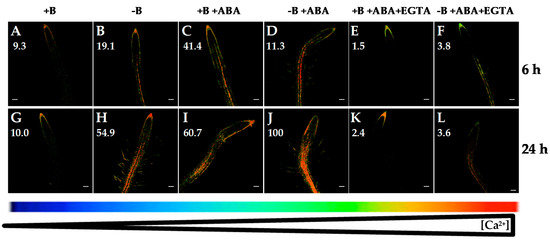
Figure 4.
Fluorescence images of roots from Arabidopsis seedlings expressing the FRET-based Ca2+ sensor UbiQ10:YC3.6-bar#22-2 and treated or not with 5 µM ABA and/or 1 mM EGTA. Seedlings were subjected (B,D,F,H,J,L) or not (A,C,E,G,I,K) to B deficiency for 6 (A–F) or 24 h (G–L) in the absence (A,B,G,H) or presence (C,D,I,J) of 5 µM abscisic acid (ABA). In addition, B-sufficient and B-deficient seedlings were treated simultaneously with 5 µM ABA and 1 mM EGTA (E,F,K,L). Fluorescence was monitored using settings for cpVenus excitation and emission. Increase in the FRET reflects higher [Ca2+]cyt levels. For more details see Materials and Methods. Representative images: (A) n = 12 roots; (B) n = 12 roots; (C) n = 7 roots; (D) n = 9 roots; (E) n = 9 roots; (F) n = 10 roots; (G) n = 12 roots; (H) n = 12 roots; (I) n = 10 roots; (J) n = 10 roots; (K) n = 9 roots; and (L) n = 8 roots. Data are from a representative experiment that was repeated twice with very similar results. Scale bars represent 100 µm. Numbers indicate raw integrated density (%), obtained from ImageJ software, compared to the maximum fluorescence level (Figure 4J).
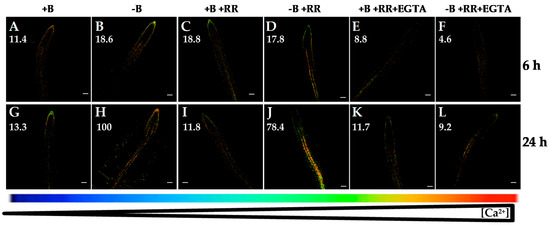
Figure 5.
Fluorescence images of roots from Arabidopsis seedlings expressing the FRET-based Ca2+ sensor UbiQ10:YC3.6-bar#22-2 and treated or not with 50 µM ruthenium red (RR) and/or 1 mM EGTA. Seedlings were subjected (B,D,F,H,J,L) or not (A,C,E,G,I,K) to B deficiency for 6 (A–F) or 24 h (G–L) in the absence (A,B,G,H) or presence (C,D,I,J) of 50 µM RR. In addition, B-sufficient and B-deficient seedlings were treated simultaneously with 50 µM RR and 1 mM EGTA (E,F,K,L). Fluorescence was monitored using settings for cpVenus excitation and emission. Increase in the FRET reflects higher [Ca2+]cyt levels. For more details see Materials and Methods. Representative images: (A) n = 12 roots; (B) n = 12 roots; (C) n = 9 roots; (D) n = 8 roots; (E) n = 9 roots; (F) n = 8 roots; (G) n = 12 roots; (H) n = 12 roots; (I) n = 7 roots; (J) n = 9 roots; (K) n = 8 roots; and (L) n = 7 roots. Data are from a representative experiment that was repeated twice with very similar results. Scale bars represent 100 µm. Numbers indicate raw integrated density (%), obtained from ImageJ software, compared to the maximum fluorescence level (Figure 5H).
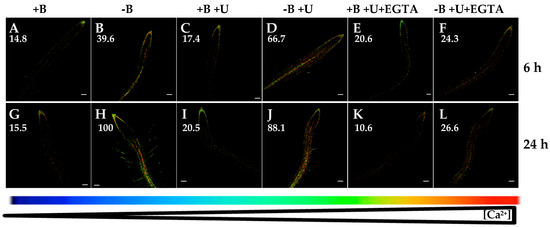
Figure 6.
Fluorescence images of roots from Arabidopsis seedlings expressing the FRET-based Ca2+ sensor UbiQ10:YC3.6-bar#22-2 and treated or not with 1 µM U73122 and/or 1 mM EGTA. Seedlings were subjected (B,D,F,H,J,L) or not (A,C,E,G,I,K) to B deficiency for 6 (A–F) or 24 h (G–L) in the absence (A,B,G,H) or presence (C,D,I,J) of 1 µM U73122. In addition, B-sufficient and B-deficient seedlings were treated simultaneously with 1 µM U73122 and 1 mM EGTA (E,F,K,L). Fluorescence was monitored using settings for cpVenus excitation and emission. Increase in the FRET reflects higher [Ca2+]cyt levels. For more details see Materials and Methods. Representative images: (A) n = 12 roots; (B) n = 12 roots; (C) n = 10 roots; (D) n = 8 roots; (E) n = 4 roots; (F) n = 5 roots; (G) n = 12 roots; (H) n = 12 roots; (I) n = 9 roots; (J) n = 10 roots; (K) n = 8 roots; and (L) n = 10 roots. Data are from a representative experiment that was repeated twice with very similar results. Scale bars represent 100 µm. Numbers indicate raw integrated density (%), obtained from ImageJ software, compared to the maximum fluorescence level (Figure 6H).
It was reported that abscisic acid (ABA) treatment induced activation of Ca2+ channels leading to an increase in [Ca2+]cyt in maize and Arabidopsis roots [33,34,35]. Accordingly, when Arabidopsis seedlings were treated with ABA for 6 and 24 h, a remarkable increase in root [Ca2+]cyt in both B-sufficient and B-deficient plants was observed (compare Figure 4A,B,G,H and Figure 4C,D,I,J). Recently, [36] have proposed a functional integration between ABA and Ca2+ signaling pathways, which would establish tight signaling networks rather than separate pathways. Furthermore, in Arabidopsis roots, [35] suggested that ABA triggers (via production of ROS) the activation of plasma membrane Ca2+-permeable channels, increase in [Ca2+]cyt and, finally, inhibition of the primary root growth. Consistently with these data, Arabidopsis seedlings subjected to B starvation showed an increased NADPH oxidase activity and inhibition of root cell elongation [37]. In addition, diphenyleneiodonium (an inhibitor of ROS generation by NADPH oxidases) mitigated the effect of B deficiency on root cell elongation [37]. Moreover, the highest root [Ca2+]cyt was observed in seedlings under the combined treatment of B deprivation and ABA (Figure 4D,J), as indicated by the greatest levels of fluorescence. These data would support that Ca2+, ABA, and ROS could be components of a signaling pathway triggered by B deficiency involved in regulating root growth [36,38].
Remarkably, in both B treatments, simultaneous application of ABA and EGTA highly reduced (Figure 4E,F,K,L) fluorescence signals compared to those from ABA treatment (Figure 4C,D,I,J). A decrease in Arabidopsis root [Ca2+]cyt when ABA and EGTA were simultaneously added was also observed using the aequorin-emitted luminescence method [35]. Together, these results supported that the ABA-induced increase in [Ca2+]cyt as well as that triggered by B deficiency were mainly a consequence of Ca2+ influx from the apoplast.
Furthermore, with the aim to elucidate the involvement of some internal Ca2+ channels in this B-deficiency response, ruthenium red (RR), a specific compound reported to inhibit Ca2+ release from vacuole to cytosol, was used. RR is a membrane-permeable Ca2+ channel blocker that inhibits vacuolar cyclic ADP-ribose (cADPR)-dependent Ca2+ channels [39]. The increase in [Ca2+]cyt under B deficiency was not decreased significantly when seedlings were treated with RR (Figure 5A–D,G–J). However, simultaneous application of RR and EGTA highly reduced the rise in [Ca2+]cyt after 6 or 24 h of B deprivation (Figure 5F,L). This decrease in fluorescence signal was similar to that observed when EGTA was exclusively added (Figure 3D,H). Therefore, tonoplast cADPR-dependent Ca2+ channels did not seem to be mostly involved in the response to B starvation, and the results supported that the increase in [Ca2+]cyt triggered by B deficiency was due mainly to Ca2+ influx from the apoplast.
Finally, with the purpose of ascertaining whether inositol 1,4,5-triphosphate (IP3)-regulated Ca2+ channels could be involved in the calcium response triggered by B starvation, U73122, an aminosteroid inhibitor of phospholipase C that reduces IP3 production and thereby inhibits the activity of these channels, was used [40,41]. U73122 application did not prevent the rise in [Ca2+]cyt triggered by B deprivation (Figure 6A–D,G–J). Interestingly, simultaneous addition of U73122 and EGTA highly reduced the increase in [Ca2+]cyt after 6 or 24 h of B starvation (Figure 6F,L). This effect was similar to that observed when EGTA was exclusively added (Figure 3D,H). These results seemed to suggest that phospholipase C pathway would not play an essential role in the B-starvation signaling, and that IP3-regulated Ca2+ channels would not participate in the rise of [Ca2+]cyt associated with B deficiency. In summary, the increased root [Ca2+]cyt in response to B deficiency was predominantly a consequence of Ca2+ influx from the apoplast through plasma membrane Ca2+ channels in an IP3-independent manner.
2.3. The Expression of Several Ca2+ Channel/Transporter Genes Are Altered by Compounds That Affect Ca2+ Homeostasis
As EGTA and ABA affected root [Ca2+]cyt (Figure 3 and Figure 4), and B deficiency upregulated the expression of Ca2+ transporter genes (CNGC19, ACAs and CAX3) and triggered an increase in [Ca2+]cyt (Figure 1A,F; [30]), transcriptome analyses in the presence of EGTA or ABA were performed in B-sufficient and B-deficient plants to ascertain the role these Ca2+ transporters could play in the regulation of root [Ca2+]cyt.
2.3.1. Ethylene Glycol Tetraacetic Acid (EGTA) Treatment
As expected, root expressions of CNGC19 (cyclic nucleotide-gated ion channel), ACA10 (plasma membrane PIIB-type Ca2+-ATPase), and CAX3 (vacuolar cation/proton exchanger) genes were overexpressed in Arabidopsis seedlings subjected to 24 h of B deficiency (Figure 7 and Figure 8; [30]). This gene overexpression was correlated with a decrease in root B concentration of B-deficient seedlings (Figure 2).
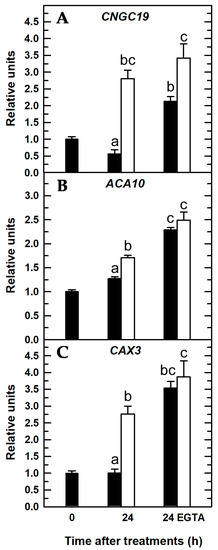
Figure 7.
Quantitative real-time PCR analysis of transcript levels in Arabidopsis roots for Ca2+-related genes in the presence of EGTA: CNGC19 (A), ACA10 (B), and CAX3 (C). Seedlings were subjected (open bars) or not (filled bars) to B deprivation for 24 h. For more details see Materials and Methods. The results are given as means ± SD (n = 4 pools of 14 separate roots). For each gene, different letters have been used to designate statistically significant differences between plants subjected or not to EGTA and B treatments. Statistical analyses were performed according to ANOVA with Tukey’s HSD test (p < 0.05).
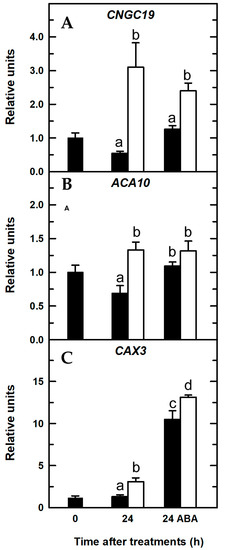
Figure 8.
Quantitative real-time PCR analysis of transcript levels in Arabidopsis roots for Ca2+-related genes in the presence of ABA: CNGC19 (A), ACA10 (B), and CAX3 (C). Seedlings were subjected (open bars) or not (filled bars) to B deprivation for a 24-h period. For more details see Materials and Methods. The results are given as means ± SD (n = 4 pools of 14 separate roots). For each gene, different letters have been used to designate statistically significant differences between plants subjected or not to ABA and B treatments. Statistical analyses were performed according to ANOVA with Tukey’s HSD test (p < 0.05).
When seedlings were treated with EGTA, there was a higher expression of these three Ca2+-related genes irrespective of the B treatment (Figure 7), which could be explained as a general response that attempted to restore Ca2+ homeostasis under conditions of lower free-Ca2+ concentration in the apoplast owing to the presence of EGTA. In this way, the overexpression of CNGC19 to increase [Ca2+]cyt, and ACA10 and CAX3 to decrease [Ca2+]cyt, would restore the Ca2+ electrochemical potential in roots. It was proposed that Arabidopsis roots responded to B deficiency by stimulating Ca2+ influx from the apoplast through plasma membrane CNGCs and Ca2+ efflux from the vacuole through CNGC19 and, thereby, increasing the [Ca2+]cyt to trigger a Ca2+ signaling pathway [30,42]. Since EGTA is a membrane-impermeable Ca2+ chelator, its presence hinders Ca2+ influx from the apoplast through plasma membrane Ca2+ channels, such as CNGCs [5,10], and, as a result, there is lower availability of intracellular Ca2+ (Figure 3D,H). Very interestingly, significant differences between the CNGC19 transcript levels of both B treatments were maintained in the presence of EGTA; the levels were significantly higher in B-deficient roots treated with EGTA (Figure 7A). In addition, under these conditions (B deficiency and EGTA) a slight fluorescence was continuously observed (Figure 3H), which suggested the involvement of CNGC19 in this response as well. These results were consistent with the previous proposal of [30,42]; our data supported that Arabidopsis plants responded to B deficiency, even in the presence of EGTA, by increasing CNGC19 transcript levels to try to compensate for a lower apoplastic Ca2+ concentration as well as Ca2+ efflux from the vacuole into the cytosol through CNGC19 (Figure 7A). Accordingly, in the absence of EGTA, apoplastic free-Ca2+ was available for transport via plasma membrane Ca2+ channels, and its influx caused the most significant increase in [Ca2+]cyt under B deprivation (Figure 3B,F), whose effect was reduced by EGTA (Figure 3D,H).
Unlike CNGC19 gene expression, upon 24 h of EGTA treatment, no significant differences in ACA10 and CAX3 transcript levels were found between both B treatments (Figure 7B,C). ACA and CAX proteins removed Ca2+ from the cytosol to the apoplast or organelles to restore cytosolic Ca2+ homeostasis after exposure to several environmental stimuli [3,5,43,44]. As in the presence of EGTA, there was not a remarkable increase in [Ca2+]cyt (Figure 3C,D,G,H) that would explain the lack of significant differences in ACA10 and CAX3 transcript levels between both B treatments (Figure 7B,C). Conversely, in the absence of EGTA, ACA10 and CAX3 gene expressions were significantly increased upon 24 h of B deprivation (Figure 7B,C); these results were consistent with those from [Ca2+]cyt where a rise in the [Ca2+]cyt was observed (Figure 3B,F). Therefore, ACA10 and CAX3 overexpression would contribute to restore [Ca2+]cyt.
2.3.2. Abscisic Acid (ABA) Treatment
In vascular plants, ABA stimulates release of Ca2+ from intracellular stores through increased cADPR levels [45]. Moreover, in guard cells, ABA increases [Ca2+]cyt via activation of plasmalemma Ca2+-permeable, nonselective cation channels and Ca2+ efflux from intracellular Ca2+ stores [46]. Consequently, a rise in the [Ca2+]cyt was observed as early as 6 h after ABA application in both B treatments (Figure 4C,D,I,J), which was associated with increased transcript levels of the CAX3 gene compared to those without ABA treatment (Figure 8). Interestingly, when B-deficient plants were treated with ABA, there was a clear, statistically significant increase in CAX3 transcript abundance (Figure 8C), which was at least five times higher than that of CNGC19 and ACA10 genes (Figure 8A,B) and more than eight times higher when compared to the CAX3 transcript level of B-deficient plants treated without ABA (Figure 8C). These results were consistent with those reported by [47] in cotton roots, in which the GhCAX3 gene was upregulated by ABA treatment (GhCAX3 is highly homologous to AtCAX3 gene, with 74% identity and 84% similarity). ABA-induced overexpression of CAX3 gene was especially associated with a remarkable rise in [Ca2+]cyt observed in B-deficient seedlings treated with ABA (Figure 8C and Figure 4J, respectively). Kinetic properties of CAX transporters differed from those of ACA ones. For instance, CAX antiporters had low affinity but a high capacity for Ca2+ transport, whereas ACA proteins had higher affinities but a low capacity for Ca2+ transport [4,48]. Accordingly, it was proposed that ACA pumps were responsible for maintaining homeostasis of [Ca2+]cyt in the resting cell, while CAX antiporters were particularly important for restoration of [Ca2+]cyt associated with signaling pathways [44,49,50]. Therefore, increased [Ca2+]cyt upon ABA application would trigger an overexpression of CAX3 gene that would restore [Ca2+]cyt to submicromolar levels. Taken together, these results suggested that CAX3 would play a major role in the restoration of Ca2+ homeostasis upon B starvation stimulus.
3. Materials and Methods
3.1. Plant Material and Growth Conditions
Seeds of A. thaliana expressing a fluorescence resonance energy transfer (FRET)-based Ca2+ sensor (UbiQ10:YC3.6-bar#22-2, [51]) (YC3.6) were kindly gifted by Prof. Dr. Jörg Kudla (Institut für Biologie und Biotechnologie der Pflanzen, Universität Münster, Germany). These seeds and those of the A. thaliana wild type (ecotype Col-0) were surface-sterilized in a 5% (v/v) hypochlorite solution for 15 min and then washed three times in ethanol and three times in sterile H2O. Sterile seeds were sown in square (12 cm x 12 cm) Petri dishes containing a culture medium (CM) supplemented with 2 µM H3BO3 [30] and solidified with 1% (w/v) Phytagel. After sowing, plates were cold-treated at 4 °C for 48 h in darkness to synchronize seed germination. Subsequently, plates were placed vertically in a growth chamber with 16 h light/8 h dark, 25/22 °C, 75% relative humidity, and an irradiance of 150 μmol m−2 s−1 of photosynthetically active radiation. Seedlings were grown under this condition for 5–6 d, and then sets of seedlings were transferred to fresh CM supplemented with 2 µM H3BO3 (control plants) or not (B-deficient plants). Both sets of plants were treated with or without 1 mM ethylene glycol tetraacetic acid (EGTA), 5 µM ABA, 50 µM ruthenium red (RR), or 1 µM U73122. RR is a specific chemical that inhibits Ca2+ release from vacuole to cytosol [39]. U73122 is an inhibitor of phospholipase C that reduces inositol 1,4,5-triphosphate (IP3) production [40,41].
Seedlings from each treatment were randomly harvested 0, 6, and 24 h after the onset of the experiments (zero time corresponded to 1 h after the beginning of the photoperiod), and they were used for Ca2+ imaging by fluorescence microscopy and gene expression measurements.
In addition, for B resupply assays, Arabidopsis seedlings were grown with CM supplemented with 2 µM H3BO3 for 6 d, and then seedlings were transferred to fresh CM without B for 24 h. Subsequently, plants were transferred to renewed CM but supplemented with 2 µM H3BO3 for 1, 3, 6, or 24 h. At the indicated times, images were taken by fluorescence microscopy to visualize the change in cytosolic Ca2+ levels.
Analytical-grade compounds were always used to prepare nutrient solutions and reagents. Purified water was obtained by a system consisting of three units (active charcoal, ion exchanger, and reverse osmosis) connected in series to an ELGA water purification system (PURELAB ultra), which supplied water with an electrical resistivity of 18.2 MΩ cm.
3.2. Imaging of Cytosolic Ca2+ Levels
Root [Ca2+]cyt measurements were performed using an A. thaliana line expressing Yellow Cameleon 3.6 (YC3.6) [51]. YC3.6 structure and its fluorescence emission mechanism upon its binding Ca2+ were described by [51,52]. For imaging, Arabidopsis seedlings expressing YC3.6 were grown in CM supplemented with 2 µM H3BO3 for 5–6 d. Afterwards, plants were transferred randomly to fresh CM supplemented with (2 µM, control) or without B, and they were treated or not with EGTA, ABA, RR, or U73122 as previously described. In vivo root Ca2+ measurements were performed at the above indicated times after onset of the treatments on an inverted fluorescence microscope (SP5 MP, DMI6000; Leica). Excitation was provided by an argon lamp through a 458 nm filter at 30% of its intensity, and emission filters were 485/20 nm (ECFP) and 535/15 nm (cpVenus). Image acquisition was performed using LASAF (Leica), and ratio calculations and fluorescence quantifications (raw integrated density) were determined using ImageJ (http://imagej.nih.gov/ij/) software. To hold the roots in position, each seedling was submerged in CM, with (2 µM, control) or without B, and treated or not with EGTA, ABA, RR, or U73122, between a slide and a cover slip to create a sandwich to fix the root and proceed with Ca2+ measurements.
3.3. RNA Isolation, cDNA Synthesis, and Quantitative Real-Time PCR Analyses
For these determinations, Arabidopsis ecotype Col-0 seedlings were grown in CM supplemented with 2 µM H3BO3 for 6 d, and then they were transferred randomly to fresh CM with (2 µM, control) or without B and treated or not with EGTA or ABA, as previously described. Four pools of 14 roots from each treatment were harvested randomly 0 and 24 h after the onset of the treatments. Roots were quickly separated, dried with a paper towel, frozen in liquid nitrogen, and stored at –80 °C until further analyses.
The expression levels of CNGC19, ACA10, and CAX3 genes were normalized to the levels of Arabidopsis AP4M (TAIR ID: AT4g24550), EF1α (TAIR ID: At1g07940), and TON1A (TAIR ID: At3g55000) reference genes. The following gene-specific primers were used for qRT-PCR analyses: CNGC19 (TAIR ID: At3g17690) (forward primer CCAAGTGGCTTGGAGATACC), reverse primer TCTACCAAACCAAACATCATCATC); ACA10 (TAIR ID: At4g29900) (forward primer AAACCGGTGGAGAAGGAACT, reverse primer CCACTAAAAGCCACCTTTGG); CAX3 (TAIR ID: At3g51860) (forward primer TGATTCGTCATCCAAAAACG, reverse primer AAGCTCCCTCCCTCATTCAT); AP4M (TAIR ID: AT4g24550) (forward primer AGCATACAC TGCGTGCAAAG, reverse primer TCGCCTGTGTCACATATCTC); EF1α (TAIR ID: At1g07940) (forward primer CCTTGGTGTCAAGCAGATGA, reverse primer TGAAGACACCTCCTTGATGATTT); and TON1A (TAIR ID: At3g55000) (forward primer: TGTGAGGGATGGAACAAATG; reverse primer: AACGCAGTTGCAAATAAAGGA). CNGC19, ACA10, and CAX3 gene expressions were analyzed using the geometric mean of the three housekeeping genes above mentioned, as reported by [53]. Efficiency of qRT-PCR reactions was higher than 94%.
3.4. Total Boron Content Analyses
Pools of frozen roots were ground to a fine powder in a mortar precooled with liquid nitrogen, transferred to porcelain crucibles, and dried out at 80 °C for 72 h. Subsequently, dried pools were weighed and burnt to ashes at 550 °C for 6 h. Ashes, once at room temperature within a desiccator, were dissolved with 0.1 M HCl, and then B was determined following the azomethine-H method as described by [54].
3.5. Statistical Analysis
The data shown were mean values ±SD. Results were statistically analyzed using one-way analysis of variance (ANOVA). Differences among treatment means were evaluated using Tukey’s honestly significant difference test (p < 0.05). Regarding Ca2+ imaging by fluorescence microscopy, representative images from 4 to 13 primary roots for each treatment were shown. Data were from a representative experiment that was repeated twice with very similar results.
4. Conclusions
In summary, it can be concluded that B deficiency elicits increased [Ca2+]cyt after 6 and 24 h of this nutrient stress, which is due mainly to Ca2+ influx across the plasma membrane from the apoplast, even though it cannot be ruled out that Ca2+ also comes from the vacuole through the tonoplast CNGC19 channel. When B-sufficient conditions are re-established, [Ca2+]cyt is gradually restored. CAX3 would play a major role in the restoration of Ca2+ homeostasis after 24 h of B deficiency.
Author Contributions
J.R., M.T.N.-G., and A.G.-F. planned and designed the research and carried out analysis and interpretation of data. C.Q.-P. performed the experiments, and the remaining authors contributed to this work. J.R. wrote the first draft of the manuscript. M.T.N.-G., A.G.-F., M.B.H.-R., and J.J.C.-C. made a critical revision of the manuscript with significant contributions.
Funding
This work was supported by the Ministerio de Ciencia e Innovación (BFU2012-37445 and BFU2017-88811-P) and Junta de Andalucía (BIO-266 and P09-CVI-4721), Spain.
Acknowledgments
The authors are deeply grateful to Jörg Kudla (Institut für Biologie und Biotechnologie der Pflanzen, Universität Münster, Germany) for providing seeds of A. thaliana expressing a fluorescence resonance energy transfer (FRET)-based Ca2+ sensor (UbiQ10:YC3.6-bar#22-2). The authors thank Marta Fernández García for skillful technical assistance.
Conflicts of Interest
The authors declare no conflict of interest.
Abbreviations
| ABA | Abscisic Acid |
| ACA | Autoinhibited Ca2+-ATPases |
| cADPR | Cyclic ADP-ribose |
| CAX | Cation/H+ Exchanger |
| [Ca2+]cyt | Cytosolic Calcium Concentration |
| CM | Culture Medium |
| CNGC | Cyclic Nucleotide-Gated Ion Channels |
| EGTA | Ethylene Glycol Tetraacetic Acid |
| IP3 | Inositol 1,4,5-Triphosphate |
| FRET | Fluorescence Resonance Energy Transfer |
| ROS | Reactive Oxygen Species |
| RR | Ruthenium Red |
| qRT-PCR | Quantitative Real Time-PCR |
References
- López-Bucio, J.; Cruz-Ramírez, A.; Herrera-Estrella, L. The role of nutrient availability in regulating root architecture. Curr. Opin. Plant Biol. 2003, 6, 280–287. [Google Scholar] [CrossRef]
- Kochian, L.V.; Lucas, W.J. Plant mineral nutrient sensing and signaling. J. Integr. Plant Biol. 2014, 56, 190–191. [Google Scholar] [CrossRef]
- Dodd, A.N.; Kudla, J.; Sanders, D. The language of calcium signaling. Annu. Rev. Plant Biol. 2010, 61, 593–620. [Google Scholar] [CrossRef] [PubMed]
- Conn, S.; Gilliham, M. Comparative physiology of elemental distributions in plants. Ann. Bot. 2010, 105, 1081–1102. [Google Scholar] [CrossRef]
- Sanders, D.; Pelloux, J.; Brownlee, C.; Harper, J.F. Calcium at the crossroads of signaling. Plant Cell 2002, 14, S401–S417. [Google Scholar] [CrossRef] [PubMed]
- Hetherington, A.M.; Brownlee, C. The generation of Ca2+ signals in plants. Annu. Rev. Plant Biol. 2004, 55, 401–427. [Google Scholar] [CrossRef]
- González-Fontes, A.; Navarro-Gochicoa, M.T.; Ceacero, C.J.; Herrera-Rodríguez, M.B.; Camacho-Cristóbal, J.J.; Rexach, J. Understanding calcium transport and signaling, and its use efficiency in vascular plants. In Plant Macronutrient Use Efficiency: Molecular and Genomic Perspectives in Crop Plants; Hossain, M.A., Kamiya, T., Burritt, D.J., Phan Tran, L.S.P., Fujiwara, T., Eds.; Academic Press: San Diego, CA, USA, 2017; pp. 165–180. [Google Scholar]
- Swarbreck, S.M.; Colaço, R.; Davies, J.M. Plant calcium-permeable channels. Plant Physiol. 2013, 163, 514–522. [Google Scholar] [CrossRef]
- Finka, A.; Cuendet, A.F.H.; Maathuis, F.J.M.; Saidi, Y.; Goloubinoff, P. Plasma membrane cyclic nucleotide gated calcium channels control land plant thermal sensing and acquired thermotolerance. Plant Cell 2012, 24, 3333–3348. [Google Scholar] [CrossRef]
- DeFalco, T.A.; Moeder, W.; Yoshioka, K. Opening the gates: Insights into cyclic nucleotide-gated channel-mediated signaling. Trends Plant Sci. 2016, 21, 903–906. [Google Scholar] [CrossRef] [PubMed]
- Yuen, C.C.Y.; Christopher, D.A. The group IV-A cyclic nucleotide-gated channels, CNGC19 and CNGC20, localize to the vacuole membrane in Arabidopsis thaliana. AoB Plants 2013, 5. [Google Scholar] [CrossRef]
- Pittman, J.K.; Bonza, M.C.; De Michelis, M.I. Ca2+ pumps and Ca2+ antiporters in plant development. In Transporters and Pumps in Plant Signaling; Geisler, M., Venema, K., Eds.; Springer: Berlin, Germany, 2011; pp. 133–161. [Google Scholar]
- Warington, K. The effect of boric acid and borax on the broad bean and certain other plants. Ann. Bot. 1923, 37, 629–672. [Google Scholar] [CrossRef]
- Goldbach, H.E.; Wimmer, M. Boron in plants and animals: Is there a role beyond cell-wall structure? J. Plant Nutr. Soil Sci. 2007, 170, 39–48. [Google Scholar] [CrossRef]
- Tanaka, M.; Fujiwara, T. Physiological roles and transport mechanisms of boron: Perspectives from plants. Eur. J. Physiol. 2008, 456, 671–677. [Google Scholar] [CrossRef] [PubMed]
- Shorrocks, V.M. The occurrence and correction of boron deficiency. Plant Soil 1997, 193, 121–148. [Google Scholar] [CrossRef]
- Herrera-Rodríguez, M.B.; González-Fontes, A.; Rexach, J.; Camacho-Cristóbal, J.J.; Maldonado, J.M.; Navarro-Gochicoa, M.T. Role of boron in vascular plants and response mechanisms to boron stress. Plant Stress 2010, 4, 115–122. [Google Scholar]
- Camacho-Cristóbal, J.J.; Navarro-Gochicoa, M.T.; Rexach, J.; González-Fontes, A.; Herrera-Rodríguez, M.B. Plant response to boron deficiency and boron use efficiency in crop plants. In Plant Micronutrient Use Efficiency: Molecular and Genomic Perspectives in Crop Plants; Hossain, M.A., Kamiya, T., Burritt, D.J., Phan Tran, L.S., Fujiwara, T., Eds.; Academic Press: San Diego, CA, USA, 2018; pp. 109–121. [Google Scholar]
- Kobayashi, M.; Matoh, T.; Azuma, J. Two chains of rhamnogalacturonan II are cross-linked by borate-diol ester bonds in higher plant cell walls. Plant Physiol. 1996, 110, 1017–1020. [Google Scholar] [CrossRef]
- O’Neill, M.A.; Warrenfeltz, D.; Kates, K.; Pellerin, P.; Doco, T.; Darvill, A.G.; Albersheim, P. Rhamnogalacturonan-II, a pectic polysaccharide in the walls of growing plant cell, forms a dimer that is covalently cross-linked by a borate ester. J. Biol. Chem. 1996, 271, 22923–22930. [Google Scholar] [CrossRef]
- Blevins, D.G.; Lukaszewski, K.M. Boron in plant structure and function. Annu. Rev. Plant Physiol. Plant Mol. Biol. 1998, 49, 481–500. [Google Scholar] [CrossRef] [PubMed]
- Brown, P.H.; Bellaloui, N.; Wimmer, M.A.; Bassil, E.S.; Ruiz, J.; Hu, H.; Pfeffer, H.; Dannel, F.; Römheld, V. Boron in plant biology. Plant Biol. 2002, 4, 205–223. [Google Scholar] [CrossRef]
- Bolaños, L.; Lukaszewski, K.; Bonilla, I.; Blevins, D. Why boron? Plant Physiol. Biochem. 2004, 42, 907–912. [Google Scholar] [CrossRef]
- Camacho-Cristóbal, J.J.; Rexach, J.; González-Fontes, A. Boron in plants: Deficiency and toxicity. J. Integr. Plant Biol. 2008, 50, 1247–1255. [Google Scholar] [CrossRef]
- Camacho-Cristóbal, J.J.; Rexach, J.; Herrera-Rodríguez, M.B.; Navarro-Gochicoa, M.T.; González-Fontes, A. Boron deficiency and transcript level changes. Plant Sci. 2011, 181, 85–89. [Google Scholar] [CrossRef] [PubMed]
- Reid, R. Understanding the boron transport network in plants. Plant Soil 2014, 385, 1–13. [Google Scholar] [CrossRef]
- Hua, Y.; Feng, Y.; Zhou, T.; Xu, F. Genome-scale mRNA transcriptomic insights into the responses of oilseed rape (Brassica napus L.) to varying boron availabilities. Plant Soil 2017, 416, 205–225. [Google Scholar] [CrossRef]
- Liu, X.; Zhang, J.-W.; Guo, L.-X.; Liu, Y.-Z.; Jin, L.-F.; Hussain, S.B.; Du, W.; Deng, Z.; Peng, S.-A. Transcriptome changes associated with boron deficiency in leaves of two citrus scion-rootstock combinations. Front. Plant Sci. 2017, 8, 317. [Google Scholar] [CrossRef]
- Koshiba, T.; Kobayashi, M.; Ishihara, A.; Matoh, T. Boron nutrition of cultured tobacco BY-2 cells. VI. Calcium is involved in early responses to boron deprivation. Plant Cell Physiol. 2010, 51, 323–327. [Google Scholar] [CrossRef] [PubMed]
- Quiles-Pando, C.; Rexach, J.; Navarro-Gochicoa, M.T.; Camacho-Cristóbal, J.J.; Herrera-Rodríguez, M.B.; González-Fontes, A. Boron deficiency increases the levels of cytosolic Ca2+ and expression of Ca2+-related genes in Arabidopsis thaliana roots. Plant Physiol. Biochem. 2013, 65, 55–60. [Google Scholar] [CrossRef]
- Fang, K.F.; Du, B.S.; Zhang, Q.; Xing, Y.; Cao, Q.Q.; Qin, L. Boron deficiency alters cytosolic Ca2+ concentration and affects the cell wall components of pollen tubes in Malus domestica. Plant Biol. 2019, 21, 343–351. [Google Scholar] [CrossRef]
- Gilroy, S.; Suzuki, N.; Miller, G.; Choi, W.G.; Toyota, M.; Devireddy, A.R.; Mittler, R. A tidal wave of signals: Calcium and ROS at the forefront of rapid systemic signaling. Trends Plant Sci. 2014, 19, 623–630. [Google Scholar] [CrossRef]
- White, P.J.; Bowen, H.C.; Demidchik, V.; Nichols, C.; Davies, J.M. Genes for calcium-permeable channels in the plasma membrane of plant root cells. Biochim. Biophys. Acta 2002, 1564, 299–309. [Google Scholar] [CrossRef]
- Bai, L.; Zhang, G.; Zhou, Y.; Zhang, Z.; Wang, W.; Du, Y.; Wu, Z.; Song, C.-P. Plasma membrane-associated proline-rich extensin-like receptor kinase 4, a novel regulator of Ca2+ signalling, is required for abscisic acid responses in Arabidopsis thaliana. Plant J. 2009, 60, 314–327. [Google Scholar] [CrossRef] [PubMed]
- Jiao, Y.; Sun, L.; Song, Y.; Wang, L.; Liu, L.; Zhang, L.; Liu, B.; Li, N.; Miao, C.; Hao, F. AtrbohD and AtrbohF positively regulate abscisic acid-inhibited primary root growth by affecting Ca2+ signalling and auxin response of roots in Arabidopsis. J. Exp. Bot. 2013, 64, 4183–4192. [Google Scholar] [CrossRef] [PubMed]
- Edel, K.H.; Kudla, J. Integration of calcium and ABA signaling. Curr. Opin. Plant Biol. 2016, 33, 83–91. [Google Scholar] [CrossRef]
- Camacho-Cristóbal, J.J.; Martín-Rejano, E.M.; Herrera-Rodríguez, M.B.; Navarro-Gochicoa, M.T.; Rexach, J.; González-Fontes, A. Boron deficiency inhibits root cell elongation via an ethylene/auxin/ROS-dependent pathway in Arabidopsis seedlings. J. Exp. Bot. 2015, 66, 3831–3840. [Google Scholar] [CrossRef]
- González-Fontes, A.; Herrera-Rodríguez, M.B.; Martín-Rejano, E.M.; Navarro-Gochicoa, M.T.; Rexach, J.; Camacho-Cristóbal, J.J. Root responses to boron deficiency mediated by ethylene. Front. Plant Sci. 2016, 6, 1103. [Google Scholar] [CrossRef] [PubMed]
- Muir, S.R.; Bewell, M.A.; Sanders, D.; Allen, G.J. Ligand-gated Ca2+ channels and Ca2+ signalling in higher plants. J. Exp. Bot. 1997, 48, 589–597. [Google Scholar] [CrossRef]
- Franklin-Tong, V.E.; Drobak, B.K.; Allan, A.C.; Watkins, P.A.C.; Trewavas, A.J. Growth of pollen tubes of Papaver rhoeas is regulated by a slow-moving calcium wave propagated by inositol 1,4,5-triphosphate. Plant Cell 1996, 8, 1305–1321. [Google Scholar] [CrossRef] [PubMed]
- Staxén, I.; Pical, C.; Montgomery, L.T.; Gray, J.E.; Hetherington, A.M.; McAinsh, M.R. Abscisic acid induces oscillations in guard-cell cytosolic free calcium that involve phosphoinositide-specific phospholipase C. Proc. Natl. Acad. Sci. USA 1999, 96, 1779–1784. [Google Scholar] [CrossRef]
- González-Fontes, A.; Navarro-Gochicoa, M.T.; Camacho-Cristóbal, J.J.; Herrera-Rodríguez, M.B.; Quiles-Pando, C.; Rexach, J. Is Ca2+ involved in the signal transduction pathway of boron deficiency? New hypotheses for sensing boron deprivation. Plant Sci. 2014, 217, 135–139. [Google Scholar] [CrossRef]
- Kudla, J.; Batistic, O.; Hashimoto, K. Calcium signals: The lead currency of plant information processing. Plant Cell 2010, 22, 541–563. [Google Scholar] [CrossRef]
- Bose, J.; Pottosin, I.I.; Shabala, S.S.; Palmgren, M.G.; Shabala, S. Calcium efflux systems in stress signaling and adaptation in plants. Front. Plant Sci. 2011, 2, 85. [Google Scholar] [CrossRef]
- Wu, Y.; Kuzma, J.; Maréchal, E.; Graeff, R.; Lee, H.C.; Foster, R.; Chua, N.-H. Abscisic acid signaling through cyclic ADP-ribose in plants. Science 1997, 278, 2126–2130. [Google Scholar] [CrossRef]
- Munemasa, S.; Hauser, F.; Park, J.; Waadt, R.; Brandt, B.; Schroeder, J.I. Mechanisms of abscisic acid-mediated control of stomatal aperture. Curr. Opin. Plant Biol. 2015, 28, 154–162. [Google Scholar] [CrossRef] [PubMed]
- Xu, L.; Zahid, K.R.; He, L.; Zhang, W.; He, X.; Zhang, X.; Yang, X.; Zhu, L. GhCAX3 gene, a novel Ca2+/H+ exchanger from cotton, confers regulation of cold response and ABA induced signal transduction. PLoS ONE 2013, 8, e66303. [Google Scholar] [CrossRef] [PubMed]
- Hirschi, K. Vacuolar H+/Ca2+ transport: Who’s directing the traffic? Trends Plant Sci. 2001, 6, 100–104. [Google Scholar] [CrossRef]
- Sze, H.; Liang, F.; Hwang, I.; Curran, A.C.; Harper, J.F. Diversity and regulation of plant Ca2+ pumps: Insights from expression in yeast. Annu. Rev. Plant Physiol. Plant Mol. Biol. 2000, 51, 433–462. [Google Scholar] [CrossRef]
- Pittman, J.K.; Hirschi, K.D. CAX-ing a wide net: Cation/H+ transporters in metal remediation and abiotic stress signaling. Plant Biol. 2016, 18, 741–749. [Google Scholar] [CrossRef]
- Krebs, M.; Held, K.; Binder, A.; Hashimoto, K.; Herder, G.D.; Parniske, M.; Kudla, J.; Schumacher, K. FRET-based genetically encoded sensors allow high-resolution live cell imaging of Ca2+ dynamics. Plant J. 2012, 69, 181–192. [Google Scholar] [CrossRef]
- Miyawaki, A.; Llopis, J.; Heim, R.; McCaffery, J.M.; Adams, J.A.; Ikura, M.; Tsien, R.Y. Fluorescent indicators for Ca2+ based on green fluorescent proteins and calmodulin. Nature 1997, 388, 882–887. [Google Scholar] [CrossRef]
- Vandesompele, J.; De Preter, K.; Pattyn, F.; Poppe, B.; Van Roy, N.; De Paepe, A.; Speleman, F. Accurate normalization of real-time quantitative RT-PCR data by geometric averaging of multiple internal control genes. Genome Biol. 2002, 3. [Google Scholar] [CrossRef]
- Beato, V.M.; Rexach, J.; Navarro-Gochicoa, M.T.; Camacho-Cristóbal, J.J.; Herrera-Rodríguez, M.B.; González-Fontes, A. A tobacco asparagine synthetase gene responds to carbon and nitrogen status and its root expression is affected under boron stress. Plant Sci. 2010, 178, 289–298. [Google Scholar] [CrossRef]
© 2019 by the authors. Licensee MDPI, Basel, Switzerland. This article is an open access article distributed under the terms and conditions of the Creative Commons Attribution (CC BY) license (http://creativecommons.org/licenses/by/4.0/).