What Drives Symbiotic Calcium Signalling in Legumes? Insights and Challenges of Imaging

Abstract
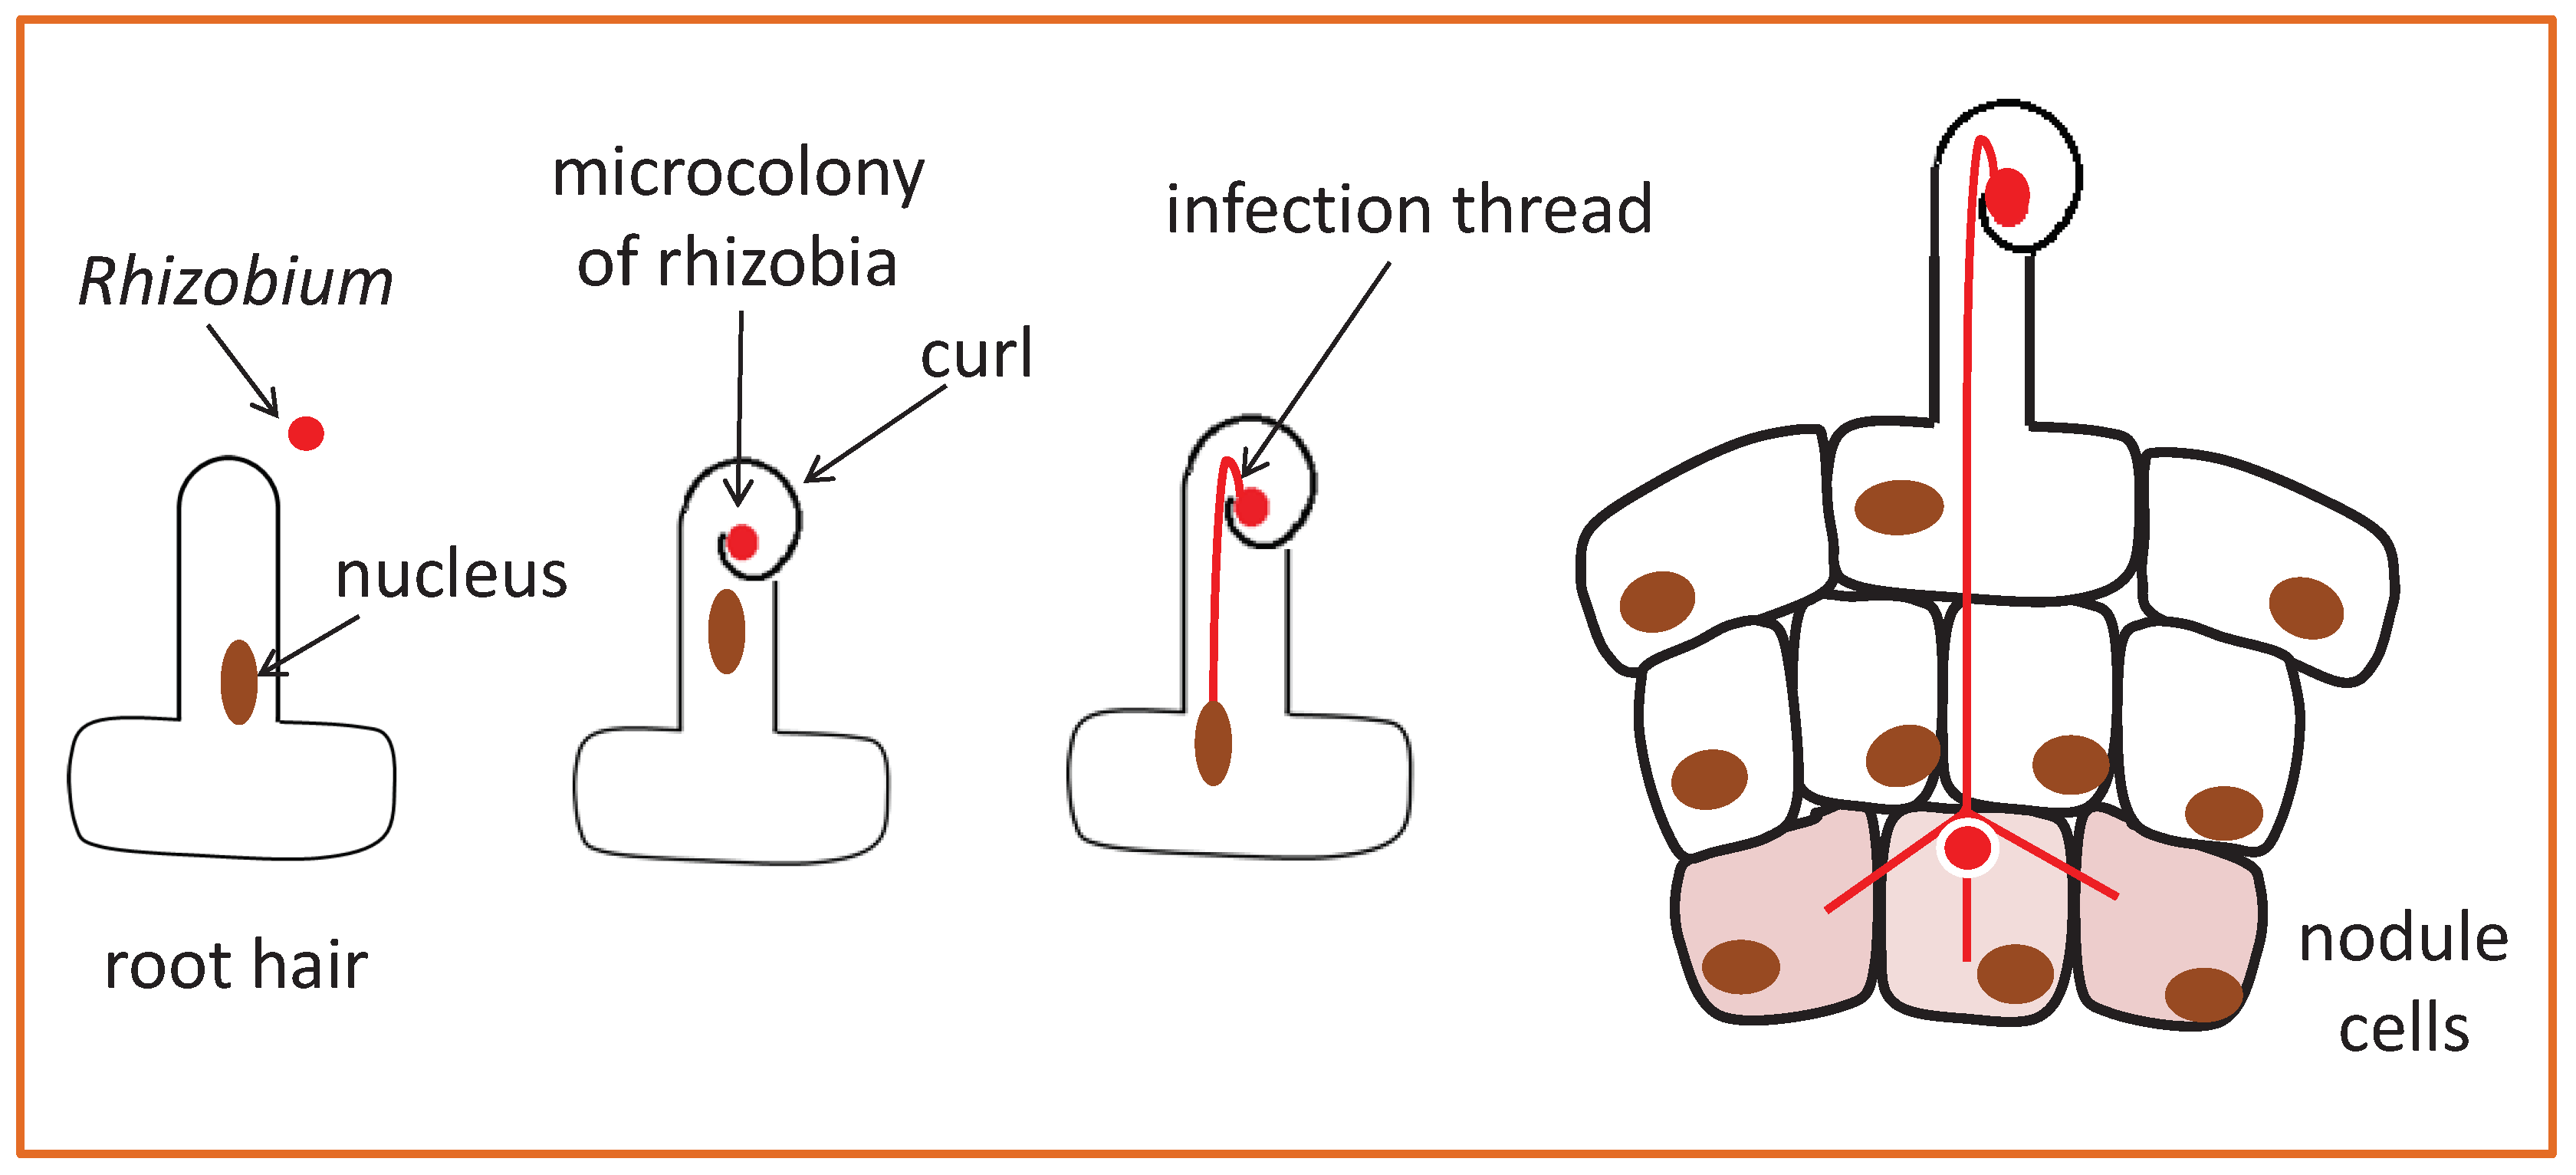
1. Introduction
2. Two Symbiotic Calcium Signals
2.1. Ca Spiking Around and Inside the Nucleus
2.2. Ca Levels Rise at the Root Hair Tip
3. Calcium Signatures
3.1. Ca Frequency
3.2. The Shape of Calcium Spikes
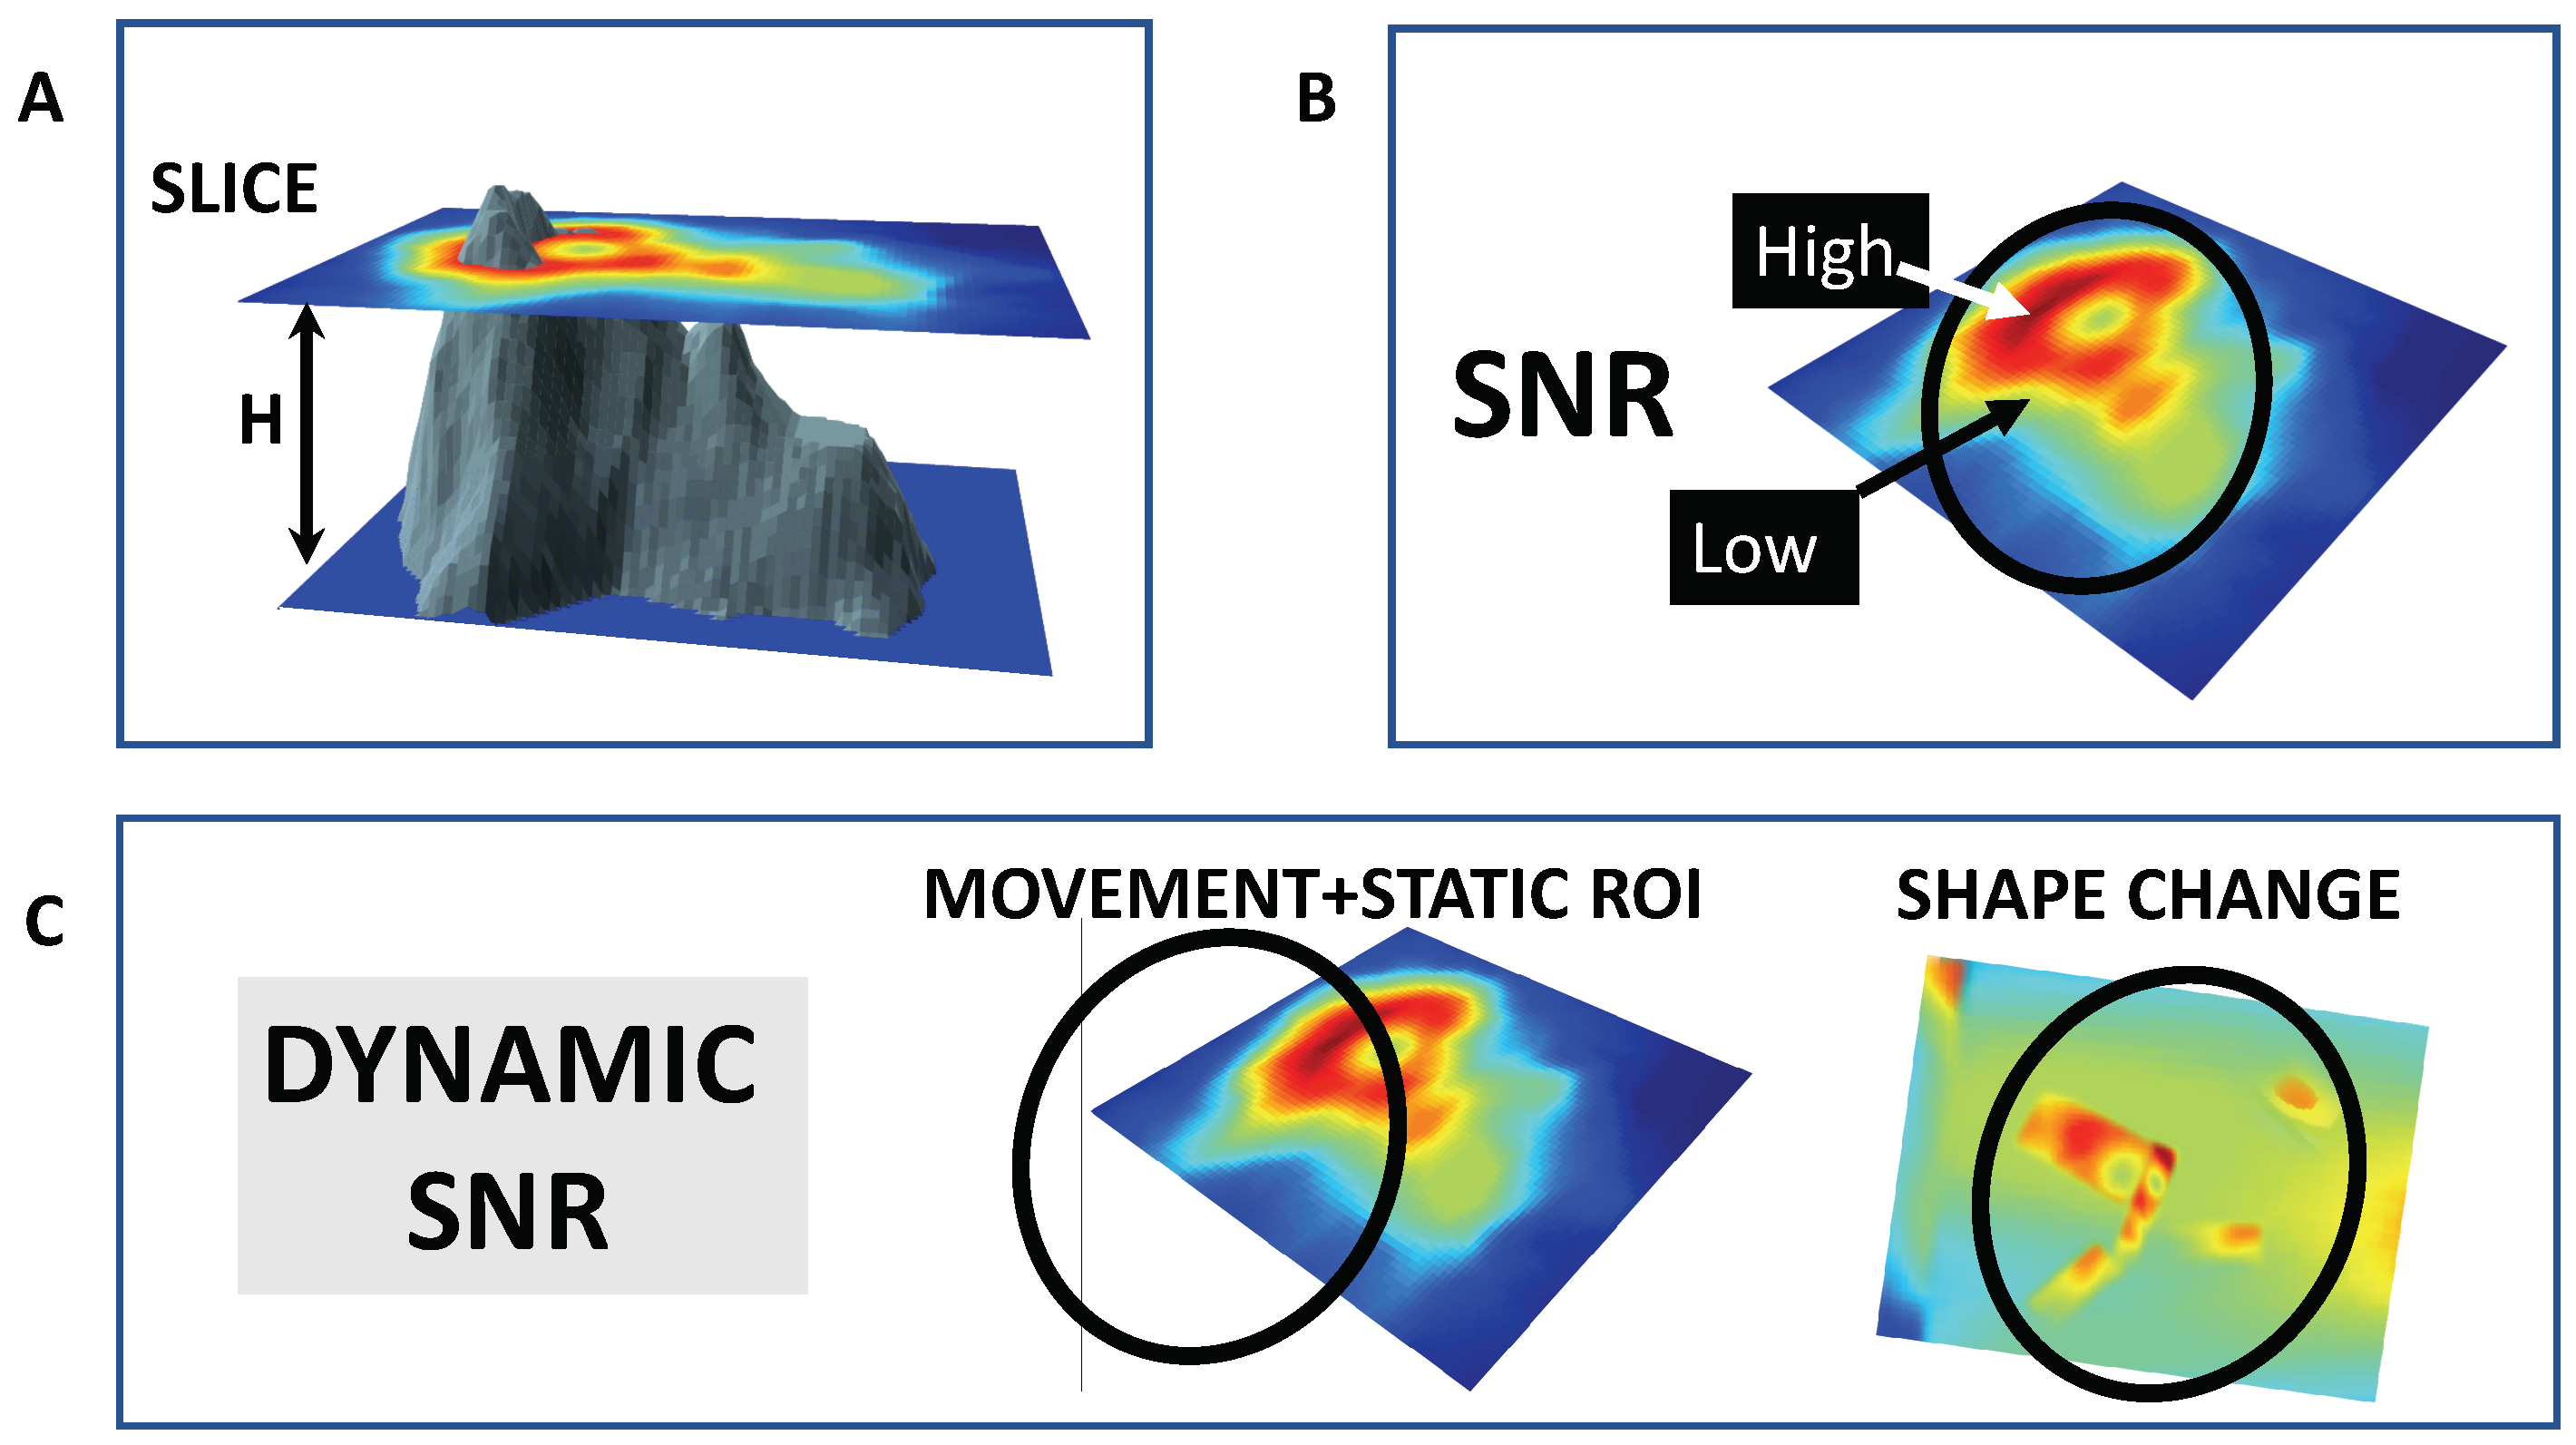
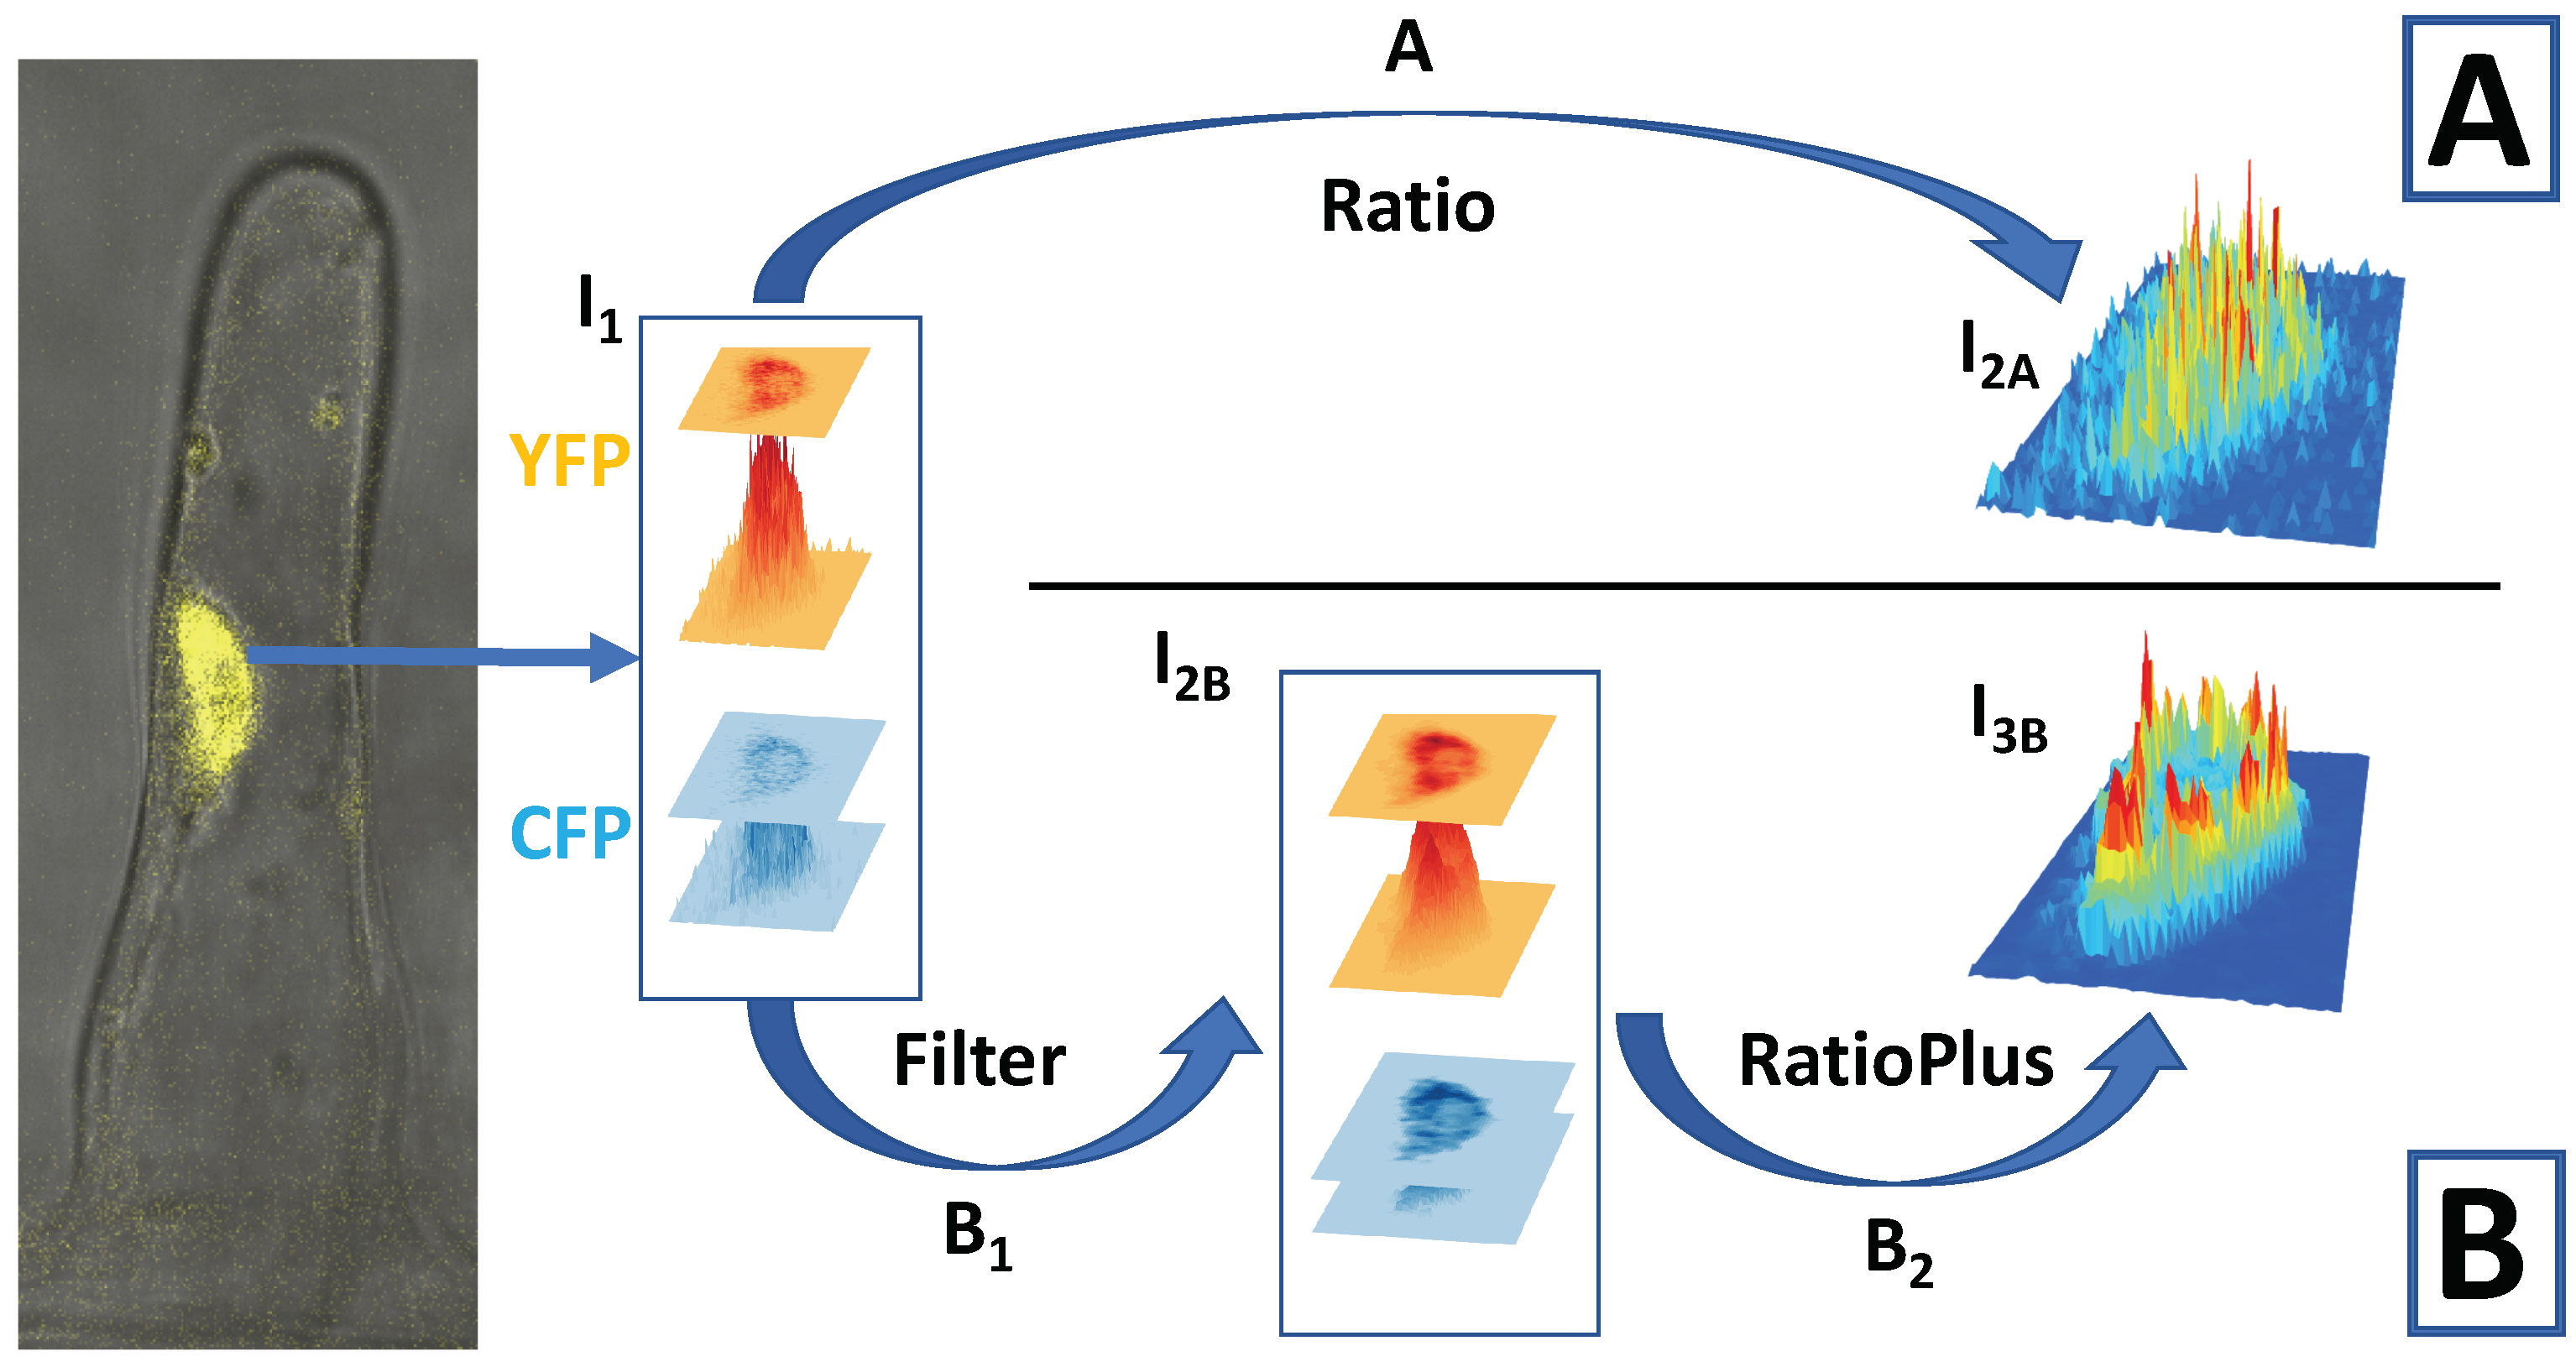
4. Imaging Ca Spiking
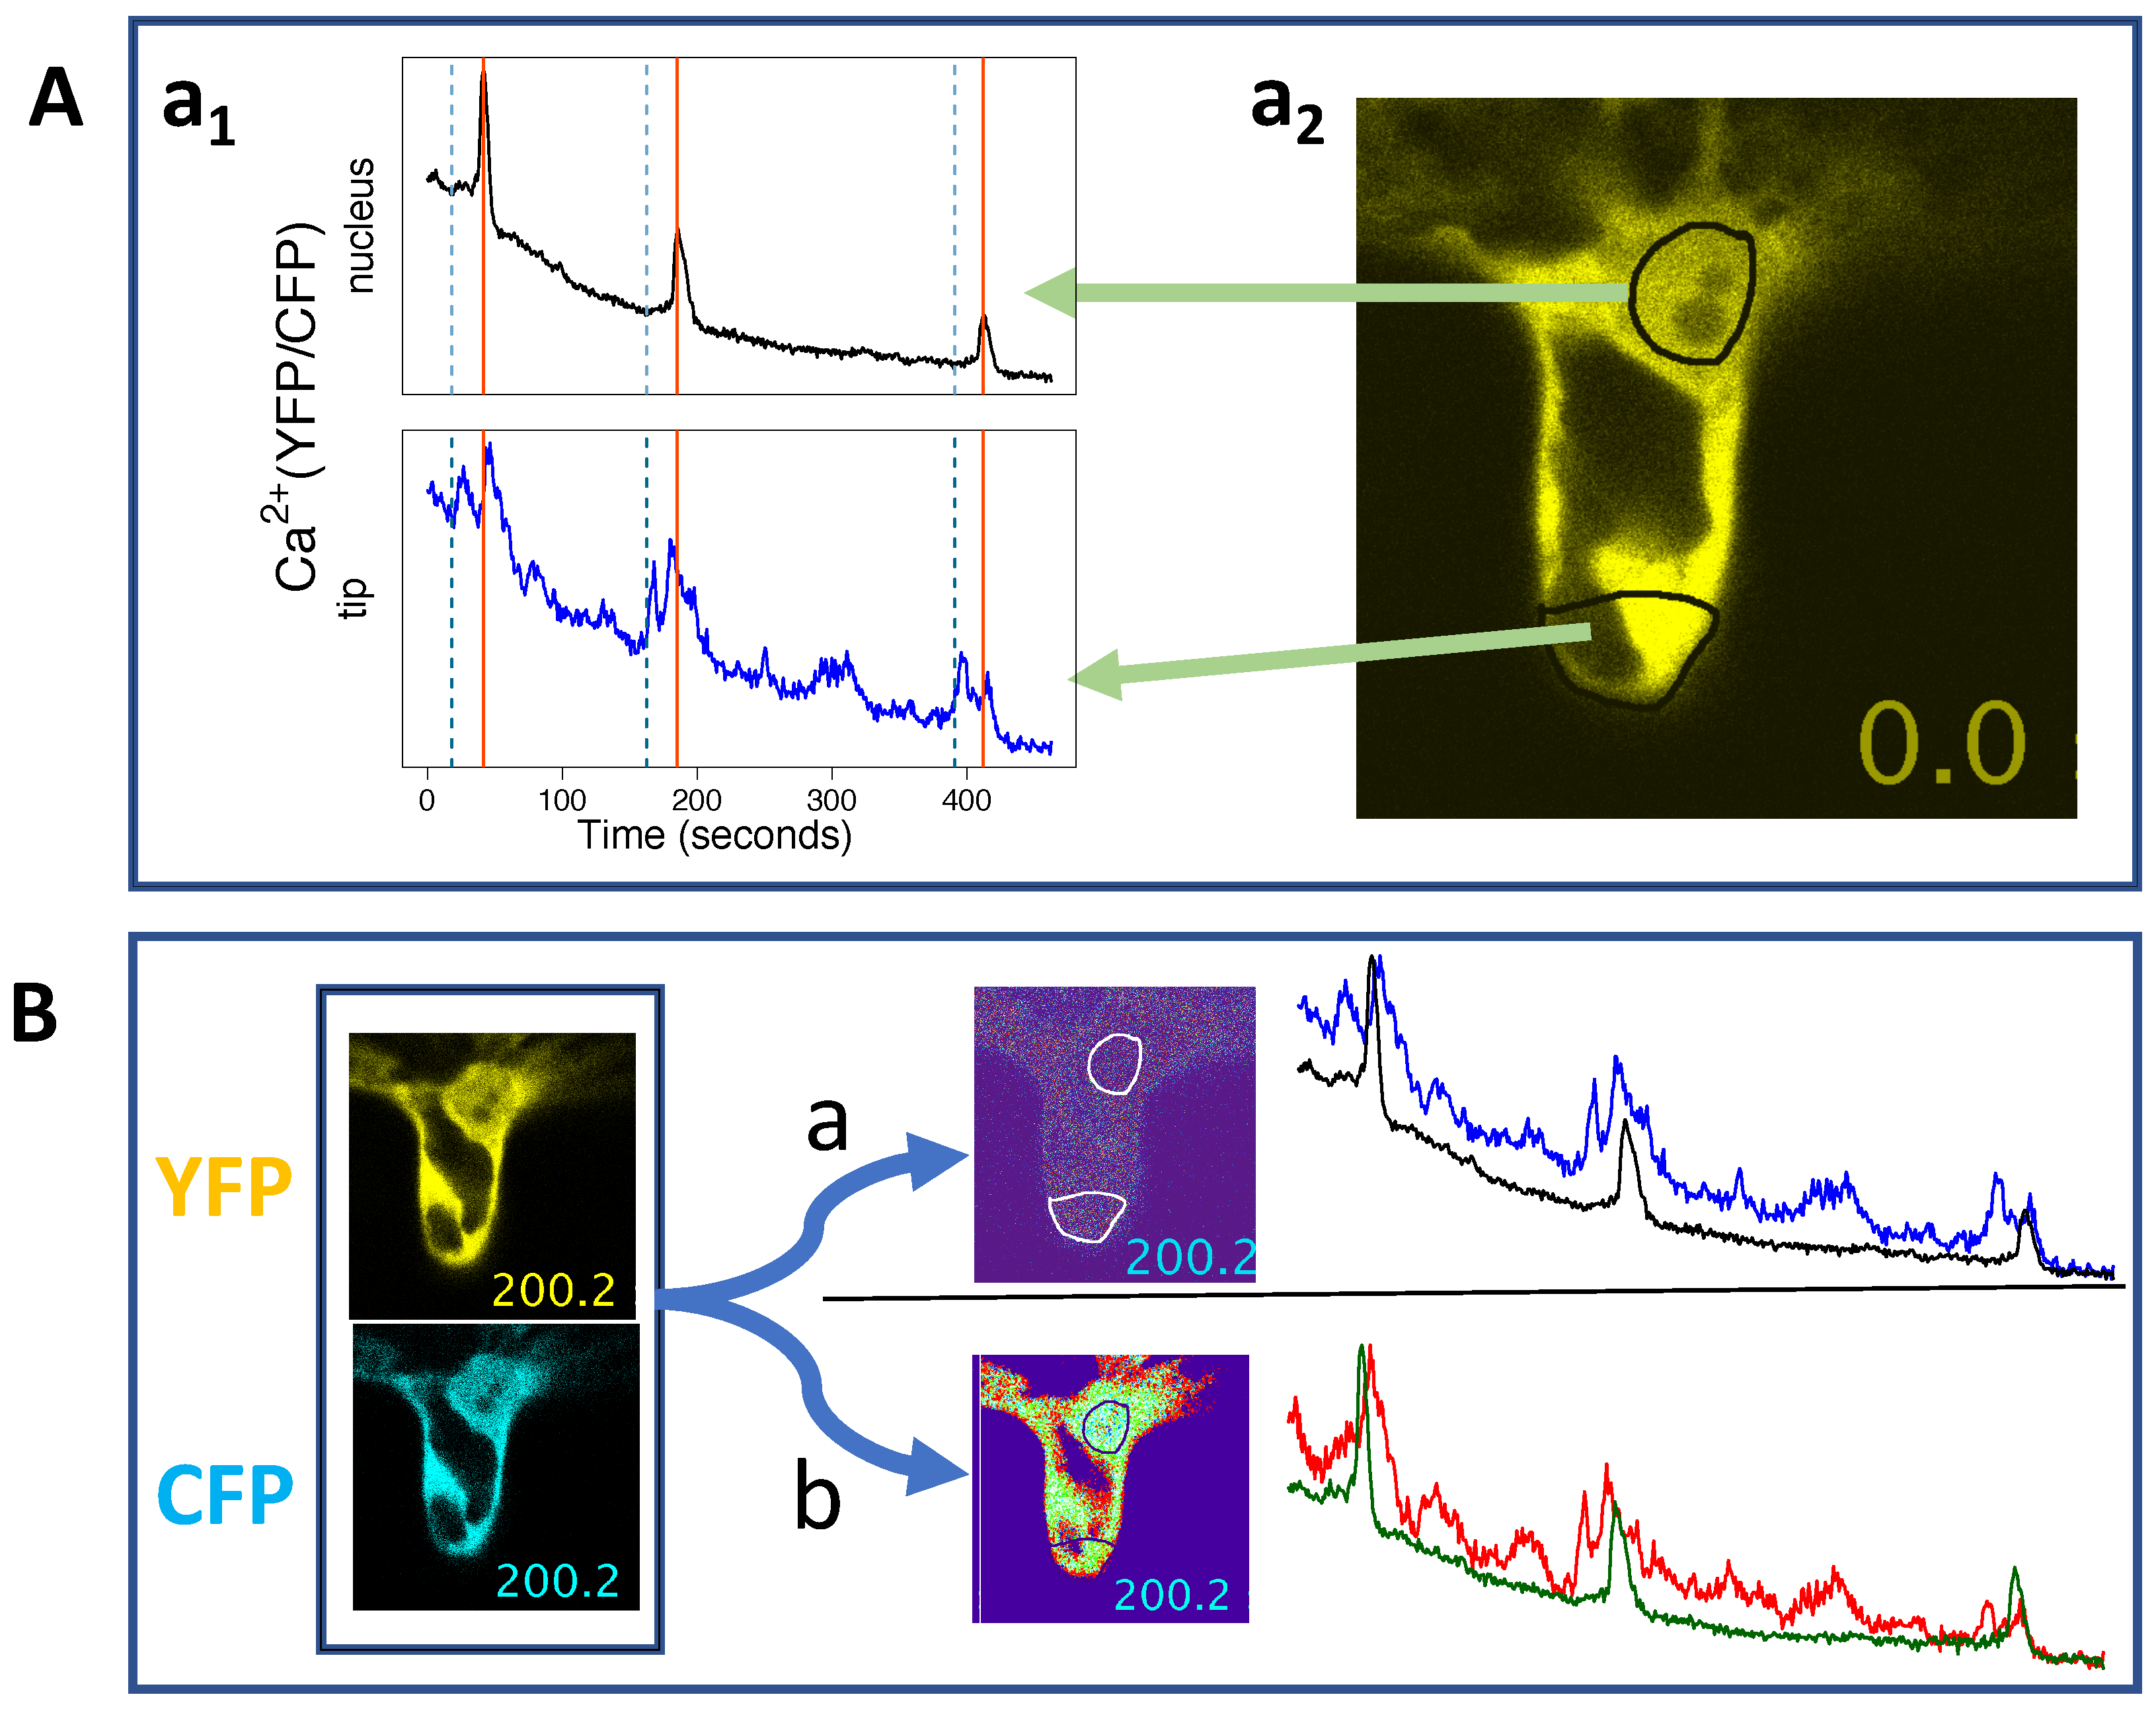
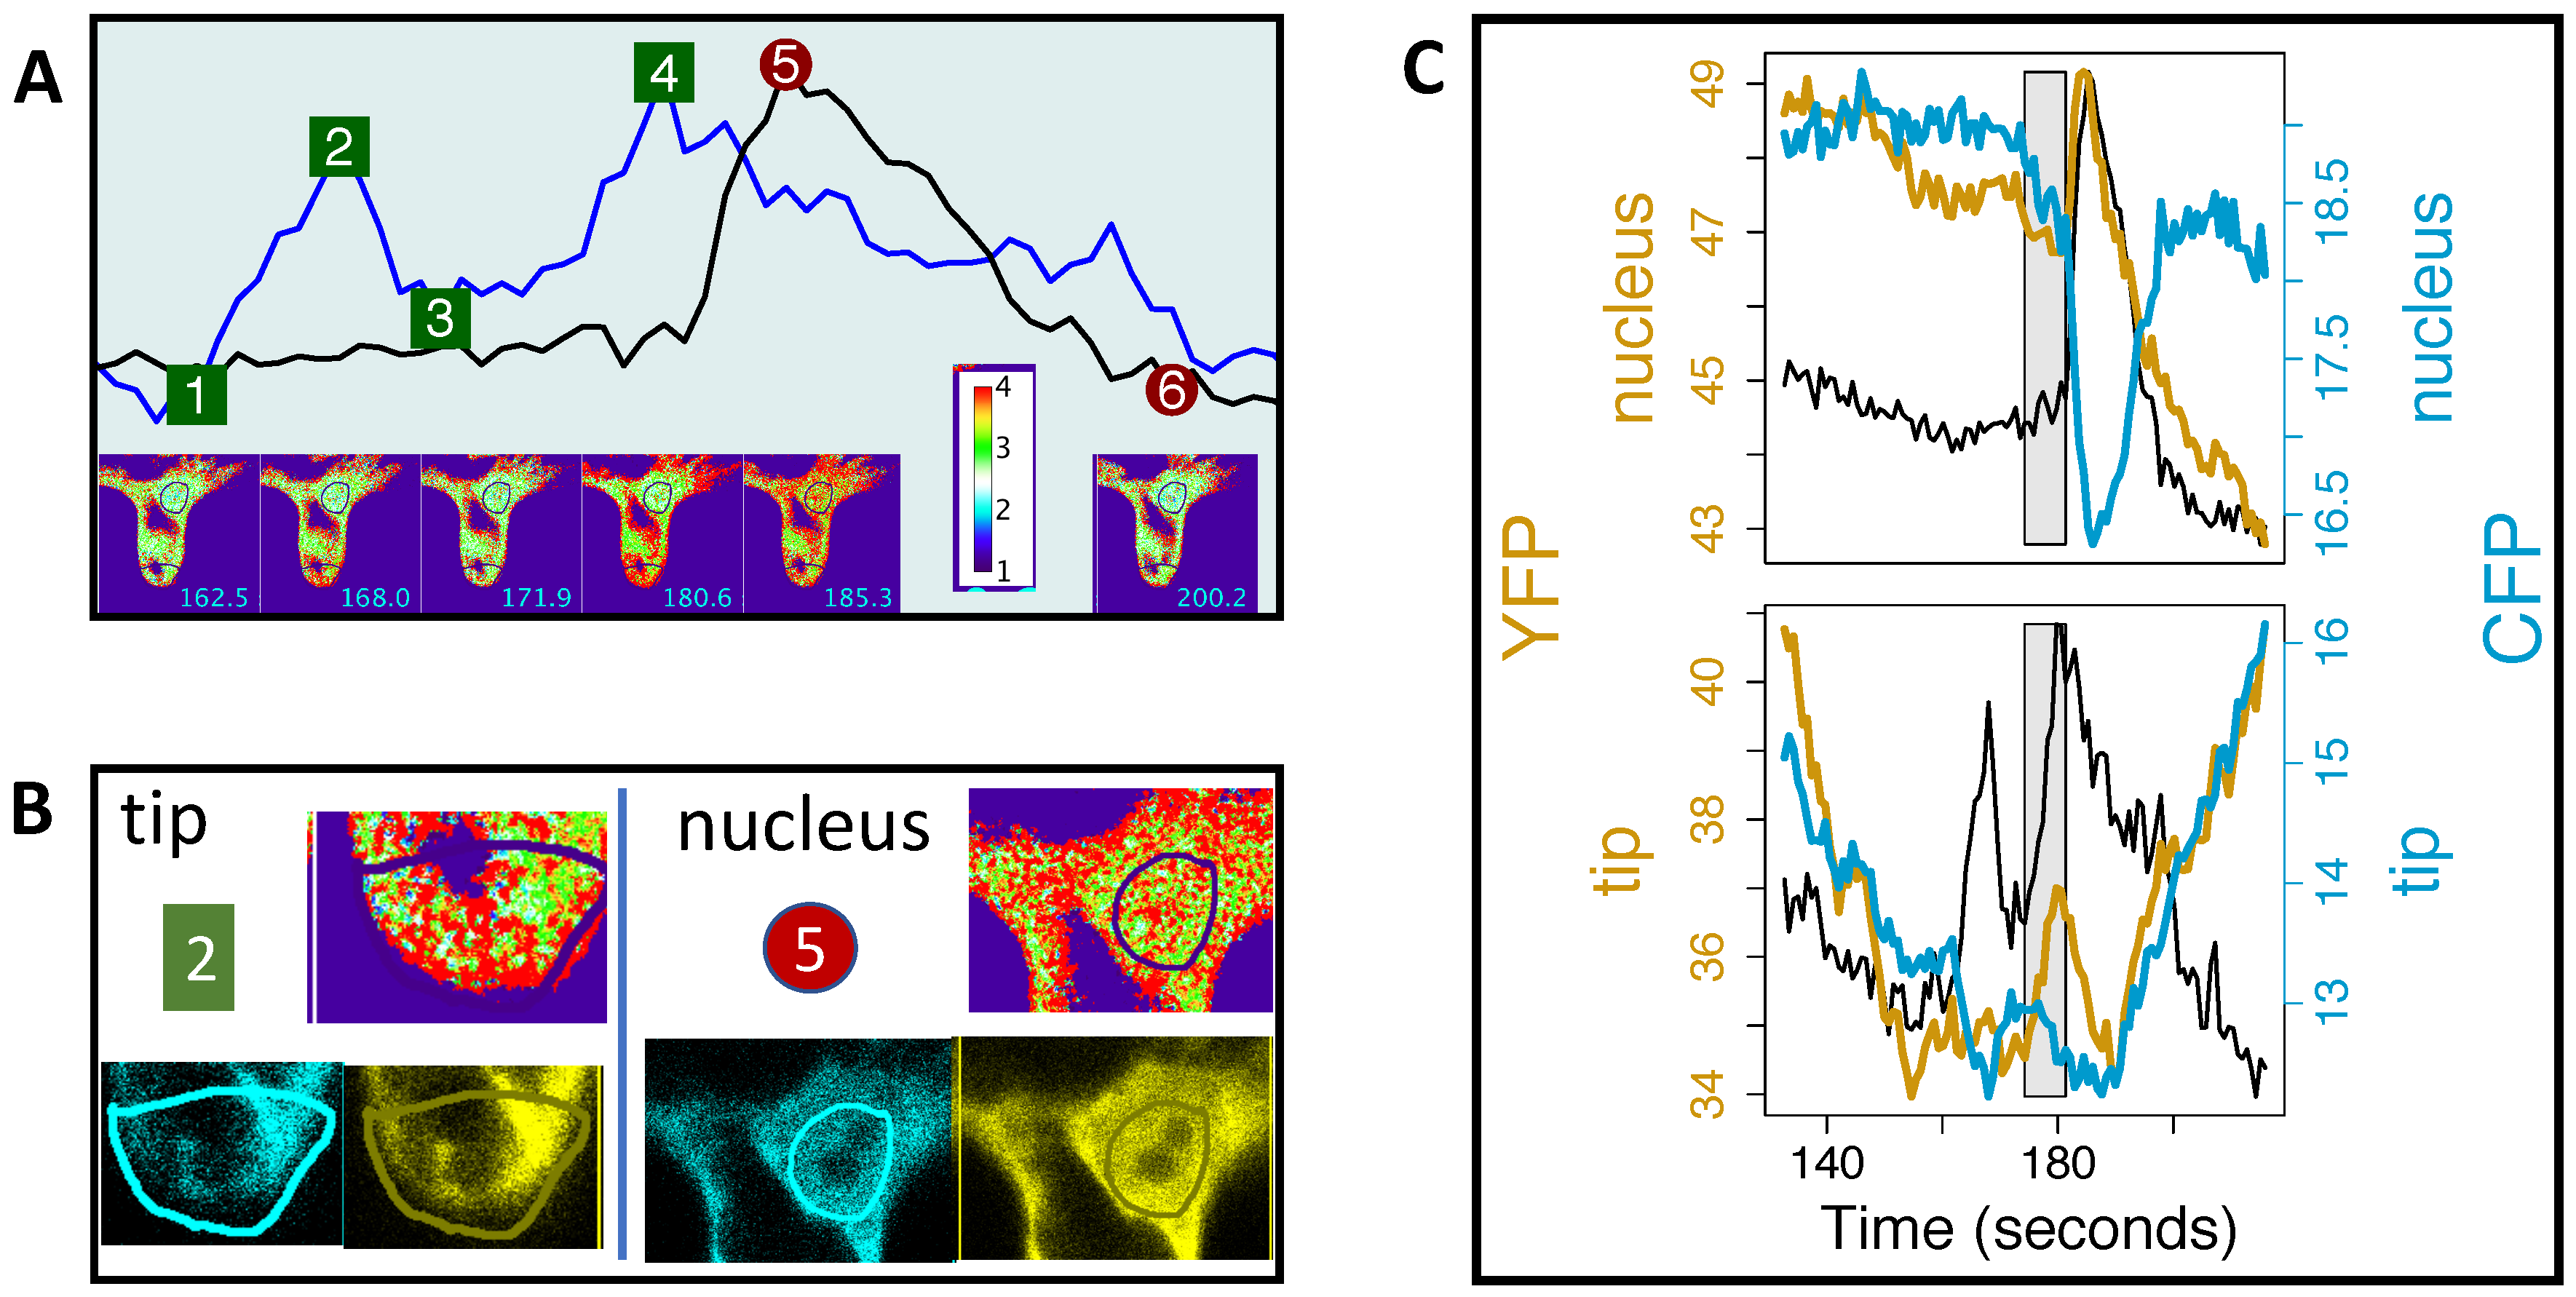
4.1. Do We See Intranuclear Calcium Being Released from the Nuclear Periphery?
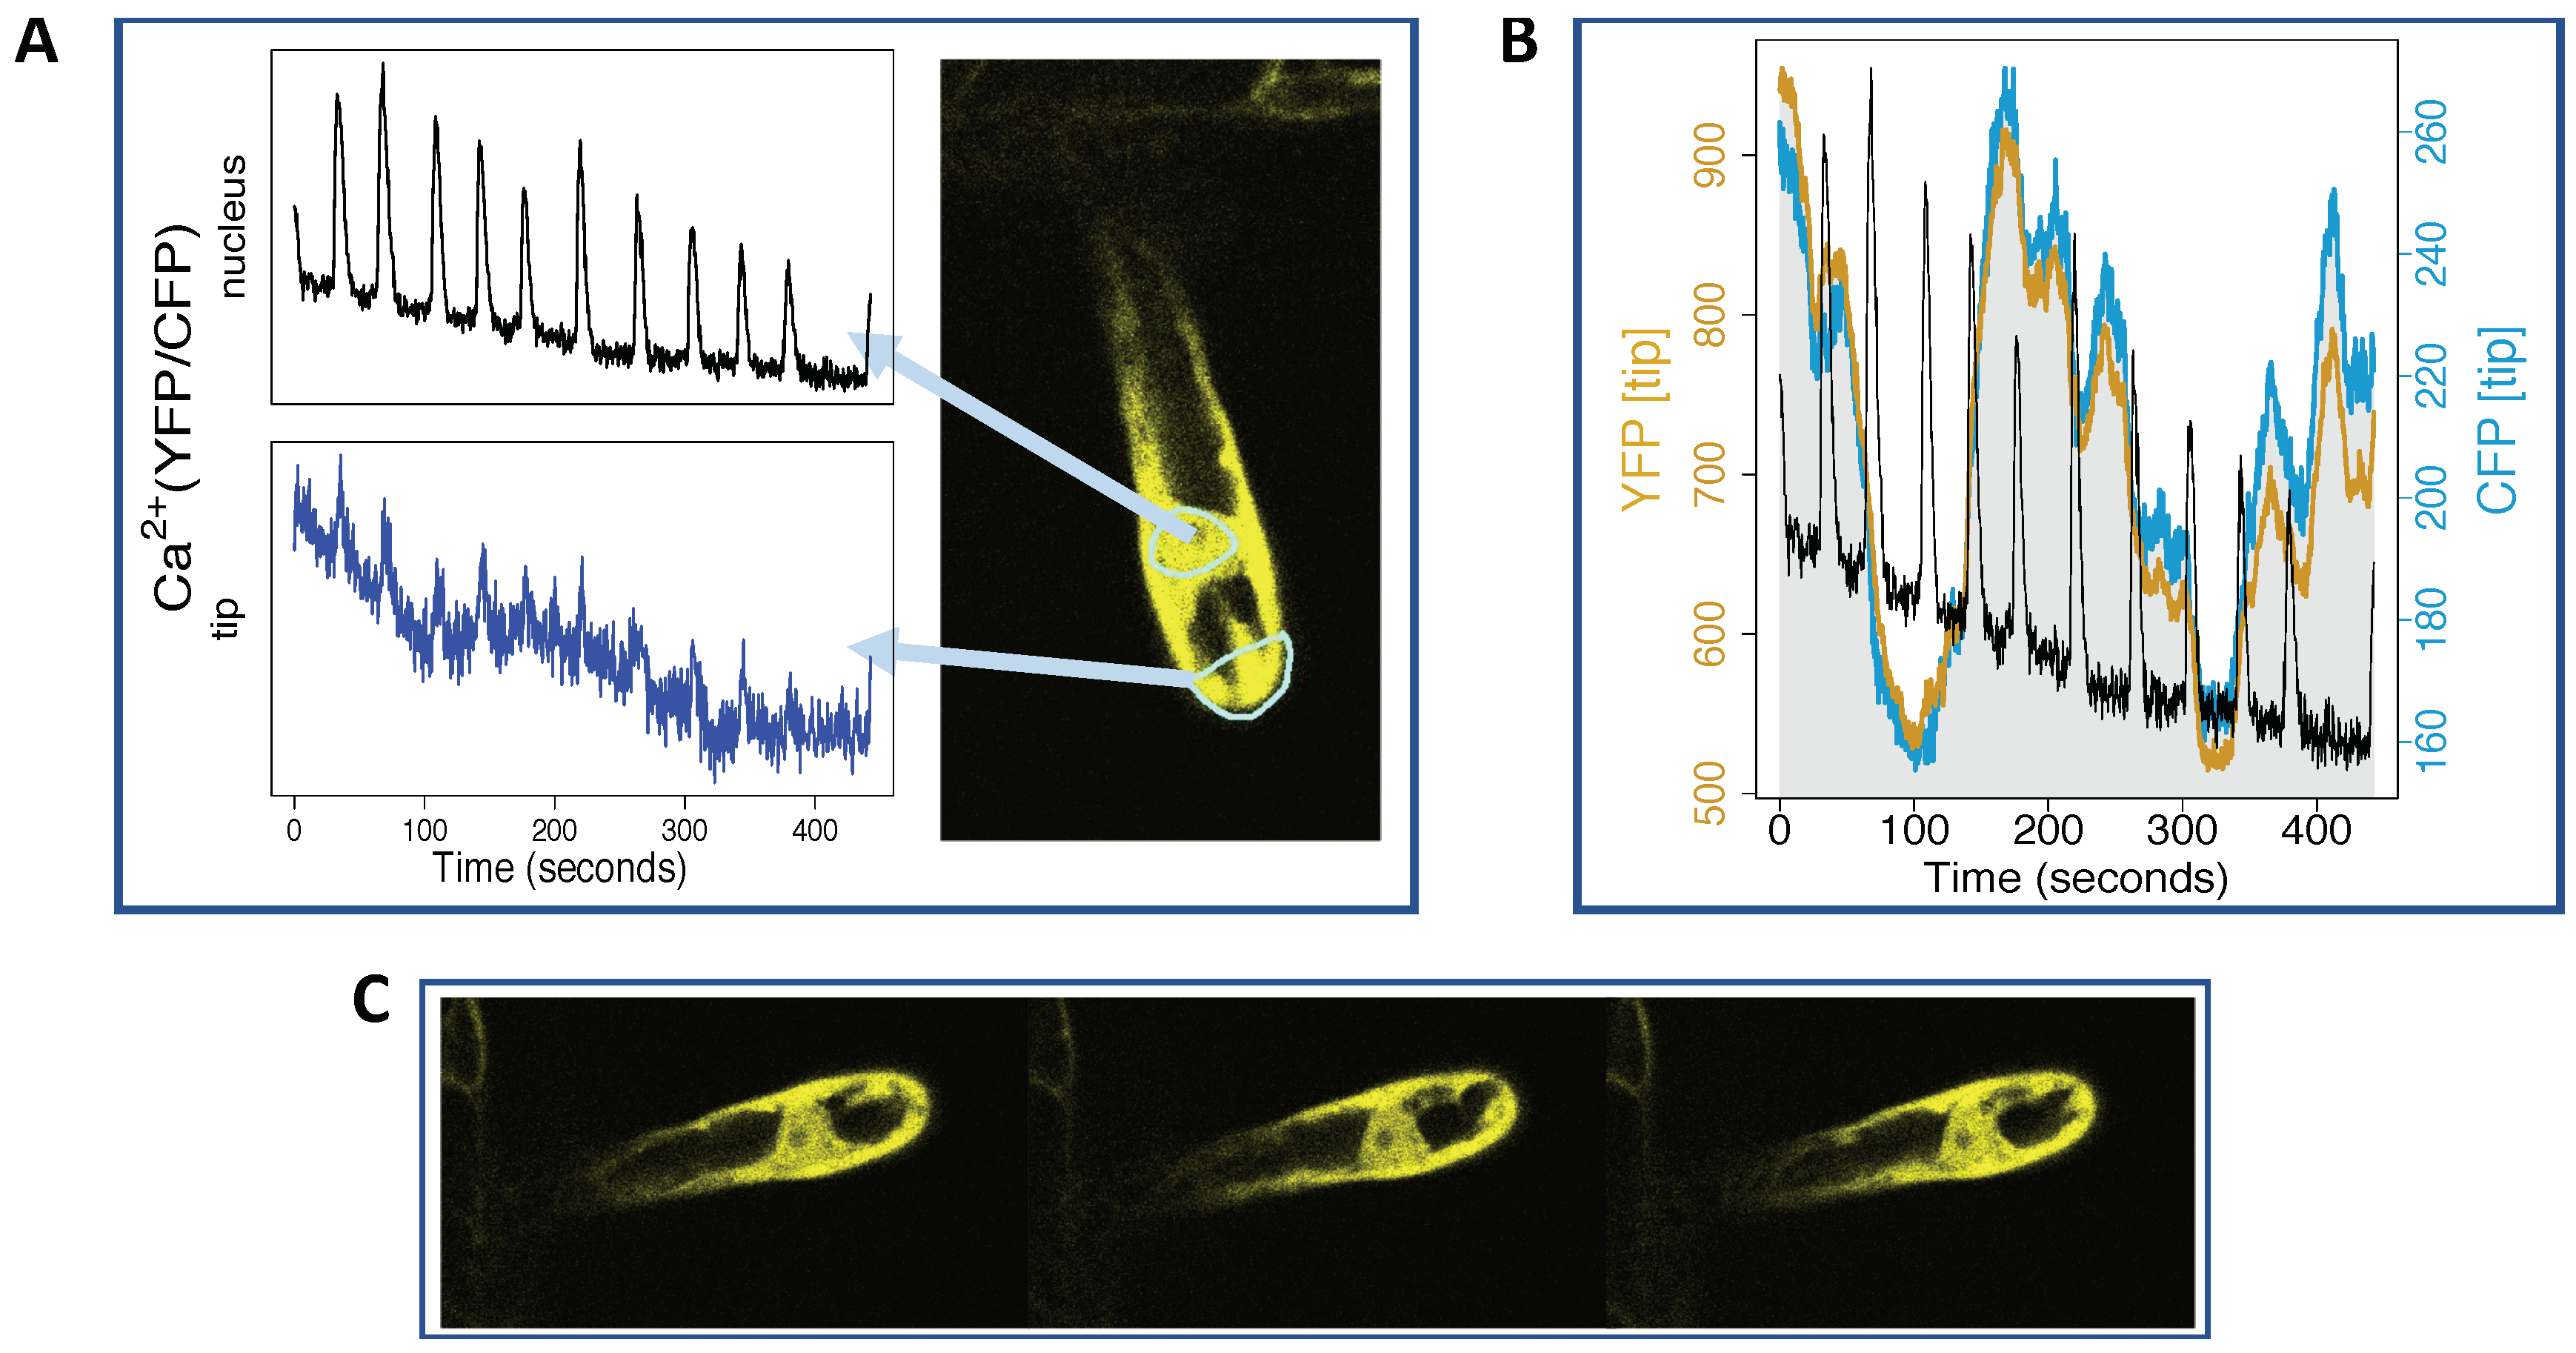
4.2. Can We See How Apical and Perinuclear Ca Oscillations are Related?
4.3. Ca Signals and Other Signals at the Tip
5. Conclusions
Author Contributions
Funding
Acknowledgments
Conflicts of Interest
Abbreviations
| OG | Oregon Green |
| TR | Texas Red |
| Nod | Nodulation |
| FP | Fluorescent Protein |
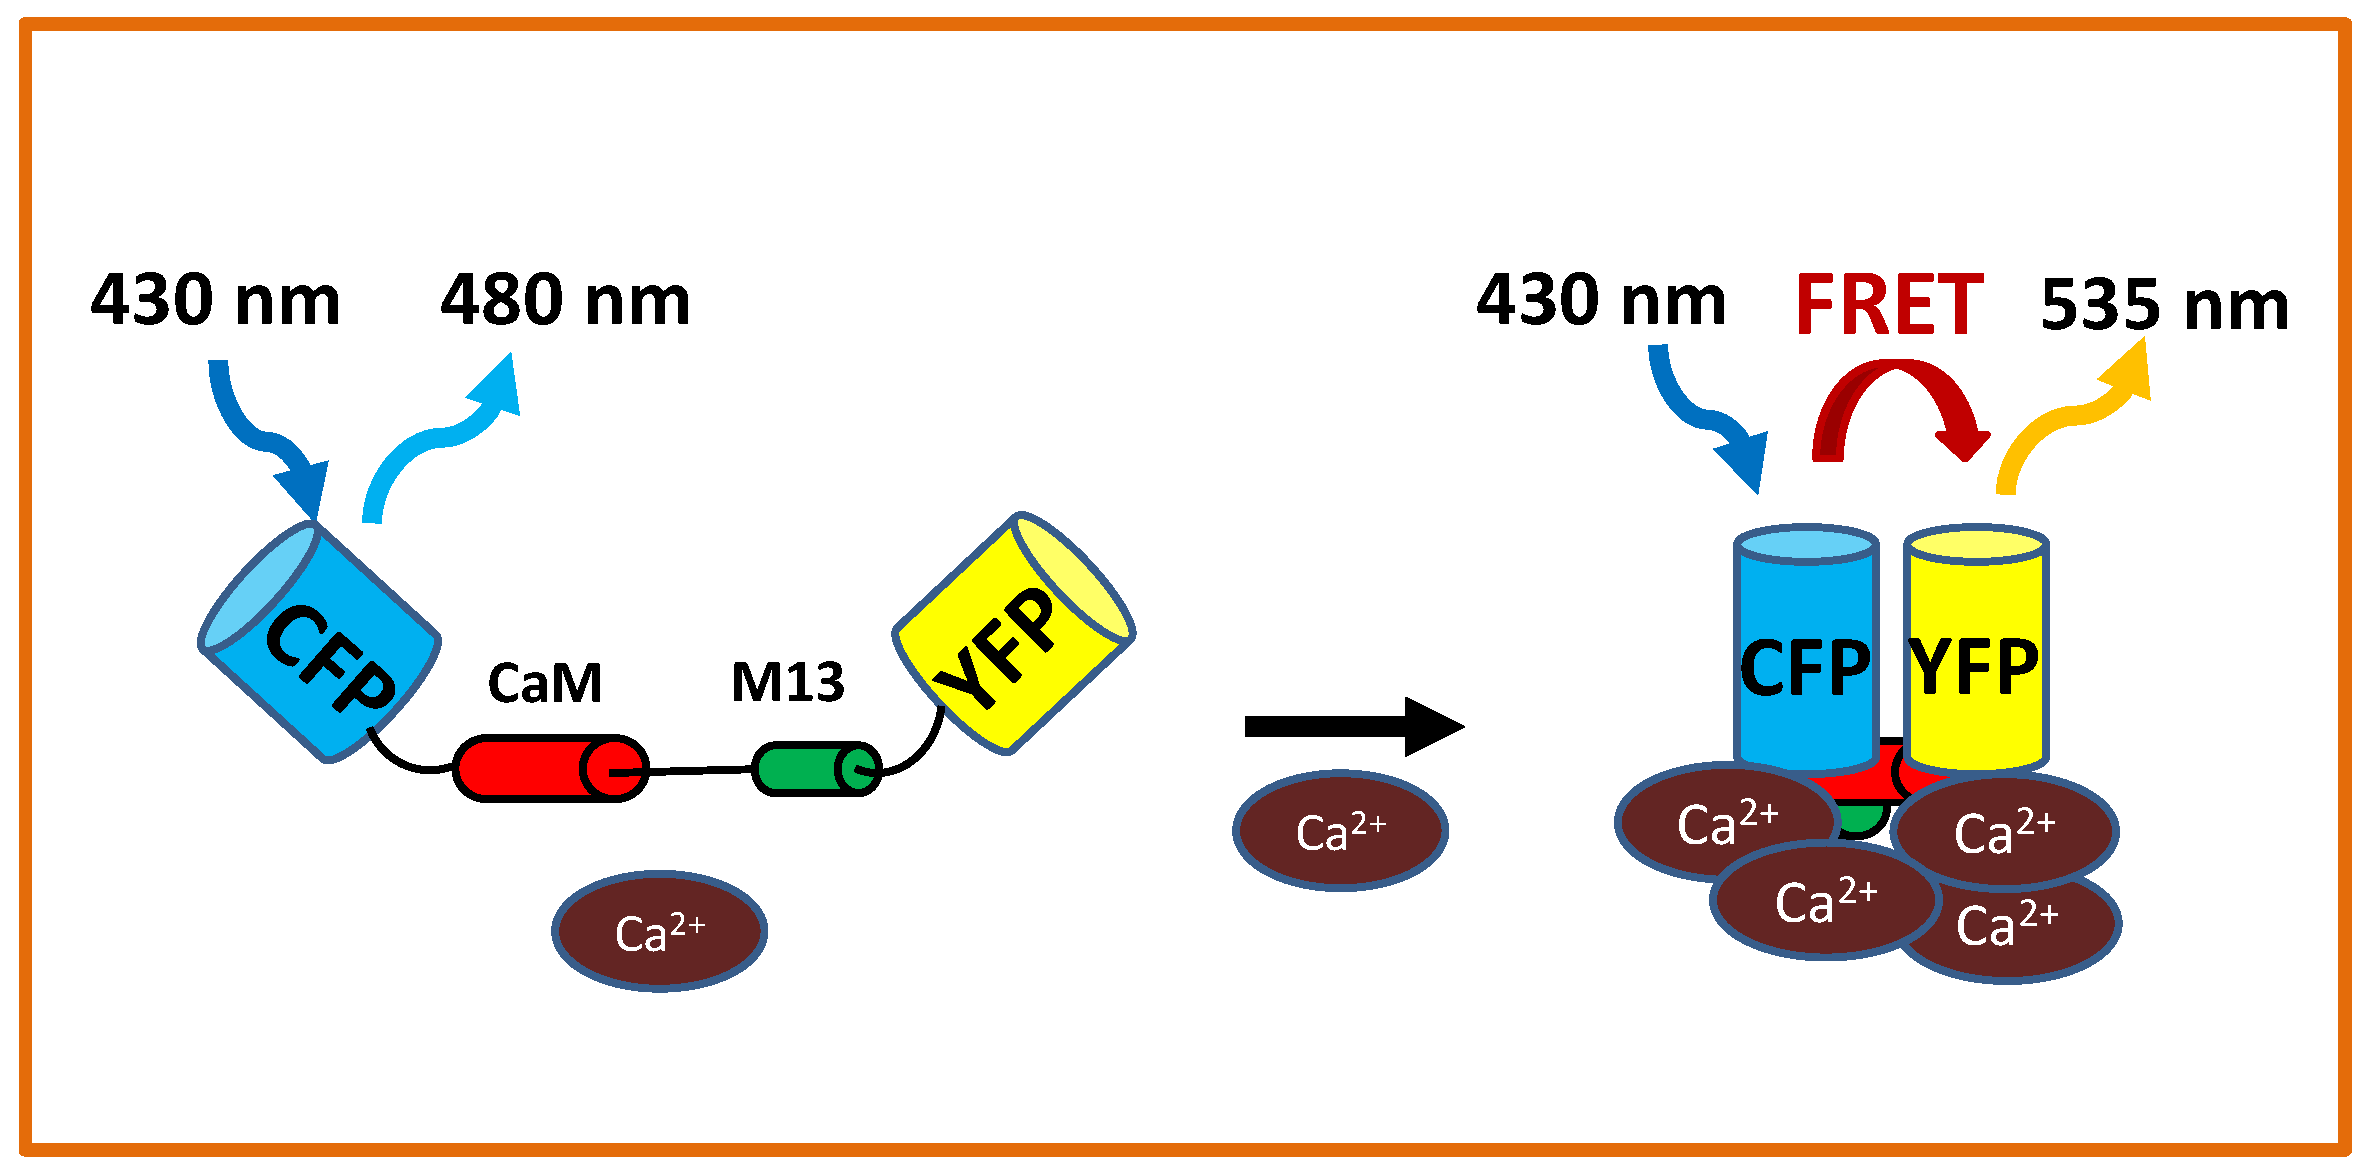
| FRET | Förster (or Fluorescence) Resonance Energy Transfer |
| YC | Yellow Cameleon |
| YFP | Yellow Fluorescent Protein |
| CFP | Cyan Fluorescent Protein |
| GECI | Genetically-Encoded Calcium Indicator |
| CLSM | Confocal Laser Scanning Microscopy |
References
- Downie, J.A. Legume nodulation. Curr. Biol. 2014, 24, R184–R190. [Google Scholar] [PubMed]
- Oldroyd, G.E.; Murray, J.D.; Poole, P.S.; Downie, J.A. The Rules of Engagement in the Legume-Rhizobial Symbiosis. Annu. Rev. Genet. 2011, 45, 119–144. [Google Scholar] [CrossRef]
- Fournier, J.; Timmers, A.C.J.; Sieberer, B.J.; Jauneau, A.; Chabaud, M.; Barker, D.G. Mechanism of infection thread elongation in root hairs of Medicago truncatula and dynamic interplay with associated rhizobial colonization. Plant Physiol. 2008, 148, 1985–1995. [Google Scholar] [CrossRef] [PubMed]
- Newman-Griffis, A.H.; del Cerro, P.; Charpentier, M.; Meier, I. Medicago LINC complexes function in nuclear morphology, nuclear movement, and root nodule symbiosis. Plant Physiol. 2019, 179, 491–506. [Google Scholar] [CrossRef] [PubMed]
- Palmer, A.E.; Tsien, R.Y. Measuring calcium signaling using genetically targetable fluorescent indicators. Nat. Protoc. 2006, 1, 1057. [Google Scholar] [CrossRef] [PubMed]
- Kanchiswamy, C.N.; Malnoy, M.; Occhipinti, A.; Maffei, M.E. Calcium imaging perspectives in plants. Int. J. Mol. Sci. 2014, 15, 3842–3859. [Google Scholar] [CrossRef]
- Walia, A.; Waadt, R.; Jones, A.M. Genetically Encoded Biosensors in Plants: Pathways to Discovery. Annu. Rev. Plant Biol. 2018, 69, 497–524. [Google Scholar] [CrossRef]
- Behera, S.; Krebs, M.; Loro, G.; Schumacher, K.; Costa, A.; Kudla, J. Ca2+ Imaging in Plants Using Genetically Encoded Yellow Cameleon Ca2+ Indicators. Cold Spring Harb. Protoc. 2013, 2013, pdb.top066183. [Google Scholar] [CrossRef]
- Hilleary, R.; Choi, W.G.; Kim, S.H.; Lim, S.D.; Gilroy, S. Sense and sensibility: The use of fluorescent protein-based genetically encoded biosensors in plants. Curr. Opin. Plant Biol. 2018, 46, 32–38. [Google Scholar] [CrossRef]
- Charpentier, M.; Martins, T.V.; Granqvist, E.; Oldroyd, G.E.; Morris, R.J. The role of DMI1 in establishing Ca2+ oscillations in legume symbioses. Plant Signal. Behav. 2013, 8, e22894. [Google Scholar] [CrossRef]
- Martins, T.V.; Evans, M.J.; Wysham, D.B.; Morris, R.J. Nuclear pores enable sustained perinuclear calcium oscillations. BMC Syst. Biol. 2016, 10, 55. [Google Scholar] [CrossRef]
- Oldroyd, G.E.D. Speak, friend, and enter: Signalling systems that promote beneficial symbiotic associations in plants. Nat. Rev. Microbiol. 2013, 11, 252–263. [Google Scholar] [CrossRef]
- Charpentier, M. Calcium signals in the plant nucleus: Origin and function. J. Exp. Bot. 2018, 69, 4165–4173. [Google Scholar] [CrossRef]
- Aldon, D.; Mbengue, M.; Mazars, C.; Galaud, J.P. Calcium Signalling in Plant Biotic Interactions. Int. J. Mol. Sci. 2018, 19, 665. [Google Scholar] [CrossRef]
- Kudla, J.; Becker, D.; Grill, E.; Hedrich, R.; Hippler, M.; Kummer, U.; Parniske, M.; Romeis, T.; Schumacher, K. Advances and current challenges in calcium signaling. New Phytol. 2018, 218, 414–431. [Google Scholar] [CrossRef]
- Sbalzarini, I.F. Seeing Is Believing: Quantifying Is Convincing: Computational Image Analysis in Biology. In Focus on Bio-Image Informatics; De Vos, W.H., Munck, S., Timmermans, J.P., Eds.; Springer International Publishing: Cham, Switzerland, 2016; pp. 1–39. [Google Scholar]
- Nketia, T.A.; Sailem, H.; Rohde, G.; Machiraju, R.; Rittscher, J. Analysis of live cell images: Methods, tools and opportunities. Methods 2017, 115, 65–79. [Google Scholar] [CrossRef]
- McAinsh, M.R.; Pittman, J.K. Shaping the calcium signature. New Phytol. 2009, 181, 275–294. [Google Scholar] [CrossRef]
- Yuan, P.; Jauregui, E.; Du, L.; Tanaka, K.; Poovaiah, B. Calcium signatures and signaling events orchestrate plant–microbe interactions. Curr. Opin. Plant Biol. 2017, 38, 173–183. [Google Scholar] [CrossRef]
- Whalley, H.J.; Knight, M.R. Calcium signatures are decoded by plants to give specific gene responses. New Phytol. 2013, 197, 690–693. [Google Scholar] [CrossRef]
- Kudla, J.; Batistic, O.; Hashimoto, K. Calcium signals: The lead currency of plant information processing. Plant Cell 2010, 22, 541–563. [Google Scholar] [CrossRef]
- Koldenkova, V.P.; Nagai, T. Genetically encoded Ca2+ indicators: Properties and evaluation. Biochim. Biophys. Acta (BBA) Mol. Cell Res. 2013, 1833, 1787–1797. [Google Scholar] [CrossRef] [PubMed]
- Himschoot, E.; Krebs, M.; Costa, A.; Beeckman, T.; Vanneste, S. Calcium Ion Dynamics in Roots: Imaging and Analysis. In Root Development: Methods and Protocols; Ristova, D., Barbez, E., Eds.; Springer: New York, NY, USA, 2018; pp. 115–130. [Google Scholar]
- Miyawaki, A.; Llopis, J.; Heim, R.; McCaffery, J.M.; Adams, J.A.; Ikura, M.; Tsien, R.Y. Fluorescent indicators for Ca2+ based on green fluorescent proteins and calmodulin. Nature 1997, 388, 882. [Google Scholar] [CrossRef]
- Krebs, M.; Held, K.; Binder, A.; Hashimoto, K.; Den Herder, G.; Parniske, M.; Kudla, J.; Schumacher, K. FRET-based genetically encoded sensors allow high-resolution live cell imaging of Ca2+ dynamics. Plant J. 2012, 69, 181–192. [Google Scholar] [CrossRef] [PubMed]
- Bankhead, P. Analyzing Fluorescence Microscopy Images with ImageJ. 2014. Available online: https://sydney.edu.au/medicine/bosch/facilities/advanced-microscopy/user-support/ImageJ_FL_Image_Analysis.pdf (accessed on 21 January 2019).
- Sheppard, C.J.; Gan, X.; Gu, M.; Roy, M. Signal-to-noise ratio in confocal microscopes. In Handbook of Biological Confocal Microscopy; Pawley, J.B., Ed.; Springer Science + Business Media LLC: New York, NY, USA, 2006; pp. 442–451. [Google Scholar]
- Cárdenas, L.; Feijó, J.A.; Kunkel, J.G.; Sánchez, F.; Holdaway-Clarke, T.; Hepler, P.K.; Quinto, C. Rhizobium Nod factors induce increases in intracellular free calcium and extracellular calcium influxes in bean root hairs. Plant J. 1999, 19, 347–352. [Google Scholar] [CrossRef] [PubMed]
- Norbert, C.D.; Rook, M.B.; Bisseling, T.; Emons, A.M.C. Lipochito-oligosaccharides re-initiate root hair tip growth in Vicia sativa with high calcium and spectrin-like antigen at the tip. Plant J. 1998, 13, 341–350. [Google Scholar]
- Gehring, C.A.; Irving, H.R.; Kabbara, A.A.; Parish, R.W.; Boukli, N.M.; Broughton, W.J. Rapid, Plateau-like Increases in Intracellular Free Calcium Are Associated with Nod-Factor–Induced Root-Hair Deformation. Mol. Plant-Microbe Interact. 1997, 10, 791–802. [Google Scholar] [CrossRef]
- Shaw, S.L.; Long, S.R. Nod Factor Elicits Two Separable Calcium Responses in Medicago truncatula Root Hair Cells. Plant Physiol. 2003, 131, 976–984. [Google Scholar] [CrossRef] [PubMed]
- Morieri, G.; Martinez, E.A.; Jarynowski, A.; Driguez, H.; Morris, R.; Oldroyd, G.E.D.; Downie, J.A. Host-specific Nod-factors associated with Medicago truncatula nodule infection differentially induce calcium influx and calcium spiking in root hairs. New Phytol. 2013, 200, 656–662. [Google Scholar] [CrossRef]
- Miwa, H.; Sun, J.; Oldroyd, G.E.D.; Downie, J.A. Analysis of Nod-Factor-Induced Calcium Signaling in Root Hairs of Symbiotically Defective Mutants of Lotus japonicus. Mol. Plant-Microbe Interact. 2006, 19, 914–923. [Google Scholar] [CrossRef]
- Sieberer, B.J.; Chabaud, M.; Timmers, A.C.; Monin, A.; Fournier, J.; Barker, D.G. A nuclear-targeted cameleon demonstrates intranuclear Ca2+ spiking in Medicago truncatula root hairs in response to rhizobial nodulation factors. Plant Physiol. 2009, 151, 1197–1206. [Google Scholar] [CrossRef]
- Capoen, W.; Sun, J.; Wysham, D.; Otegui, M.S.; Venkateshwaran, M.; Hirsch, S.; Miwa, H.; Downie, J.A.; Morris, R.J.; Ané, J.M.; et al. Nuclear membranes control symbiotic calcium signaling of legumes. Proc. Natl. Acad. Sci. USA 2011, 108, 14348–14353. [Google Scholar] [CrossRef]
- Ehrhardt, D.W.; Wais, R.; Long, S.R. Calcium spiking in plant root hairs responding to Rhizobium nodulation signals. Cell 1996, 85, 673–681. [Google Scholar] [CrossRef]
- Walker, S.A.; Viprey, V.; Downie, J.A. Dissection of nodulation signaling using pea mutants defective for calcium spiking induced by Nod factors and chitin oligomers. Proc. Natl. Acad. Sci. USA 2000, 97, 13413–13418. [Google Scholar] [CrossRef]
- Kelner, A.; Leitão, N.; Chabaud, M.; Charpentier, M.; de Carvalho-Niebel, F. Dual Color Sensors for Simultaneous Analysis of Calcium Signal Dynamics in the Nuclear and Cytoplasmic Compartments of Plant Cells. Front. Plant Sci. 2018, 9, 245. [Google Scholar] [CrossRef]
- Oldroyd, G.E.; Downie, J.A. Nuclear calcium changes at the core of symbiosis signalling. Curr. Opin. Plant Biol. 2006, 9, 351–357. [Google Scholar] [CrossRef] [PubMed]
- Edel, K.H.; Marchadier, E.; Brownlee, C.; Kudla, J.; Hetherington, A.M. The Evolution of Calcium-Based Signalling in Plants. Curr. Biol. 2017, 27, R667–R679. [Google Scholar] [CrossRef]
- Wais, R.J.; Galera, C.; Oldroyd, G.; Catoira, R.; Penmetsa, R.V.; Cook, D.; Gough, C.; Dénarié, J.; Long, S.R. Genetic analysis of calcium spiking responses in nodulation mutants of Medicago truncatula. Proc. Natl. Acad. Sci. USA 2000, 97, 13407–13412. [Google Scholar] [CrossRef] [PubMed]
- Miwa, H.; Sun, J.; Oldroyd, G.E.D.; Downie, J.A. Analysis of calcium spiking using a cameleon calcium sensor reveals that nodulation gene expression is regulated by calcium spike number and the developmental status of the cell. Plant J. 2006, 48, 883–894. [Google Scholar] [CrossRef]
- Sun, J.; Miwa, H.; Downie, J.A.; Oldroyd, G.E. Mastoparan Activates Calcium Spiking Analogous to Nod Factor-Induced Responses in Medicago truncatula Root Hair Cells. Plant Physiol. 2007, 144, 695–702. [Google Scholar] [CrossRef]
- Harris, J.M.; Wais, R.; Long, S.R. Rhizobium-Induced Calcium Spiking in Lotus japonicus. Mol. Plant-Microbe Interact. 2003, 16, 335–341. [Google Scholar] [CrossRef] [PubMed][Green Version]
- Capoen, W.; Den Herder, J.; Sun, J.; Verplancke, C.; De Keyser, A.; De Rycke, R.; Goormachtig, S.; Oldroyd, G.; Holsters, M. Calcium Spiking Patterns and the Role of the Calcium/Calmodulin-Dependent Kinase CCaMK in Lateral Root Base Nodulation of Sesbania rostrata. Plant Cell 2009, 21, 1526–1540. [Google Scholar] [CrossRef]
- Sieberer, B.J.; Chabaud, M.; Fournier, J.; Timmers, A.C.; Barker, D.G. A switch in Ca2+ spiking signature is concomitant with endosymbiotic microbe entry into cortical root cells of Medicago truncatula. Plant J. 2012, 69, 822–830. [Google Scholar] [CrossRef]
- Charpentier, M.; Bredemeier, R.; Wanner, G.; Takeda, N.; Schleiff, E.; Parniske, M. Lotus japonicus CASTOR and POLLUX are ion channels essential for perinuclear calcium spiking in legume root endosymbiosis. Plant Cell 2008, 20, 3467–3479. [Google Scholar] [CrossRef]
- Charpentier, M.; Sun, J.; Martins, T.V.; Radhakrishnan, G.V.; Findlay, K.; Soumpourou, E.; Thouin, J.; Véry, A.A.; Sanders, D.; Morris, R.J.; et al. Nuclear-localized cyclic nucleotide–gated channels mediate symbiotic calcium oscillations. Science 2016, 352, 1102–1105. [Google Scholar] [CrossRef]
- Saito, K.; Yoshikawa, M.; Yano, K.; Miwa, H.; Uchida, H.; Asamizu, E.; Sato, S.; Tabata, S.; Imaizumi-Anraku, H.; Umehara, Y.; et al. NUCLEOPORIN85 is required for calcium spiking, fungal and bacterial symbioses, and seed production in Lotus japonicus. Plant Cell 2007, 19, 610–624. [Google Scholar] [CrossRef]
- Shailes, S. Regulation of Calcium Influx and Reactive Oxygen Species Production during Infection of Legumes by Rhizobia. Ph.D. Thesis, University of East Anglia, Norwich, UK, 2014. [Google Scholar]
- Gage, D.J. Infection and invasion of roots by symbiotic, nitrogen-fixing rhizobia during nodulation of temperate legumes. Microbiol. Mol. Biol. Rev. 2004, 68, 280–300. [Google Scholar] [CrossRef]
- Monshausen, G.B.; Messerli, M.A.; Gilroy, S. Imaging of the Yellow Cameleon 3.6 Indicator Reveals That Elevations in Cytosolic Ca2+ Follow Oscillating Increases in Growth in Root Hairs of Arabidopsis. Plant Physiol. 2008, 147, 1690–1698. [Google Scholar] [CrossRef]
- Mendrinna, A.; Persson, S. Root hair growth: It’s a one way street. F1000Prime Rep. 2015, 7, 23. [Google Scholar] [CrossRef]
- Sieberer, B.J.; Fournier, J.; Timmers, A.C.; Chabaud, M.; Barker, D.G. Nuclear Ca2+ Signaling Reveals Active Bacterial-Host Communication Throughout Rhizobial Infection in Root Hairs of Medicago truncatula. In Biological Nitrogen Fixation; de Bruijn, F.J., Ed.; John Wiley and Sons, Ltd., 2015; Chapter 57; pp. 567–574. [Google Scholar]
- Kosuta, S.; Hazledine, S.; Sun, J.; Miwa, H.; Morris, R.J.; Downie, J.A.; Oldroyd, G.E.D. Differential and chaotic calcium signatures in the symbiosis signaling pathway of legumes. Proc. Natl. Acad. Sci. USA 2008, 105, 9823–9828. [Google Scholar] [CrossRef]
- Granqvist, E.; Wysham, D.; Hazledine, S.; Kozlowski, W.; Sun, J.; Charpentier, M.; Martins, T.V.; Haleux, P.; Tsaneva-Atanasova, K.; Downie, J.A.; et al. Buffering Capacity Explains Signal Variation in Symbiotic Calcium Oscillations. Plant Physiol. 2012, 160, 2300–2310. [Google Scholar] [CrossRef]
- Marhl, M.; Perc, M.; Schuster, S. A minimal model for decoding of time-limited Ca2+ oscillations. Biophys. Chem. 2006, 120, 161–167. [Google Scholar] [CrossRef] [PubMed]
- Pawley, J.B. Handbook of Biological Confocal Microscopy; Springer Science + Business Media LLC: New York, NY, USA, 2006. [Google Scholar]
- Volcano Dataset. Available online: https://stat.ethz.ch/R-manual/R-devel/library/datasets/html/volcano.html (accessed on 21 January 2019).
- Soetaert, K. plot3D Package. Available online: https://cran.r-project.org/web/packages/plot3D/index.html. (accessed on 21 January 2019).
- Magalhaes, P. RatioPlus Plugin. Available online: https://imagej.nih.gov/ij/plugins/ratio-plus.html. (accessed on 14 January 2019).
- Schneider, C.A.; Rasband, W.S.; Eliceiri, K.W. NIH Image to ImageJ: 25 years of image analysis. Nat. Methods 2012, 9, 671. [Google Scholar] [CrossRef]
- Rudolf, R.; Mongillo, M.; Magalhães, P.J.; Pozzan, T. In vivo monitoring of Ca2+ uptake into mitochondria of mouse skeletal muscle during contraction. J. Cell Biol. 2004, 166, 527–536. [Google Scholar] [CrossRef]
- Rudolf, R.; Magalhães, P.J.; Pozzan, T. Direct in vivo monitoring of sarcoplasmic reticulum Ca2+ and cytosolic cAMP dynamics in mouse skeletal muscle. J. Cell Biol. 2006, 173, 187–193. [Google Scholar] [CrossRef] [PubMed]
- Bootman, M.D.; Rietdorf, K.; Collins, T.; Walker, S.; Sanderson, M. Ca2+-Sensitive Fluorescent Dyes and Intracellular Ca2+ Imaging. Cold Spring Harb. Protoc. 2013, 2013, pdb.top066050. [Google Scholar] [CrossRef]
- Sieberer, B.; Emons, A.M.C. Cytoarchitecture and pattern of cytoplasmic streaming in root hairs of Medicago truncatula during development and deformation by nodulation factors. Protoplasma 2000, 214, 118–127. [Google Scholar] [CrossRef]
- Nakai, J.; Ohkura, M.; Imoto, K. A high signal-to-noise Ca2+ probe composed of a single green fluorescent protein. Nat. Biotechnol. 2001, 19, 137. [Google Scholar] [CrossRef]
- Toyota, M.; Spencer, D.; Sawai-Toyota, S.; Jiaqi, W.; Zhang, T.; Koo, A.J.; Howe, G.A.; Gilroy, S. Glutamate triggers long-distance, calcium-based plant defense signaling. Science 2018, 361, 1112–1115. [Google Scholar] [CrossRef]
- Evaluation of Measurement Data—Guide to the Expression of Uncertainty in Measurement JCGM 100:2008. (GUM 1995 with Minor Corrections), 2008. Available online: http://www.bipm.org/utils/common/documents/jcgm/JCGM_100_2008_E.pdf (accessed on 17 February 2019).
- Pikovsky, A.; Rosenblum, M.; Kurths, J. Synchronization: A Universal Concept in Nonlinear Sciences; Cambridge Nonlinear Science Series; Cambridge University Press: Cambridge, UK, 2001. [Google Scholar]
- Goldstein, R.E.; van de Meent, J.W. A physical perspective on cytoplasmic streaming. Interface Focus 2015, 5, 20150030. [Google Scholar] [CrossRef] [PubMed]


| LOCATION | RESULT | SPECIES | SENSOR |
|---|---|---|---|
| CALCIUM AT THE TIP | |||
| Cytosol | Apical Ca gradient | Phaseolus vulgaris | Fura-2 [28] |
| In growing root hairs, even without Nod factor, | Vicia sativa | Indo-1 [29] | |
| in those terminating growth with Nod factor | |||
| Apical Ca plateau-like increase | Vigna unguiculata | Fura-2 and Fluo-3 [30] | |
| Requires larger Nod factor concentrations | Medicago truncatula | Calcium green/TR [31] | |
| YC2.1 [32] | |||
| Lotus japonicus | OG-TR [33] | ||
| Flux propagates towards perinuclear region | Medicago truncatula | Calcium green/TR [31] | |
| CALCIUM AT THE PERINUCLEAR REGION | |||
| Nucleus | Ca release at the periphery | Medicago truncatula | Nup YC.2.1 [34,35] |
| Cytosol/Nucleus | Perinuclear region | Medicago sativa | Fura-2 [36] |
| Phaseolus vulgaris | Fura-2 [28] | ||
| Pisum sativum | OG/TR [37] | ||
| Lotus japonicus | OG-TR [33] | ||
| Spikes propagate towards tip | Medicago truncatula | Calcium green/TR [31] | |
| Hotspots | Phaseolus vulgaris | Fura-2 [28] | |
| Nucleus vs. cytosol | Synchronous spikes | Medicago truncatula | 70kDaOG, 10kDaRhoD [35] |
| Cytosolic Ca spikes delayed | R-GECO, G-GECO [38] | ||
| Cytosolic Ca spikes more symmetric | Lotus japonicus | NES-YC3.6, NLS-YC3.6 [25] | |
| CALCIUM SIGNATURES | |||
|---|---|---|---|
| COMPARISON | RESULT | SPECIES | SENSOR |
| Infection thread | Frequency increases | Medicago truncatula | NupYC2.1 [54] |
| growth rate | in periods of rapid elongation | ||
| Transinfection stage | Frequency increases | YC2.1 YC3.60 NupYC2.1 [46] | |
| when transcellular infection starts | |||
| Myc and NF | Deterministic chaotic patterns | YC2.1 [55] | |
| Root hair | Slower frequency in | YC2.1 [42] | |
| development stage | younger root hairs | ||
| Ca sensors k | Spike shape: decay phase | OG/TR vs. YC2.1 [56] | |
| more gradual for smaller k | |||
| Invasion mode | Frequency faster in the lateral root base | Sesbania rostrata | OG and TR [45] |
| than root hair invasion mode | Medicago truncatula | ||
© 2019 by the authors. Licensee MDPI, Basel, Switzerland. This article is an open access article distributed under the terms and conditions of the Creative Commons Attribution (CC BY) license (http://creativecommons.org/licenses/by/4.0/).
Share and Cite
Vaz Martins, T.; Livina, V.N. What Drives Symbiotic Calcium Signalling in Legumes? Insights and Challenges of Imaging. Int. J. Mol. Sci. 2019, 20, 2245. https://doi.org/10.3390/ijms20092245
Vaz Martins T, Livina VN. What Drives Symbiotic Calcium Signalling in Legumes? Insights and Challenges of Imaging. International Journal of Molecular Sciences. 2019; 20(9):2245. https://doi.org/10.3390/ijms20092245
Chicago/Turabian StyleVaz Martins, Teresa, and Valerie N. Livina. 2019. "What Drives Symbiotic Calcium Signalling in Legumes? Insights and Challenges of Imaging" International Journal of Molecular Sciences 20, no. 9: 2245. https://doi.org/10.3390/ijms20092245
APA StyleVaz Martins, T., & Livina, V. N. (2019). What Drives Symbiotic Calcium Signalling in Legumes? Insights and Challenges of Imaging. International Journal of Molecular Sciences, 20(9), 2245. https://doi.org/10.3390/ijms20092245