Article

A Survey on Tubulin and Arginine Methyltransferase Families Sheds Light on P. lividus Embryo as Model System for Antiproliferative Drug Development

by
Maria Antonietta Ragusa
1,*,
Aldo Nicosia
2,
Salvatore Costa
1,
Caterina Casano
1 and
Fabrizio Gianguzza
1
1
Department of Biological, Chemical and Pharmaceutical Sciences and Technologies (STEBICEF), University of Palermo, Viale delle Scienze, Ed. 16, Palermo, 90128 Sicily, Italy.
2
National Research Council-Istituto per lo studio degli impatti Antropici e Sostenibilità in ambiente marino (IAS-CNR), Laboratory of Molecular Ecology and Biotechnology, Detached Unit of Capo Granitola, Via del mare, Torretta Granitola (TP), 91021 Sicily, Italy
*
Author to whom correspondence should be addressed.
Int. J. Mol. Sci. 2019, 20(9), 2136; https://doi.org/10.3390/ijms20092136
Submission received: 18 April 2019 / Accepted: 27 April 2019 / Published: 30 April 2019
(This article belongs to the Special Issue Regulatory Mechanisms of Tubulin-Like Proteins)

Abstract

:
Tubulins and microtubules (MTs) represent targets for taxane-based chemotherapy. To date, several lines of evidence suggest that effectiveness of compounds binding tubulin often relies on different post-translational modifications on tubulins. Among them, methylation was recently associated to drug resistance mechanisms impairing taxanes binding. The sea urchin is recognized as a research model in several fields including fertilization, embryo development and toxicology. To date, some α- and β-tubulin genes have been identified in P. lividus, while no data are available in echinoderms for arginine methyl transferases (PRMT). To evaluate the exploiting of the sea urchin embryo in the field of antiproliferative drug development, we carried out a survey of the expressed α- and β-tubulin gene sets, together with a comprehensive analysis of the PRMT gene family and of the methylable arginine residues in P. lividus tubulins. Because of their specificities, the sea urchin embryo may represent an interesting tool for dissecting mechanisms of tubulin targeting drug action. Therefore, results herein reported provide evidences supporting the P. lividus embryo as animal system for testing antiproliferative drugs.

1. Introduction

It is well known that different α- and β-tubulin isotypes contribute to create an evolutionary conserved network of highly dynamic filaments, with key roles in cellular architecture and physiology [1].
The α- and β-tubulin dimers linearly assemble to create polarized proto-filaments with β-tubulin subunits exposed to the solvent at the plus end, while the minus-end is capped by α-tubulin subunits [2,3]. Classically, 13 proto-filaments are known to assemble into an MT, a cylinder of 22 nm in diameter. MTs are responsible for several aspects of cell division and proliferation as well as development and tissue differentiation, signalling pathways and gene expression modulation [4,5,6]. Beyond the role in organizing chromosome movements during cell divisions [7], MTs interacting with kinetochore are responsible for the mechanism of genome surveillance known as spindle assembly checkpoint [8]. Changes in kinetochore MT stability often result in chromosome segregation errors, aneuploidy and tumorigenesis [9,10].
Alteration of the dynamic instability between free and polymerized tubulin, as a result of antitumor drugs that interact with MTs and tubulin, severely affects the cell fate leading apoptosis after cell cycle arrest at G2/M [11,12], thus depicting MTs as drug targets in cancer treatment.
Interestingly, several lines of evidence unveiled a role for the switch of tubulin isotypes [13] directly affecting mechanisms of tumorigenesis and resistance to tubulin-binding chemotherapy agents [14,15,16]. Moreover, tubulins can be post-translationally chemically modified changing their affinity towards cellular interactors and their binding to different drugs [17,18,19,20]. All that could lead to a regulation of cell activities and cell cycle control, and a different response to chemotherapeutic agents [10,21,22,23].
The α- and β-tubulins constitute a multigene family in several species. At least 4 α- and 4 β-tubulin genes were found in Drosophila melanogaster, in different members of hemimetabolous and holometabolous [24]; while the human genome contains at least 15 α-tubulin genes and 21 β-tubulin genes which are on distinct chromosomes and possess specific tissue and developmental distributions [25,26]. Among Echinodermata, genome wide analyses of the sea urchin Strongylocentrotus purpuratus retrieved 9 α-tubulin genes and 6 β-tubulin genes [27], thus providing evidences for the existence of multiple gene families also in non-chordates deuterostomes.
Sea urchin is recognized as a research model for fertilization [28], mechanisms of embryo development and specification [29,30,31], bilaterian development [32], gene regulatory networks [33,34] and stress responses [35,36]. Interestingly, the first hypothesis on tumorigenesis was provided by Boveri analysing alteration in the mitotic apparatus during sea urchin cleavage [37,38]. Moreover, the sea urchin embryo was also the perfect model for cyclin discovery [39,40].
Because of the synchrony in cleavage times related to the correlation between cell cycle regulation and mitotic apparatus of the sea urchin embryo system, tubulins and tubulin targeting drugs may represent an interesting tool for analyse antimitotic molecules that affect tubulin dynamics and drug activity on MT assembly and stability [41]. In fact, during development two distinct processes are directly connected to microtubule dynamics: the early cleavage and the ciliary dependent swimming which occurs later in development. Among drugs interacting with MTs, taxanes are widely studied both as tool for experimental researches and as antiproliferative and chemotherapeutic agents. The effects of taxol were observed on the sea urchin embryo mitotic apparatus and in particular the alterations of cleavage furrow during blastomere segmentation were reported [42]. Moreover, a sea urchin embryo-based protocol for the assessment of multiple tubulin destabilizing drugs has been already proposed [41] and successfully used in several studies [43,44,45].
To date, some α- and β-tubulin genes have been identified and characterized from the Mediterranean sea urchin Paracentrotus lividus [46,47,48,49,50,51]; and mechanisms of transcriptional regulation have been finely defined for the neural α-tubulin [52,53,54]. However, to date a comprehensive view of tubulins and MTs related to post-translational modifications (PTMs) and especially arginine methylation is still lacking.
During the last few years, several P. lividus transcriptome datasets have been generated [55,56], thus allowing the identification of other gene families [57,58]. While, regarding arginine methyl transferases (PRMTs), no data are still available in echinoderms. Therefore, in the present work, we carried out a survey of the expressed α- and β-tubulin gene sets, together with a comprehensive analysis of the PRMT gene family and the predicted methylable arginine residues in P. lividus tubulins. This will provide the basal elements for a tool kit to study arginine methylation sensitive drugs.

2. Results and Discussion

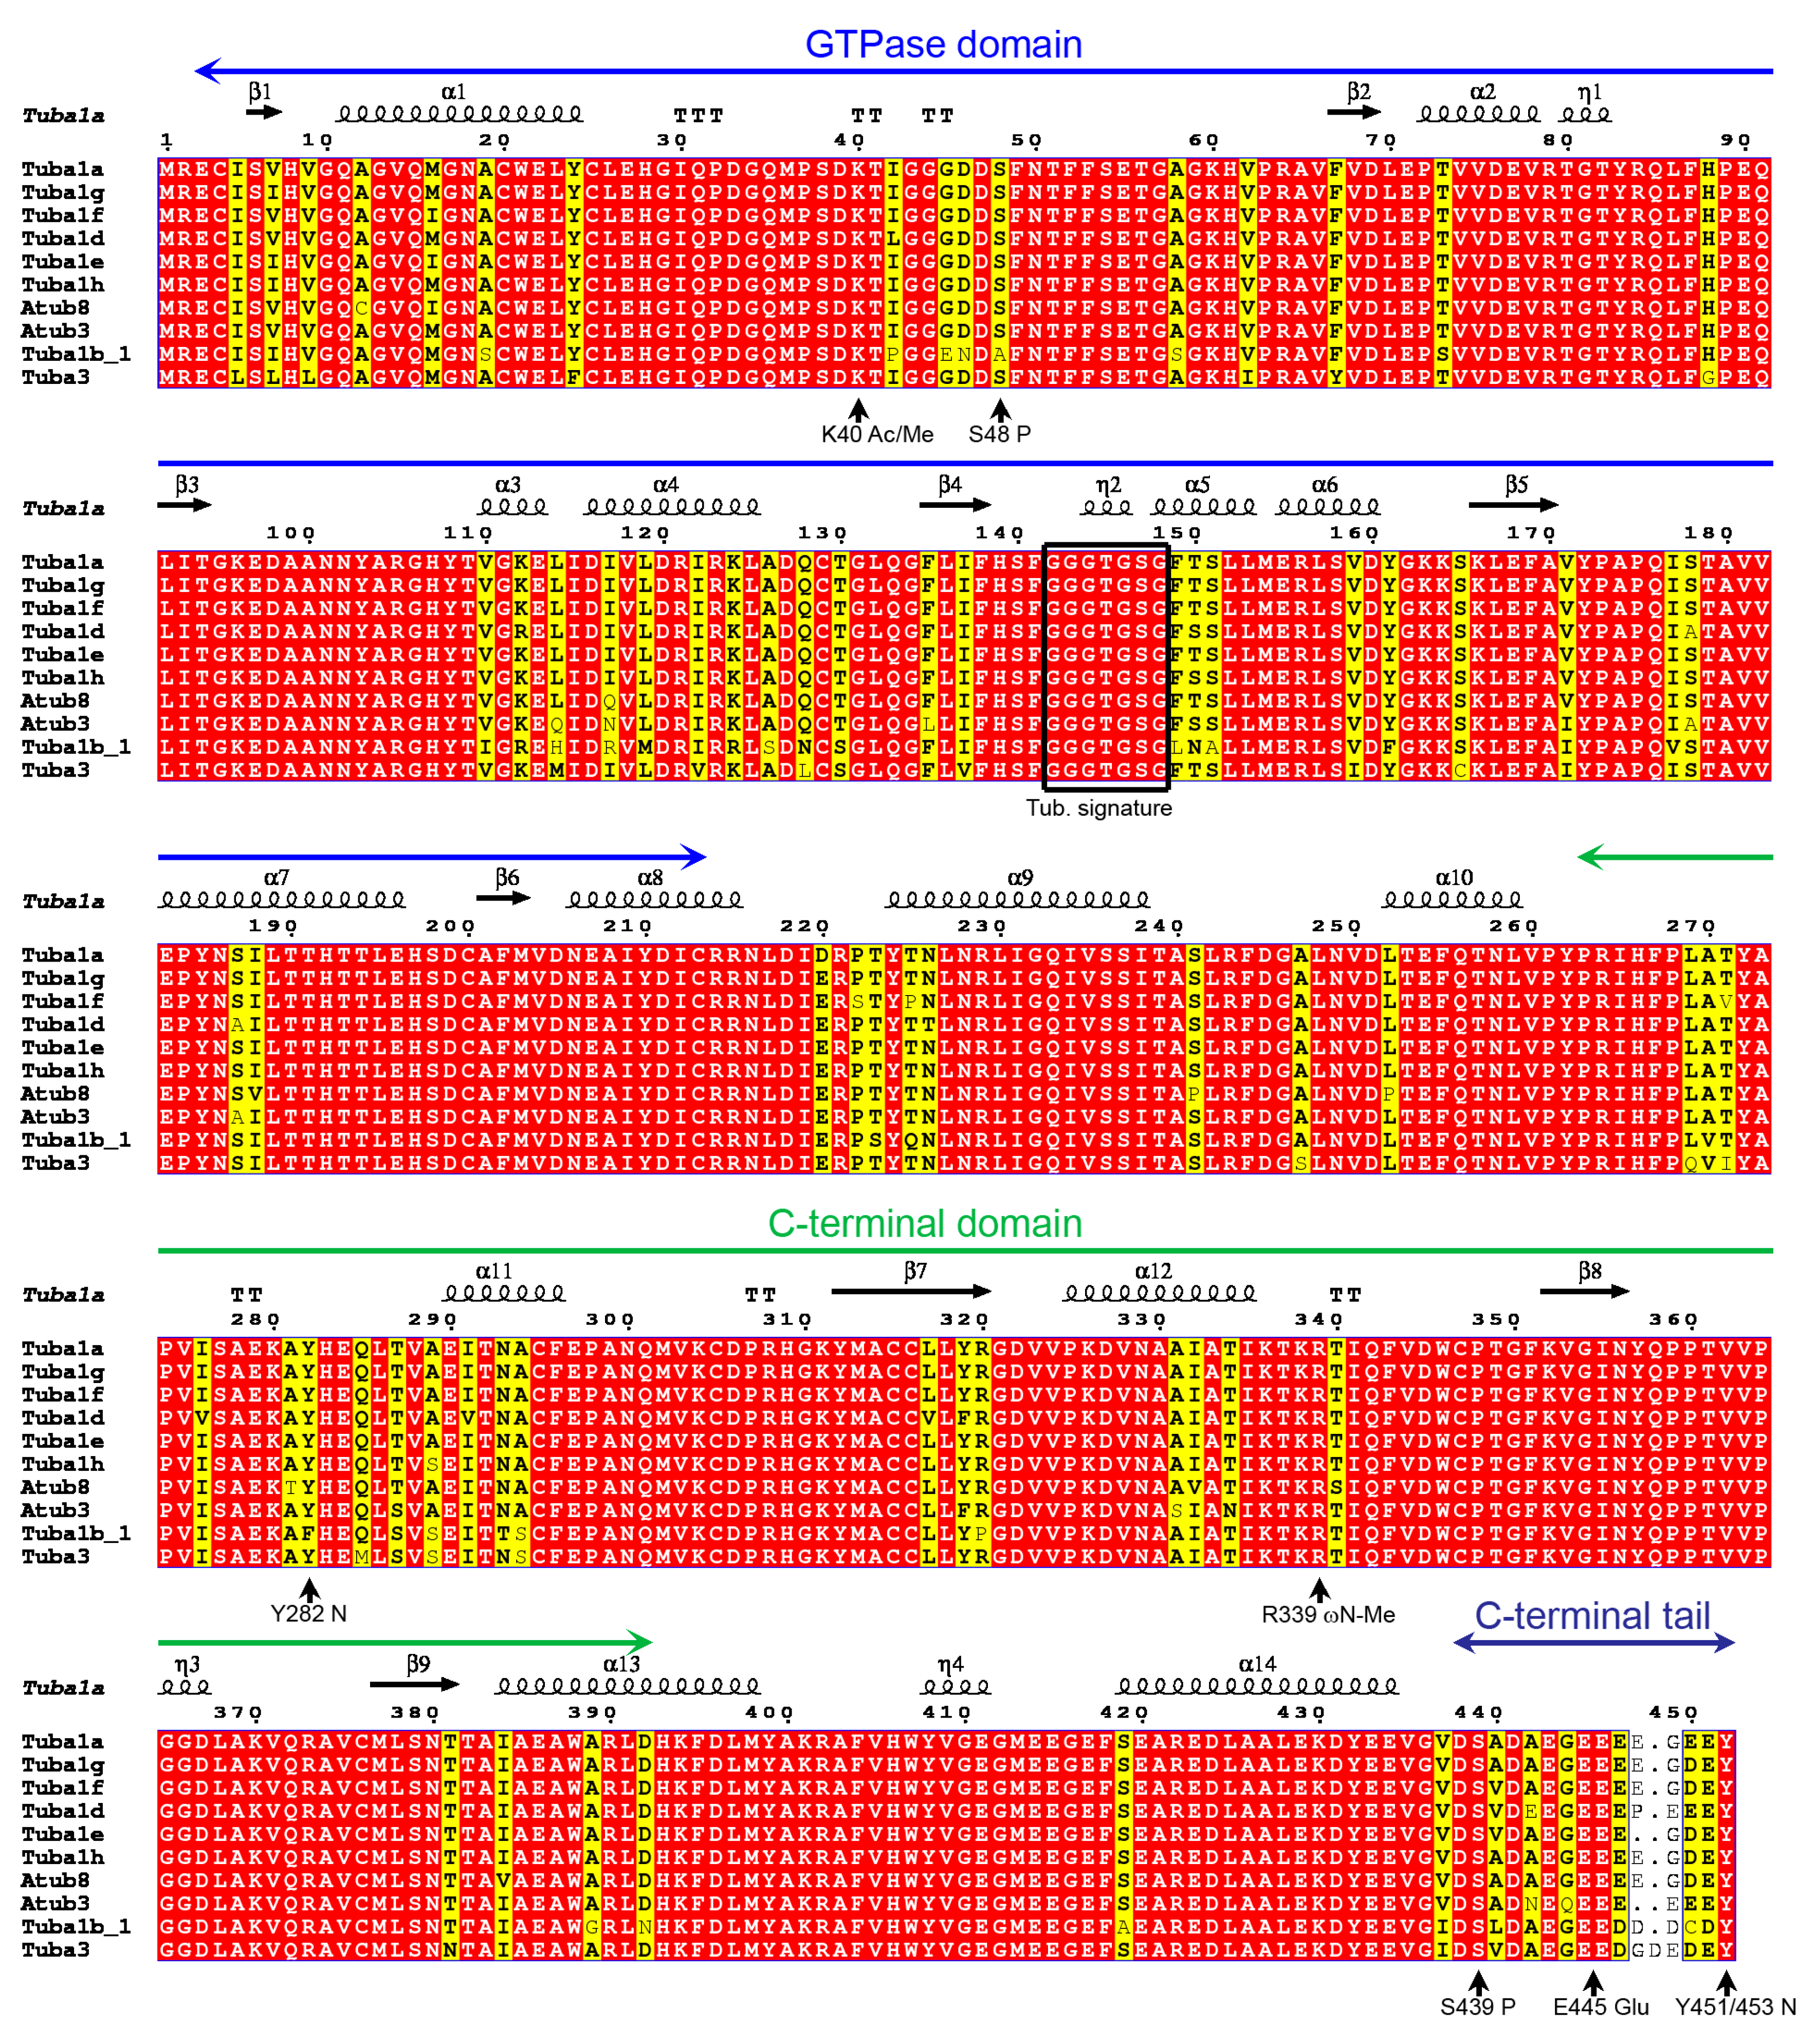
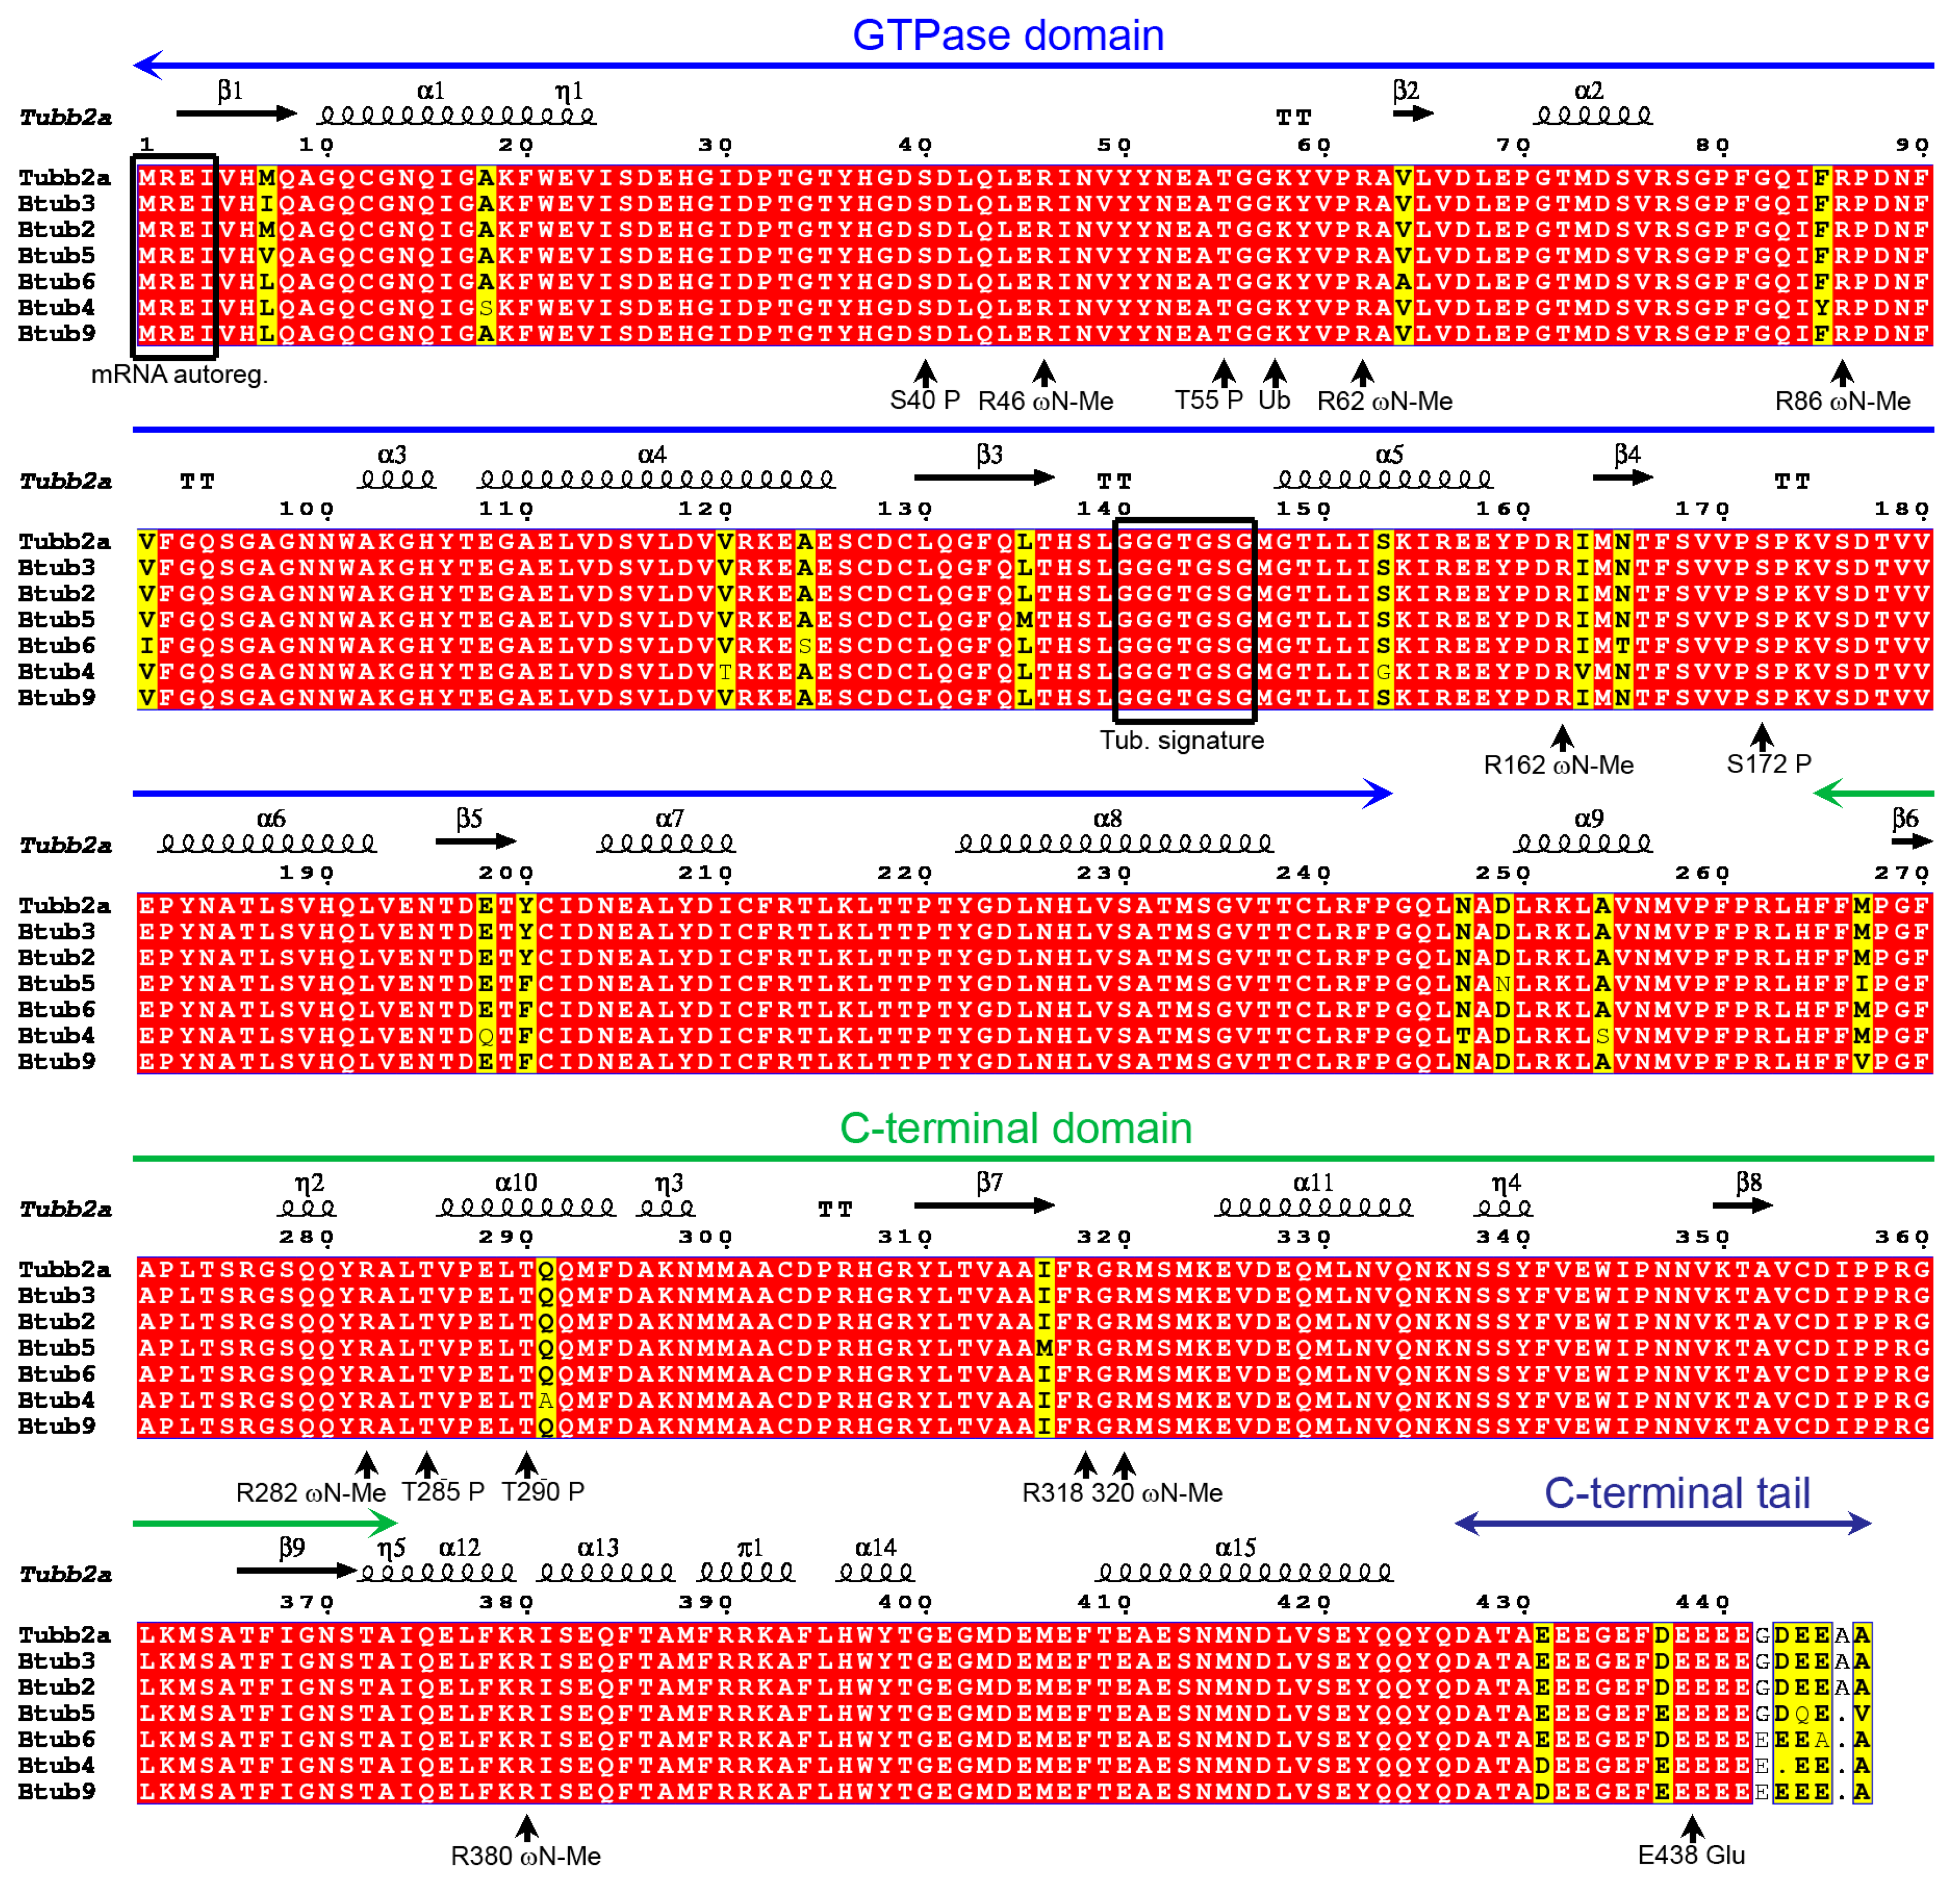
2.1. P. lividus α- and β-Tubulin Identification and Their Predicted PTMs

The availability of large-scale transcriptome collections freely available on public databases allowed us to carry out a transcriptome survey in the sea urchin embryo P. lividus. To identify the expressed α- and β-tubulin multigene family, we implemented BLAST searches. Given the high similarity of α- and β-tubulin sequences, each identification was manually curated as well as reconfirmed by comparative analysis.
Starting from collected sequences in the EST databases, specific primer sets were designed and used to isolate the 3′- and 5′-ends of the cDNAs. The full-length cDNAs were obtained by assembling the 3′ and 5′ RACE products with the original sequences and were validated by sequencing. Several other predicted homologues were detected in the database but were not subjected to further analysis as they contained truncations or domain insertions. To avoid confusion in nomenclature, we used the tubulin gene names coined in the purple sea urchin S. purpuratus or in previous reports [27]. Moreover, sequences corresponding to Tuba1a (α2), Tuba1g (α10), Tuba1h (α1), Tubb2a (β3), Btub2 (β2) and Btub5 (β1) derive from already isolated tubulin transcripts or genes [46,47,48,49,50,51,52,53,54].
All the transcripts contain the Kozak consensus surrounding the initiator codon, while stop codons, polyadenylation signals and a poly(A) tail were found in the 3′-UTRs (untranslated region). The length of mRNAs, open reading frames (ORFs), corresponding amino acid residues and theoretical parameters for each of them are summarized in Table 1.
The P. lividus α- and β-tubulins are organized in an N-terminal GTPase domain with the canonical tubulin signatures GGGTGSG mapping the amino acid residues 142–148 in α- and 140–146 in β-tubulins, respectively, and a C-terminal domain connected by a central helix (Figure 1 and Figure 2). Moreover, tubulins possess an acidic and flexible Carboxy-terminal tail of about 10–15 amino acid residues that in the MTs decorates the external surface and through which MTs interact with microtubule-associated proteins (MAPs) [59].
A computational search for PTMs identified several conserved Ser/Thr phosphorylation recognition sites including S48 and S439 in the α-tubulin chains as well S40, S172, T55, T285 and T290 in β-tubulins (Figure 1 and Figure 2). Even if the functions of these PTMs have remained almost elusive for years, new lines of evidence suggested a control of the dimerization dynamic and a role in the MT behaviour during cell division, especially for β-tubulin phosphorylation at S172 by cyclin-dependent kinase 1 [19,60].
Acetylation of α-tubulin on lysine 40 represents a common PTM especially found on stable MTs [61,62], making microtubules more resistant to mechanical forces [63,64]. Our analyses confirmed the presence of a specific amino acid residue (K40) acetylation/deacetylation site in all α-tubulin (Figure 1) but not β-tubulin isoforms. Similarly, only the α-tubulins contain a Tyr residue (Y451/453) at the C-terminus which may undergo detyrosination/tyrosination cycles corresponding to assembled or disassembled MTs [20,62]. Interestingly, detyrosination guides chromosome congression during mitosis [65]. Together with K40 acetylation, detyrosination was shown to regulate Kinesin-dependent transport [66].
Additionally, exclusively the β-tubulin isoforms possess the N-terminal tetrapeptide (MREY) which co-translationally regulates the mRNA degradation by negative β-tubulin autoregulatory binding (Figure 2), thus altering mRNA stability [67].
In the tubulin dimer, the C-terminal tail harboured by α- and β-tubulins is exposed to the solvent allowing polyglutamylation [68,69] and it is involved in the regulation of interactions between MTs and different structural and motor MAPs, the regulation of flagellar and ciliary beating and the stability of centrioles/centrosomes. Similarly, polyglycylation also occurs at the C-terminal tail and it has been implicated in the mechanical stabilization of the axoneme [20,70].
Polyglutamylation has been studied also in P. lividus, establishing that this PTM is virtually absent in β-axonemal tubulins and that α-tubulin polyglutamylation (that is not evenly distributed along the flagellar length) is important for flagellar motility [71,72,73].
Computational analyses on sea urchin tubulins mapped the existence of polyglutamylation sites in all the proteins, including E445 and E438 in α- and β-tubulins respectively (Figure 1 and Figure 2). This confirms the regulatory role ascribed to these PTMs, connecting tubulins to their associated proteins [20].
Several other PTMs have been identified on tubulins, including ubiquitination and methylation [74]. However, few details on related functions have been provided to date. Interestingly, on the basis of the computational analysis, β-tubulins contain the glycyl-lysine isopeptide (G57K58) that putatively undergoes ubiquitination (Figure 1 and Figure 2).
Recently, methylation has been found on tubulins occurring in lysine and arginine amino acid residues [22,75,76,77,78,79,80] and it has not been characterized in detail.
All these features, including post-transcriptional and post-translation mechanisms, represent a hallmark of the tubulin multigene family and the polymer structural diversity [74,75,76].
A MSA analysis confirm the high similarity among members of α- and β-tubulin family and that the main differences located at the C-terminal tail may correspond to the differential isotype class involved in specific heterodimers which in turn may affect MT properties. Additionally, it appears that α isotypes accept more residue variations in the corresponding sequence. An analysis of amino acid substitutions shows that, both in α and β isotypes, about 50% of variability occurs in α helix or β sheet secondary structures. The additional variations showed by α isotypes mainly involve amino acid residues structured in α helix. This is not surprisingly since α helices were already found underrepresented in conserved regions [81,82].

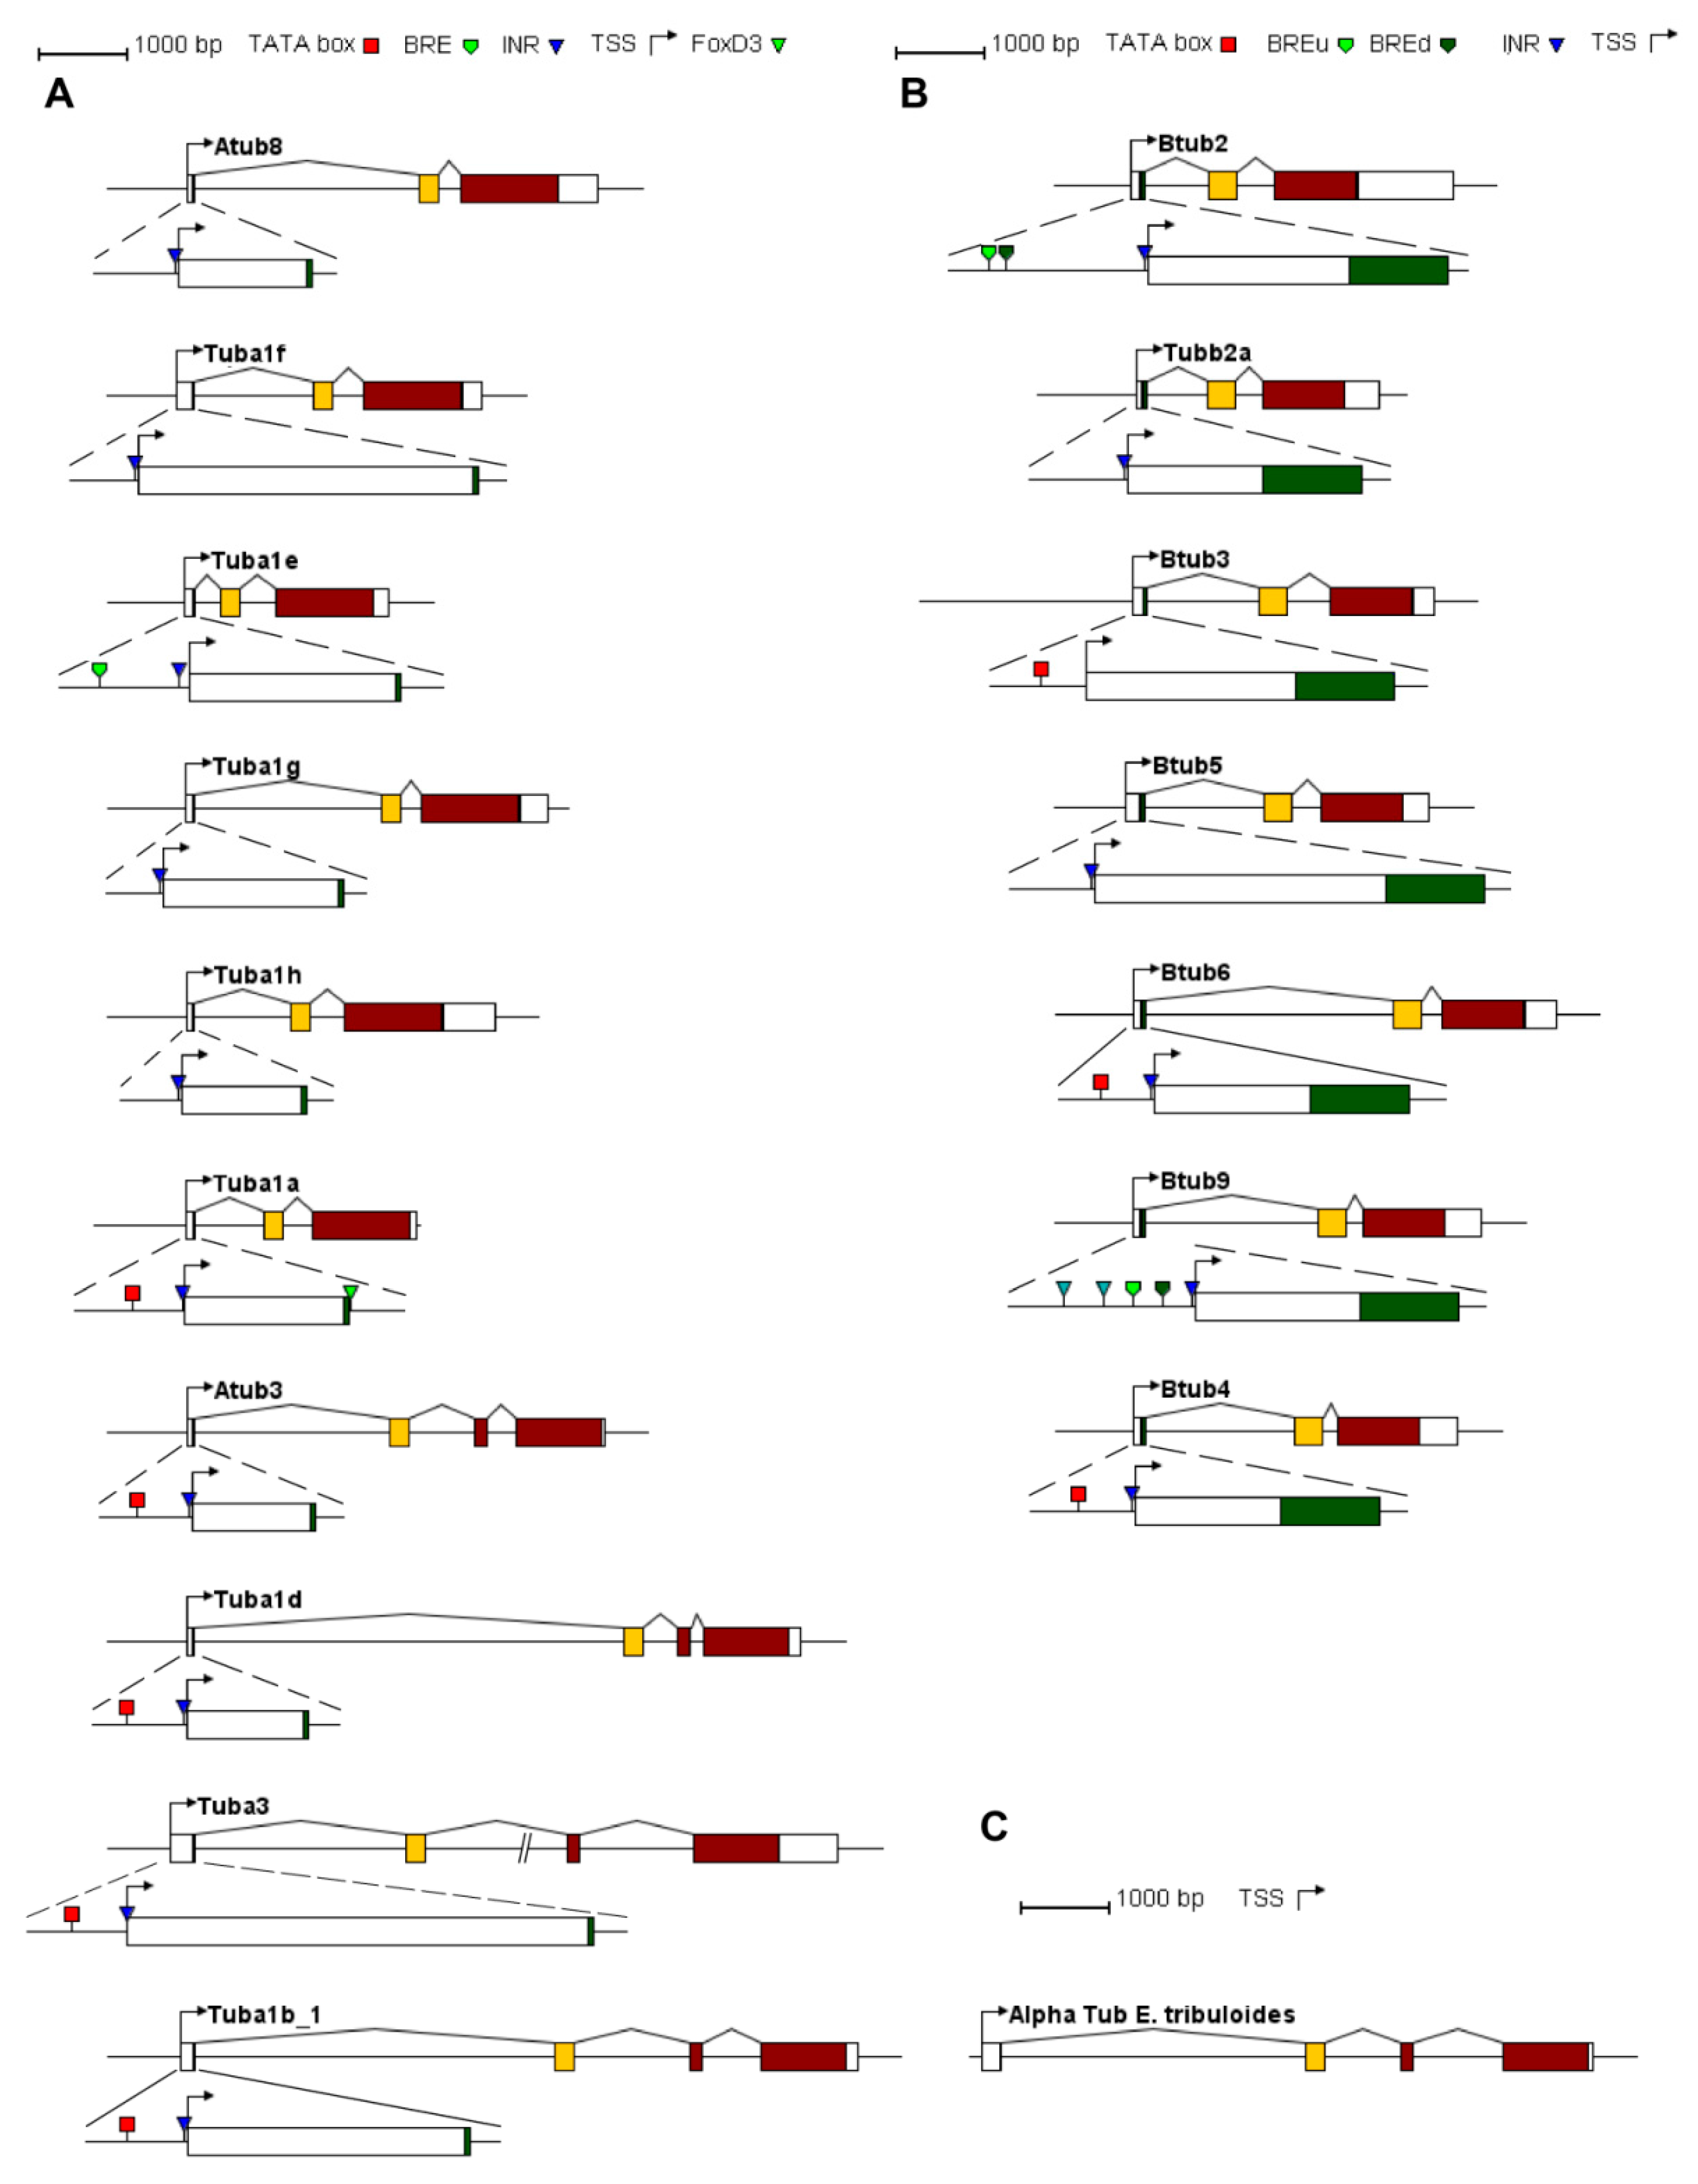
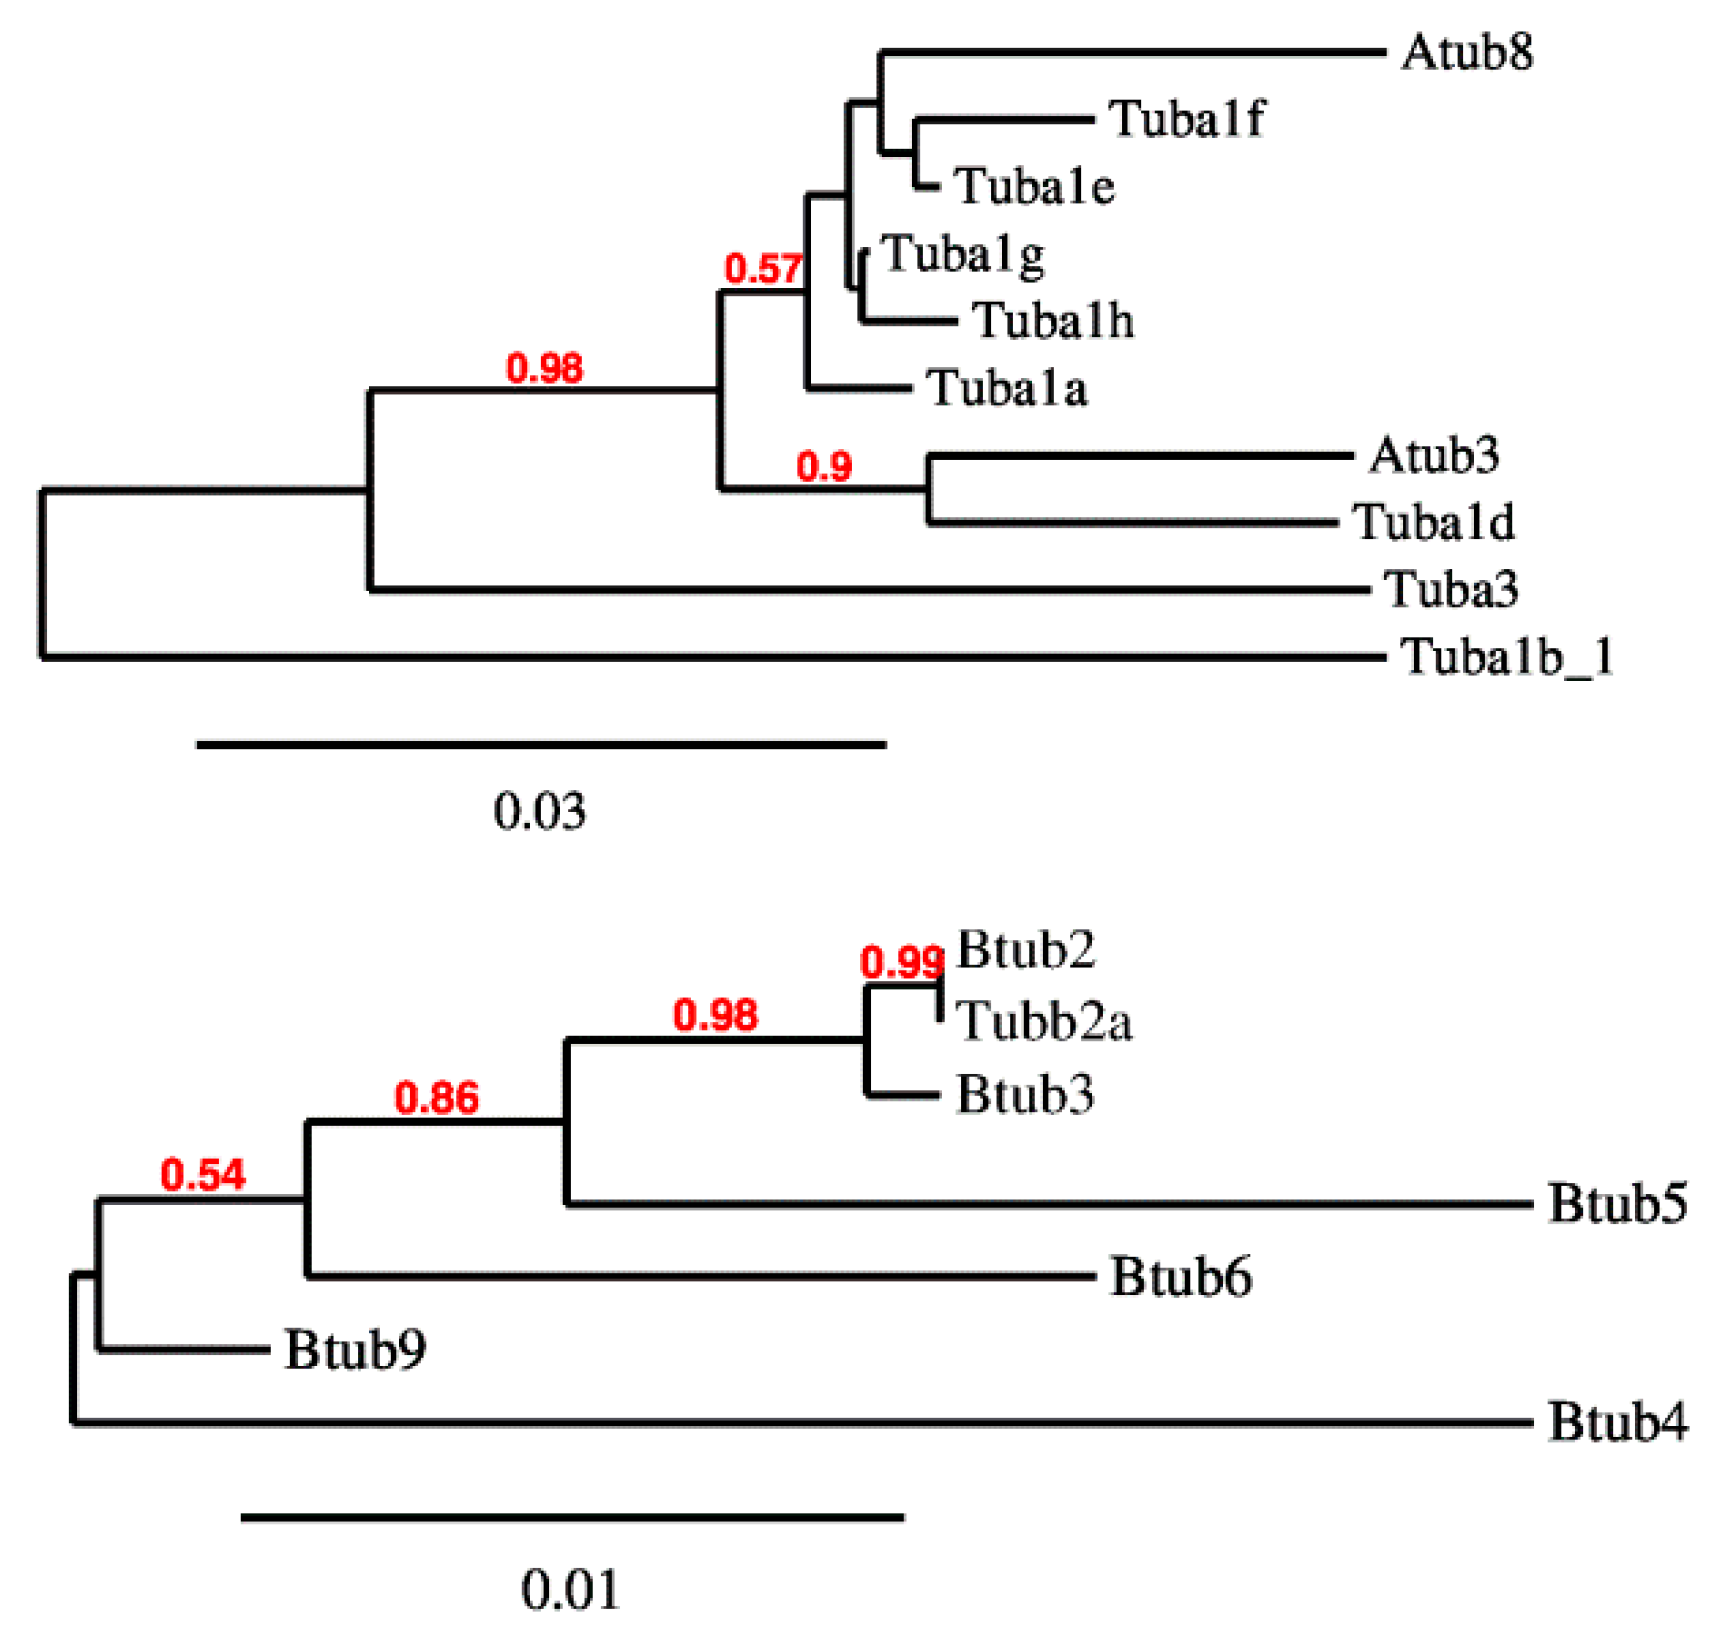
2.2. P. lividus α- and β-Tubulin Gene Organization

To characterize the α- and β-tubulin gene structures, efforts were made to isolate genomic loci related to cDNAs.
Seven β-tubulin genomic clones and 11 diverse clones corresponding to α-tubulins were selected. The gene structures of the P. lividus tubulin genes are represented in Figure 3A,B.
The comparison between cDNA and genomic sequences revealed that the transcription unit of all the β-tubulin genes and α genes including Atub8, Tuba1f, Tuba1e, Tuba1g, Tuba1h and Tuba1a, are composed of three exons interrupted by two introns, whereas in Atub3, Tuba1d, Tuba3 and Tuba1b_1 an additional intron interrupts the coding sequence at the amino acid 125 (phase-0); thus the fourth exon includes sequences encoding the Tub signature, the remaining part of the GTPase domain and the C-terminal domain. In α-tubulin genes, the first intron occurs after the first codon (phase-0) and the second intron is located after the codon number 75 (phase-1). To verify if the third intron occurring in position 125 was acquired before the origin of Echinodermata phylum, an inspection of the α-tubulin expressed genes in a member of the basal echinoid order Cidaroida was performed. Indeed, an α-tubulin gene structured with four exons was found in the slate pencil urchin Eucidaris tribuloides and is reported in Figure 3C. Therefore, it could be reasonably hypothesized that this intron originated before the speciation of Echinodermata and was maintained in the lineage leading to Vertebrata [83].
In β-tubulin genes, the first intron occurs after the codon number 19 (phase-0) and the second intron is located after the codon number 131 (phase-0). All of them possess canonical splicing sites, identified at 5′-end by GT and at 3′-end by AG consensus sequences. Interestingly, the first intron is vertebrates specific, while the second one is shared with invertebrates and is maintained with the alga and fungi [83].
Moreover, computational analyses were performed on the proximal upstream region, revealing the presence of canonical sharp core promoter elements (BRE, TATA box and/or INR) often organized in couples, as reported in Figure 3 and Table 2.
Both sequence comparison and gene structure analyses provide similar suggestions about the evolution of these gene families, in particular the isotypes that are closely related each other based on tree topology (Figure 4), show the same gene organization and promoter features. This is particularly evident for α-tubulin genes, indeed the divergent ones possess the additional intron and are TATA box dependent (Atub3, Tuba1d, Tuba3 and Tuba1b_1). Additionally, for β-tubulin genes is it possible to observe a stricter relation among genes showing similar first intron length (Btub2, Tubb2a and Btub3).

2.3. P. lividus α- and β-Tubulin Gene Expression

To analyse the expression profiles of α- and β-tubulin embryonic transcripts, total RNA was isolated from different developmental stages including eggs, early blastula, late blastula and prism and RT-qPCR were performed. The α- and β-tubulin gene families contain members whose transcripts are detected both in unfertilized eggs and during development, and genes whose transcripts showed different expression levels during embryogenesis.
Atub8, Tuba1g, Tuba1h and Tuba1b_1 transcripts resulted maternally inherited since they were detected in unfertilized eggs. Atub8, Tuba1g, Tuba1h resulted expressed also during the development reaching the higher levels at early/late blastula stages and then decreasing at prism, whereas Tuba1b_1 was not expressed during early development and was re-expressed at prism.
The expression of the remaining α-tubulin genes was developmentally regulated rising progressively until early and late blastula as occurred for Tuba1a and Tuba3 or restricted at late blastula stage (Tuba1f) or prism stage (Tuba1e, Atub3 and Tuba1d).
Among β-tubulin genes, only the Btub9 transcript was found in unfertilized eggs and its levels are high; while the mRNA level was reduced during the development. Btub2 and Btub3 transcripts showed similar profiles being expressed in a stage specific manner at early blastula and prism; while Btub6 and Btub4 mRNA expression was restricted at prism. Conversely, Tubb2a and Btub5 showed constitutive expression during development. The results agree with previous reports [47,48,49,50] and are summarized in Table 1.

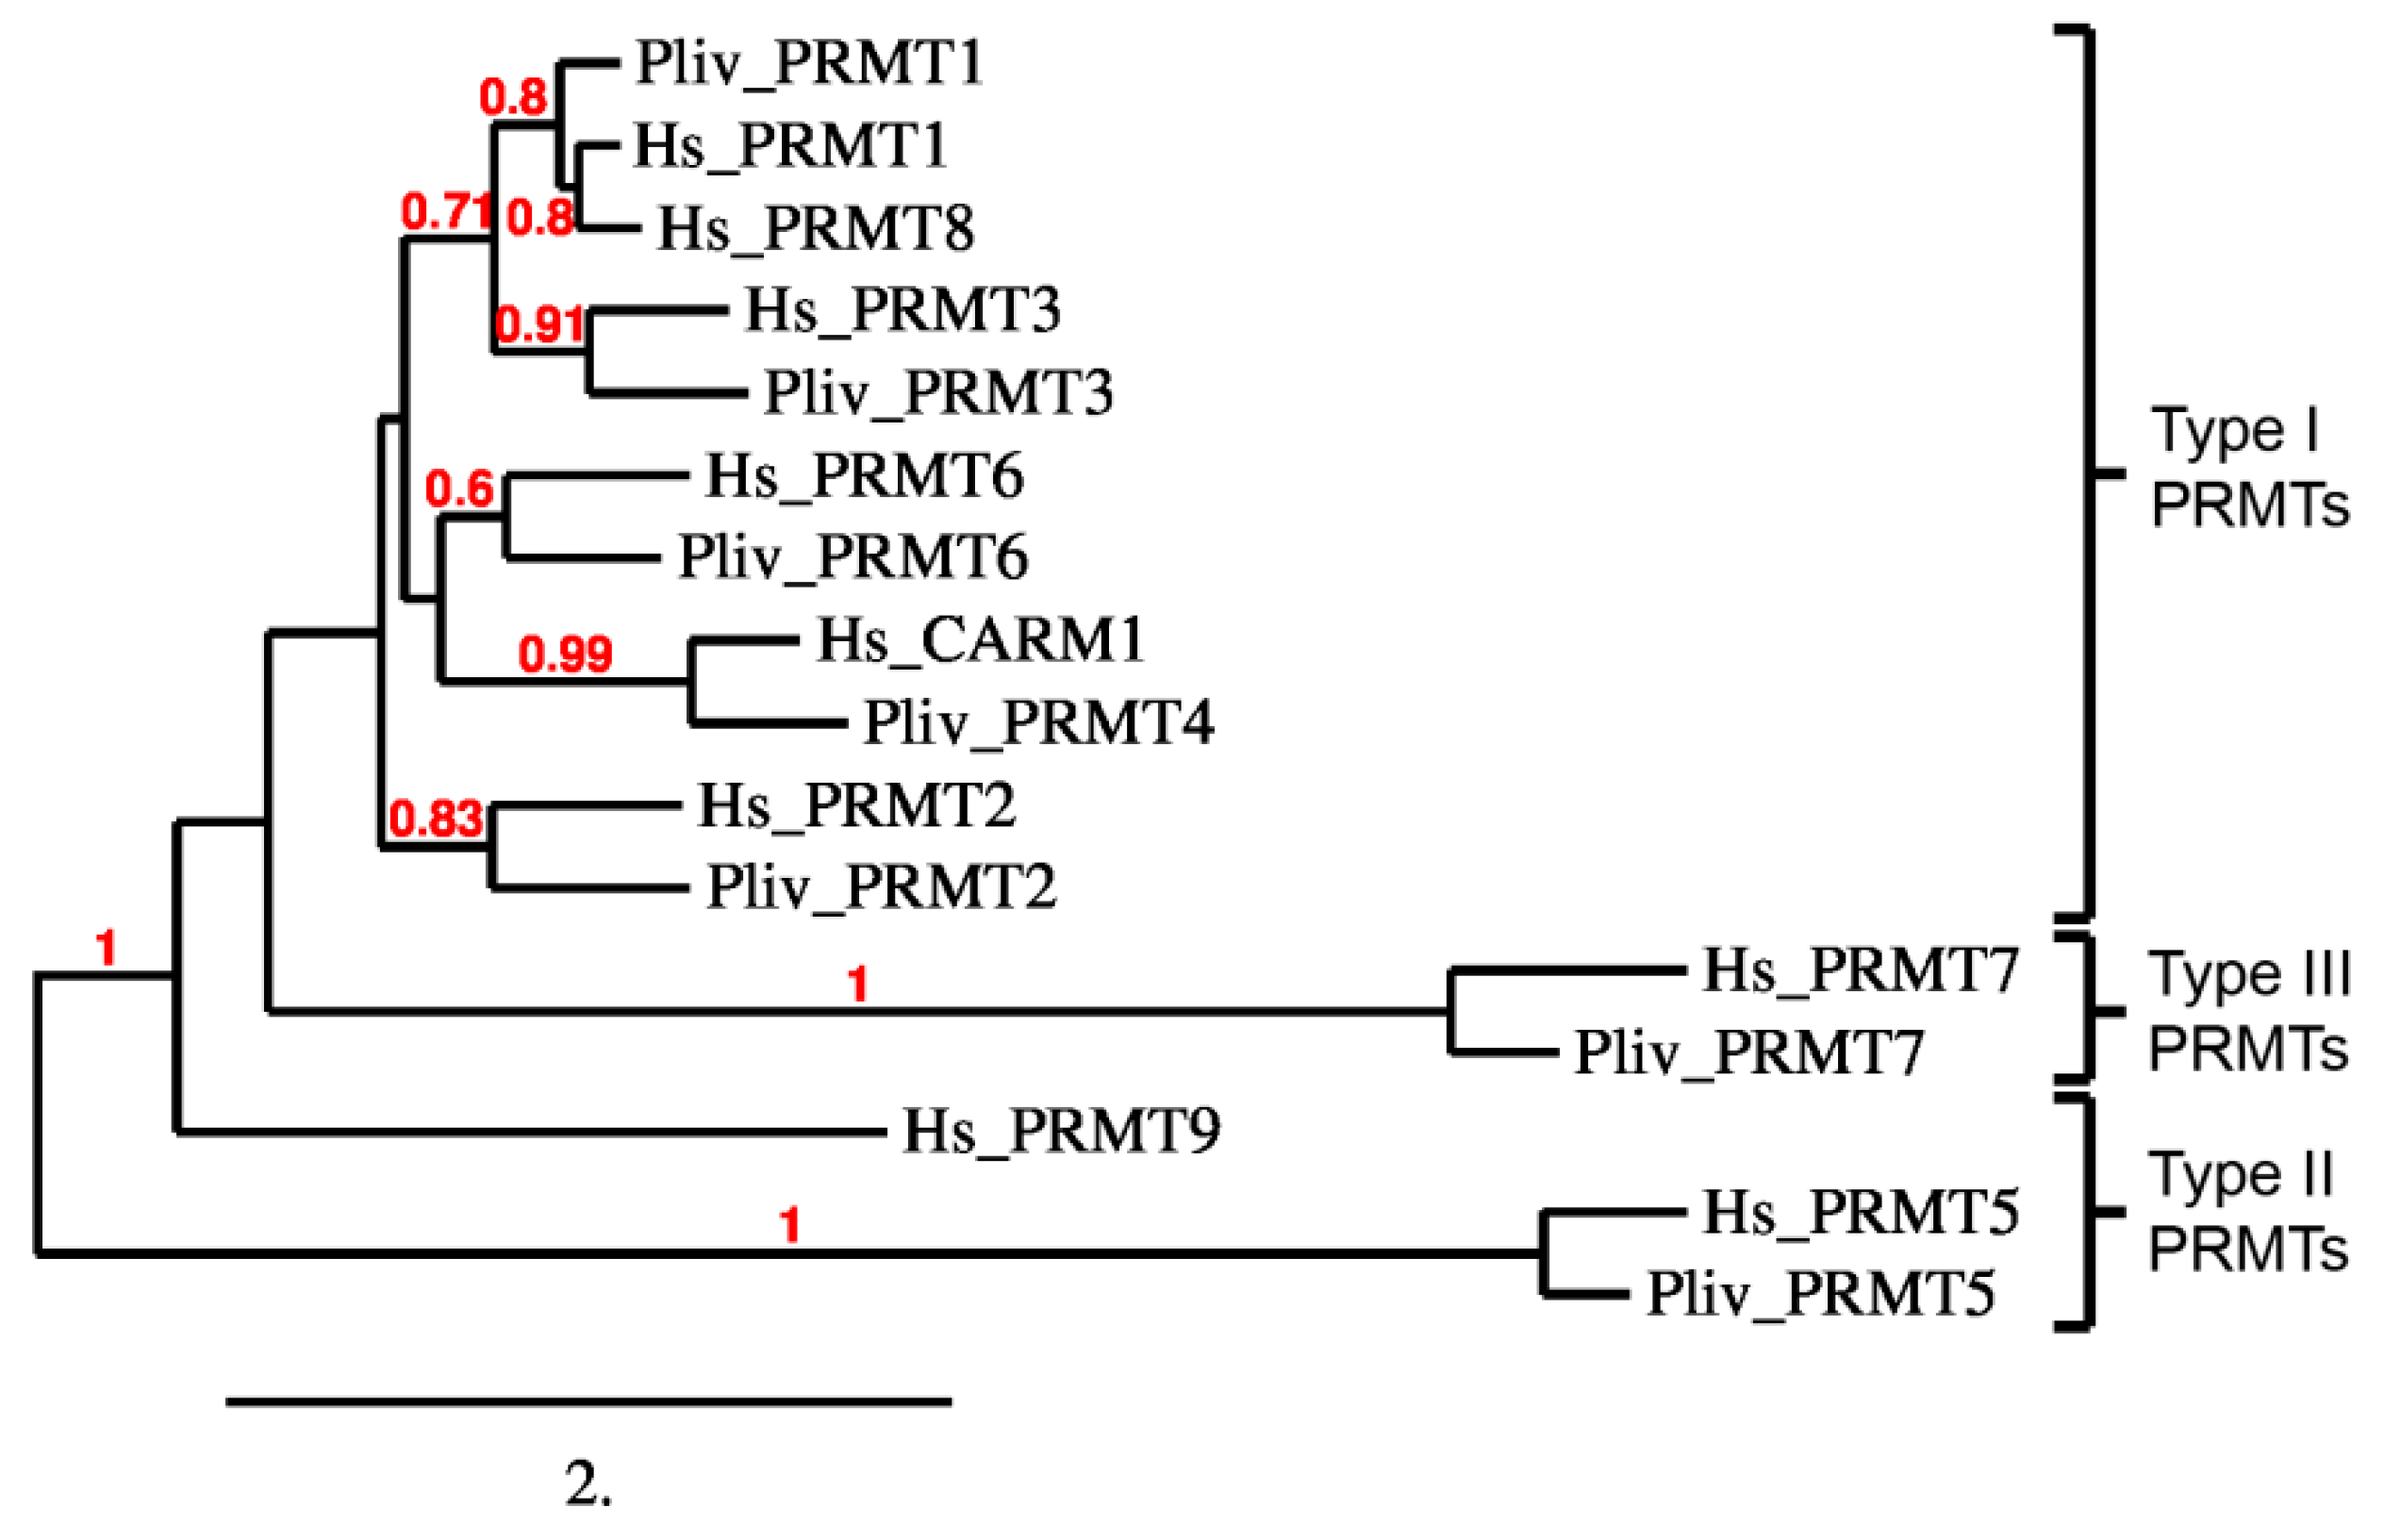
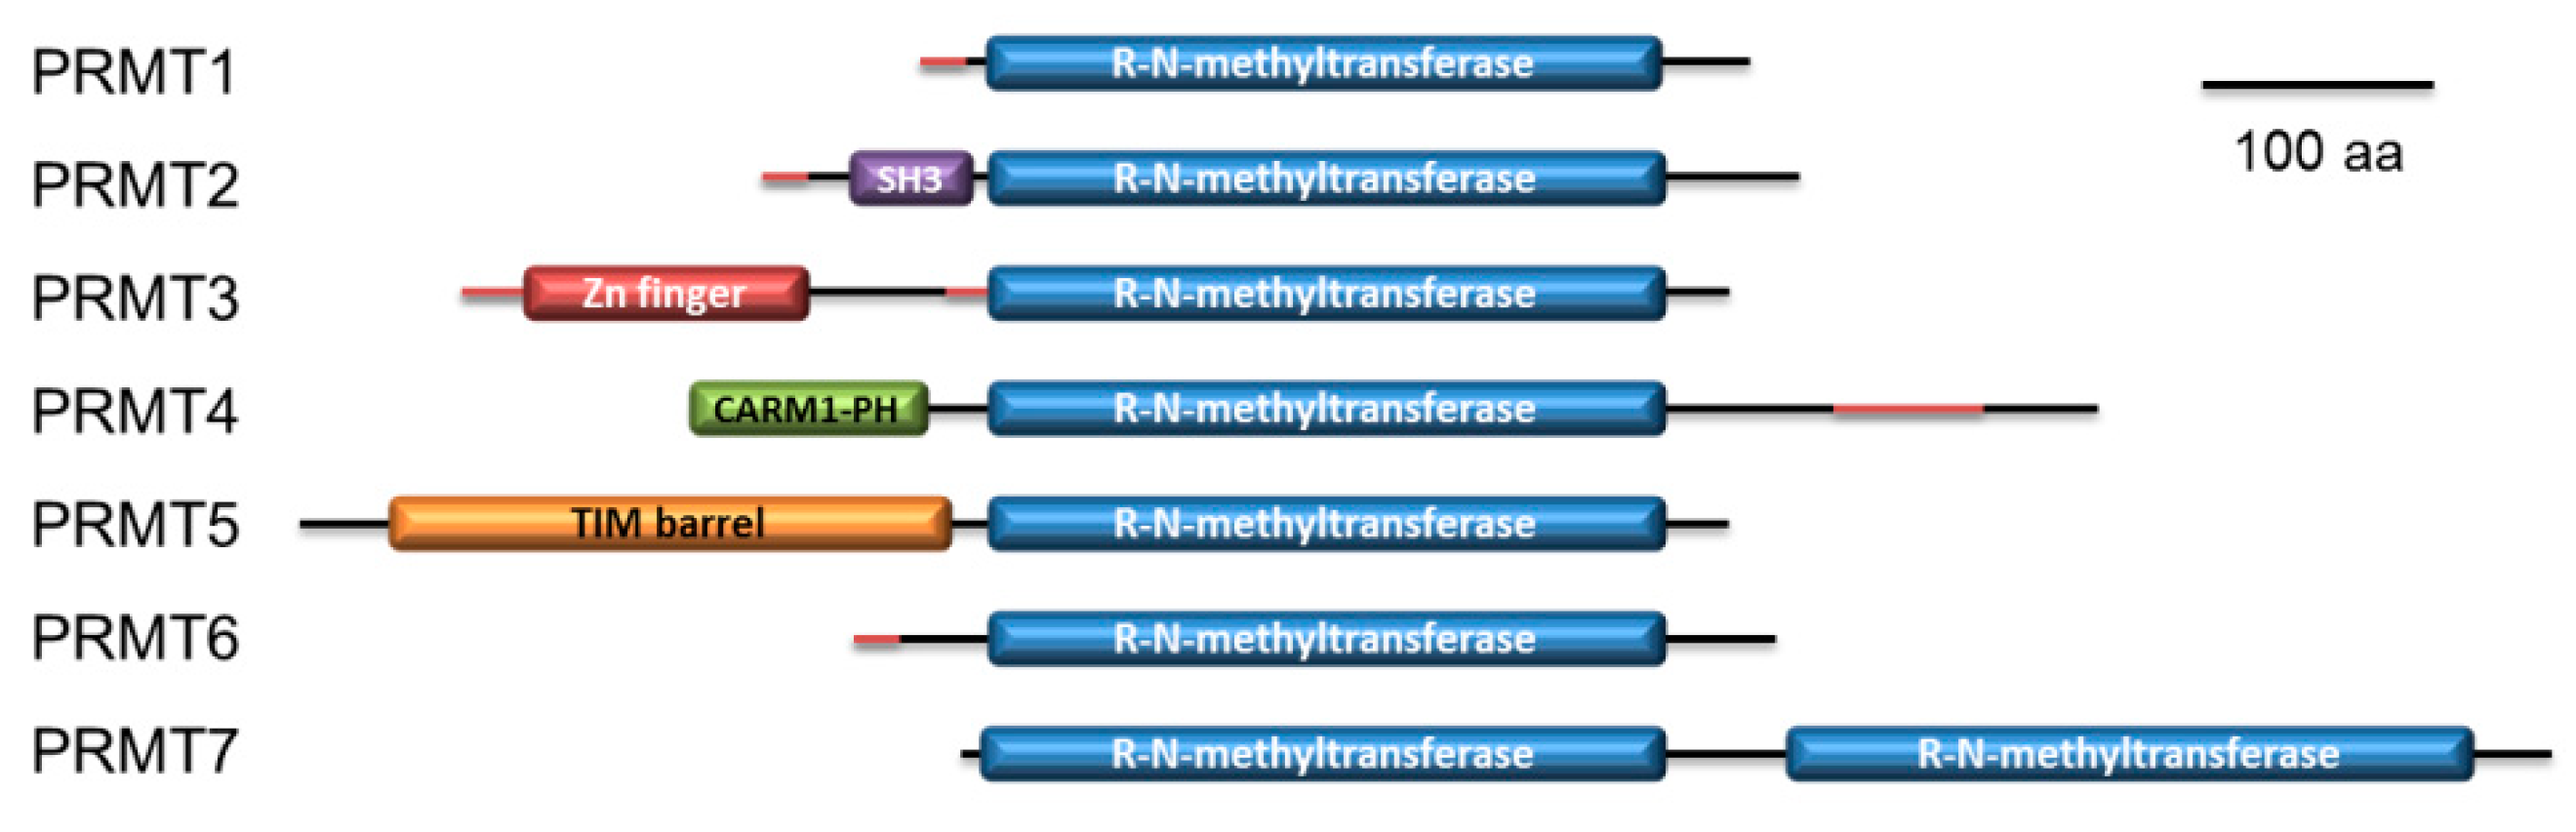
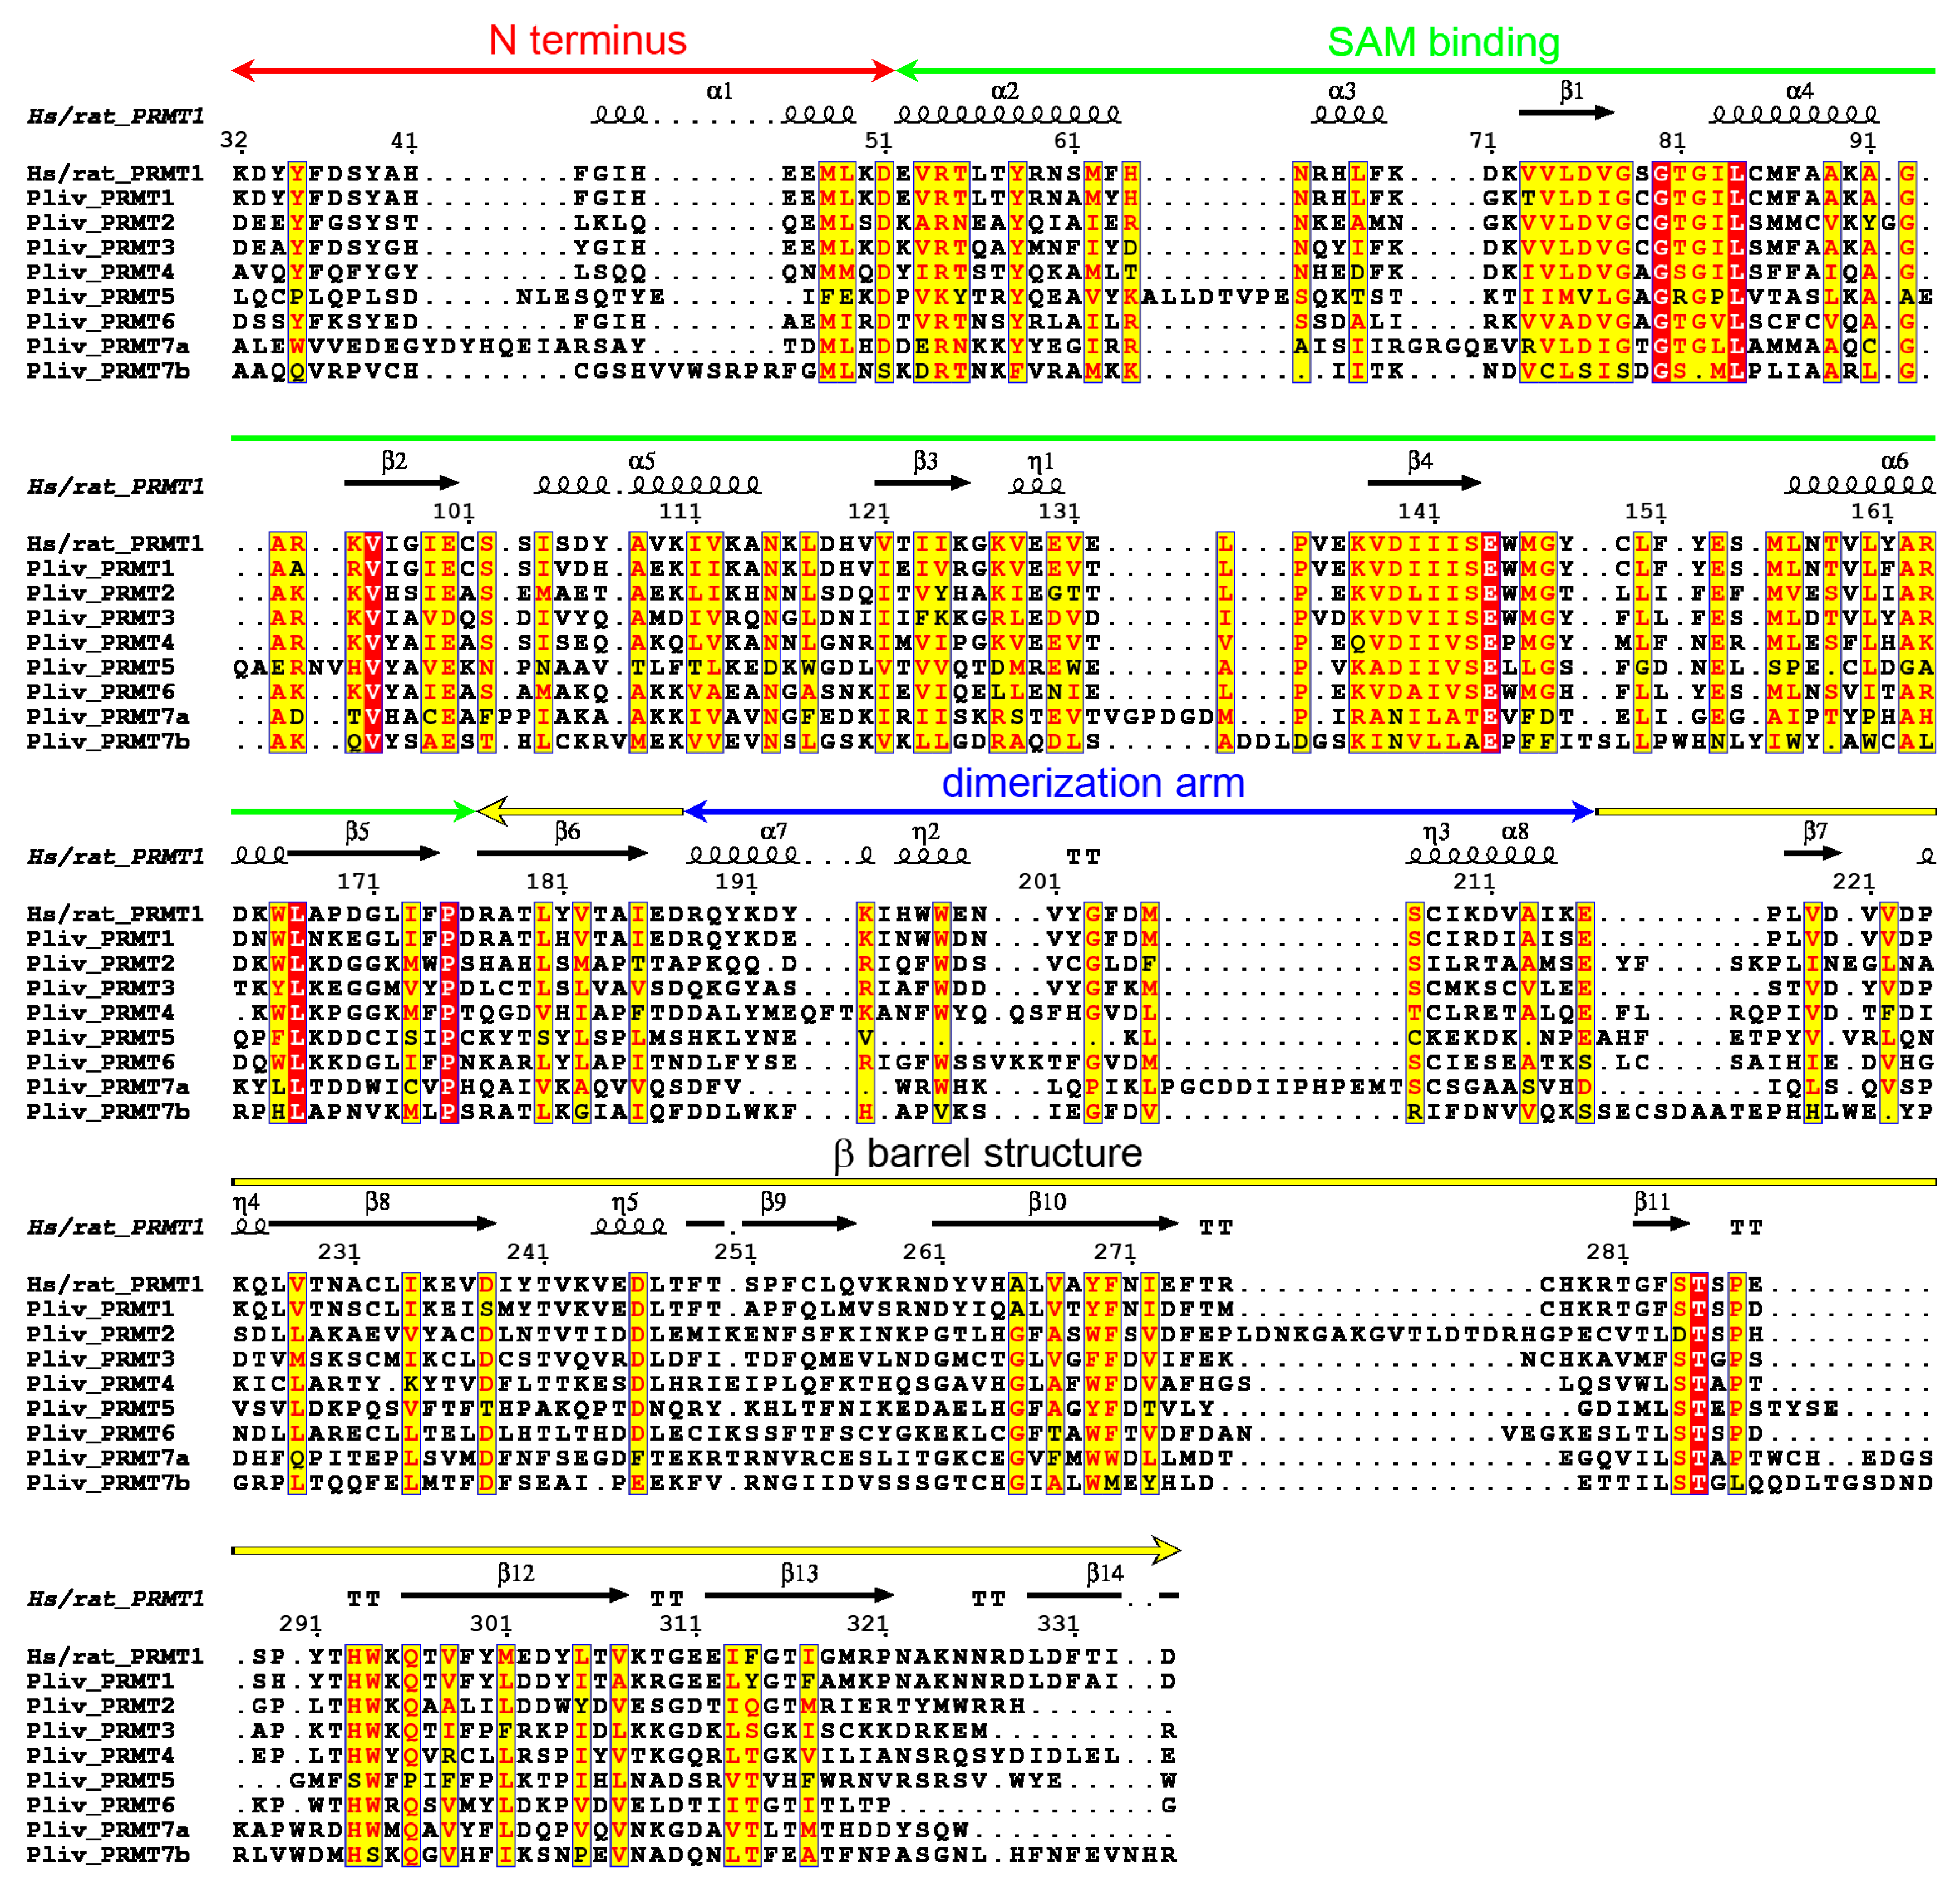
2.4. P. lividus PRMT Orthologues

Due to the growing interest in the protein methylation effects and the recent discover of tubulin methylated sites in neural cells [22], together with the lack of information in the sea urchin methyl transferase, we studied the protein arginine methyltransferase family in P. lividus.
Using human PRMT protein sequences as queries, we detected in the P. lividus EST database partial sequences coding for PRMT1 to PRMT7. To complete coding sequences, 3′ RACE PCRs were performed. Clones selection was carried out in the same manner as for tubulin cDNAs. Predicted amino acid sequences, whom features are summarized in Table 3, were in silico characterized.
An effort was also carried out to isolate cDNAs coding for PRMT8 and PRMT9, however no matching sequences were retrieved in the dataset. Similarly, a screening of the cDNA and genomic libraries, using degenerate primer sets failed to detect any positive signal (data not shown). Therefore, we hypothesize that in P. lividus no orthologues of such methyltransferases do exist. The PMRT gene family and their related protein features are summarized in Table 3.
Inspection of the predicted domains of P. lividus PRMTs showed that they possess the canonical methyltransferase domain. Overall, a SAM-dependent methyltransferase PRMT-type domain is shared among them. In addition, a Src homology 3 (SH3) domain in PRMT2, a Zinc finger C2H2 superfamily domain in PRMT3, a Pleckstrin homology (PH) like domain similar to CARM1 N-terminal histone-arginine methyltransferase domain in PRMT4, a TIM barrel domain in PRMT5 and a second methyltransferase domain in PRMT7 were found (Figure 5). On the basis of domain organization, protein comparison with human orthologues (see supplemental material) and phylogenetic analysis (Figure 6), we likely hypothesize that sea urchin PRMT1, PRMT2, PRMT3, PRMT4 and PRMT6 belong to the type-I enzyme while PRMT5 to type-II and PRMT7 to type III [84].
An MSA of the arginine methyltransferase domains show the conservation between mammal and echinoderm PRMTs (see also Supplementary Figures S1 and S2) and the typical differences into the PRMT family. The active site residues, essential for enzymatic activity, are conserved (i.e., glutamates 144 and 153 in rat, 149 and 158 in P. lividus, Figure 7) as well as the GxGxG motif used to bind the adenosyl part of S-adenosyl-L-methionine (SAM) and the acidic residue at the end of β2 that forms hydrogen bonds to both hydroxyls of the SAM ribose (glutamate 100 in rat, 105 in P. lividus, Figure 7).

2.5. P. lividus PRMT Expression

To study the mRNA expression profile of PRMTs during development, we performed RT-qPCR experiments at different developmental stages.
Results (reported in Table 4) show that, with the exception of PRMT3 and 6, PRMTs are expressed in the unfertilized egg, therefore they are maternally inherited. PRMT1 mRNA resulted hugely transcribed until late blastula stage, while it remained expressed at lower levels at prism stage. Conversely, similar RNA expression levels were detected for PRMT2, 4 and 5, showing a basal expression during embryogenesis. Differently, PRMT7 and 3 are developmentally regulated, rising progressively until early and late blastula stage respectively.

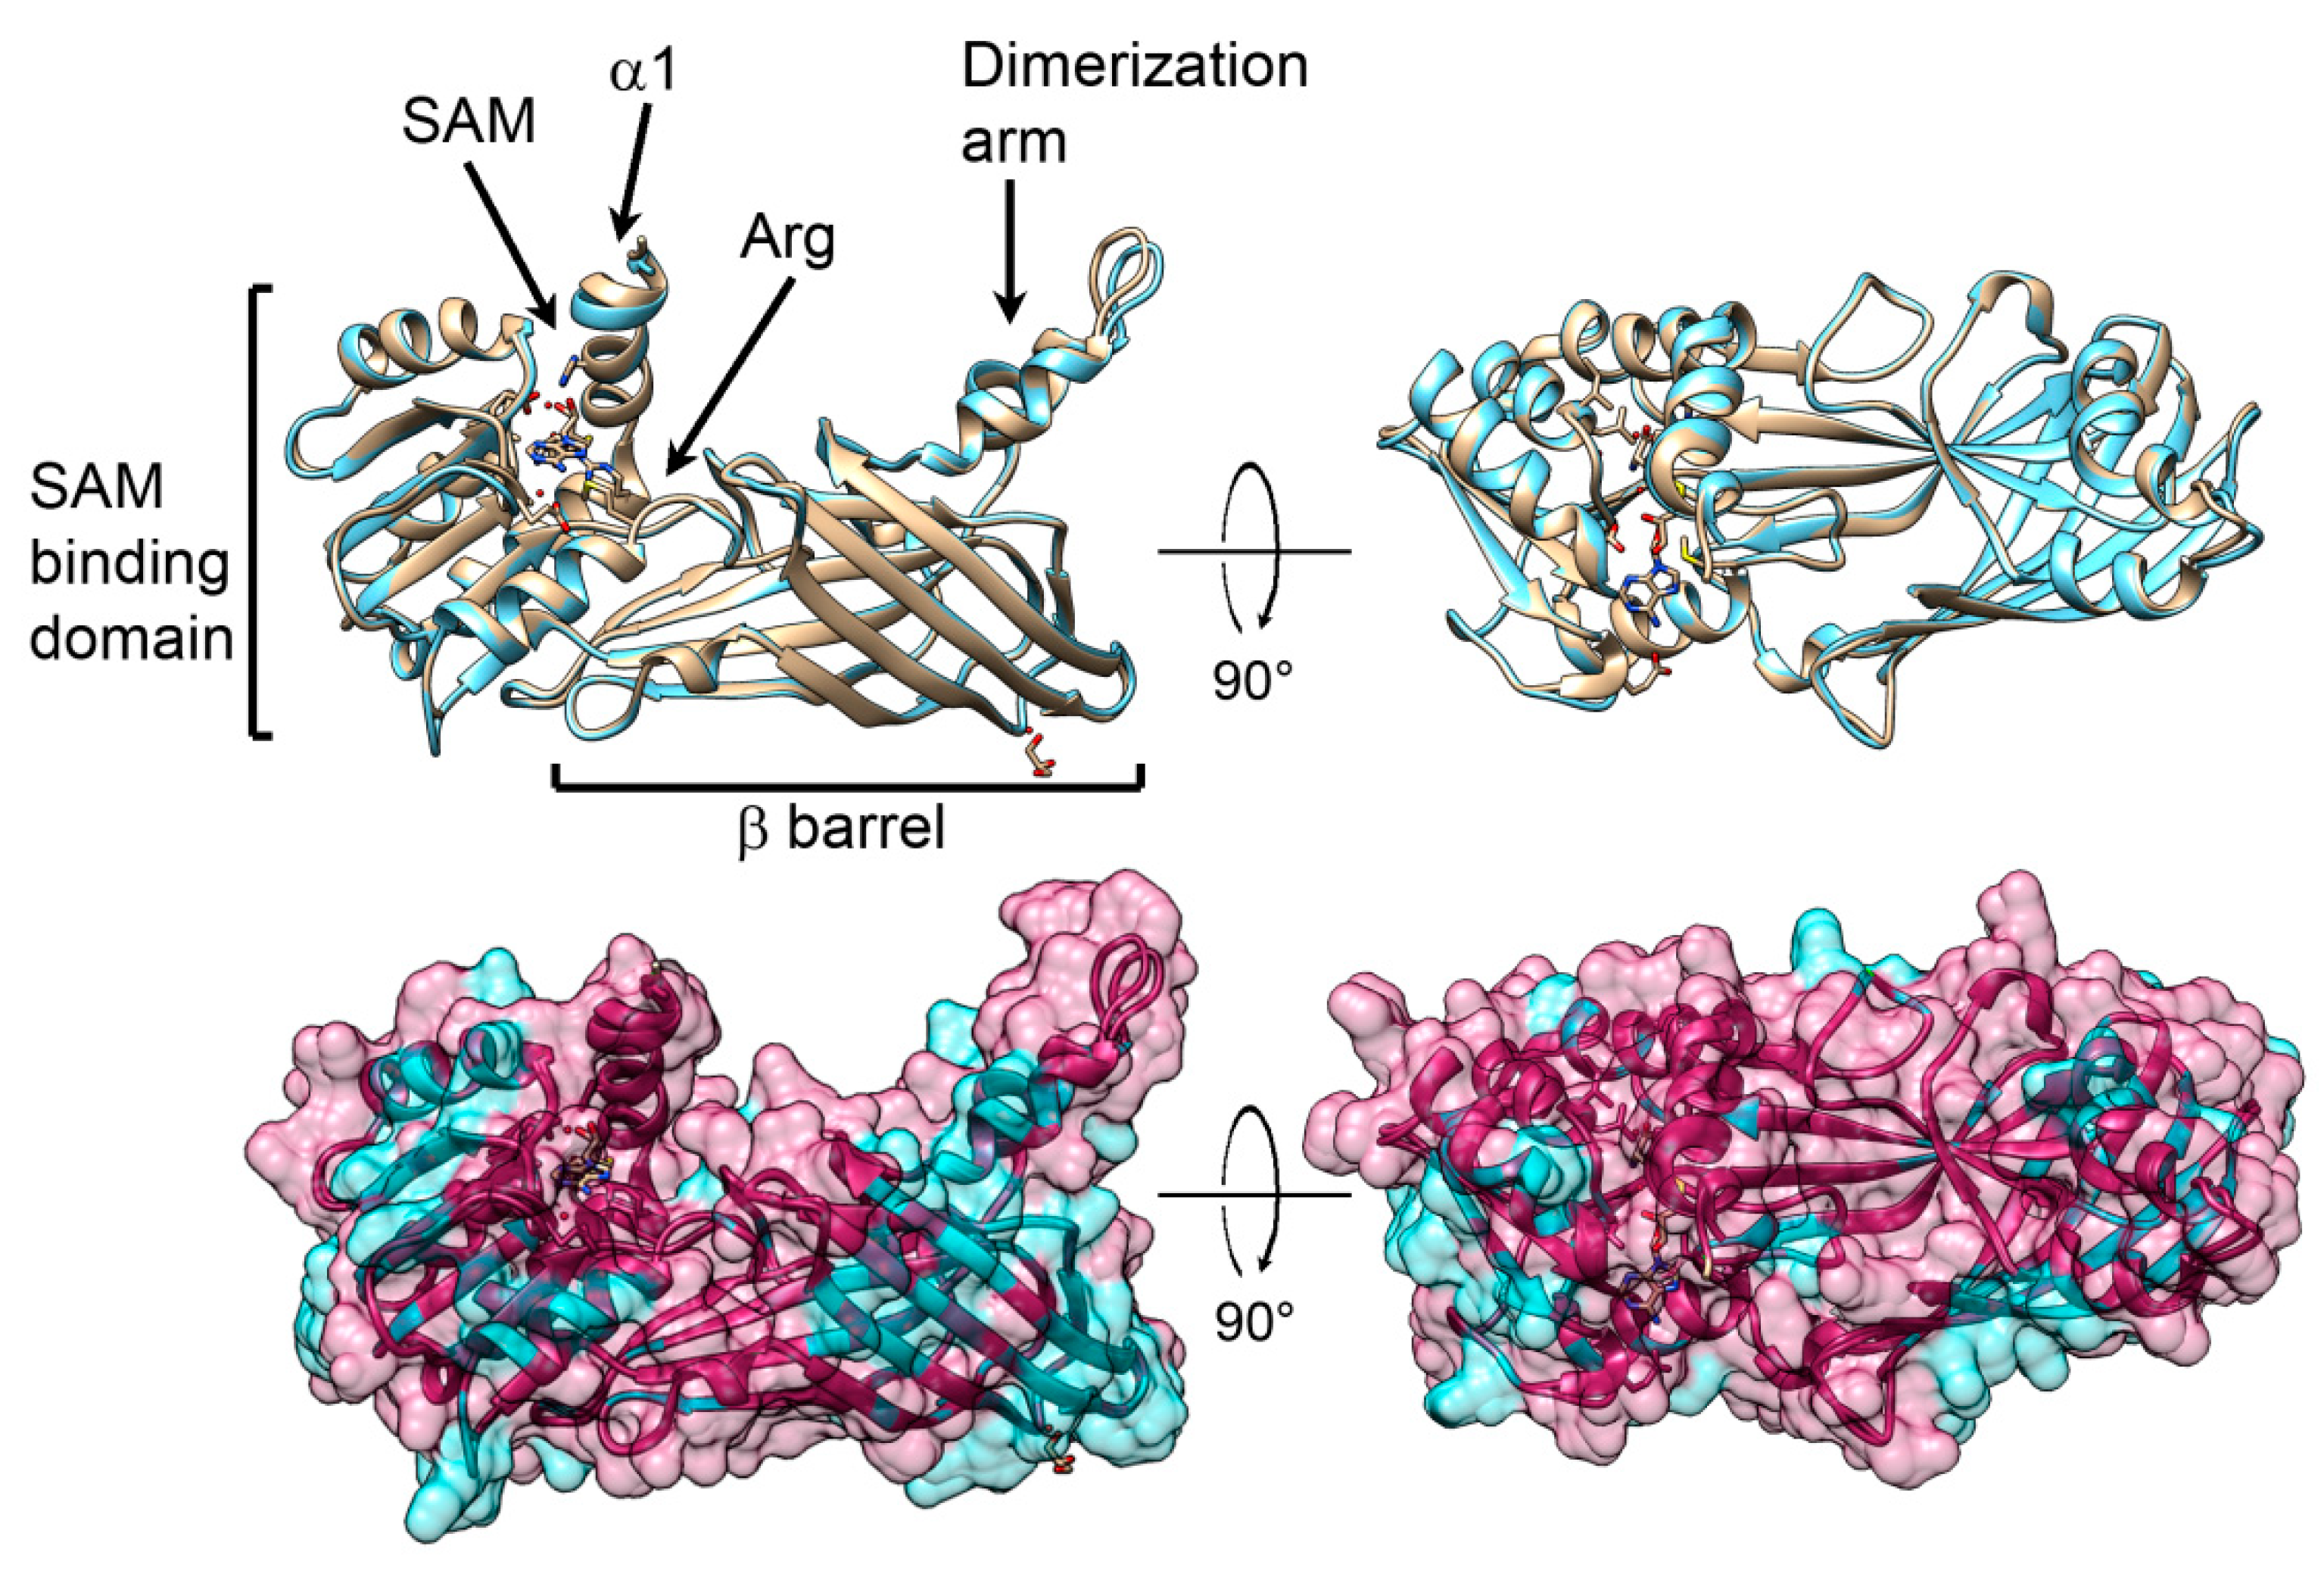
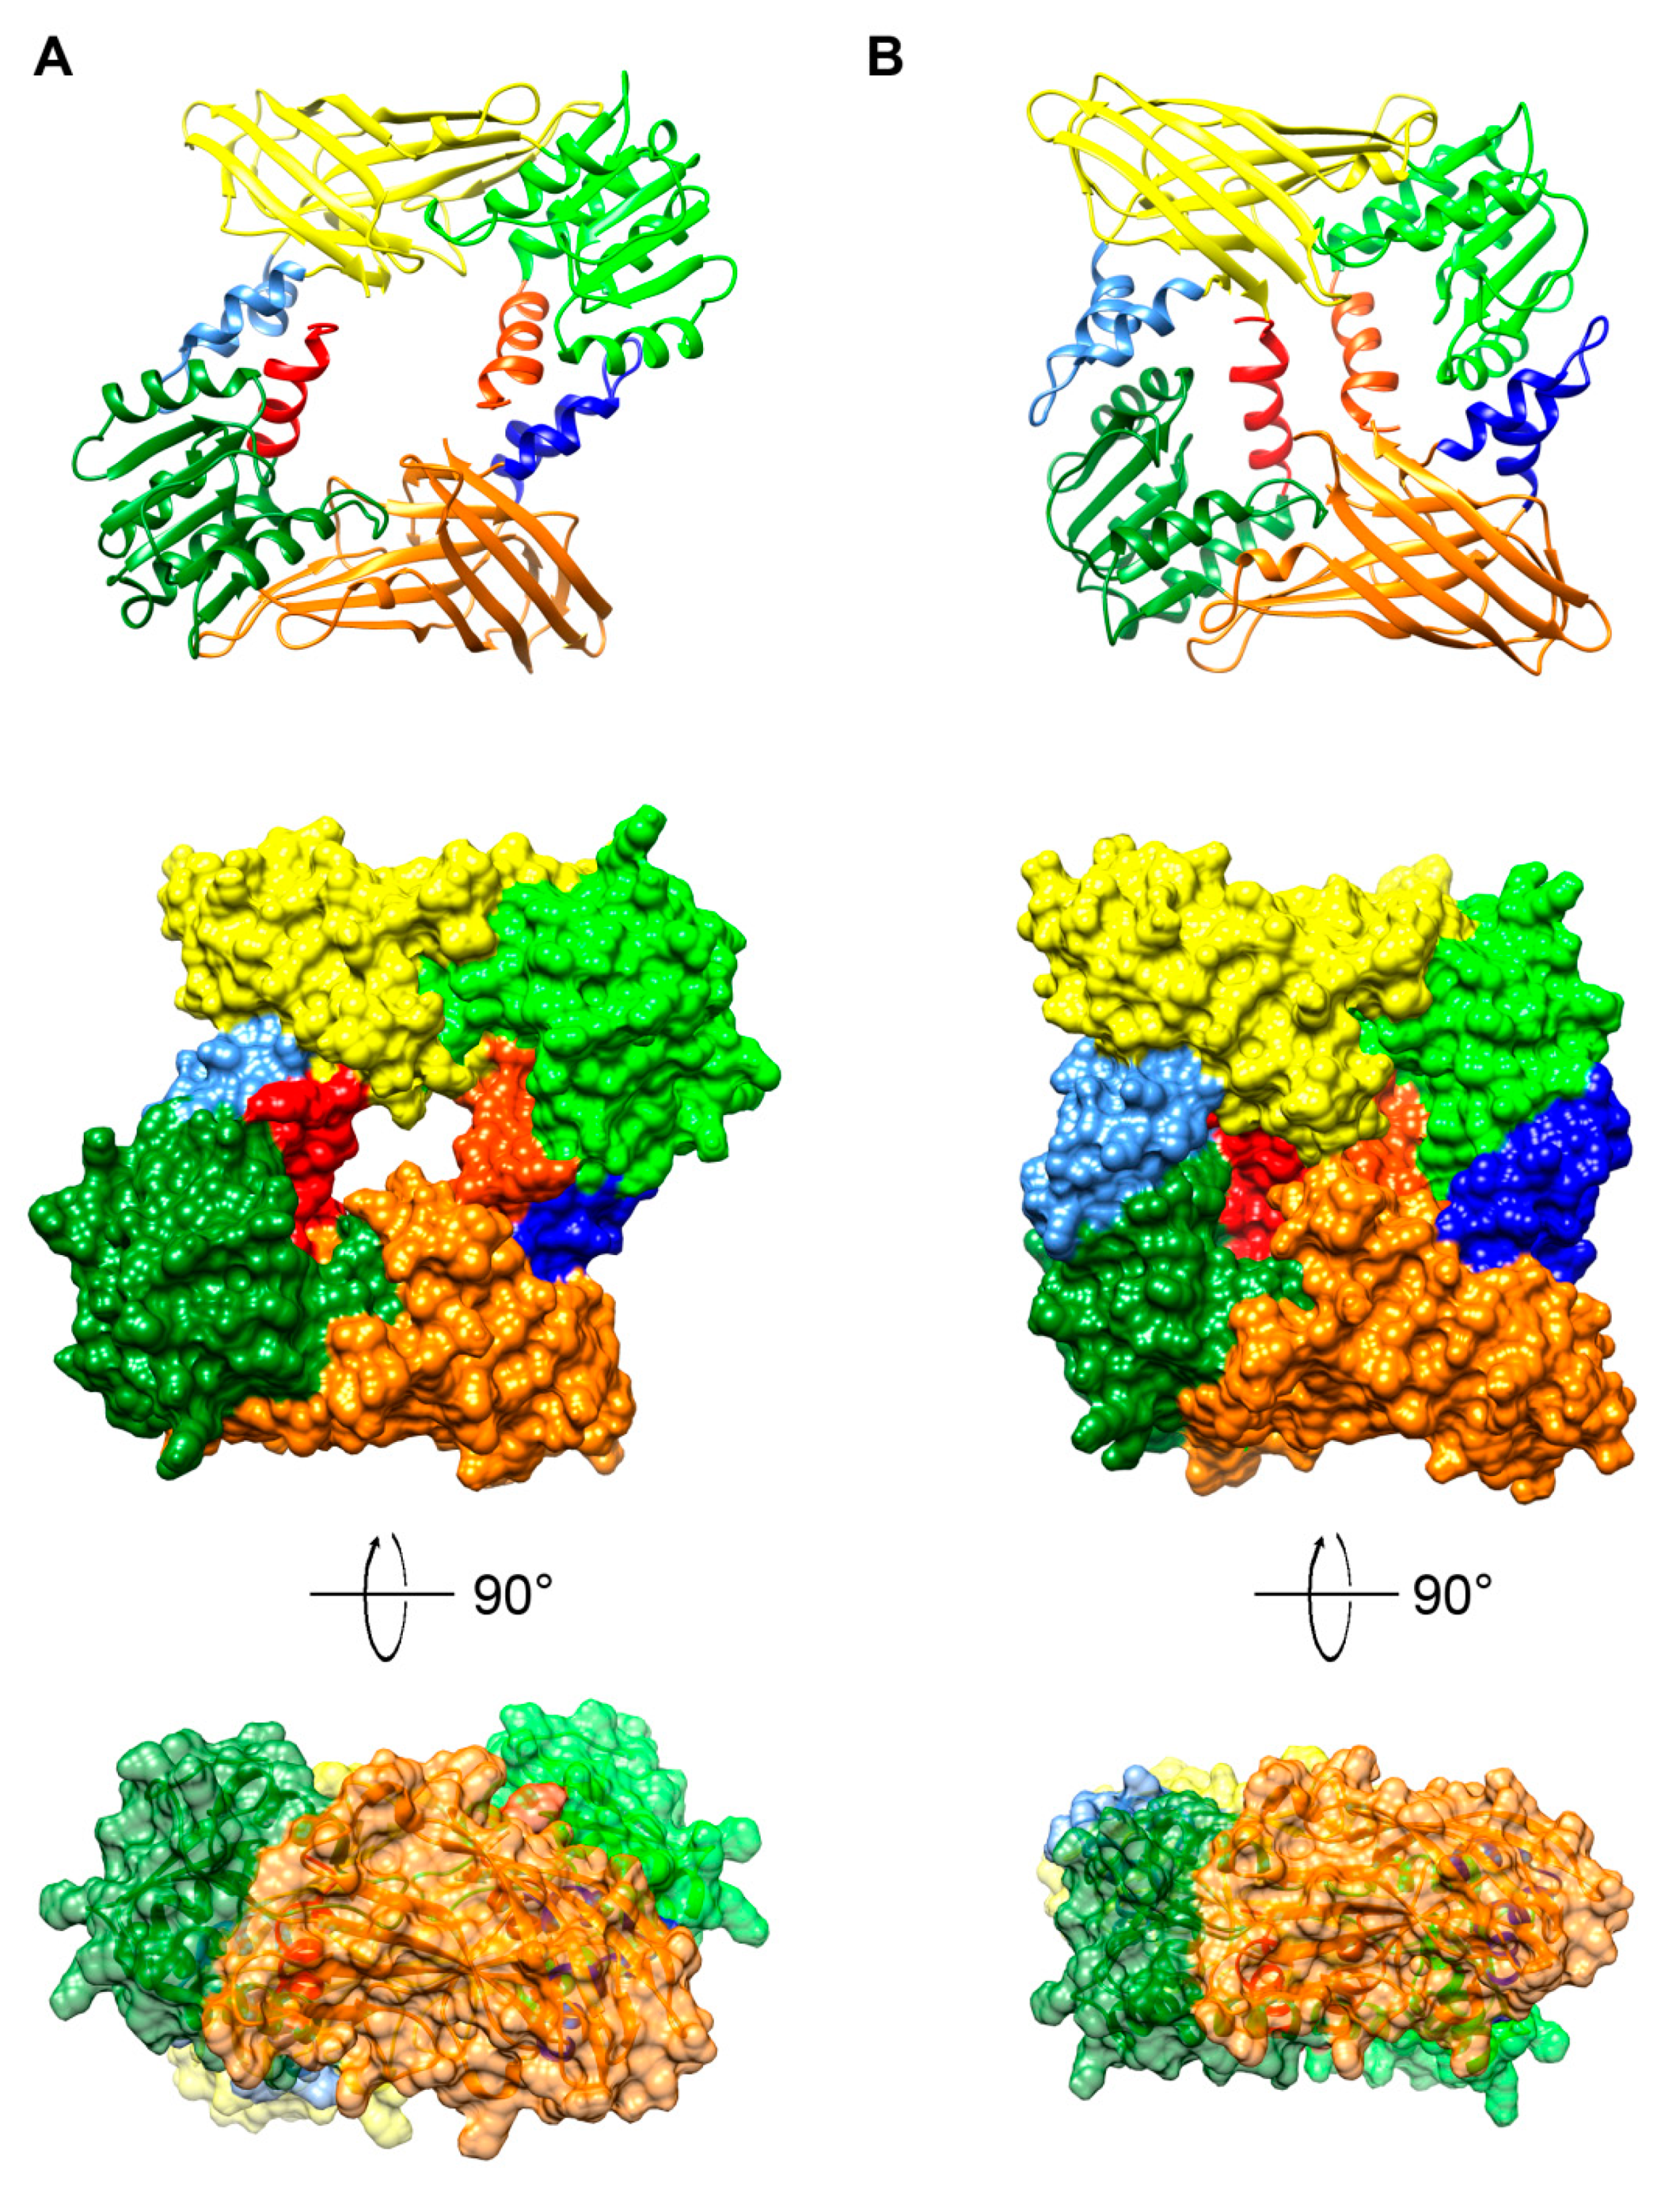
2.6. Predicted 3D Structural Model of P. lividus PRMT1

Recently, several lines of evidence [22,76,77,78] suggested that α- and β-tubulins undergo monomethylation or asymmetrical dimethylation in ω-N manner at specific arginine residues. To define methylation pattern occurring in P. lividus tubulins, sequence and pattern recognition analyses were carried out to map and characterize the amino acid residues putatively methylable and the kind of modification (monomethylarginine, MMA; asymmetric dimethylarginine, ADMA, or symmetric dimethylarginine, SDMA) (Table 5).
Based on the conservation of type-specific methylation consensus, we deduced that also in P. lividus tubulins the major modifications can be represented by MMA and ADMA. Such modifications are catalysed by type I PRMTs and particularly by PRMT1 which is known as the predominant type I PRMT in vertebrates [86] and also during P. lividus embryo development. Therefore, computational analysis tools were herein used to define the 3D structure of the PRMT1 orthologue in P. lividus.
On the basis of the computational analysis, we determined the key features of P. lividus PRMT1 (Figure 8). Results gave an extremely high accuracy model, with 89% of residues modelled at >90% confidence and only the 40 N-terminal residues, expected disordered, were modelled by ab initio calculations, therefore they are not shown in structure Figure 8 and Figure 9. The results highlight the typical two-domain structure—a SAM binding domain and a barrel-like domain—with the active site pocket located between the two domains.
P. lividus PRMT1 structure was compared to the known rat structure [85]. There are few structural changes among the protein structures, consisting of a slight difference in the orientation of the loop in the dimerization arm and a loop between β14 and β15 (Figure 8).
To recreate the structure of a functional enzyme, a P. lividus PRMT1 dimer was computed by molecular docking avoiding use of the unstructured N-terminal region which could impair the reliability of the model (Figure 9).
The resulting models using the balanced coefficients were compared to the available dimer structure already reported [85]. Interestingly, even if a model recapitulates the already published dimer structure of rat PRMT1 [85], other significant structures were also retrieved. We report in Figure 9 the best ranked model which appears more compact and with additional contacts between monomers, resulting in a loss of the cavity in the ring-like structure (Figure 9B).

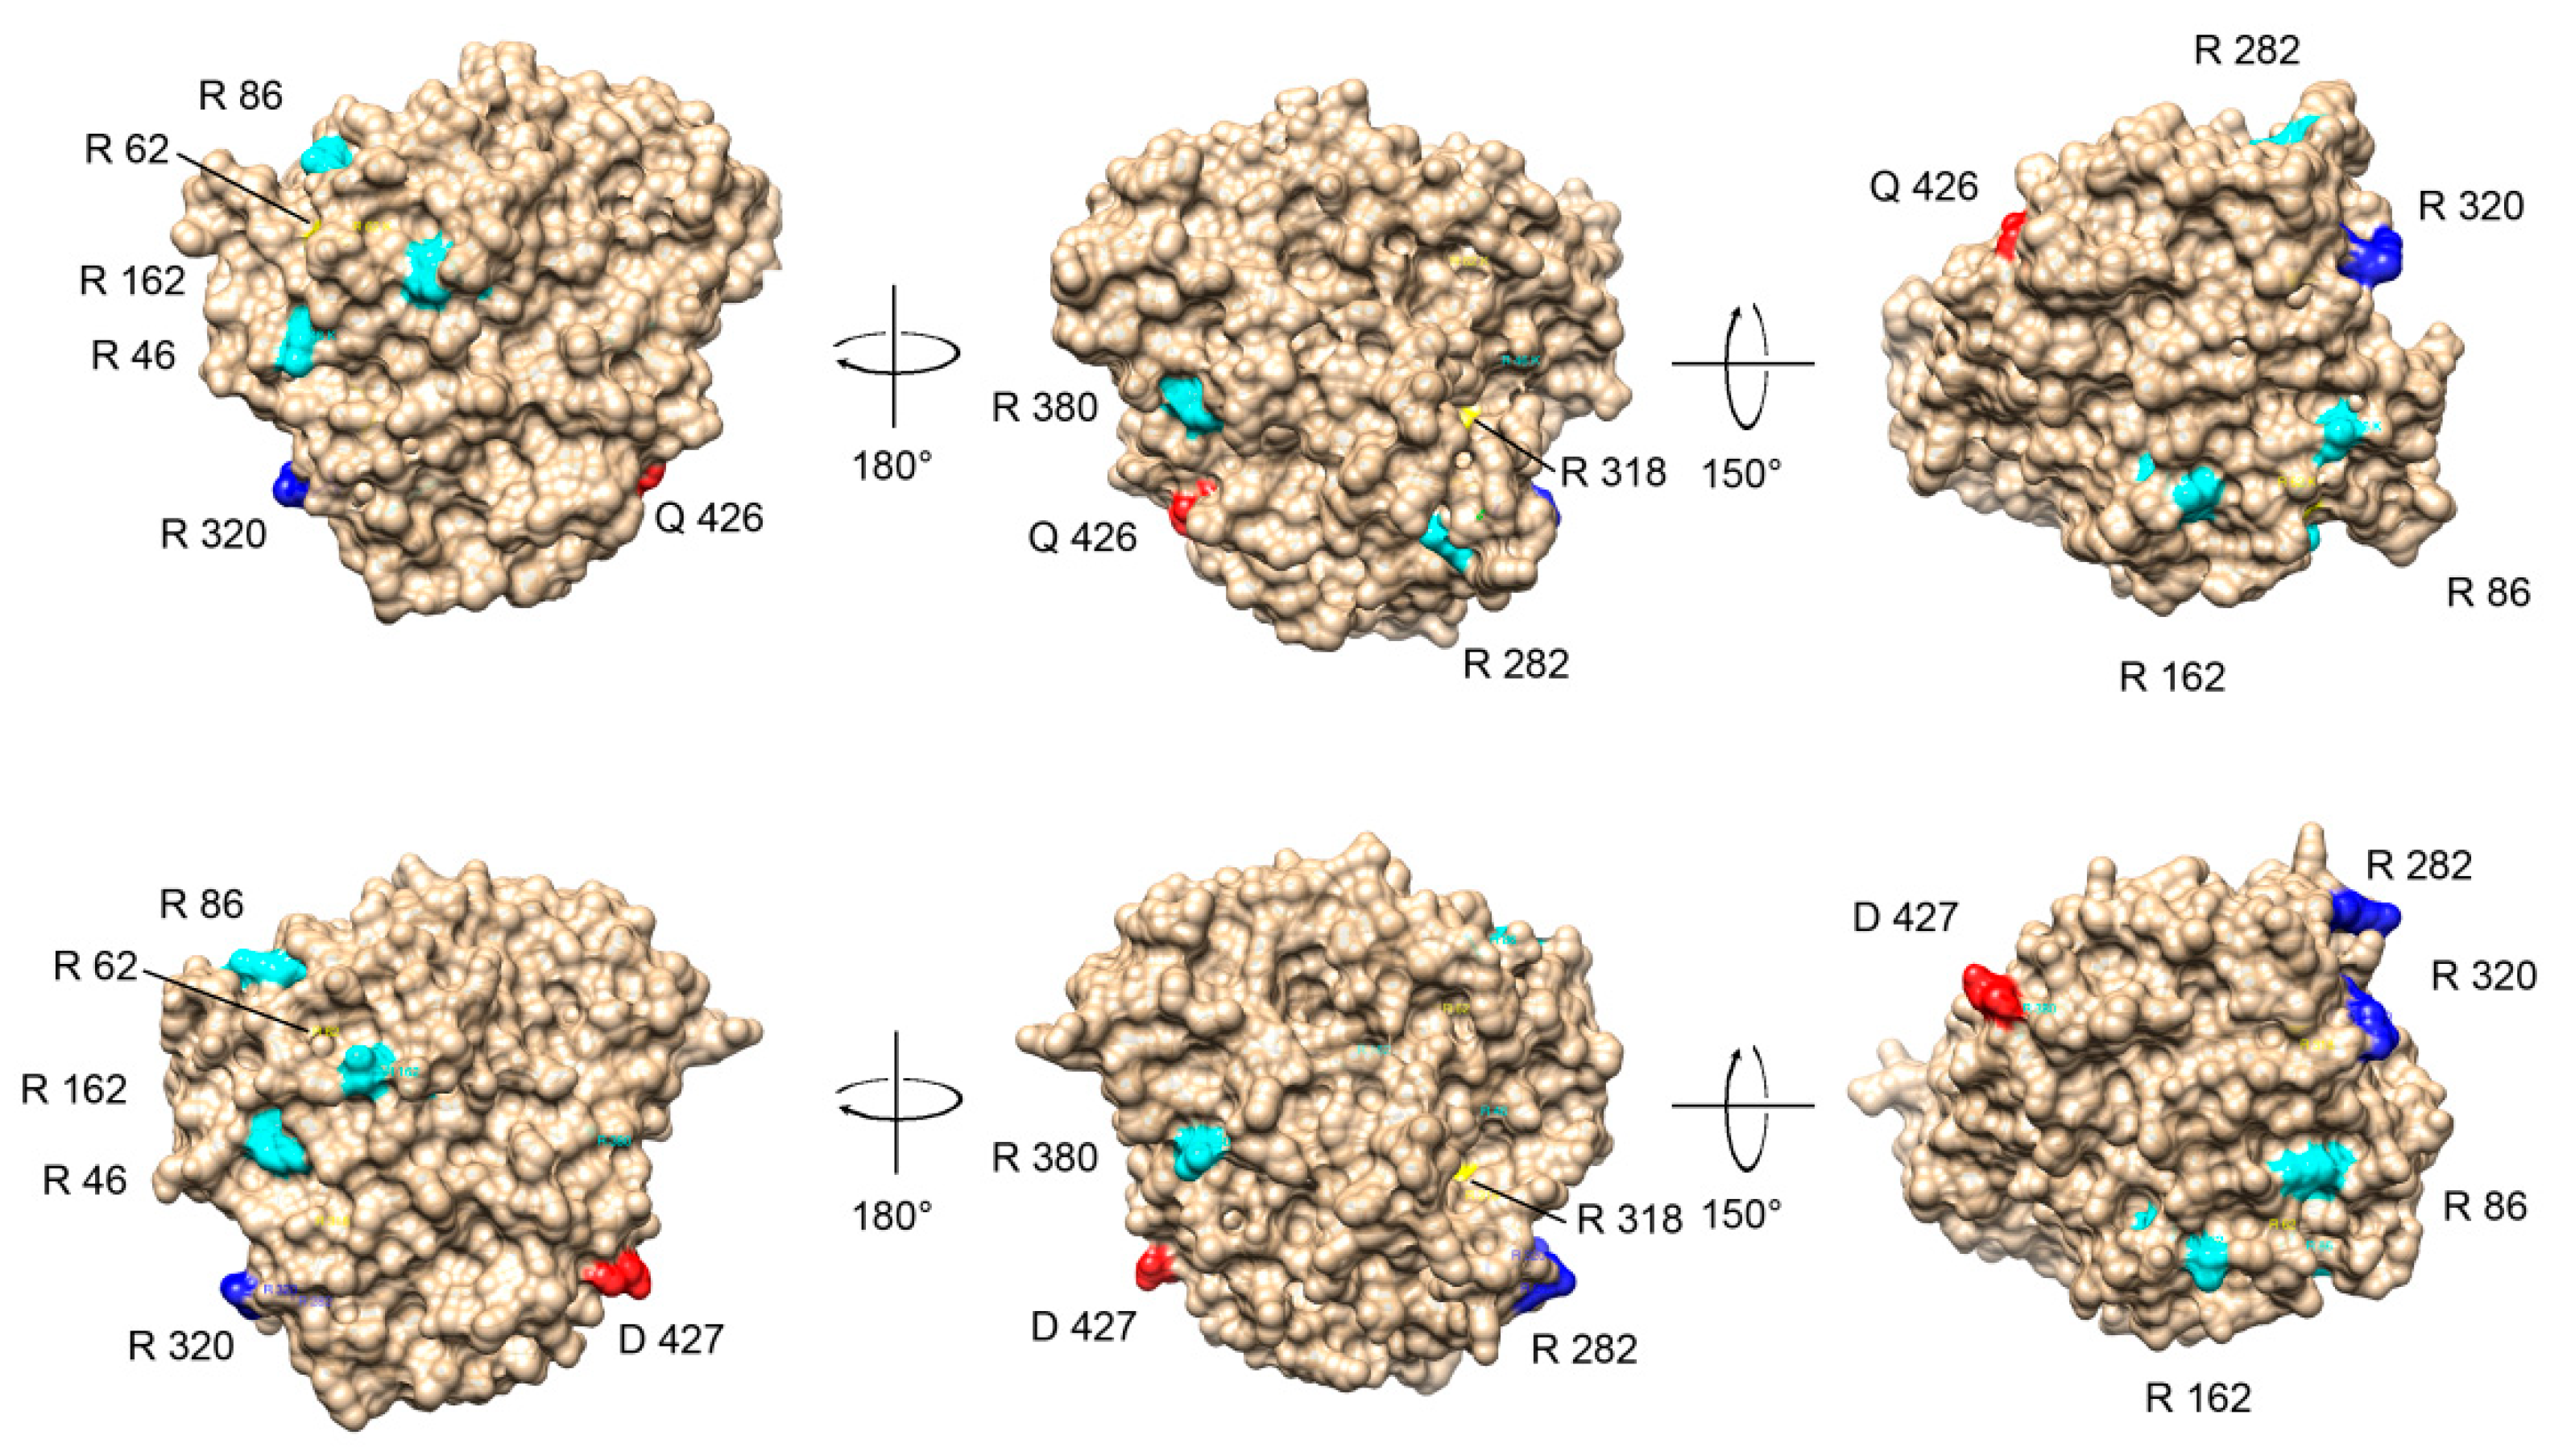
2.7. Tubulin Arginine Methylation

Methylation on R339 of some α-tubulin isotypes and R46, R62, R86, R162, R282, R318, R320 and R380 of some β-tubulin isotypes were recently shown by proteomics study of protein methylation (for details see Table 4) [22,76,77,78]. To provide a comprehensive survey of computed methylable aminoacid residues also in the light of physical constraints, we superpose the P. lividus tubulin 3D structures with human orthologues. As expected, structures appear extremely conserved, maintaining secondary and tertiary structure features with RMSD values <1Å. The predicted methylable arginine residues in P. lividus structures were characterized in terms of evolutionary maintenance and solvent accessibility to provide functional sites for enzymatic modifications. A representative comparison is shown in Figure 10 where methylable ariginine residues are coloured according to their RSA in P. lividus Btub3 and human Tubb3.
According to evolutionary maintenance of selected residues, methylation consensus in primary sequence, organization of secondary structural elements and 3D conformation, arginine residues were similarly computed among the two orthologues, showing a huge conservation in terms of RSA profiles. Therefore, it is reasonable to suppose that MMA and ADMA modifications occurs on sea urchin tubulins in a manner that resembles vertebrate mechanisms. Interestingly, it should be noted that also buried residues which are known to be modified in humans (R62 and R318) are analogously located in sea urchin isotypes, suggesting that changes (including structural modifications after PRMT docking) are likely required for enzyme activity.

3. Materials and Methods

3.1. Data Mining

The characterized P. lividus α- and β-tubulin sequences were used initially to retrieve their corresponding sequences from the publicly available EST database at the National Centre for Biotechnology Information (NCBI). To rescue the expressed isoforms, these sequences were used as queries to perform extensive nucleotide BLAST (BLASTN) and protein-nucleotide BLAST (TBLASTN) searches. The P. lividus expressed PRMTs were analogously collected using human PRMT sequences as queries.

3.2. Embryo Cultures

Gametes were collected from gonads of the sea urchin P. lividus collected in the South-West coast of Sicily, nearby Capo Granitola. Eggs were fertilized at a concentration of 5000/mL and the embryos were grown under gentle rotation at 18 °C in Millipore filtered seawater (MFSW). Developmental stages were monitored by optical microscopy.

3.3. RNA Purification, Reverse Transcription and DNA Extraction

Total RNA was extracted from unfertilized eggs and from embryos at 10 (early blastula), 16 (late blastula) and 36 h (prism stage) of development in MFSW using the RNeasy Mini Kit (Qiagen, Hilden, Germany) following the manufacturer’s instructions and performing DNase treatment. RNA concentrations were fluorometrically verified on Qubit 2.0 Fluorometer, while RNA integrity was checked using a 1.5% agarose gel. RNA was stored at −80 °C for future use. An amount of total RNA corresponding to 2 μg was treated with DNAseI, Amplification Grade (Sigma-Aldrich) to remove any residual genomic DNA contamination, and DNAseI was inactivated by adding 50 mM EDTA. First strand cDNA was synthesized from 1 μg DNAseI-treated total RNA samples using SuperScript VILO cDNA Synthesis Kit (Invitrogen), following the manufacturer’s instructions. The cDNA mixture was diluted 1:20 prior to use in Real Time qPCR experiments.
Genomic DNA was extracted from sperm cells from a single animal using the GenElute Blood Genomic DNA Kit (Sigma-Aldrich, St. Louis, MO, USA) and further genomic DNA purification steps were performed according to the manufacturer’s instructions. DNA concentrations and quality were verified by spectrophotometry (OD at 260 nm), whereas the integrity was checked using a 0.8% agarose gel. The DNA was stored at +4 °C for future use.

3.4. cDNA Identification

Based on the partial P. lividus PRMT, α- and β-tubulin sequences, the 5′- and 3′-end were obtained by PCR-RACE using the 5′/3′ RACE Kit, 2nd Generation application kit (Roche) and the primers (Table 6) as described in the user manual.
The full-length cDNA, consisting of sequences from original ESTs and additional elements from RACE products, were cloned into the pGEM-T Easy vector (Promega, USA) and transformed into XL1- Blue Escherichia coli cells (Stratagene, San Diego, CA, USA). Plasmid DNAs were purified on Illustra™ plasmidPrep Mini SpinKit (GE Healthcare Life Sciences, Chicago, IL, USA) and sequenced using T7 and SP6 primers.

3.5. RS-PCR and α- and β-Tubulin Gene Organization

Based on the α- and β-tubulin 5′ and 3′ UTR sequences, the primer sets reported in Table 7 were used to isolate the genomic DNA sequences and define the gene structures. Tuba3 gene amplicons were obtained amplifying two fragments (Up and Down).
Moreover, the Restriction-site PCR [90] was carried out to isolate genomic elements adjacent to previously cloned sequences (primer sets are listed in Table 8).
Amplified genomic fragments were cloned in pGEM-T Easy plasmid vector and tubulin clones were fully sequenced by primer walking. Sequences were assembled with Codon Code aligner and were annotated using ab initio or with similarity gene prediction programs (i.e., FGENESH using S. purpuratus specific gene-finding parameters [91]) and then manually curated.

3.6. RT-qPCR

Real-time PCRs were performed in 96 well plates in a 20 μL mixture containing 1 μL of a 1:20 dilution of the cDNA preparations, in the BIO-RAD CFX96 system using the following PCR parameters: 95 °C for 5 min, followed by 40 cycles of 95 °C for 10 s, 60 °C for 30 s. The sequences of the specific primer pairs used for qPCR are shown in Table 9. Samples were run in triplicate, with positive controls (100 pg plasmid clone DNA) and negative controls (no cDNA). The absence of nonspecific products was confirmed by both the analysis of the melt curves and electrophoresis in 2 % agarose gels. To obtain sample quantification, the E−ΔΔCt method was used, and the relative changes in gene expression were analysed as described in the CFX Manager software manual. 18S rRNA was used as internal reference, in order to compensate for variations in input RNA amounts.

3.7. Sequence and Structural Analyses

Functional sites and domains in the predicted amino acid sequences were predicted using the InterProScan software [92].
MSA were constructed using T-Coffee (Tree-based Consistency Objective Function For alignment Evaluation) [93]. Phylogenetic and molecular evolutionary analyses were conducted using a Neighbour Joining (NJ) method, implemented in MEGA version X [94] in which Poisson correction, pairwise deletion and bootstrapping (1000 replicates) were considered as parameters, to define the diversification of different protein families herein analysed. Moreover, the 3D structures were reconstructed by homology modelling via the Protein Homology/analogY Recognition Engine 2.0 (Phyre 2) software [87] using the intensive modelling model. Candidate structures for homology modelling were selected according to pairwise alignment. At least two different structures were used as a template for each generated structure as reported elsewhere [82,95,96,97] and extremely high accurate homology models were built for all the sets of proteins. Secondary structure assignments and relative solvent accessibility (RSA) were calculated by the DSSP program as implemented in ENDscript [98]. Additionally, the evolutionary variability of amino acids onto the reconstructed structures were rendered using the UCSF Chimera package [88].
The Multimer Mode Docking option of ClusPro tool [89] was used to compute the dimer structure of P. lividus PRMT1, with the number of subunits set to 2 and selecting the option “Remove Unstructured Terminal Residues”.

4. Conclusions

In the present work we provide a comprehensive analysis of the expressed α- and β-tubulin gene families in the P. lividus model system. Tubulins are recognized targets for antiproliferative drugs used as chemotherapeutic agents. To date, several lines of evidence suggest their use for drug assessing and toxicity evaluation. Moreover, effectiveness of MT binding compounds has been shown to rely often on different PTM degree on tubulins, thus providing different or controversial issues. Among PTMs, methylation carried out by PRMTs were recently associated to drug resistance mechanisms. In particular, some α- and β-tubulin mutations that impair taxanes and epothilones binding to tubulin include arginine residues that undergo methylation (β282Arg→Gln) [99]. Moreover, PRMTs are known to be expressed with different subcellular locations in different cancer types and on the other hand, it has been reported that methylation of R282 reduces Taxol binding [22]. Therefore, it has been suggested [23] to use PRMT inhibitors in combination with classic chemotherapy drugs to overcame Taxol resistance. In cancer- targeted therapies, cell division could be inhibited impeding arginine methylation of tubulins, providing full access to Taxol. Alternatively, drug development may also require the production of Taxol derivatives that bind also to methylated tubulin.
Herein, we show that the tubulin and PRMT system in P. lividus extremely resembles the mammal counterpart, in terms of sequences, phylogeny and structures. Additionally, chemical-physical constraints on modifiable arginine residues resulted conserved among the systems.
P. lividus embryo is a widely recognized model for several research programs spanning from cell proliferation assays [100] and differentiation patterns to toxicological studies [56,57,61,101,102,103,104,105,106,107,108], and also in poor-resource settings. Moreover, the sea urchin embryo has been also intensively used in order to select antimitotic compounds (and glean insights into the biological mechanism) from libraries of 1,3,4-oxadiazole derivatives [43], combretastatin derivatives [44,45] and analogues [109,110] and also 3-amino-thieno[2,3-b]pyridines [111].
Herein, we provide additional elements to extend the reliability of the sea urchin embryo also to MT targeting drugs that are affected by arginine methylation. Transfer of nucleic acid, proteins and drugs performed by microinjection in egg or in one of the blastomere of the early stage embryos are established procedures [112,113] that can allow the modulation of drug actions and responses in order to comprehend the activity of targeted elements and to choose a specific compound. Therefore, experimental set up based on modulation of selected PRMTs and tubulins expression level (by means of miRNA or mRNA transfer experiments) could result in the identification of arginine methylation non-sensitive MT targeting drugs. Moreover, local injection of drugs and their derivatives in different blastomeres allow the observation of local effects on the mitotic apparatus [42].
Additionally, in times of the complex identification of the proper animal system due to ethical issues, P. lividus embryos solve many problems also in accordance with international and local laws. This offers the opportunity to test novel anti-proliferative drugs in the nearest non-chordate deuterostome relative, thus providing an animal system supporting cancer research programs including those “from the bench to the bedside”.

Supplementary Materials

Supplementary materials can be found at https://www.mdpi.com/1422-0067/20/9/2136/s1.

Author Contributions

Conceptualization, A.N. and M.A.R., S.C., C.C. and F.G.; validation, S.C.; formal analysis, M.A.R.; investigation, M.A.R., A.N. and S.C.; writing—original draft preparation, A.N. and M.A.R.; writing—review and editing, S.C.; visualization, M.A.R.; supervision, C.C. and F.G.; funding acquisition, M.A.R.

Funding

This research was funded by University of Palermo, Progetti di Ateneo - EX-60%, grant number B74G13000040001 to M.A.R.

Acknowledgments

We thank very much all the researchers and students who worked with us and S. Rosalia who supported and provided us strength to close the 30-year tubulin project.

Conflicts of Interest

The authors declare no conflict of interest. The funders had no role in the design of the study; in the collection, analyses, or interpretation of data; in the writing of the manuscript, or in the decision to publish the results.

Abbreviations

ADMAasymmetric dimethylarginine
MAPmicrotubule-associated protein
MMAmonomethylarginine
MSAmultiple sequence alignment
ORFopen reading frame
PRMTprotein arginine methyl transferase
PTMpost-translational modification
SDMAsymmetric dimethylarginine
TSStranscription start site
UTRuntranslated region

References

  1. Nogales, E. Structural insights into microtubule function. Annu. Rev. Biochem. 2000, 69, 277–302. [Google Scholar] [CrossRef] [PubMed]
  2. Downing, K.H.; Nogales, E. Tubulin structure: Insights into microtubule properties and functions. Curr. Opin. Struct. Biol. 1998, 8, 785–791. [Google Scholar] [CrossRef]
  3. Bowne-Anderson, H.; Hibbel, A.; Howard, J. Regulation of Microtubule Growth and Catastrophe: Unifying Theory and Experiment. Trends Cell Biol. 2015, 25, 769–779. [Google Scholar] [CrossRef] [Green Version]
  4. Etienne-Manneville, S. From signaling pathways to microtubule dynamics: The key players. Curr. Opin. Cell Biol. 2010, 22, 104–111. [Google Scholar] [CrossRef] [PubMed]
  5. Rosette, C.; Karin, M. Cytoskeletal control of gene expression: Depolymerization of microtubules activates NF-kappa B. J Cell Biol 1995, 128, 1111–1119. [Google Scholar] [CrossRef]
  6. Cho, S.G.; Sihn, C.-R.; Yoo, S.J.; Cho, K.K.; Lee, H.-G.; Choi, Y.-J.; Kim, S.H. Analysis of gene expression induced by microtubule-disrupting agents in HeLa cells using microarray. Cancer Lett. 2006, 241, 110–117. [Google Scholar] [CrossRef]
  7. Magidson, V.; O’Connell, C.B.; Lončarek, J.; Paul, R.; Mogilner, A.; Khodjakov, A. The spatial arrangement of chromosomes during prometaphase facilitates spindle assembly. Cell 2011, 146, 555–567. [Google Scholar] [CrossRef] [Green Version]
  8. Etemad, B.; Kuijt, T.E.F.; Kops, G.J.P.L. Kinetochore-microtubule attachment is sufficient to satisfy the human spindle assembly checkpoint. Nat Commun. 2015, 6, 8987. [Google Scholar] [CrossRef] [PubMed]
  9. Bakhoum, S.F.; Thompson, S.L.; Manning, A.L.; Compton, D.A. Genome stability is ensured by temporal control of kinetochore-microtubule dynamics. Nat. Cell Biol. 2009, 11, 27–35. [Google Scholar] [CrossRef]
  10. Parker, A.L.; Teo, W.S.; McCarroll, J.A.; Kavallaris, M. An Emerging Role for Tubulin Isotypes in Modulating Cancer Biology and Chemotherapy Resistance. Int. J. Mol. Sci. 2017, 18, 1434. [Google Scholar] [CrossRef]
  11. Jordan, M.A. Mechanism of action of antitumor drugs that interact with microtubules and tubulin. Curr. Med. Chem. Anticancer Agents 2002, 2, 1–17. [Google Scholar] [CrossRef] [PubMed]
  12. Singh, P.; Rathinasamy, K.; Mohan, R.; Panda, D. Microtubule assembly dynamics: An attractive target for anticancer drugs. IUBMB Life 2008, 60, 368–375. [Google Scholar] [CrossRef]
  13. Gan, P.P.; McCarroll, J.A.; Po’uha, S.T.; Kamath, K.; Jordan, M.A.; Kavallaris, M. Microtubule dynamics, mitotic arrest, and apoptosis: Drug-induced differential effects of betaIII-tubulin. Mol. Cancer Ther. 2010, 9, 1339–1348. [Google Scholar] [CrossRef] [PubMed]
  14. Kamath, K.; Wilson, L.; Cabral, F.; Jordan, M.A. BetaIII-tubulin induces paclitaxel resistance in association with reduced effects on microtubule dynamic instability. J. Biol. Chem. 2005, 280, 12902–12907. [Google Scholar] [CrossRef] [PubMed]
  15. Cheung, C.H.A.; Wu, S.-Y.; Lee, T.-R.; Chang, C.-Y.; Wu, J.-S.; Hsieh, H.-P.; Chang, J.-Y. Cancer cells acquire mitotic drug resistance properties through beta I-tubulin mutations and alterations in the expression of beta-tubulin isotypes. PLoS ONE 2010, 5, e12564. [Google Scholar] [CrossRef]
  16. Katsetos, C.D.; Dráber, P. Tubulins as therapeutic targets in cancer: From bench to bedside. Curr. Pharm. Des. 2012, 18, 2778–2792. [Google Scholar] [CrossRef] [PubMed]
  17. Verhey, K.J.; Gaertig, J. The tubulin code. Cell Cycle 2007, 6, 2152–2160. [Google Scholar] [CrossRef] [PubMed]
  18. Janke, C. The tubulin code: Molecular components, readout mechanisms, and functions. J. Cell Biol. 2014, 206, 461–472. [Google Scholar] [CrossRef] [Green Version]
  19. Magiera, M.M.; Janke, C. Post-translational modifications of tubulin. Curr. Biol. 2014, 24, R351–R354. [Google Scholar] [CrossRef] [Green Version]
  20. Gadadhar, S.; Bodakuntla, S.; Natarajan, K.; Janke, C. The tubulin code at a glance. J. Cell Sci. 2017, 130, 1347–1353. [Google Scholar] [CrossRef] [Green Version]
  21. Song, Y.; Brady, S.T. Post-translational modifications of tubulin: Pathways to functional diversity of microtubules. Trends Cell Biol. 2015, 25, 125–136. [Google Scholar] [CrossRef]
  22. Piller, S.; Jwad, N.; Hejazi, L.; Gamsjaeger, R.; Sucher, N. Protein Arginine Methylation of Tubulin Beta Decreases Binding of Taxol in Neuro2a Cells. FASEB J. 2015, 29, 717.16. [Google Scholar]
  23. Raposo, A.E.; Piller, S.C. Protein arginine methylation: An emerging regulator of the cell cycle. Cell Div. 2018, 13. [Google Scholar] [CrossRef]
  24. Nielsen, M.G.; Gadagkar, S.R.; Gutzwiller, L. Tubulin evolution in insects: Gene duplication and subfunctionalization provide specialized isoforms in a functionally constrained gene family. BMC Evol. Biol. 2010, 10, 113. [Google Scholar] [CrossRef] [PubMed]
  25. Ludueña, R.F. Are tubulin isotypes functionally significant. Mol. Biol. Cell 1993, 4, 445–457. [Google Scholar]
  26. Verdier-Pinard, P.; Pasquier, E.; Xiao, H.; Burd, B.; Villard, C.; Lafitte, D.; Miller, L.M.; Angeletti, R.H.; Horwitz, S.B.; Braguer, D. Tubulin proteomics: Towards breaking the code. Anal. Biochem. 2009, 384, 197–206. [Google Scholar] [CrossRef] [PubMed] [Green Version]
  27. Morris, R.L.; Hoffman, M.P.; Obar, R.A.; McCafferty, S.S.; Gibbons, I.R.; Leone, A.D.; Cool, J.; Allgood, E.L.; Musante, A.M.; Judkins, K.M.; et al. Analysis of cytoskeletal and motility proteins in the sea urchin genome assembly. Dev. Biol. 2006, 300, 219–237. [Google Scholar] [CrossRef] [PubMed] [Green Version]
  28. Briggs, E.; Wessel, G.M. In the beginning… Animal fertilization and sea urchin development. Dev. Biol. 2006, 300, 15–26. [Google Scholar] [CrossRef] [PubMed] [Green Version]
  29. Pederson, T. The sea urchin’s siren. Dev. Biol. 2006, 300, 9–14. [Google Scholar] [CrossRef] [PubMed]
  30. Cavalieri, V.; Spinelli, G. Early asymmetric cues triggering the dorsal/ventral gene regulatory network of the sea urchin embryo. Elife 2014, 3, e04664. [Google Scholar] [CrossRef]
  31. Molina, M.D.; Quirin, M.; Haillot, E.; Jimenez, F.; Chessel, A.; Lepage, T. p38 MAPK as an essential regulator of dorsal-ventral axis specification and skeletogenesis during sea urchin development: A re-evaluation. Development 2017, 144, 2270–2281. [Google Scholar] [CrossRef]
  32. Howard-Ashby, M.; Materna, S.C.; Brown, C.T.; Tu, Q.; Oliveri, P.; Cameron, R.A.; Davidson, E.H. High regulatory gene use in sea urchin embryogenesis: Implications for bilaterian development and evolution. Dev. Biol. 2006, 300, 27–34. [Google Scholar] [CrossRef] [Green Version]
  33. Britten, R.J.; Davidson, E.H. Gene regulation for higher cells: A theory. Science 1969, 165, 349–357. [Google Scholar] [CrossRef]
  34. Davidson, E.H. The Sea Urchin Genome: Where Will It Lead Us? Science 2006, 314, 939–940. [Google Scholar] [CrossRef] [Green Version]
  35. Chiarelli, R.; Martino, C.; Agnello, M.; Bosco, L.; Roccheri, M.C. Autophagy as a defense strategy against stress: Focus on Paracentrotus lividus sea urchin embryos exposed to cadmium. Cell Stress Chaperones 2016, 21, 19–27. [Google Scholar] [CrossRef]
  36. Pinsino, A.; Matranga, V. Sea urchin immune cells as sentinels of environmental stress. Dev. Comp. Immunol. 2015, 49, 198–205. [Google Scholar] [CrossRef]
  37. Boveri, T. Zur frage der entstehung maligner tumoren (Jena: Gustav Fischer) (English translation); Boveri, M., Translator; Williams and Wilkins: Baltimore, MD, USA, 1929. [Google Scholar]
  38. Knudson, A.G. Of sea urchins and worms: Development and cancer. Cell Death Differ. 2004, 11, 11–12. [Google Scholar] [CrossRef]
  39. Hultin, T. The effect of puromycin on proteinmetabolism and cell division in fertilized sea ur-chin eggs. Experientia 1961, 17, 410–411. [Google Scholar] [CrossRef]
  40. Evans, T.; Rosenthal, E.T.; Youngblom, J.; Distel, D.; Hunt, T. Cyclin: A protein specified by maternal mRNA in sea urchin eggs that is destroyed at each cleavage division. Cell 1983, 33, 389–396. [Google Scholar] [CrossRef]
  41. Semenova, M.N.; Kiselyov, A.; Semenov, V.V. Sea urchin embryo as a model organism for the rapid functional screening of tubulin modulators. BioTechniques 2006, 40, 765–774. [Google Scholar] [CrossRef] [Green Version]
  42. Hamaguchi, Y. Displacement of cleavage plane in the sea urchin egg by locally applied taxol. Cell Motil. Cytoskelet. 1998, 40, 211–219. [Google Scholar] [CrossRef]
  43. Kiselyov, A.S.; Semenova, M.N.; Chernyshova, N.B.; Leitao, A.; Samet, A.V.; Kislyi, K.A.; Raihstat, M.M.; Oprea, T.; Lemcke, H.; Lantow, M.; et al. Novel derivatives of 1,3,4-oxadiazoles are potent mitostatic agents featuring strong microtubule depolymerizing activity in the sea urchin embryo and cell culture assays. Eur. J. Med. Chem. 2010, 45, 1683–1697. [Google Scholar] [CrossRef]
  44. Demchuk, D.V.; Samet, A.V.; Chernysheva, N.B.; Ushkarov, V.I.; Stashina, G.A.; Konyushkin, L.D.; Raihstat, M.M.; Firgang, S.I.; Philchenkov, A.A.; Zavelevich, M.P.; et al. Synthesis and antiproliferative activity of conformationally restricted 1,2,3-triazole analogues of combretastatins in the sea urchin embryo model and against human cancer cell lines. Bioorg. Med. Chem. 2014, 22, 738–755. [Google Scholar] [CrossRef]
  45. Strobykina, I.Y.; Belenok, M.G.; Semenova, M.N.; Semenov, V.V.; Babaev, V.M.; Rizvanov, I.K.; Mironov, V.F.; Kataev, V.E. Triphenylphosphonium Cations of the Diterpenoid Isosteviol: Synthesis and Antimitotic Activity in a Sea Urchin Embryo Model. J. Nat. Prod. 2015, 78, 1300–1308. [Google Scholar] [CrossRef]
  46. Di Bernardo, M.G.; Gianguzza, F.; Ciaccio, M.; Palla, F.; Colombo, P.; Di Blasi, F.; Fais, M.; Spinelli, G. Nucleotide sequence of a full length cDNA clone encoding for beta-tubulin of the sea urchin Paracentrotus lividus. Nucleic Acids Res. 1989, 17, 5851. [Google Scholar] [CrossRef]
  47. Gianguzza, F.; Di Bernardo, M.G.; Sollazzo, M.; Palla, F.; Ciaccio, M.; Carra, E.; Spinelli, G. DNA sequence and pattern of expression of the sea urchin (Paracentrotus lividus) alpha-tubulin genes. Mol. Reprod. Dev. 1989, 1, 170–181. [Google Scholar] [CrossRef]
  48. Gianguzza, F.; Di Bernardo, M.G.; Fais, M.; Palla, F.; Casano, C.; Russo, R.; Spinelli, G. Sequence and expression of Paracentrotus lividus alpha tubulin gene. Nucleic Acids Res. 1990, 18, 4915. [Google Scholar] [CrossRef]
  49. Gianguzza, F.; Casano, C.; Ragusa, M. Alpha-tubulin marker gene of neural territory of sea urchin embryos detected by whole-mount in situ hybridization. Int. J. Dev. Biol. 1995, 39, 477–483. [Google Scholar]
  50. Casano, C.; Ragusa, M.; Cutrera, M.; Costa, S.; Gianguzza, F. Spatial expression of alpha and beta tubulin genes in the late embryogenesis of the sea urchin Paracentrotus lividus. Int. J. Dev. Biol. 1996, 40, 1033–1041. [Google Scholar]
  51. Costa, S.; Ragusa, M.A.; Drago, G.; Casano, C.; Alaimo, G.; Guida, N.; Gianguzza, F. Sea urchin neural alpha2 tubulin gene: Isolation and promoter analysis. Biochem. Biophys. Res. Commun. 2004, 316, 446–453. [Google Scholar] [CrossRef]
  52. Emanuele, M.; Costa, S.; Ragusa, M.A.; Gianguzza, F. Chromatin dynamics of the developmentally regulated P. lividus neural alpha tubulin gene. Int. J. Dev. Biol. 2011, 55, 591–596. [Google Scholar] [CrossRef]
  53. Ragusa, M.A.; Longo, V.; Emanuele, M.; Costa, S.; Gianguzza, F. In silico characterization of the neural alpha tubulin gene promoter of the sea urchin embryo Paracentrotus lividus by phylogenetic footprinting. Mol. Biol. Rep. 2012, 39, 2633–2644. [Google Scholar] [CrossRef]
  54. Costa, S.; Nicosia, A.; Cuttitta, A.; Gianguzza, F.; Ragusa, M.A. An Intronic cis-Regulatory Element Is Crucial for the Alpha Tubulin Pl-Tuba1a Gene Activation in the Ciliary Band and Animal Pole Neurogenic Domains during Sea Urchin Development. PLoS ONE 2017, 12, e0170969. [Google Scholar] [CrossRef]
  55. Gildor, T.; Malik, A.; Sher, N.; Avraham, L.; Ben-Tabou de-Leon, S. Quantitative developmental transcriptomes of the Mediterranean sea urchin Paracentrotus lividus. Mar. Genom. 2016, 25, 89–94. [Google Scholar] [CrossRef]
  56. Di Natale, M.; Bennici, C.; Biondo, G.; Masullo, T.; Monastero, C.; Tagliavia, M.; Torri, M.; Costa, S.; Ragusa, M.A.; Cuttitta, A.; et al. Aberrant gene expression profiles in Mediterranean sea urchin reproductive tissues after metal exposures. Chemosphere 2019, 216, 48–58. [Google Scholar] [CrossRef]
  57. Ragusa, M.A.; Costa, S.; Gianguzza, M.; Roccheri, M.C.; Gianguzza, F. Effects of cadmium exposure on sea urchin development assessed by SSH and RT-qPCR: Metallothionein genes and their differential induction. Mol. Biol. Rep. 2013, 40, 2157–2167. [Google Scholar] [CrossRef]
  58. Ragusa, M.A.; Nicosia, A.; Costa, S.; Cuttitta, A.; Gianguzza, F. Metallothionein Gene Family in the Sea Urchin Paracentrotus lividus: Gene Structure, Differential Expression and Phylogenetic Analysis. Int. J. Mol. Sci. 2017, 18, 812. [Google Scholar] [CrossRef]
  59. Fry, A.M.; O’Regan, L.; Montgomery, J.; Adib, R.; Bayliss, R. EML proteins in microtubule regulation and human disease. Biochem. Soc. Trans. 2016, 44, 1281–1288. [Google Scholar] [CrossRef] [Green Version]
  60. Fourest-Lieuvin, A.; Peris, L.; Gache, V.; Garcia-Saez, I.; Juillan-Binard, C.; Lantez, V.; Job, D. Microtubule Regulation in Mitosis: Tubulin Phosphorylation by the Cyclin-dependent Kinase Cdk1. Mol. Biol. Cell 2006, 17, 1041–1050. [Google Scholar] [CrossRef] [Green Version]
  61. Gambardella, C.; Morgana, S.; Bari, G.D.; Ramoino, P.; Bramini, M.; Diaspro, A.; Falugi, C.; Faimali, M. Multidisciplinary screening of toxicity induced by silica nanoparticles during sea urchin development. Chemosphere 2015, 139, 486–495. [Google Scholar] [CrossRef]
  62. Stephens, R.E. Tubulin in sea urchin embryonic cilia: Post-translational modifications during regeneration. J. Cell Sci. 1992, 101 Pt 4, 837–845. [Google Scholar]
  63. Portran, D.; Schaedel, L.; Xu, Z.; Théry, M.; Nachury, M.V. Tubulin acetylation protects long-lived microtubules against mechanical ageing. Nat. Cell Biol. 2017, 19, 391–398. [Google Scholar] [CrossRef] [Green Version]
  64. Xu, Z.; Schaedel, L.; Portran, D.; Aguilar, A.; Gaillard, J.; Marinkovich, M.P.; Théry, M.; Nachury, M.V. Microtubules acquire resistance from mechanical breakage through intralumenal acetylation. Science 2017, 356, 328–332. [Google Scholar] [CrossRef]
  65. Barisic, M.; Silva e Sousa, R.; Tripathy, S.K.; Magiera, M.M.; Zaytsev, A.V.; Pereira, A.L.; Janke, C.; Grishchuk, E.L.; Maiato, H. Microtubule detyrosination guides chromosomes during mitosis. Science 2015, 348, 799–803. [Google Scholar] [CrossRef] [Green Version]
  66. Sirajuddin, M.; Rice, L.M.; Vale, R.D. Regulation of microtubule motors by tubulin isotypes and post-translational modifications. Nat. Cell Biol. 2014, 16, 335–344. [Google Scholar] [CrossRef] [Green Version]
  67. Cleveland, D.W. Autoregulated control of tubilin synthesis in animal cells. Curr. Opin. Cell Biol. 1989, 1, 10–14. [Google Scholar] [CrossRef]
  68. Eddé, B.; Rossier, J.; Le Caer, J.P.; Desbruyères, E.; Gros, F.; Denoulet, P. Posttranslational glutamylation of alpha-tubulin. Science 1990, 247, 83–85. [Google Scholar] [CrossRef]
  69. Redeker, V.; Levilliers, N.; Schmitter, J.M.; Le Caer, J.P.; Rossier, J.; Adoutte, A.; Bré, M.H. Polyglycylation of tubulin: A posttranslational modification in axonemal microtubules. Science 1994, 266, 1688–1691. [Google Scholar] [CrossRef]
  70. Mary, J.; Redeker, V.; Le Caer, J.P.; Rossier, J.; Schmitter, J.M. Posttranslational modifications in the C-terminal tail of axonemal tubulin from sea urchin sperm. J. Biol. Chem. 1996, 271, 9928–9933. [Google Scholar] [CrossRef] [PubMed]
  71. Gagnon, C.; White, D.; Cosson, J.; Huitorel, P.; Eddé, B.; Desbruyères, E.; Paturle-Lafanechère, L.; Multigner, L.; Job, D.; Cibert, C. The polyglutamylated lateral chain of alpha-tubulin plays a key role in flagellar motility. J. Cell Sci. 1996, 109, 1545–1553. [Google Scholar] [PubMed]
  72. Huitorel, P.; White, D.; Fouquet, J.-P.; Kann, M.-L.; Cosson, J.; Gagnon, C. Differential distribution of glutamylated tubulin isoforms along the sea urchin sperm axoneme. Mol. Reprod. Dev. 2002, 62, 139–148. [Google Scholar] [CrossRef] [PubMed]
  73. Kann, M.-L.; Soues, S.; Levilliers, N.; Fouquet, J.-P. Glutamylated tubulin: Diversity of expression and distribution of isoforms. Cell Motil. Cytoskelet. 2003, 55, 14–25. [Google Scholar] [CrossRef] [PubMed]
  74. Löwe, J.; Li, H.; Downing, K.H.; Nogales, E. Refined structure of alpha beta-tubulin at 3.5 A resolution. J. Mol. Biol. 2001, 313, 1045–1057. [Google Scholar] [CrossRef] [PubMed]
  75. Park, I.Y.; Chowdhury, P.; Tripathi, D.N.; Powell, R.T.; Dere, R.; Terzo, E.A.; Rathmell, W.K.; Walker, C.L. Methylated α-tubulin antibodies recognize a new microtubule modification on mitotic microtubules. MAbs 2016, 8, 1590–1597. [Google Scholar] [CrossRef] [PubMed] [Green Version]
  76. Pang, C.N.I.; Gasteiger, E.; Wilkins, M.R. Identification of arginine- and lysine-methylation in the proteome of Saccharomyces cerevisiae and its functional implications. BMC Genom. 2010, 11, 92. [Google Scholar] [CrossRef] [PubMed]
  77. Guo, A.; Gu, H.; Zhou, J.; Mulhern, D.; Wang, Y.; Lee, K.A.; Yang, V.; Aguiar, M.; Kornhauser, J.; Jia, X.; et al. Immunoaffinity Enrichment and Mass Spectrometry Analysis of Protein Methylation. Mol. Cell. Proteom. 2014, 13, 372–387. [Google Scholar] [CrossRef] [PubMed]
  78. Plett, K.L.; Raposo, A.E.; Bullivant, S.; Anderson, I.C.; Piller, S.C.; Plett, J.M. Root morphogenic pathways in Eucalyptus grandis are modified by the activity of protein arginine methyltransferases. BMC Plant Biol. 2017, 17, 62. [Google Scholar] [CrossRef]
  79. Alushin, G.M.; Lander, G.C.; Kellogg, E.H.; Zhang, R.; Baker, D.; Nogales, E. High-resolution microtubule structures reveal the structural transitions in αβ-tubulin upon GTP hydrolysis. Cell 2014, 157, 1117–1129. [Google Scholar] [CrossRef]
  80. Chaaban, S.; Brouhard, G.J. A microtubule bestiary: Structural diversity in tubulin polymers. Mol. Biol. Cell 2017, 28, 2924–2931. [Google Scholar] [CrossRef]
  81. Sitbon, E.; Pietrokovski, S. Occurrence of protein structure elements in conserved sequence regions. BMC Struct. Biol. 2007, 7, 3. [Google Scholar] [CrossRef]
  82. Nicosia, A.; Maggio, T.; Costa, S.; Salamone, M.; Tagliavia, M.; Mazzola, S.; Gianguzza, F.; Cuttitta, A. Maintenance of a Protein Structure in the Dynamic Evolution of TIMPs over 600 Million Years. Genome Biol. Evol. 2016, 8, 1056–1071. [Google Scholar] [CrossRef] [Green Version]
  83. Perumal, B.S.; Sakharkar, K.R.; Chow, V.T.K.; Pandjassarame, K.; Sakharkar, M.K. Intron position conservation across eukaryotic lineages in tubulin genes. Front. Biosci. 2005, 10, 2412–2419. [Google Scholar] [CrossRef]
  84. Morales, Y.; Cáceres, T.; May, K.; Hevel, J.M. Biochemistry and regulation of the protein arginine methyltransferases (PRMTs). Arch. Biochem. Biophys. 2016, 590, 138–152. [Google Scholar] [CrossRef] [Green Version]
  85. Zhang, X.; Cheng, X. Structure of the Predominant Protein Arginine Methyltransferase PRMT1 and Analysis of Its Binding to Substrate Peptides. Structure 2003, 11, 509–520. [Google Scholar] [CrossRef] [Green Version]
  86. Tang, J.; Frankel, A.; Cook, R.J.; Kim, S.; Paik, W.K.; Williams, K.R.; Clarke, S.; Herschman, H.R. PRMT1 is the predominant type I protein arginine methyltransferase in mammalian cells. J. Biol. Chem. 2000, 275, 7723–7730. [Google Scholar] [CrossRef]
  87. Kelley, L.A.; Mezulis, S.; Yates, C.M.; Wass, M.N.; Sternberg, M.J.E. The Phyre2 web portal for protein modeling, prediction and analysis. Nat. Protoc. 2015, 10, 845–858. [Google Scholar] [CrossRef]
  88. Pettersen, E.F.; Goddard, T.D.; Huang, C.C.; Couch, G.S.; Greenblatt, D.M.; Meng, E.C.; Ferrin, T.E. UCSF Chimera--a visualization system for exploratory research and analysis. J. Comput. Chem. 2004, 25, 1605–1612. [Google Scholar] [CrossRef]
  89. Kozakov, D.; Hall, D.R.; Xia, B.; Porter, K.A.; Padhorny, D.; Yueh, C.; Beglov, D.; Vajda, S. The ClusPro web server for protein-protein docking. Nat. Protoc. 2017, 12, 255–278. [Google Scholar] [CrossRef]
  90. Sarkar, G.; Turner, R.T.; Bolander, M.E. Restriction-site PCR: A direct method of unknown sequence retrieval adjacent to a known locus by using universal primers. Genome Res. 1993, 2, 318–322. [Google Scholar] [CrossRef]
  91. Solovyev, V.; Kosarev, P.; Seledsov, I.; Vorobyev, D. Automatic annotation of eukaryotic genes, pseudogenes and promoters. Genome Biol. 2006, 7, S10. [Google Scholar] [CrossRef]
  92. Jones, P.; Binns, D.; Chang, H.-Y.; Fraser, M.; Li, W.; McAnulla, C.; McWilliam, H.; Maslen, J.; Mitchell, A.; Nuka, G.; et al. InterProScan 5: Genome-scale protein function classification. Bioinformatics 2014, 30, 1236–1240. [Google Scholar] [CrossRef]
  93. Di Tommaso, P.; Moretti, S.; Xenarios, I.; Orobitg, M.; Montanyola, A.; Chang, J.-M.; Taly, J.-F.; Notredame, C. T-Coffee: A web server for the multiple sequence alignment of protein and RNA sequences using structural information and homology extension. Nucleic Acids Res. 2011, 39, W13–W17. [Google Scholar] [CrossRef]
  94. Kumar, S.; Stecher, G.; Li, M.; Knyaz, C.; Tamura, K. MEGA X: Molecular Evolutionary Genetics Analysis across Computing Platforms. Mol. Biol. Evol. 2018, 35, 1547–1549. [Google Scholar] [CrossRef]
  95. Salamone, M.; Nicosia, A.; Bennici, C.; Quatrini, P.; Catania, V.; Mazzola, S.; Ghersi, G.; Cuttitta, A. Comprehensive analysis of a Vibrio parahaemolyticus strain extracellular serine protease VpSP37. PLoS ONE 2015, 10, e0126349. [Google Scholar] [CrossRef]
  96. Cuttitta, A.; Ragusa, M.A.; Costa, S.; Bennici, C.; Colombo, P.; Mazzola, S.; Gianguzza, F.; Nicosia, A. Evolutionary conserved mechanisms pervade structure and transcriptional modulation of allograft inflammatory factor-1 from sea anemone Anemonia viridis. Fish Shellfish. Immunol. 2017, 67, 86–94. [Google Scholar] [CrossRef]
  97. Nicosia, A.; Bennici, C.; Biondo, G.; Costa, S.; Di Natale, M.; Masullo, T.; Monastero, C.; Ragusa, M.A.; Tagliavia, M.; Cuttitta, A. Characterization of Translationally Controlled Tumour Protein from the Sea Anemone Anemonia viridis and Transcriptome Wide Identification of Cnidarian Homologues. Genes 2018, 9, 30. [Google Scholar] [CrossRef]
  98. Robert, X.; Gouet, P. Deciphering key features in protein structures with the new ENDscript server. Nucleic Acids Res. 2014, 42, W320–W324. [Google Scholar] [CrossRef] [Green Version]
  99. Giannakakou, P.; Gussio, R.; Nogales, E.; Downing, K.H.; Zaharevitz, D.; Bollbuck, B.; Poy, G.; Sackett, D.; Nicolaou, K.C.; Fojo, T. A common pharmacophore for epothilone and taxanes: Molecular basis for drug resistance conferred by tubulin mutations in human cancer cells. Proc. Natl. Acad. Sci. USA 2000, 97, 2904–2909. [Google Scholar] [CrossRef] [Green Version]
  100. Romancino, D.P.; Anello, L.; Lavanco, A.; Buffa, V.; Di Bernardo, M.; Bongiovanni, A. A sea urchin in vivo model to evaluate Epithelial-Mesenchymal Transition. Dev. Growth Differ. 2017, 59, 141–151. [Google Scholar] [CrossRef]
  101. Nasuchon, N.; Hirasaka, K.; Yamaguchi, K.; Okada, J.; Ishimatsu, A. Effects of elevated carbon dioxide on contraction force and proteome composition of sea urchin tube feet. Comp. Biochem. Physiol. Part D Genom. Proteom. 2017, 21, 10–16. [Google Scholar] [CrossRef] [Green Version]
  102. Ragusa, M.A.; Costa, S.; Cuttitta, A.; Gianguzza, F.; Nicosia, A. Coexposure to sulfamethoxazole and cadmium impairs development and attenuates transcriptional response in sea urchin embryo. Chemosphere 2017, 180, 275–284. [Google Scholar] [CrossRef] [Green Version]
  103. Pinsino, A.; Bergami, E.; Della Torre, C.; Vannuccini, M.L.; Addis, P.; Secci, M.; Dawson, K.A.; Matranga, V.; Corsi, I. Amino-modified polystyrene nanoparticles affect signalling pathways of the sea urchin (Paracentrotus lividus) embryos. Nanotoxicology 2017, 11, 201–209. [Google Scholar] [CrossRef]
  104. Martino, C.; Bonaventura, R.; Byrne, M.; Roccheri, M.; Matranga, V. Effects of exposure to gadolinium on the development of geographically and phylogenetically distant sea urchins species. Mar. Environ. Res. 2017, 128, 98–106. [Google Scholar] [CrossRef] [Green Version]
  105. Bonaventura, R.; Russo, R.; Zito, F.; Matranga, V. Combined Effects of Cadmium and UVB Radiation on Sea Urchin Embryos: Skeleton Impairment Parallels p38 MAPK Activation and Stress Genes Overexpression. Chem. Res. Toxicol. 2015, 28, 1060–1069. [Google Scholar] [CrossRef]
  106. Bonaventura, R.; Matranga, V. Overview of the molecular defense systems used by sea urchin embryos to cope with UV radiation. Mar. Environ. Res. 2017, 128, 25–35. [Google Scholar] [CrossRef]
  107. Chiarelli, R.; Agnello, M.; Bosco, L.; Roccheri, M.C. Sea urchin embryos exposed to cadmium as an experimental model for studying the relationship between autophagy and apoptosis. Mar. Environ. Res. 2014, 93, 47–55. [Google Scholar] [CrossRef]
  108. Anello, L.; Cavalieri, V.; Di Bernardo, M. Developmental effects of the protein kinase inhibitor kenpaullone on the sea urchin embryo. Comp. Biochem. Physiol. C Toxicol. Pharmacol. 2018, 204, 36–44. [Google Scholar] [CrossRef]
  109. Semenova, M.N.; Demchuk, D.V.; Tsyganov, D.V.; Chernysheva, N.B.; Samet, A.V.; Silyanova, E.A.; Kislyi, V.P.; Maksimenko, A.S.; Varakutin, A.E.; Konyushkin, L.D.; et al. Sea Urchin Embryo Model As a Reliable in Vivo Phenotypic Screen to Characterize Selective Antimitotic Molecules. Comparative evaluation of Combretapyrazoles, -isoxazoles, -1,2,3-triazoles, and -pyrroles as Tubulin-Binding Agents. ACS Comb. Sci. 2018, 20, 700–721. [Google Scholar] [CrossRef]
  110. Chernysheva, N.B.; Maksimenko, A.S.; Andreyanov, F.A.; Kislyi, V.P.; Strelenko, Y.A.; Khrustalev, V.N.; Semenova, M.N.; Semenov, V.V. Regioselective synthesis of 3,4-diaryl-5-unsubstituted isoxazoles, analogues of natural cytostatic combretastatin A4. Eur. J. Med. Chem. 2018, 146, 511–518. [Google Scholar] [CrossRef]
  111. Eurtivong, C.; Semenov, V.; Semenova, M.; Konyushkin, L.; Atamanenko, O.; Reynisson, J.; Kiselyov, A. 3-Amino-thieno[2,3-b]pyridines as microtubule-destabilising agents: Molecular modelling and biological evaluation in the sea urchin embryo and human cancer cells. Bioorg. Med. Chem. 2017, 25, 658–664. [Google Scholar] [CrossRef]
  112. Oliveri, P.; Davidson, E.H.; McClay, D.R. Activation of pmar1 controls specification of micromeres in the sea urchin embryo. Dev. Biol. 2003, 258, 32–43. [Google Scholar] [CrossRef] [Green Version]
  113. Stepicheva, N.A.; Song, J.L. High Throughput Microinjections of Sea Urchin Zygotes. J. Vis. Exp. 2014. [Google Scholar] [CrossRef]
Figure 1. Multiple sequence alignment (MSA) of the α-tubulins of P. lividus. Alignment was performed with T-coffee and rendered by ESPript 3.0. Similar residues are written in black bold characters and boxed in yellow whereas conserved residues are in white bold characters and boxed in red. The sequence numbering on the top refers to the alignment. Tubulin domains are highlighted by long arrows also on the top. The principals PTMs are indicated on the bottom. Ac: acetylation; Me: methylation; P: phosphorylation; Glu: polyglutamylation and polyglycylation.
Ijms 20 02136 g001
Figure 2. MSA of the β-tubulins of P. lividus. Alignment was performed with T-coffee and rendered by ESPript 3.0. Similar residues are written in black bold characters and boxed in yellow whereas conserved residues are in white bold characters and boxed in red. The sequence numbering on the top refers to the alignment. Tubulin domains are highlighted by long arrows also on the top. The principals PTMs are indicated on the bottom. Me: methylation; P: phosphorylation; Glu: polyglutamylation and polyglycylation.
Ijms 20 02136 g002
Figure 3. α- and β-tubulin gene structure and core promoter analysis. Schematic gene structures of the Paracentrotus lividus α-tubulins (A), β-tubulins (B) and an α-tubulin gene of Eucidaris tribuloides (C), drawn to scale. The bent arrows indicate the putative transcription start sites (TSS). Boxes represent exons. In particular, white boxes indicate untranslated regions and coding regions are coloured. Core promoter elements are shown as indicated.
Ijms 20 02136 g003
Figure 4. P. lividus α- and β-tubulin NJ distance trees. The trees were generated using MEGA X. The bootstrap consensus tree inferred from 1000 replicates is taken to represent the reliability of the branches of the analysed sequences. The percentage of replicate trees in which the associated taxa clustered together in the bootstrap test (1000 replicates) greater than 50% are shown in red next to the branches.
Ijms 20 02136 g004
Figure 5. Schematic representation of the seven P. lividus PRMT isoforms and their domains predicted by InterPro (drawn to scale). SH3: SRC homology 3 domain; Zn finger: Zinc finger C2H2 superfamily; CARM1/PH: Histone-arginine methyltransferase CARM1, N-terminal / PH-like domain superfamily; TIM barrel: PRMT5, TIM barrel domain; R-N-methyltransferase: SAM-dependent methyltransferase PRMT-type domain. The protein regions predicted as disordered are depicted in red.
Ijms 20 02136 g005
Figure 6. Amino acid sequences of P. lividus and Homo sapiens PRMTs were aligned and a distance tree was constructed. The tree was generated using MEGA X. The bootstrap consensus tree inferred from 1000 replicates is taken to represent the reliability of the branches of the analysed sequences. The percentage of replicate trees in which the associated taxa clustered together in the bootstrap test (1000 replicates) greater than 50% are shown in red next to the branches. Pairwise amino acid sequence alignment of human and P. lividus PRMTs are shown in Supplementary Materials Figures S1 and S2.
Ijms 20 02136 g006
Figure 7. MSA of the methyltransferase domains (ProSite ID PS51678) of human and rat PRMT1 and P. lividus PRMT family performed with T-Coffee. Similar residues are written in black bold characters and boxed in yellow whereas conserved residues are in white bold characters and boxed in red. The sequence numbering on the top refers to the rat PRMT1 sequence (Q63009). PRMT1 domains and secondary structures are highlighted on the top; the colour coding is red for the N terminus (residues 41–51), green for the SAM binding domain (residues 52–176), yellow for the β barrel structure (residues 177–187 and 217–352), and blue for the dimerization arm (residues 188–216), as depicted in Zhang and Cheng [85].
Ijms 20 02136 g007
Figure 8. Molecular evolution of sea urchin PRMT1. Top: Superposition of three-dimensional models in ribbon representation of rat PRMT1 (1ORH; showed in pale) and P. lividus PRMT1 showed in light blue. Bottom: same superposition in surface (50% transparency) representation with their structures coloured according to the evolutionary conservation of amino acids. The P. lividus 3D structure was created via the Phyre 2 software [87] and rendered by using Chimera package [88]. Variable positions are presented in blue; while conserved amino acids are shown in red as defined in the colour-coding bar. In all the structures only the residues after amino acid 40 are shown, since the amino terminus is disordered.
Ijms 20 02136 g008
Figure 9. P. lividus PRMT1 dimer structure models obtained by ClusPro [89]. The colour coding is red/orange red for the N-terminal domains, green/light green for the SAM binding domains, orange/yellow for the β barrel structures, and blue/light blue for the dimerization arm. (A) the ring-like model similar to the model described in Zhang and Cheng [85]; (B) the best ranked compact model.
Ijms 20 02136 g009
Figure 10. Comparison between arginine methylation sites in human and P. lividus β-tubulins. Top, ribbon/surface diagrams of the human neural β-tubulin structure Tubb3 (5JCO). Bottom, ribbon/surface diagrams of the neural β-tubulin structure generated by homology modelling. The 3D structures were created via the Phyre 2 software [87] and rendered by using Chimera package [88]. The arginine residues that can be methylated were coloured according to their accessibility on the surface: buried in yellow, intermediate accessibility in cyan, exposed in blue. The last amino acid shown in the structures (Q426 for the human protein and D427 for the P. lividus protein) are coloured in red as reference.
Ijms 20 02136 g010
Table 1. The P. lividus α- and β-tubulins.
mRNA Length (Kb)ORF Length (nt)Protein Length (aa)Molecular Weight apI b
Atub81.9135945250,189.554.90
Tuba1f1.7135945250,186.664.90
Tuba1e1.7135645150,087.574.93
Tuba1g1.8135945250,206.674.90
Tuba1h2.0135945250,208.644.90
Tuba1a1.5135945250,192.644.90
Atub31.5135645150,212.594.91
Tuba1d1.6135945250,243.734.88
Tuba32.4136245350,407.984.83
Tuba1b_11.7135945250,353.764.97
Btub21.9134444750,051.164.73
Tubb2a1.8134444750,051.164.73
Btub31.7134444750,033.134.73
Btub51.9134144649,990.174.79
Btub61.8134144649,963.084.74
Btub92.0134144650,000.084.72
Btub41.9133844549,837.914.76
a Molecular weight of the deduced polypeptide in Dalton. b Isoelectric point of the deduced protein.
Table 2. Tubulin genes: core promoter elements and expression analysis during development.
Core Promoter ElementsExpression
Gene NameBRETATAINREggEarly BlastulaLate BlastulaPrism
Atub8 ++++++
Tuba1f +--+-
Tuba1e+ +---++
Tuba1g +++++++++
Tuba1h ++++++
Tuba1a ++-+++++
Atub3 ++---+
Tuba1d ++---+
Tuba3 ++--+++
Tuba1b_1 +++--++
Btub2+ +-++-+++
Tubb2a +-+++++++
Btub3 + -++-+++
Btub5 +-+++++
Btub6 ++---++
Btub9+ ++++++++
Btub4 ++---+
Table 3. The P. lividus PRMTs.
mRNA Length (Kb)ORF Length (nt)Protein Length (aa)Molecular WeightpI
PRMT11.6107735841,123.815.33
PRMT23.0135345050,762.225.06
PRMT32.2164754862,149.504.60
PRMT43.4118539468,586.266.77
PRMT52.5188162671,161.216.16
PRMT62.4185461744,301.145.04
PRMT73.1206168677,028.465.55
Table 4. PRMT genes and their expression during development.
Expression
Gene NameEggEarly BlastulaLate BlastulaPrism
PRMT1+++++++++++++
PRMT2+++-
PRMT3-++++
PRMT4+++-
PRMT5++++
PRMT6-++-
PRMT7+++--
Table 5. Arginine methylation sites identified in tubulins of other organisms, their sequence environment (−6/+6 peptide) and corresponding sequences in P. lividus.
Experimentally Defined Methylated ResiduesPredicted Methylable P. lividus Residues
Site 1Type 2TissueReference 3Protein NameAccession #−6/+6 Peptide 4P. lividus Proteins−6/+6 Peptide 4P. lividus Protein−6/+6 Peptide 4
α339MMAHCT116 cells[77]TUBA1BNP_006073ATIKTKrSIQFVDALL 6ATIKTKrTIQFVDAtub8ATIKTKrSIQFVD
α339MMAHCT116 cells[77]TUBA4ANP_005991AAIKTKrSIQFVD Atub3ANIKTKrTIQFVD
α338MMA2,9 F 5[77]TUBA3CXP_486246ATIKTKrTIQFVD
α339MMA2,9 F[77]TUBA1BP05213ATIKTKrSIQFVD
α339MMA2,9 F[77]TUBA4AP68368AAIKTKrSIQFVD
β46MMA2,0 F[77]TUBB2AQ7TMM9SDLQLErINVYYNALLSDLQLErINVYYN
β46MMA2,0 F[77]TUBB2BQ9CWF2SDLQLErINVYYN
β62 Neuro2a cells[22]TUBB3Q13509SHKYVPrAILVDLALL 6GGKYVPrAVLVDLBtub6GGKYVPrAALVDL
β86MMA2,7 F[77]TUBB2AQ7TMM9PFGQIFrPDNFVFALL 6PFGQIFrPDNFVFBtub4PFGQIYrPDNFVF
β86MMA2,7 F[77]TUBB2BQ9CWF2PFGQIFrPDNFVF Btub6PFGQIFrPDNFIF
β86MMA2,7 F[77]TUBB2CP68372PFGQIFrPDNFVF
β86MMA2,7 F[77]TUBB4Q9D6F9PFGQIFrPDNFVF
β86MMA2,7 F[77]TUBBP99024PFGQIFrPDNFVF
β162ADMAmouse brain[77]TUBBNP_035785REEYPDrIMNTFSALL 6REEYPDrIMNTFSBtub4REEYPDrVMNTFS
β282 Neuro2a cells[76]TUBB3Q13509RGSQQYrALTVPEALLRGSQQYrALTVPE
β318MMAHCT116 cells[77]TUBB2CNP_006079TVAAVFrGRMSMKALL 6TVAAIFrGRMSMKBtub5TVAAMFrGRMSMK
β318ADMAmouse brain[77]TUBBNP_035785TVAAVFrGRMSMK
β318DIMETHS. cerevisiae[76]YFL037WP02557TVAAFFrGKVSVK
β320ADMAmouse brain[77]TUBBNP_035785AAVFRGrMSMKEVALL 6AAIFRGrMSMKEVBtub5AAMFRGrMSMKEV
β380MMAHCT116 cells[77]TUBB8NP_817124IQELFKrVSEQFTALLIQELFKrISEQFT
α79MMAroot tissue 7[78]α tubulin XP_010044940TV(I/V)DEVRSGTYRQ
β162MMAroot tissue 7[78]β tubulin 5NP_001289666REEYPDRMMLTFS
1 Site of Methylation. 2 Type of methylation. 3 Reference. 4 Methylable site environment; differences are in red. Lower case r is the methylated residue. 5 F: Fold Change_ Brain/Embryo - mouse. 6 All P. lividus proteins except for proteins indicated in the next columns. 7 Plant tubulins [Eucalyptus grandis].
Table 6. Oligonucleotides used as primers for the PCR-RACE.
TargetForward Primer - 3′RACEReverse Primer- 5′RACETa 1
Atub8TATACCAACTTGAACCGTCAGATGAGAAATCCTTGGAGA48
Tuba1fATCTATGATATATGCCGTCGGACATGGACTGAGATACATT47
Tuba1eATTACGGAAAGAAGTCCAAGACTGAAGAAGGTGTTAAAGG48
Atub3CTGTTGTCGAGCCATATAAGCATAGTTATTAGCAGCATC47
Tuba1dCTGTAGTTGAGCCCTATAACACTGAGATACATTCCCTCAT48
Tuba3GGAGAAGGACTATGAAGAAGAAGGATTGAGTTGTATGGTT47
Tuba1b_1GAATCCATTTCCCTCTTGTATATCCATGACTCTGTCAATG47
Btub6GATATCTGTTTCCGTACCTTCTGTAGCCTCATTGTAGTAG47
Btub9CCTGAATCATCTCGTATCAGCACGCATAATGATACAGATG47
Btub4AGCTCTGTACGATATTTGTTCAGCTTGTAGATGAACAATC47
PRMT2ATAGAAGGTACAACCCTACCATTGCTTCCATCTCCATTAC48
PRMT3CAAGGATAAGGTGGTGTTAGTGGAGAGGAGAAGATTTCAT48
PRMT4TGAGCAGGTTGATATCATTGCTTTGTGTTTAGTGTGTGTG48
PRMT5CAAATGTGCTATCTTCTCCATTTCCTTCTACGAACTCTCT48
PRMT6AGTCCTCATTTACATTCAGCCCTAGGAGGCTTAGTAGAAG48
PRMT7CTACATATCCACATGCTCACAGGGGATGTTCACCATATTA48
1 Ta: annealing temperature. PRMT1 coding sequence was already complete.
Table 7. Oligonucleotides used as primers for the genomic DNA amplifications.
NameForward PrimerReverse PrimerTa 1
Atub8CGGCACATCGGACACTGTGAAGCCGTGGGCGTTGATTGAT58
Tuba1fTGTAGCGAGCGACTCAAGCGTGAGCAAAAGGAGGCTACGGC58
Tuba1eACCCATCCATCACTTGGCACGTCCCCACATTTTGGCGAATGA55
Atub3CGACGTCTGCTAGCTCACCTTATGGTTTATTGATCAGCTCTCATGGC56
Tuba1dGACGCTTCGCAGCTCTGTCTTGCATCGAAGGAAGGGGGAT56
Tuba3_UPGTCTCGCCGATTTCGCCACTTGTGCTTGCCAGCTCCAGTC58
Tuba3_DWGCGAACCGGTACGTATCGTCATTCATCGTAGAATCTTGGAACGCC56
Tuba1b_1CGCATCGAACACGGCTCTGAGGTATCGTGGCCGTGCGAT58
Btub6CCTTCTAAGCGAATTGCAAGGTGTCTGCTTGTACATGCTGCCAGA55
Btub9GACGGTTGCACAGCATGCACGTCCGGACGCAAGAGTGGTC58
Btub4GGTCTGCTTGTGTGTCCCCGTAACGAGTCCGACCAGGGGG58
1 Ta: annealing temperature. UP: up fragment amplification, DW: down fragment amplification.
Table 8. Oligonucleotides used as primers for the RS-PCRs.
TargetForward Primer - 3′RSOReverse Primer- 5′RSOTa 1
Atub8TTATAAGGCAACCTCCAACCGTTTCACAGATTGCTCACAG50
Tuba1fACAACGAACTAAAGGCTCATGTATGATGTGCCGTAAGCTA50
Tuba1eGCCAAAATGTGGGGATTAAGTAGACGGATTTGAGGCAAAA50
Atub3TAGAATTCAGCCATGAGAGCTTTGAGGAGCTTTGACAACT50
Tuba1dAATCGTCAACAGTTTGCTTCTATTGAAGAGACAGAGCTGC50
Tuba3TTCTGACTTCTTAGTGCCTTAGTAGAAGTGGCGAAATCGG50
Tuba1b_1AGAGGAAGATGACGATTGTGATAGGTTAGGCTTCAACAGC50
Btub6CACTTGAAAGGAACATCTGCAATAATGCACAGGAGAGGTG50
Btub9TTCCAAAACATTTGCCTGTCAATGGCGGAAAAATTGTGTT50
Btub4CGACCTGTGGATACATCATTAGATGTAAAGAAACGGGGAC50
RSO-BamTAATACGACTCACTATAGGGAGANNNNNNNNNNGGATCC
RSO-EcoTAATACGACTCACTATAGGGAGANNNNNNNNNNGAATTC
RSO-NdeTAATACGACTCACTATAGGGAGANNNNNNNNNNCATATG
RSO-XbaTAATACGACTCACTATAGGGAGANNNNNNNNNNTCTAGA
RSO-SauTAATACGACTCACTATAGGGAGANNNNNNNNNNGATC
RSO-TaqTAATACGACTCACTATAGGGAGANNNNNNNNNNTCGA
RSO_T7TAATACGACTCACTATAGGGAGA50
1 Ta: annealing temperature.
Table 9. Oligonucleotides used as primers for the qPCR.
NameForward PrimerReverse Primer
Atub8TGAGCAATCTGTGAAACCTCCTCTACAACTCCCAGCAGGCATTACC
Tuba1fCTTACGGCACATCATACGTTGCCGACATGGACTGAGATACATTCCC
Tuba1eCTGAGCATTTTGCCTCAAATCCTCCGACGTGGATAGAGATACATTC
Atub3CAGTGCAGTTGTCAAAGCTCCTCGGCTGGATACCATGCTCAAGAC
Tuba1dAAAGCTCACTTCAAGACGCTTCGCGACATGGACTGAGATACATTCCC
Tuba3GCCGATTTCGCCACTTCTACTTAGAGGCATTTCCCATCTGGACAC
Tuba1b_1TCTTCGTTGCTGTTGAAGCCTCAAGGCAATAGAGTTCCCAGC
Btub6CCTAAGCAAATTGCAGGGTGTAACGCCTGTAAATGTACAATCTCACGC
Btub9CCACGAACACAATTTTTCCGCCAGCTTGTAAGTGAACAATCTCAC
Btub4TTTCCCAAAGAGTCGTGGTGCCAGCTTGTAGATGAACAATCTCAC
PRMT1GGGAGGACAGGGGGACGGACCAGCCCCAGCTTTGGCAGCA
PRMT2GCCTGGCGGAAATGGGGGAGTTCCCTTGCGTGCCCACCAC
PRMT3CTGCTCACCATGGGCGCTGCAGCCTTCCAATCGGTTTGCGTGT
PRMT4ACAGCAAGGCAGGGTGGTGCGCATACATGCCCCCAGCCCC
PRMT5GTCCGCAGCCGGAGCGTATGGGGCATCGAGGGCACCATCA
PRMT6GGCAGAGCCAGAGCCTGTTGGGCCGCAATCTCTTCCGCACCT
PRMT7TCGCTGGCGCCTGGAGTACACCTGGGCCTTGAGAATGCAGGG
18S rRNAGAATGTCTGCCCTATCAACTTTCGTTGGATGTGGTAGCCGTTTCTC

