Author Contributions
Conceptualization: C.Y., E.B., H.K., and H.Y.; Data curation: C.Y. and E.B.; Formal Analysis: C.Y., E.B., and S.P.A.; Funding Acquisition: H.K.; Investigation: H.K. and H.Y.; Methodology, C.Y. and E.B.; Project Administration, H.K. and H.Y.; Software, C.Y.; Supervision, H.Y.; Validation, C.Y. and S.P.A.; Writing—Original Draft, C.Y. and E.B.; Writing—Review & Editing, H.K., H.Y., S.P.A., and S.-J.K.
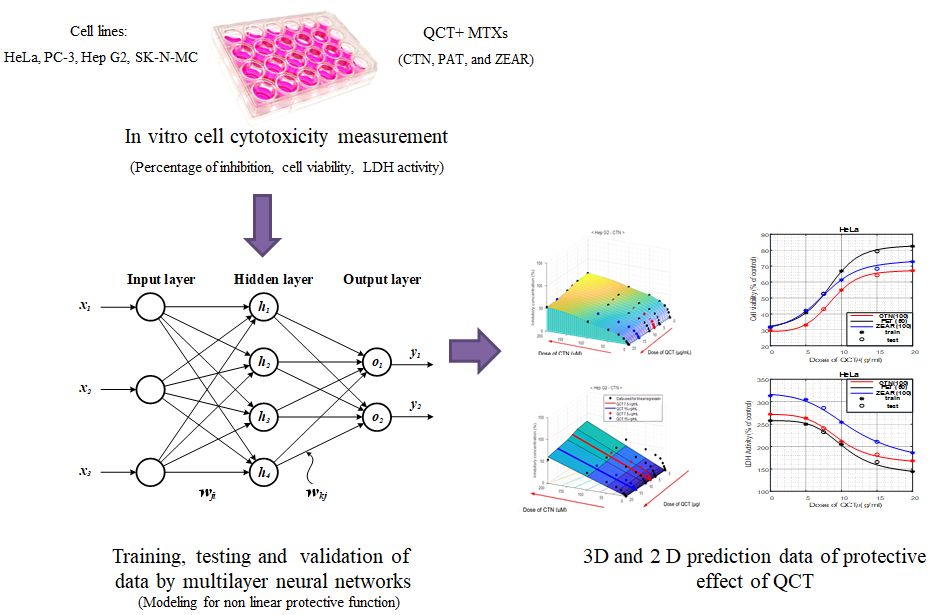
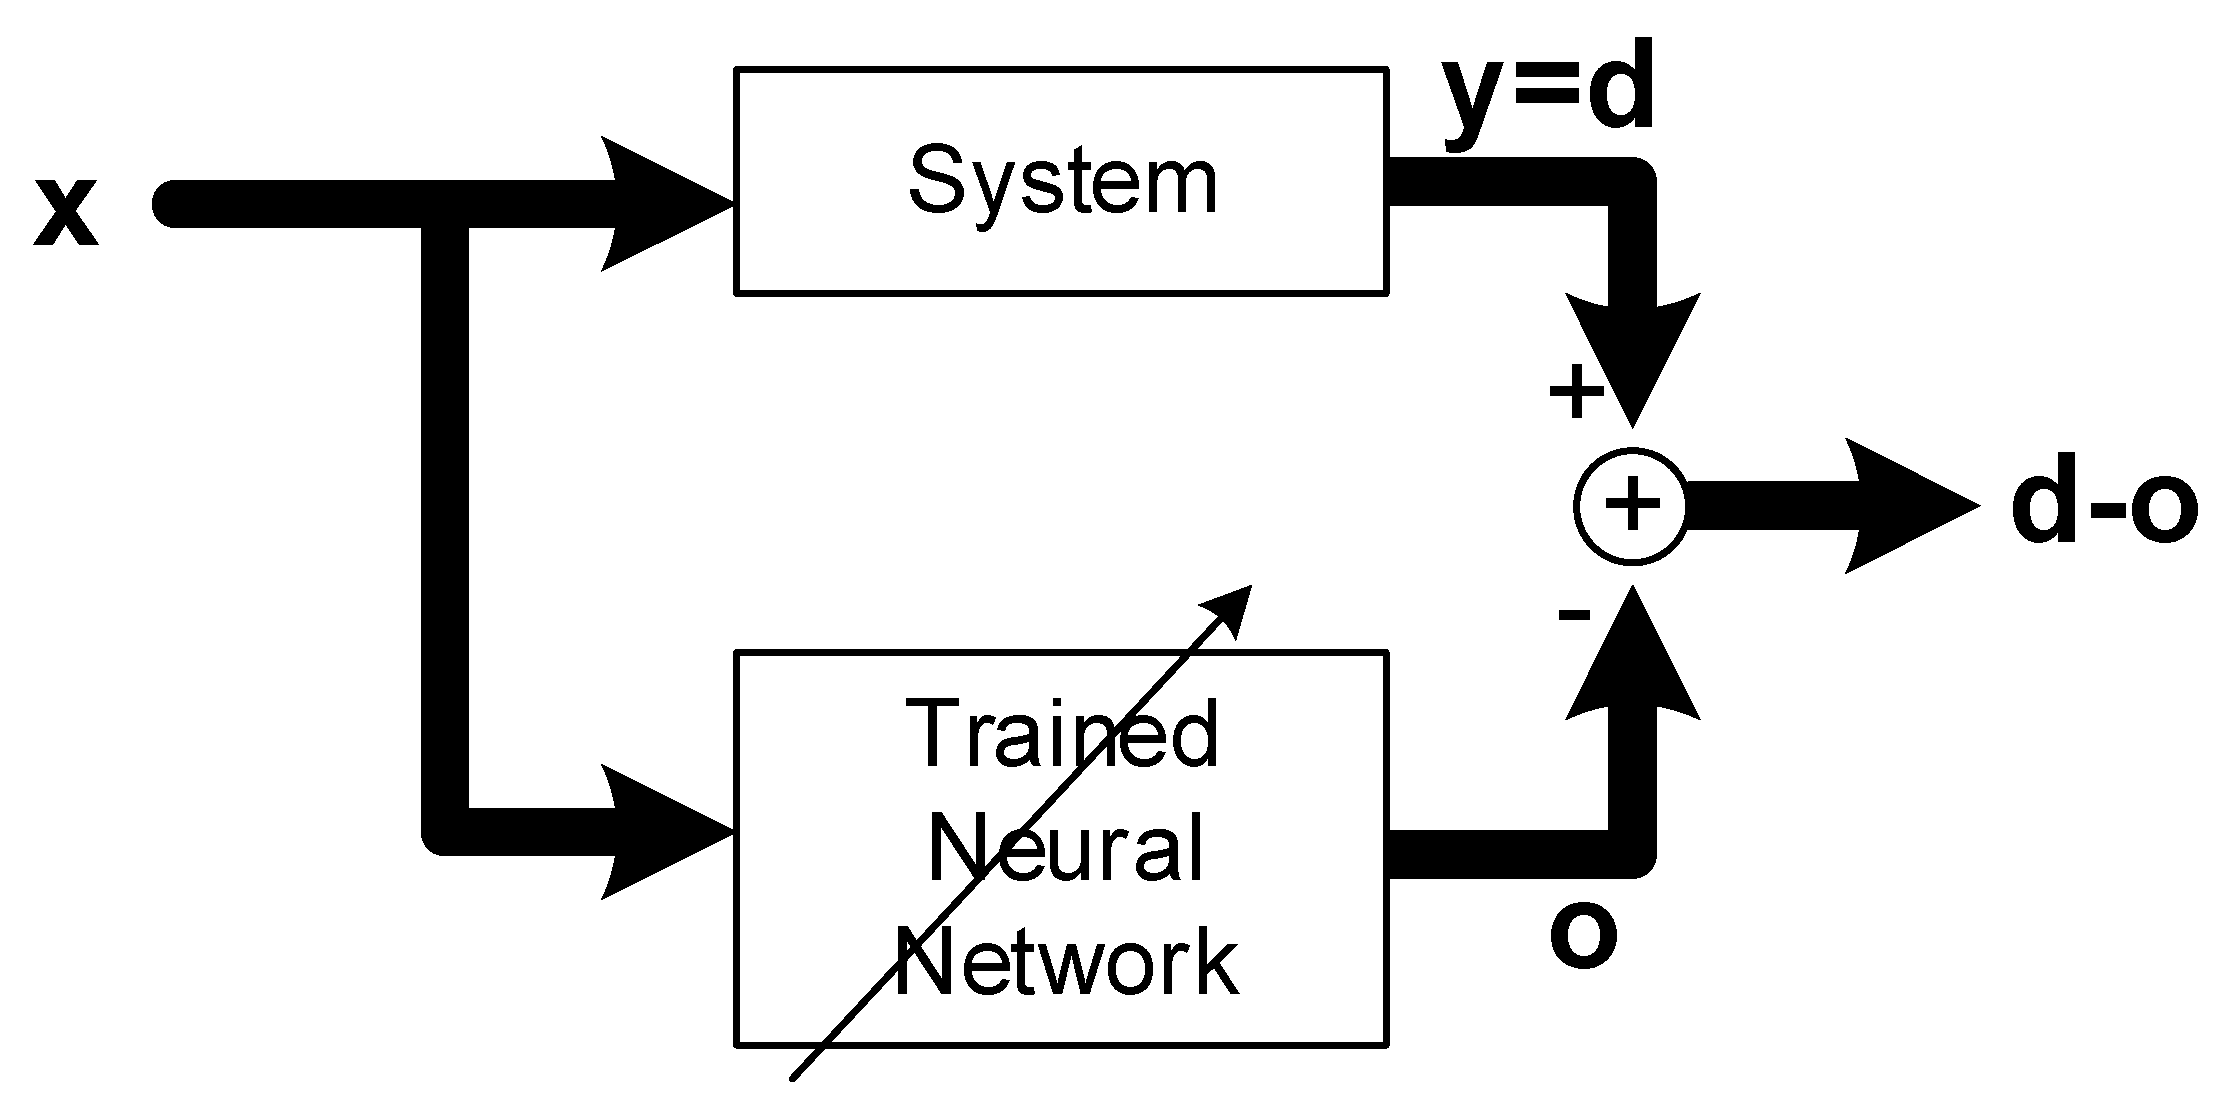
Figure 1.
Concept of system identification with artificial neural networks, where lines with arrow heads denote parameter adjustment via learning.
Figure 1.
Concept of system identification with artificial neural networks, where lines with arrow heads denote parameter adjustment via learning.
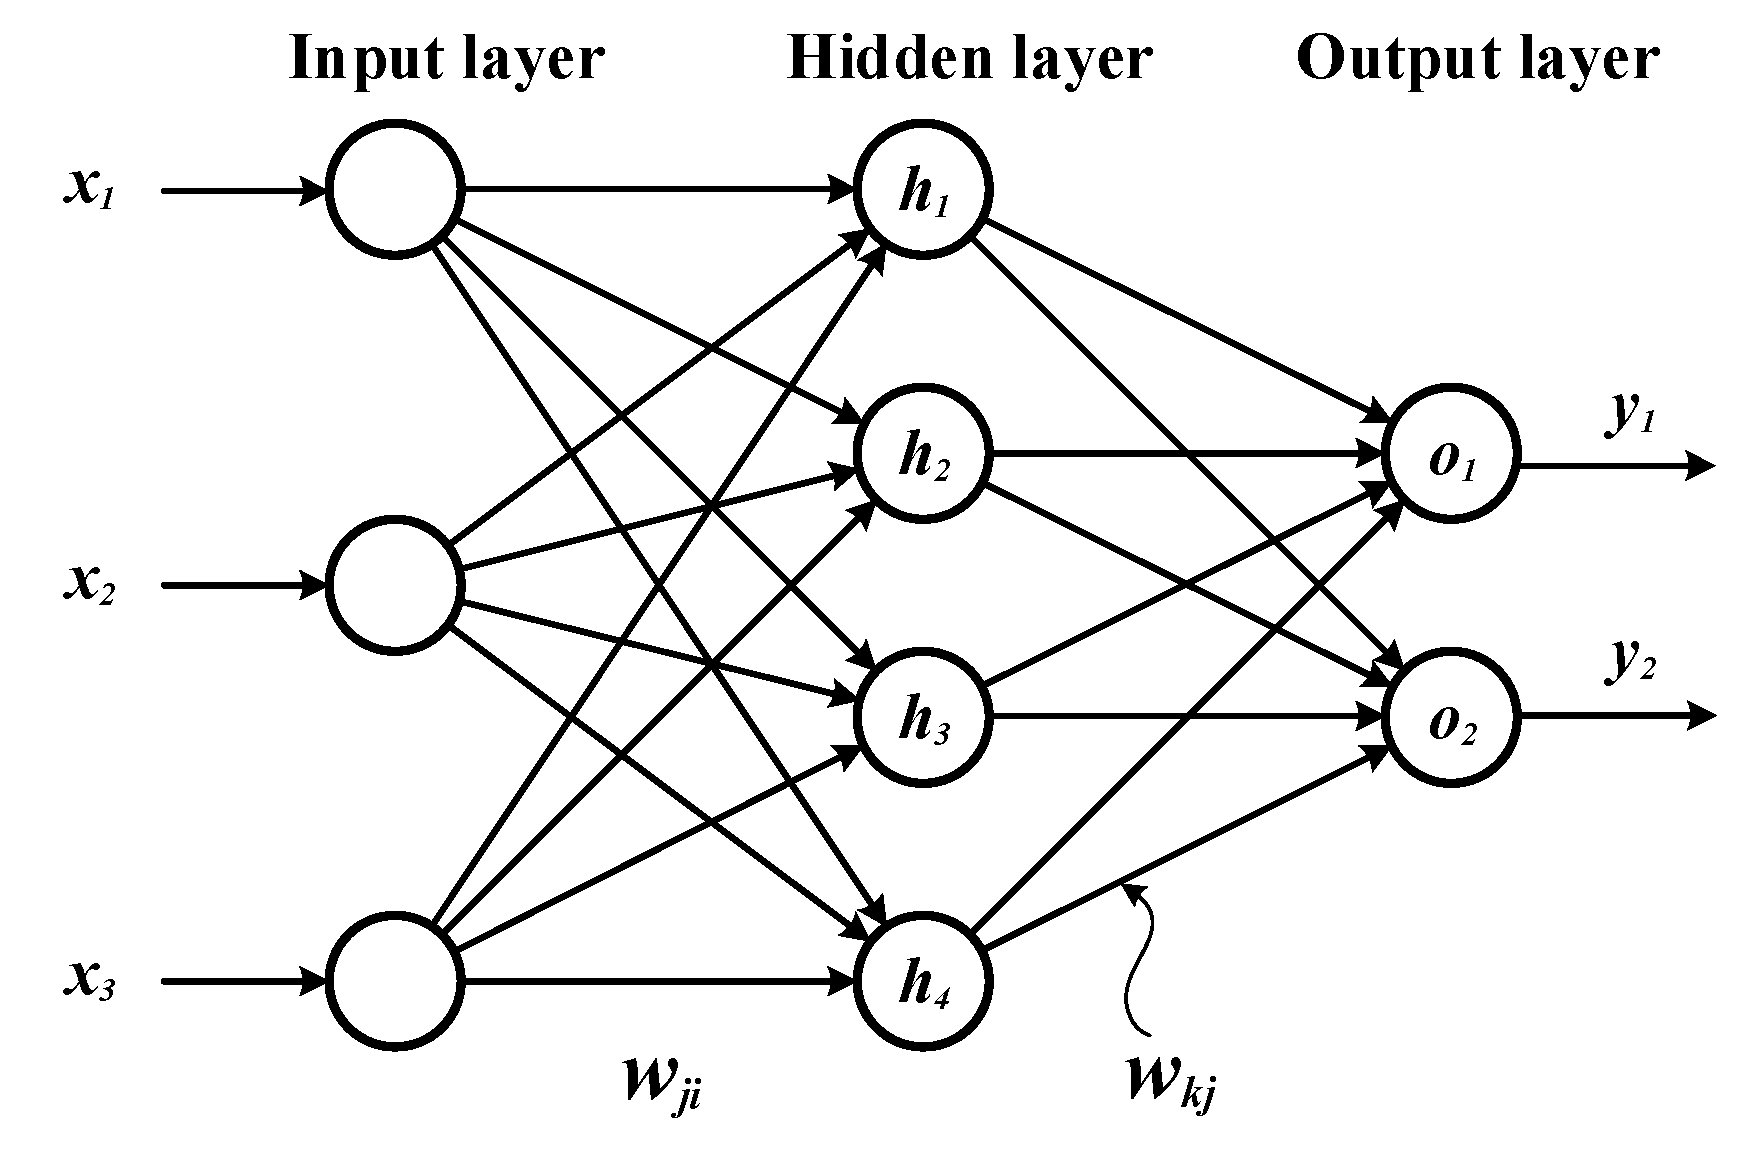
Figure 2.
Architecture of our artificial neural network.
Figure 2.
Architecture of our artificial neural network.
Figure 3.
The protective effect of QCT against MTX-induced cell death. (A) Cell viability on HeLa, PC-3, Hep G2, and SK-N-MC cells when pretreated with QCT and post-treated with various MTXs, such as (A) CTN, (B) PAT, and (C) ZEAR. Values were represented as mean ± SD. ## p < 0.01 as compared with the control group; * p < 0.05; ** p < 0.01 as compared with the MTX alone group.
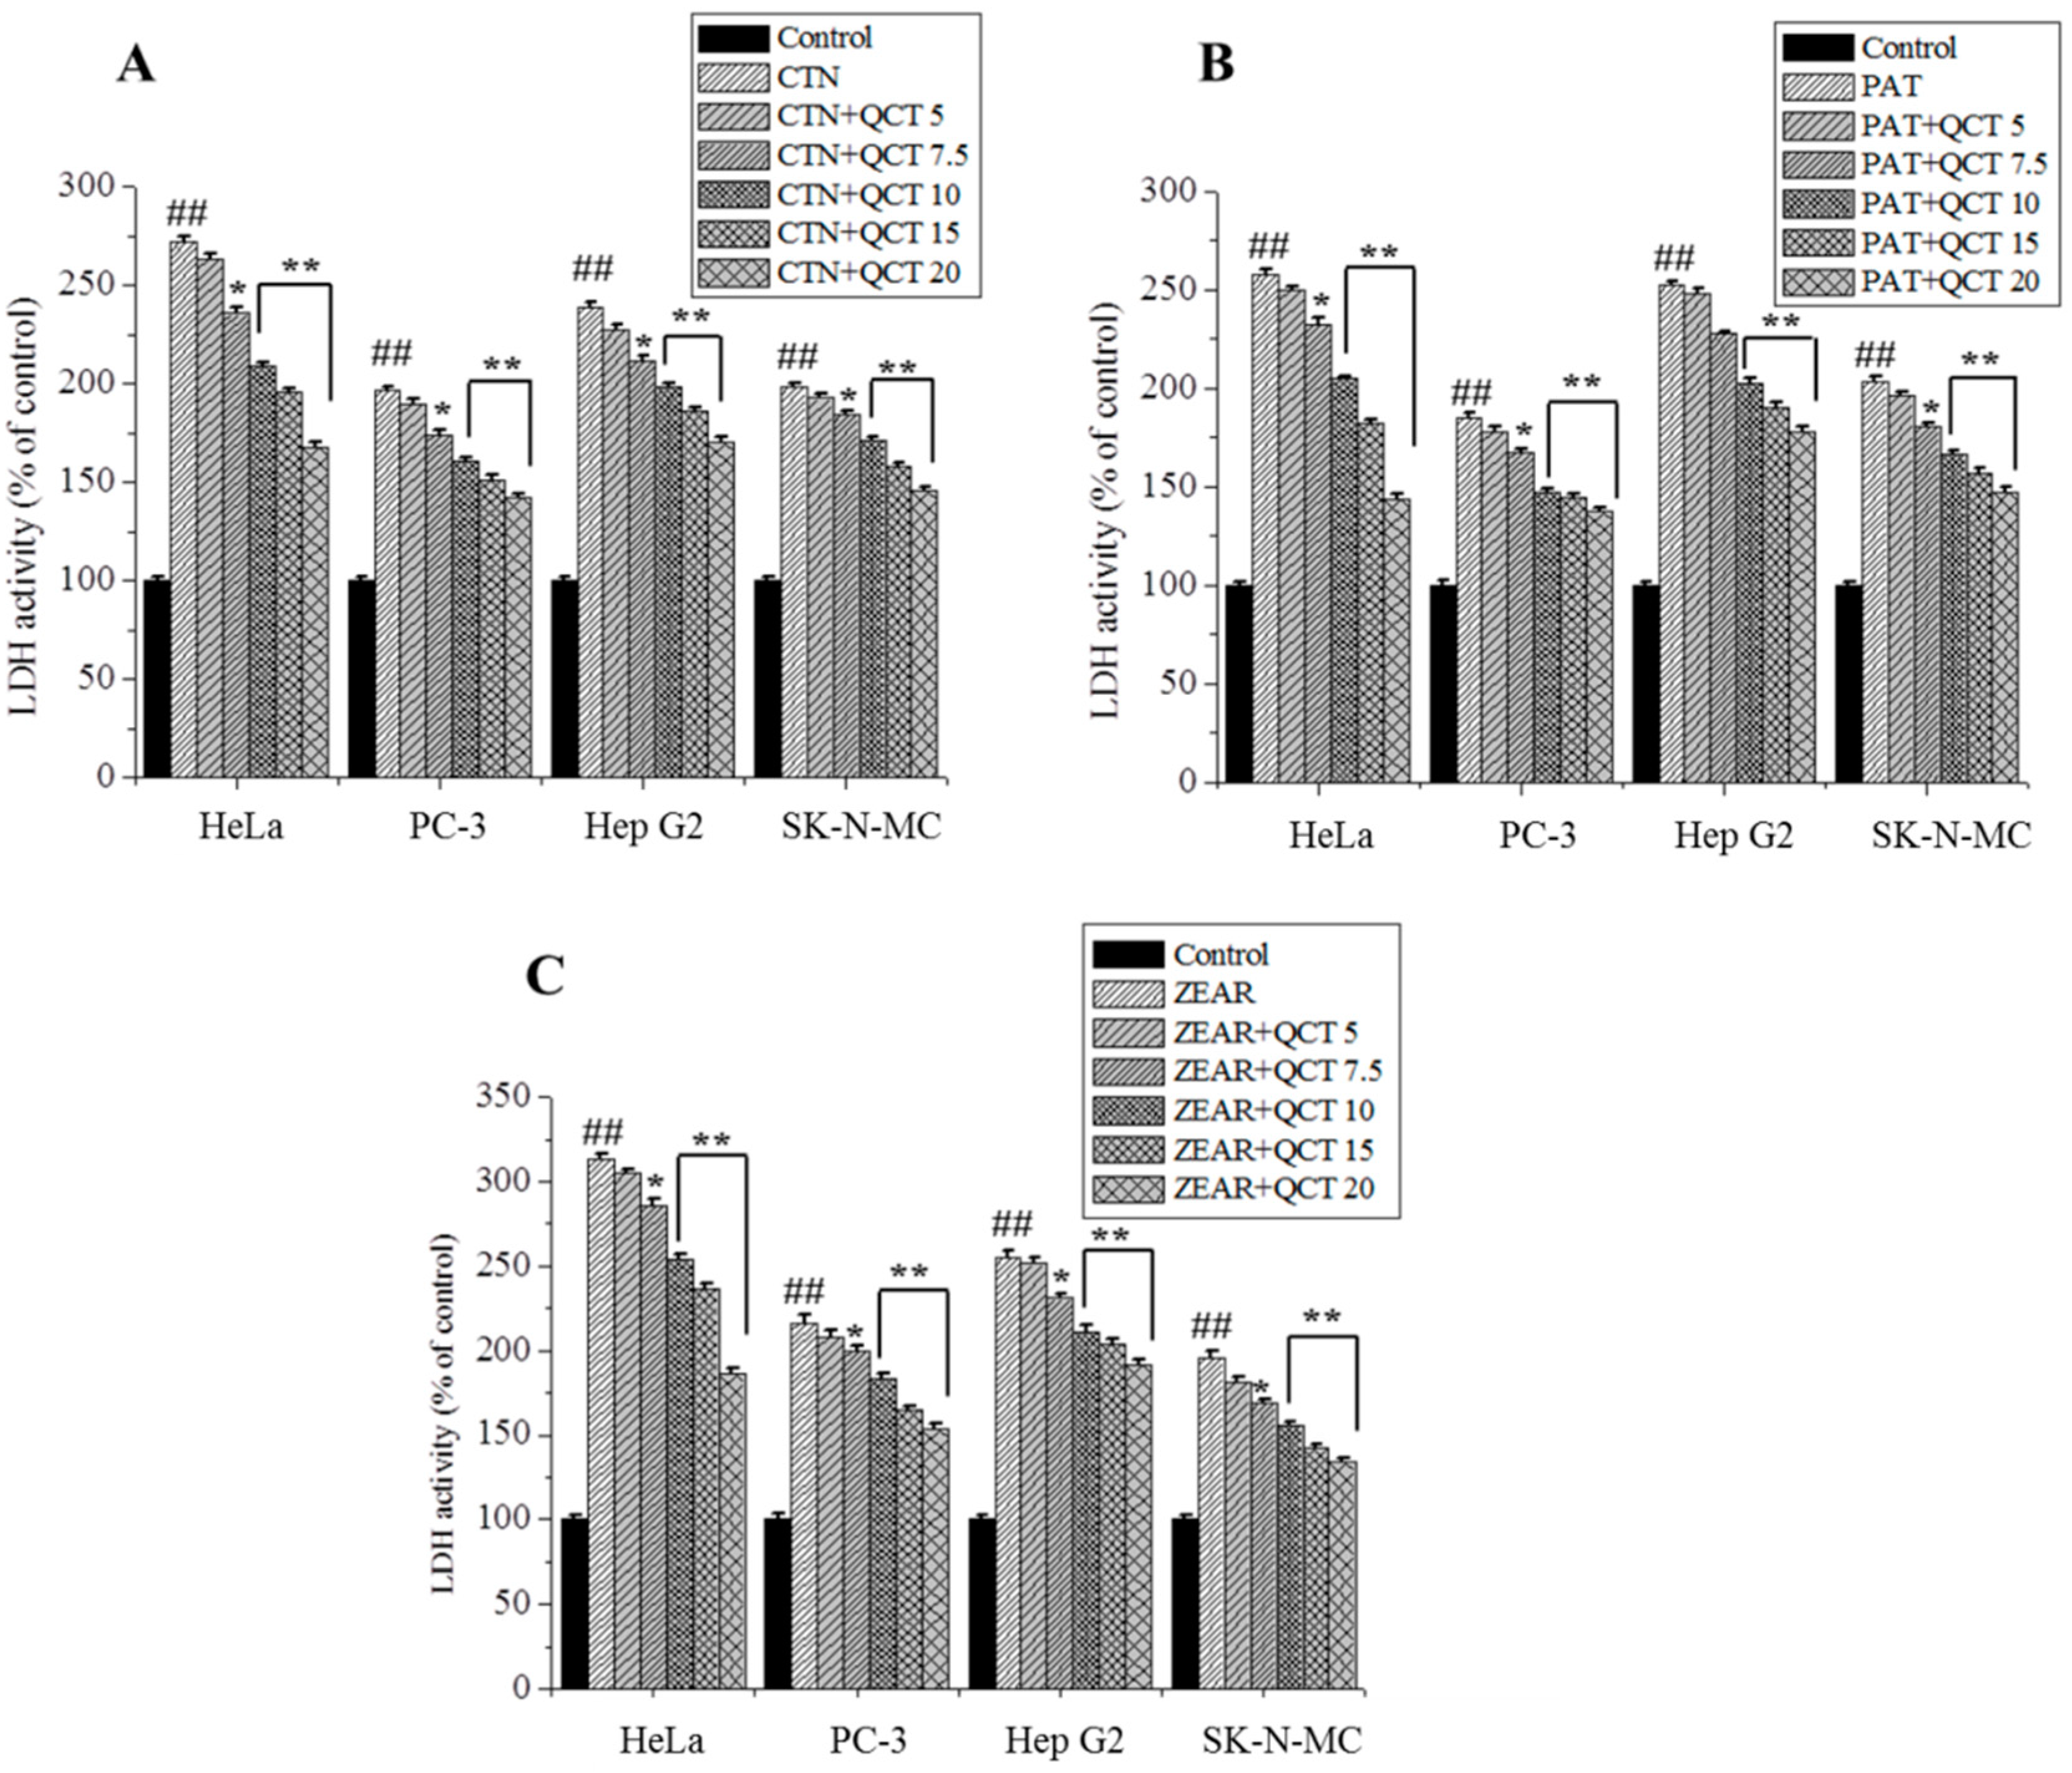
Figure 4.
The protective effect of QCT against MTX-induced cytotoxicity. LDH activity on HeLa, PC-3, Hep G2, and SK-N-MC cells when pretreated with QCT and post-treated with various MTXs, such as (A) CTN, (B) PAT, and (C) ZEAR. Values were represented as mean ± SD. ## p < 0.01 as compared with the control group; * p < 0.05; ** p < 0.01 as compared with the MTX alone group.
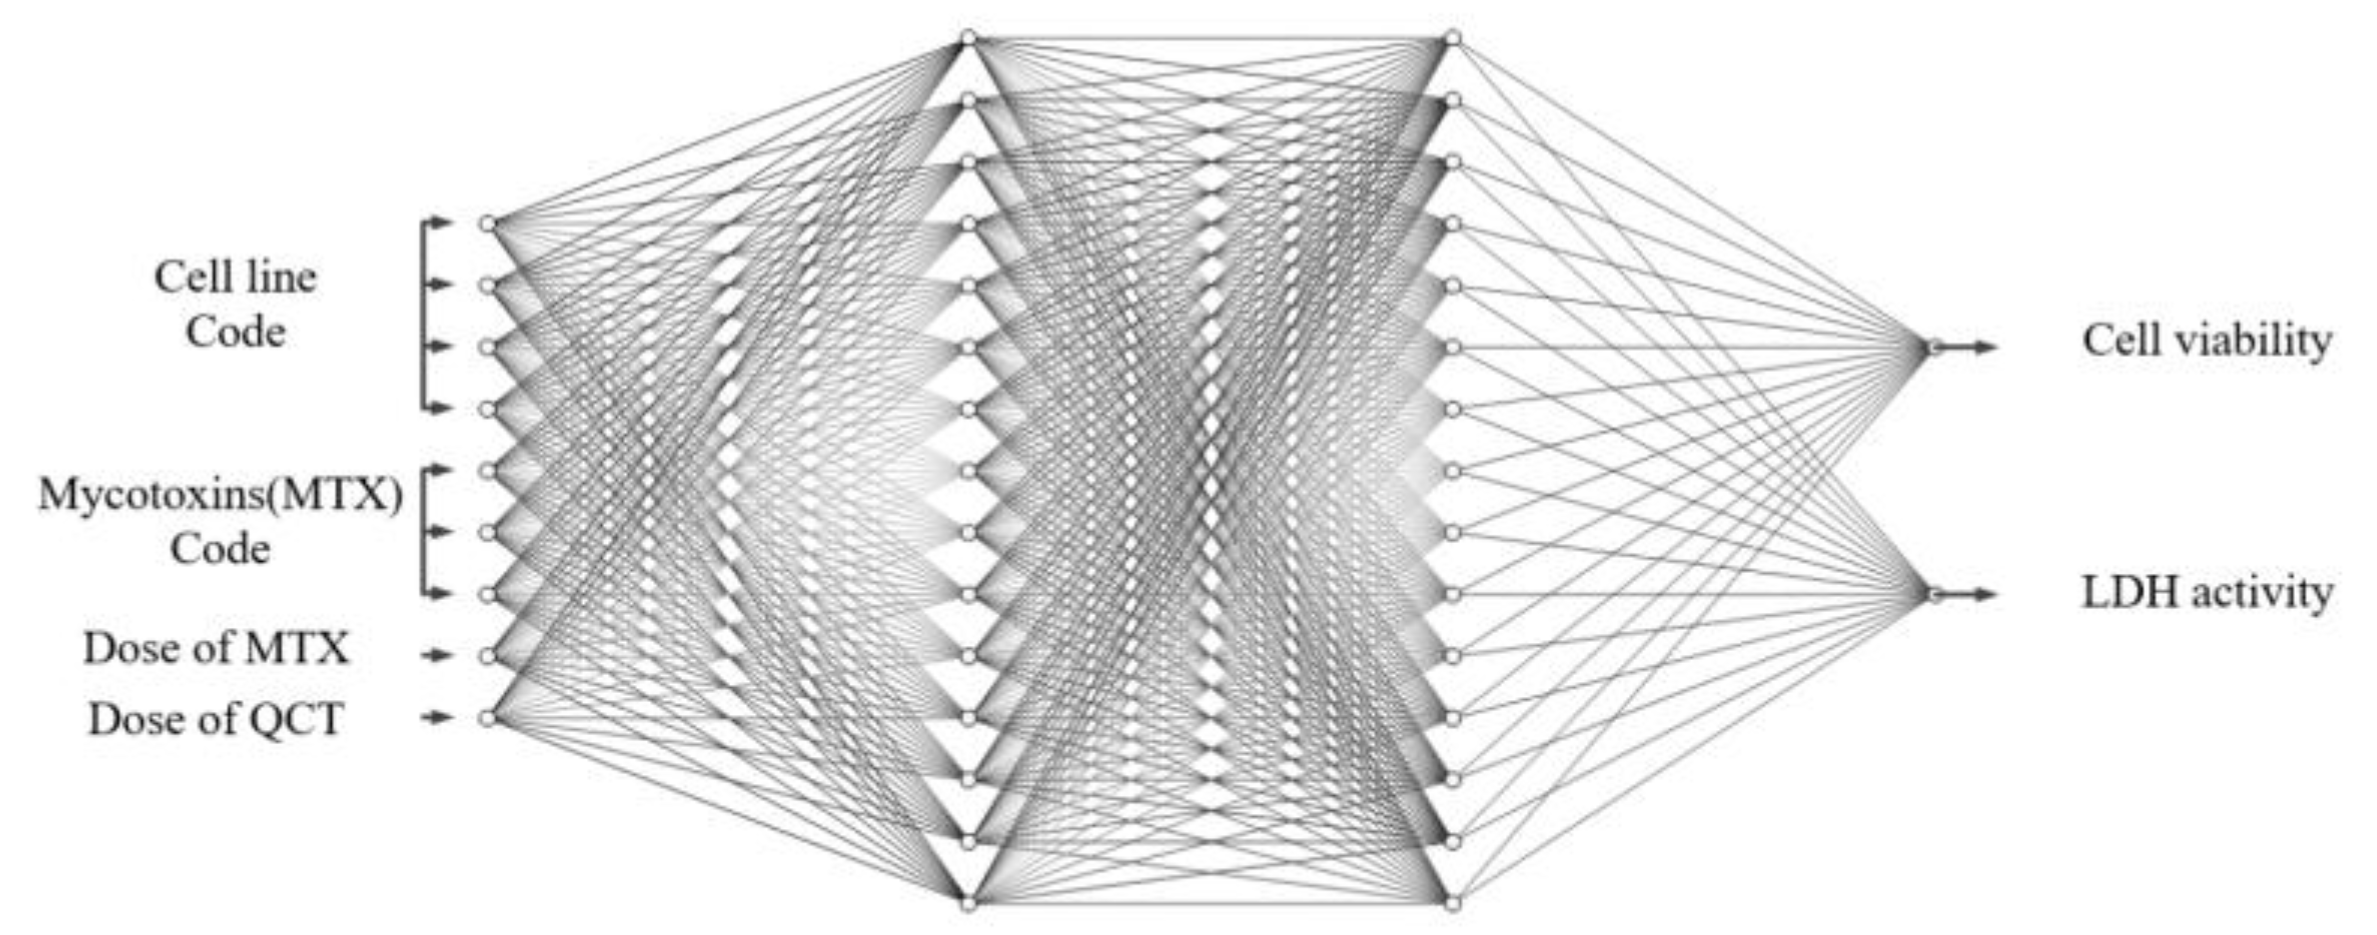
Figure 5.
Architecture of artificial neural network (ANN) (9-20-15-1) for learning of % of inhibition. Biases of nodes are omitted in this figure, where four input terminals are used for indicating cell lines and three input terminals are to determine MTXs and other two input terminals are for the dose of MTX and QCT, respectively. Also, the single output terminal is for % of inhibition.
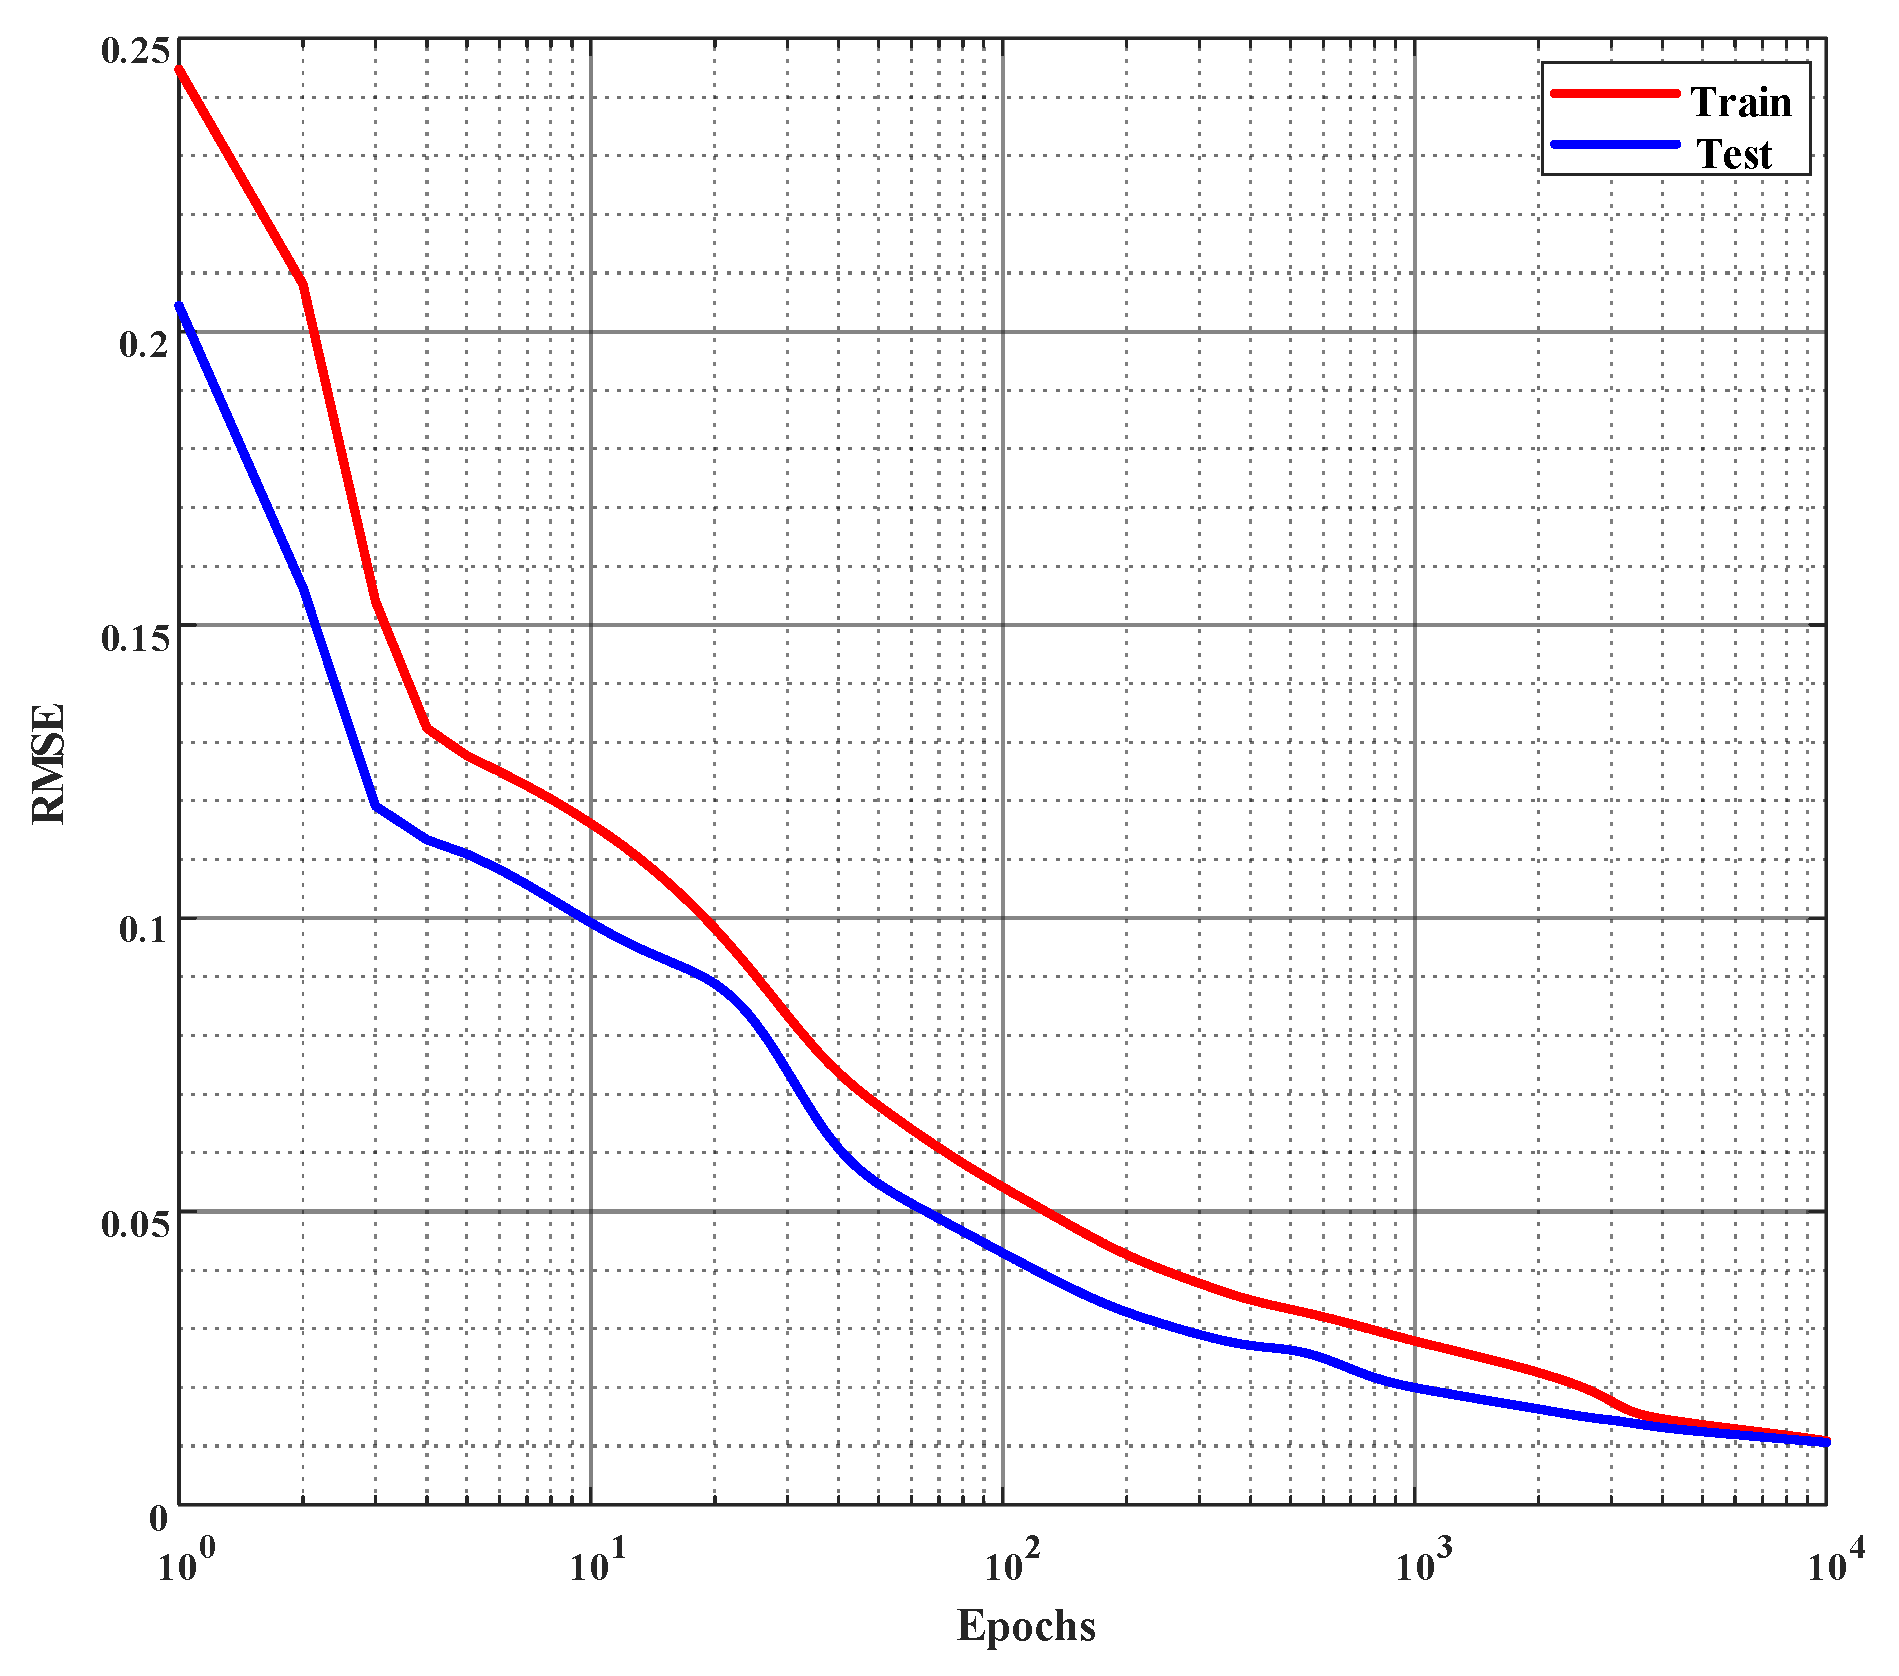
Figure 6.
Error curves of learning % of inhibition on the training and the test set. Root mean square error (rmse) is employed to evaluate the performance and the network is trained for 10,000 epochs or until the rmse reaches 0.01, whichever occurs first. (The x-axis is plotted in log scale.)
Figure 6.
Error curves of learning % of inhibition on the training and the test set. Root mean square error (rmse) is employed to evaluate the performance and the network is trained for 10,000 epochs or until the rmse reaches 0.01, whichever occurs first. (The x-axis is plotted in log scale.)
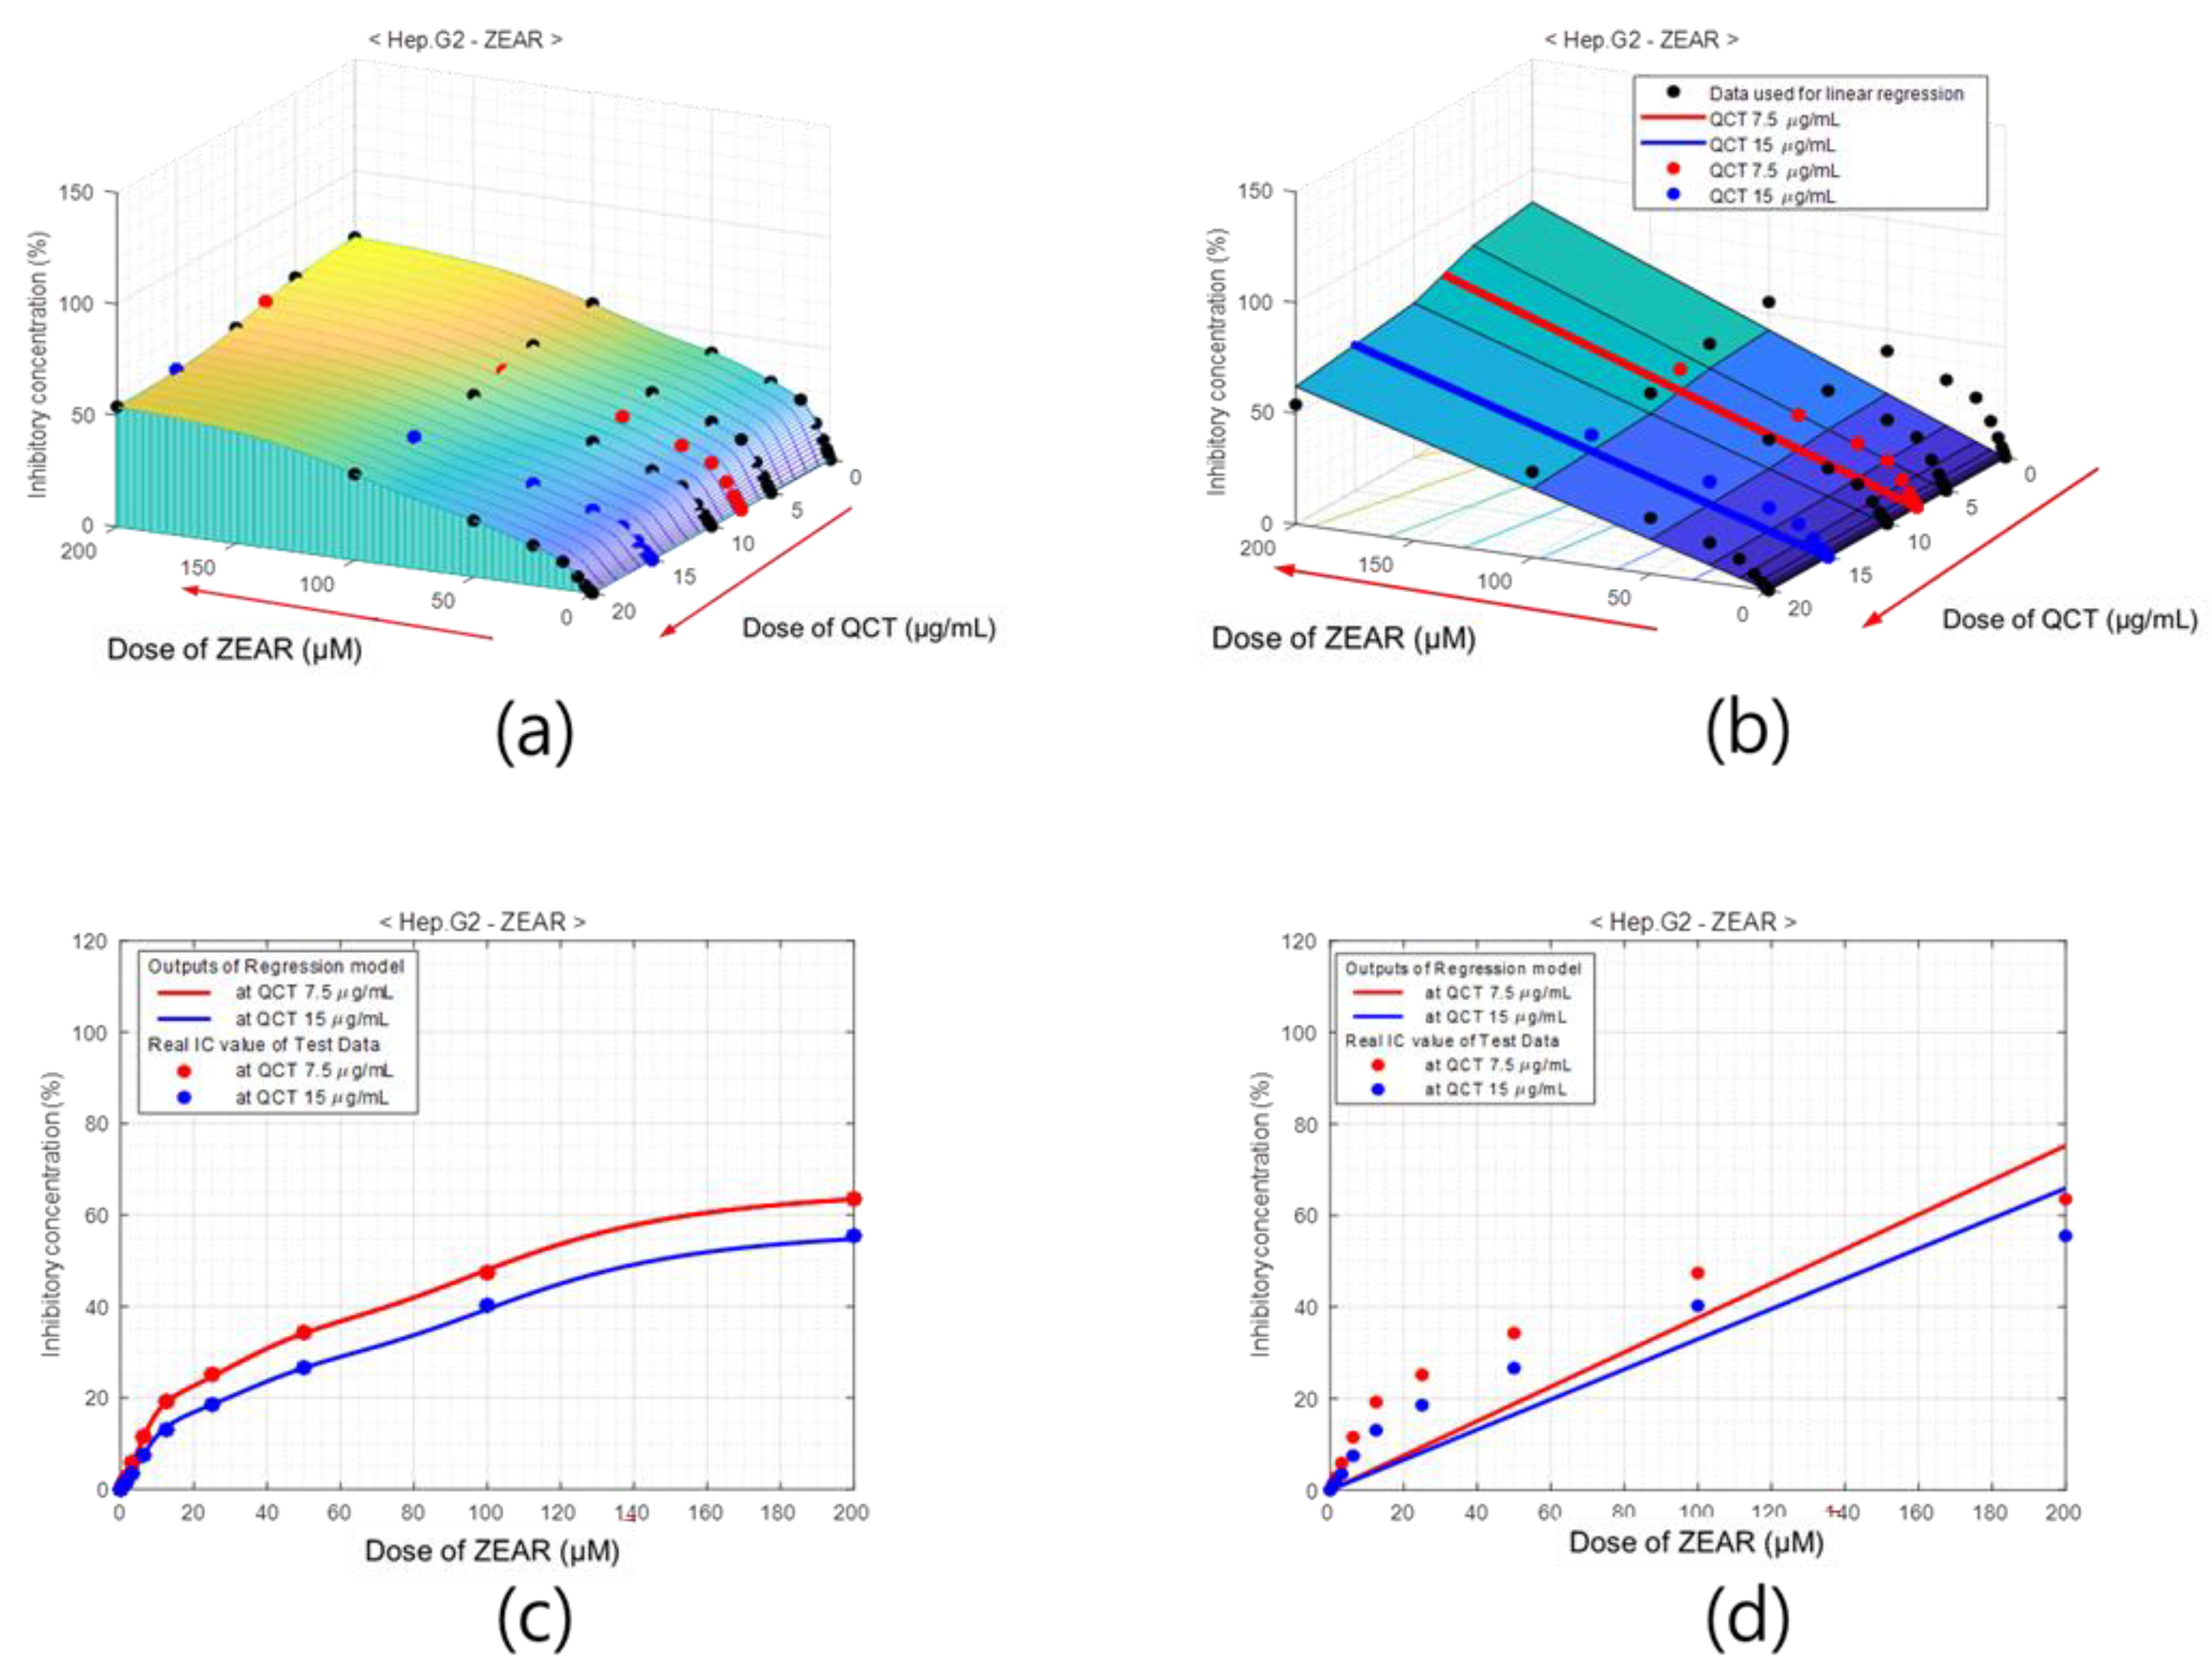
Figure 7.
Percentage of inhibition model of Hep G2 cell for dose of QCT and CTN. (a) Surface of % of inhibition values obtained with ANNs, where black dots indicate training data and red and blue dots are test data. (b) % of inhibition surface obtained with linear regression. Cross-sections of (c) ANN-based model and (d) the linear regression model at QCT = 7.5 μg/mL (red) and QCT = 15 μg/mL (blue), which comprise the test area. The outputs of the neuro-model are close to the experimentally measured % of inhibition values.
Figure 8.
Percentage of inhibition model of QCT for Hep G2 cell with PAT. Surface of % of inhibition obtained using (a) ANN model and (b) linear regression. Cross-sections of (c) ANN-based model and (d) linear regression model at QCT = 7.5 μg/mL (red) and QCT = 15 μg/mL (blue), which comprise the test area.
Figure 9.
Percentage of inhibition model of QCT for Hep G2 cell with ZEAR. Surface of % of inhibition obtained using (a) ANN model and (b) linear regression. Cross-sections of (c) ANN-based model and (d) linear regression model at QCT = 7.5 μg/mL (red) and QCT = 15 μg/mL (blue), which comprise the test area.
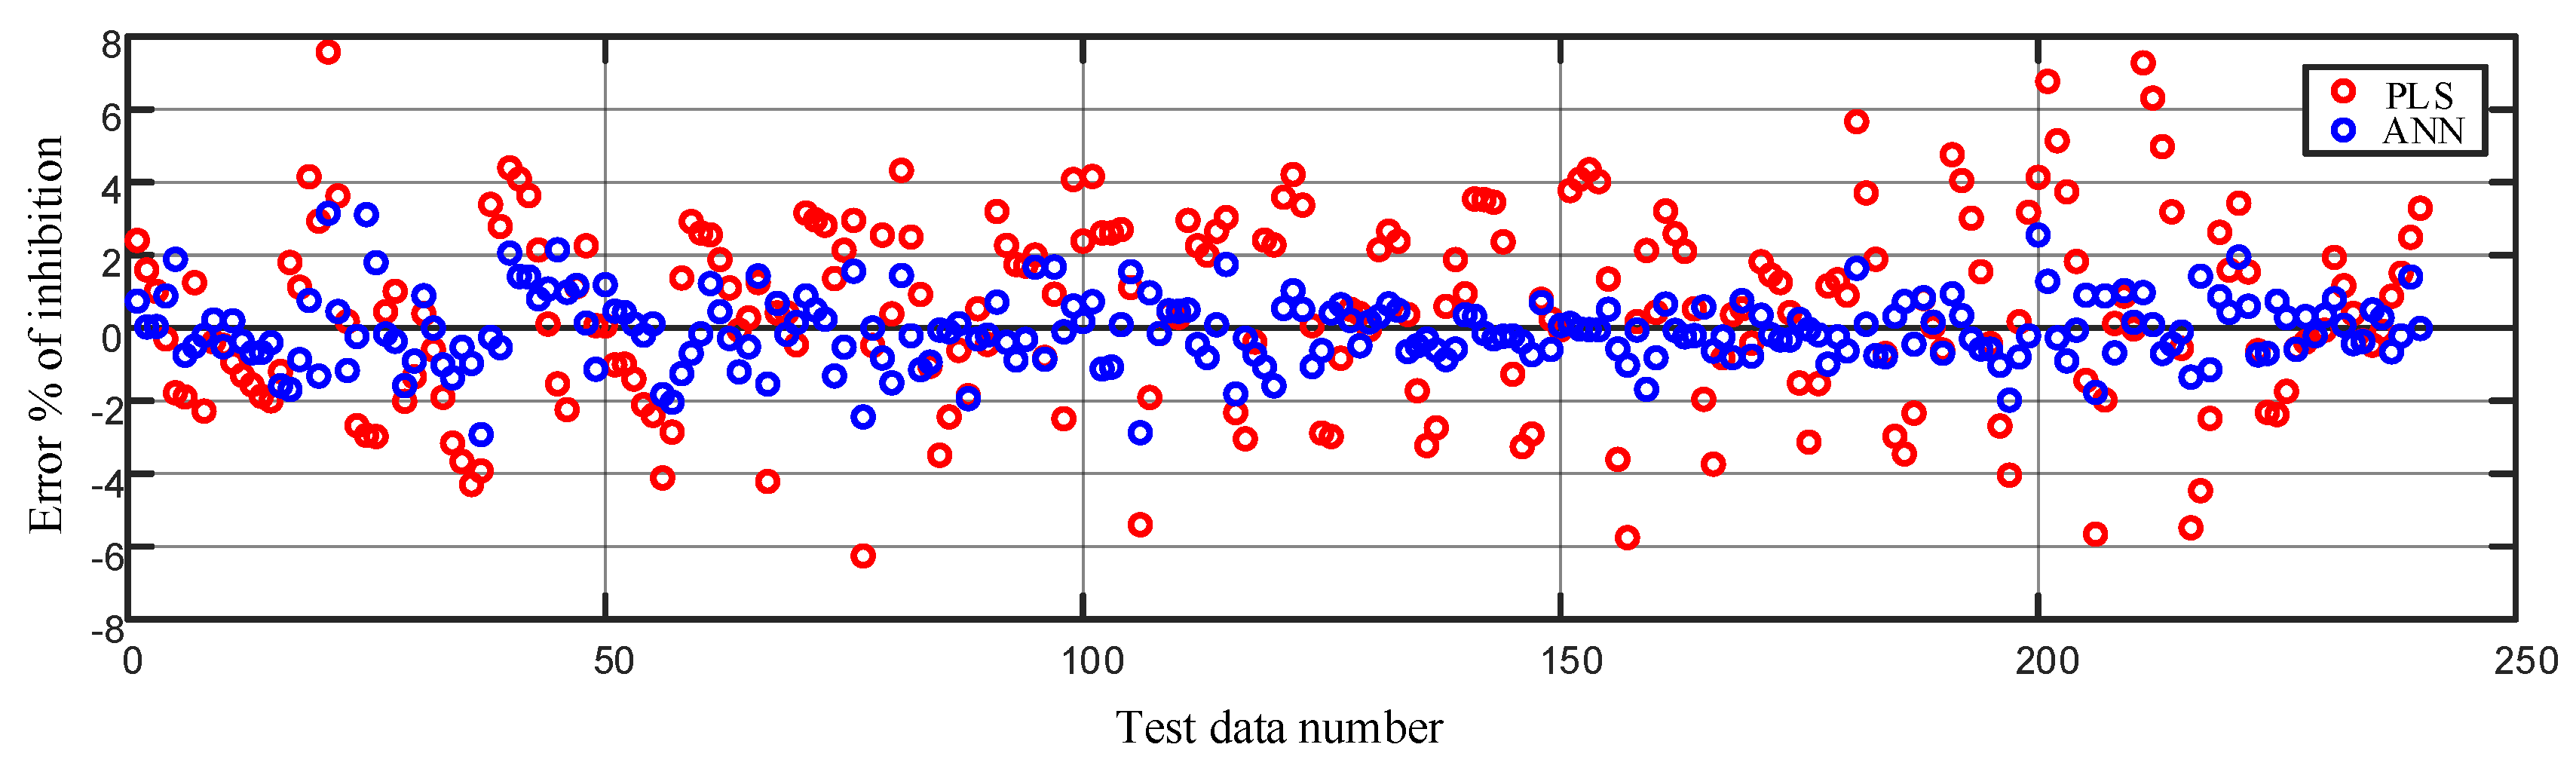
Figure 10.
Comparison of error in modeling the % of inhibition on the test data using the partial least squares regression (PLS) and the artificial neural network method.
Figure 10.
Comparison of error in modeling the % of inhibition on the test data using the partial least squares regression (PLS) and the artificial neural network method.
Figure 11.
Architecture of ANN which was used for the modeling of cell viability and LDH activity. The size of the ANN is 9-10-10-2. Biases of nodes are omitted in this figure.
Figure 11.
Architecture of ANN which was used for the modeling of cell viability and LDH activity. The size of the ANN is 9-10-10-2. Biases of nodes are omitted in this figure.
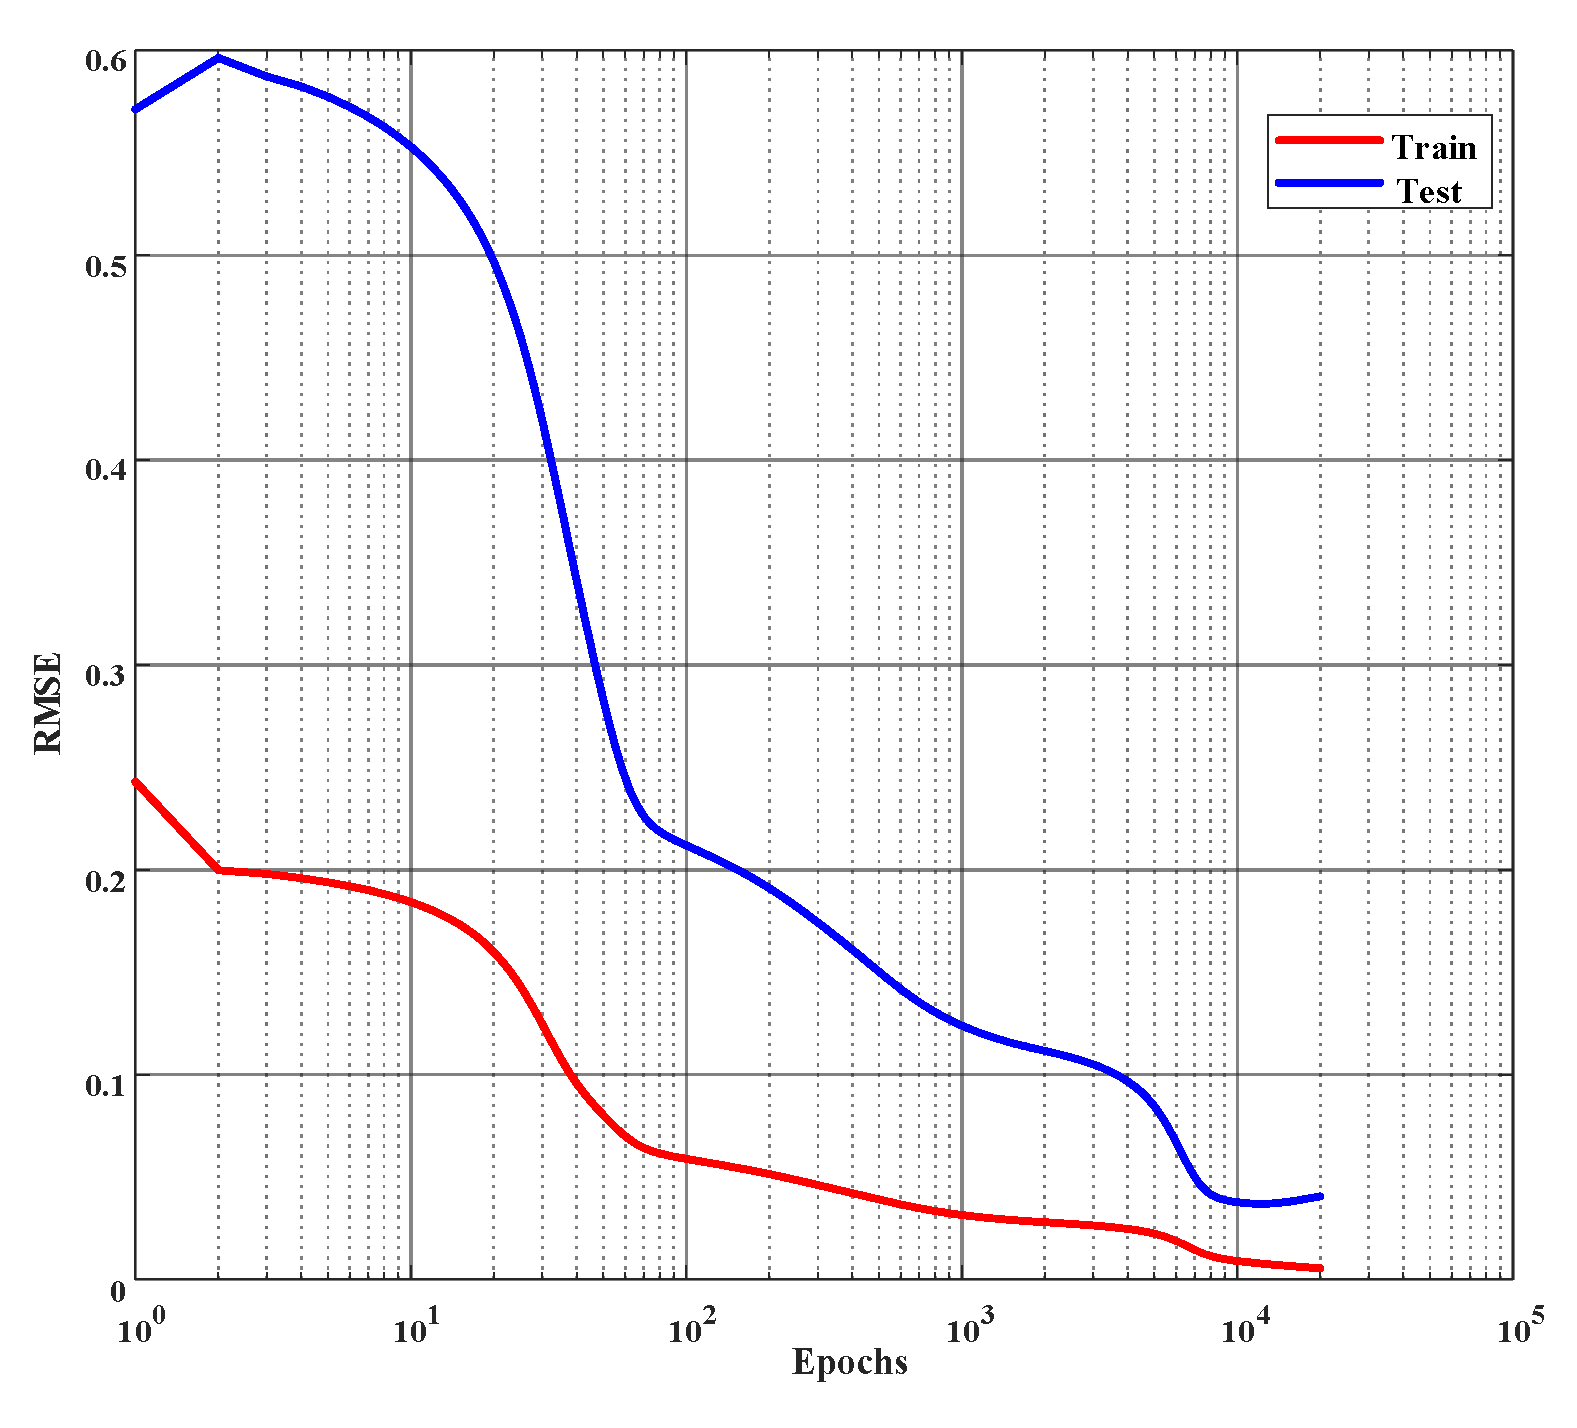
Figure 12.
Error curves for the learning of cell viability and LDH activity on the training and the test set. Root mean square error (rmse) is employed to evaluate the performance and the network is trained for 20,000 epochs or until the rmse reaches 0.001, whichever occurs first. (x-axis is plotted in log scale.)
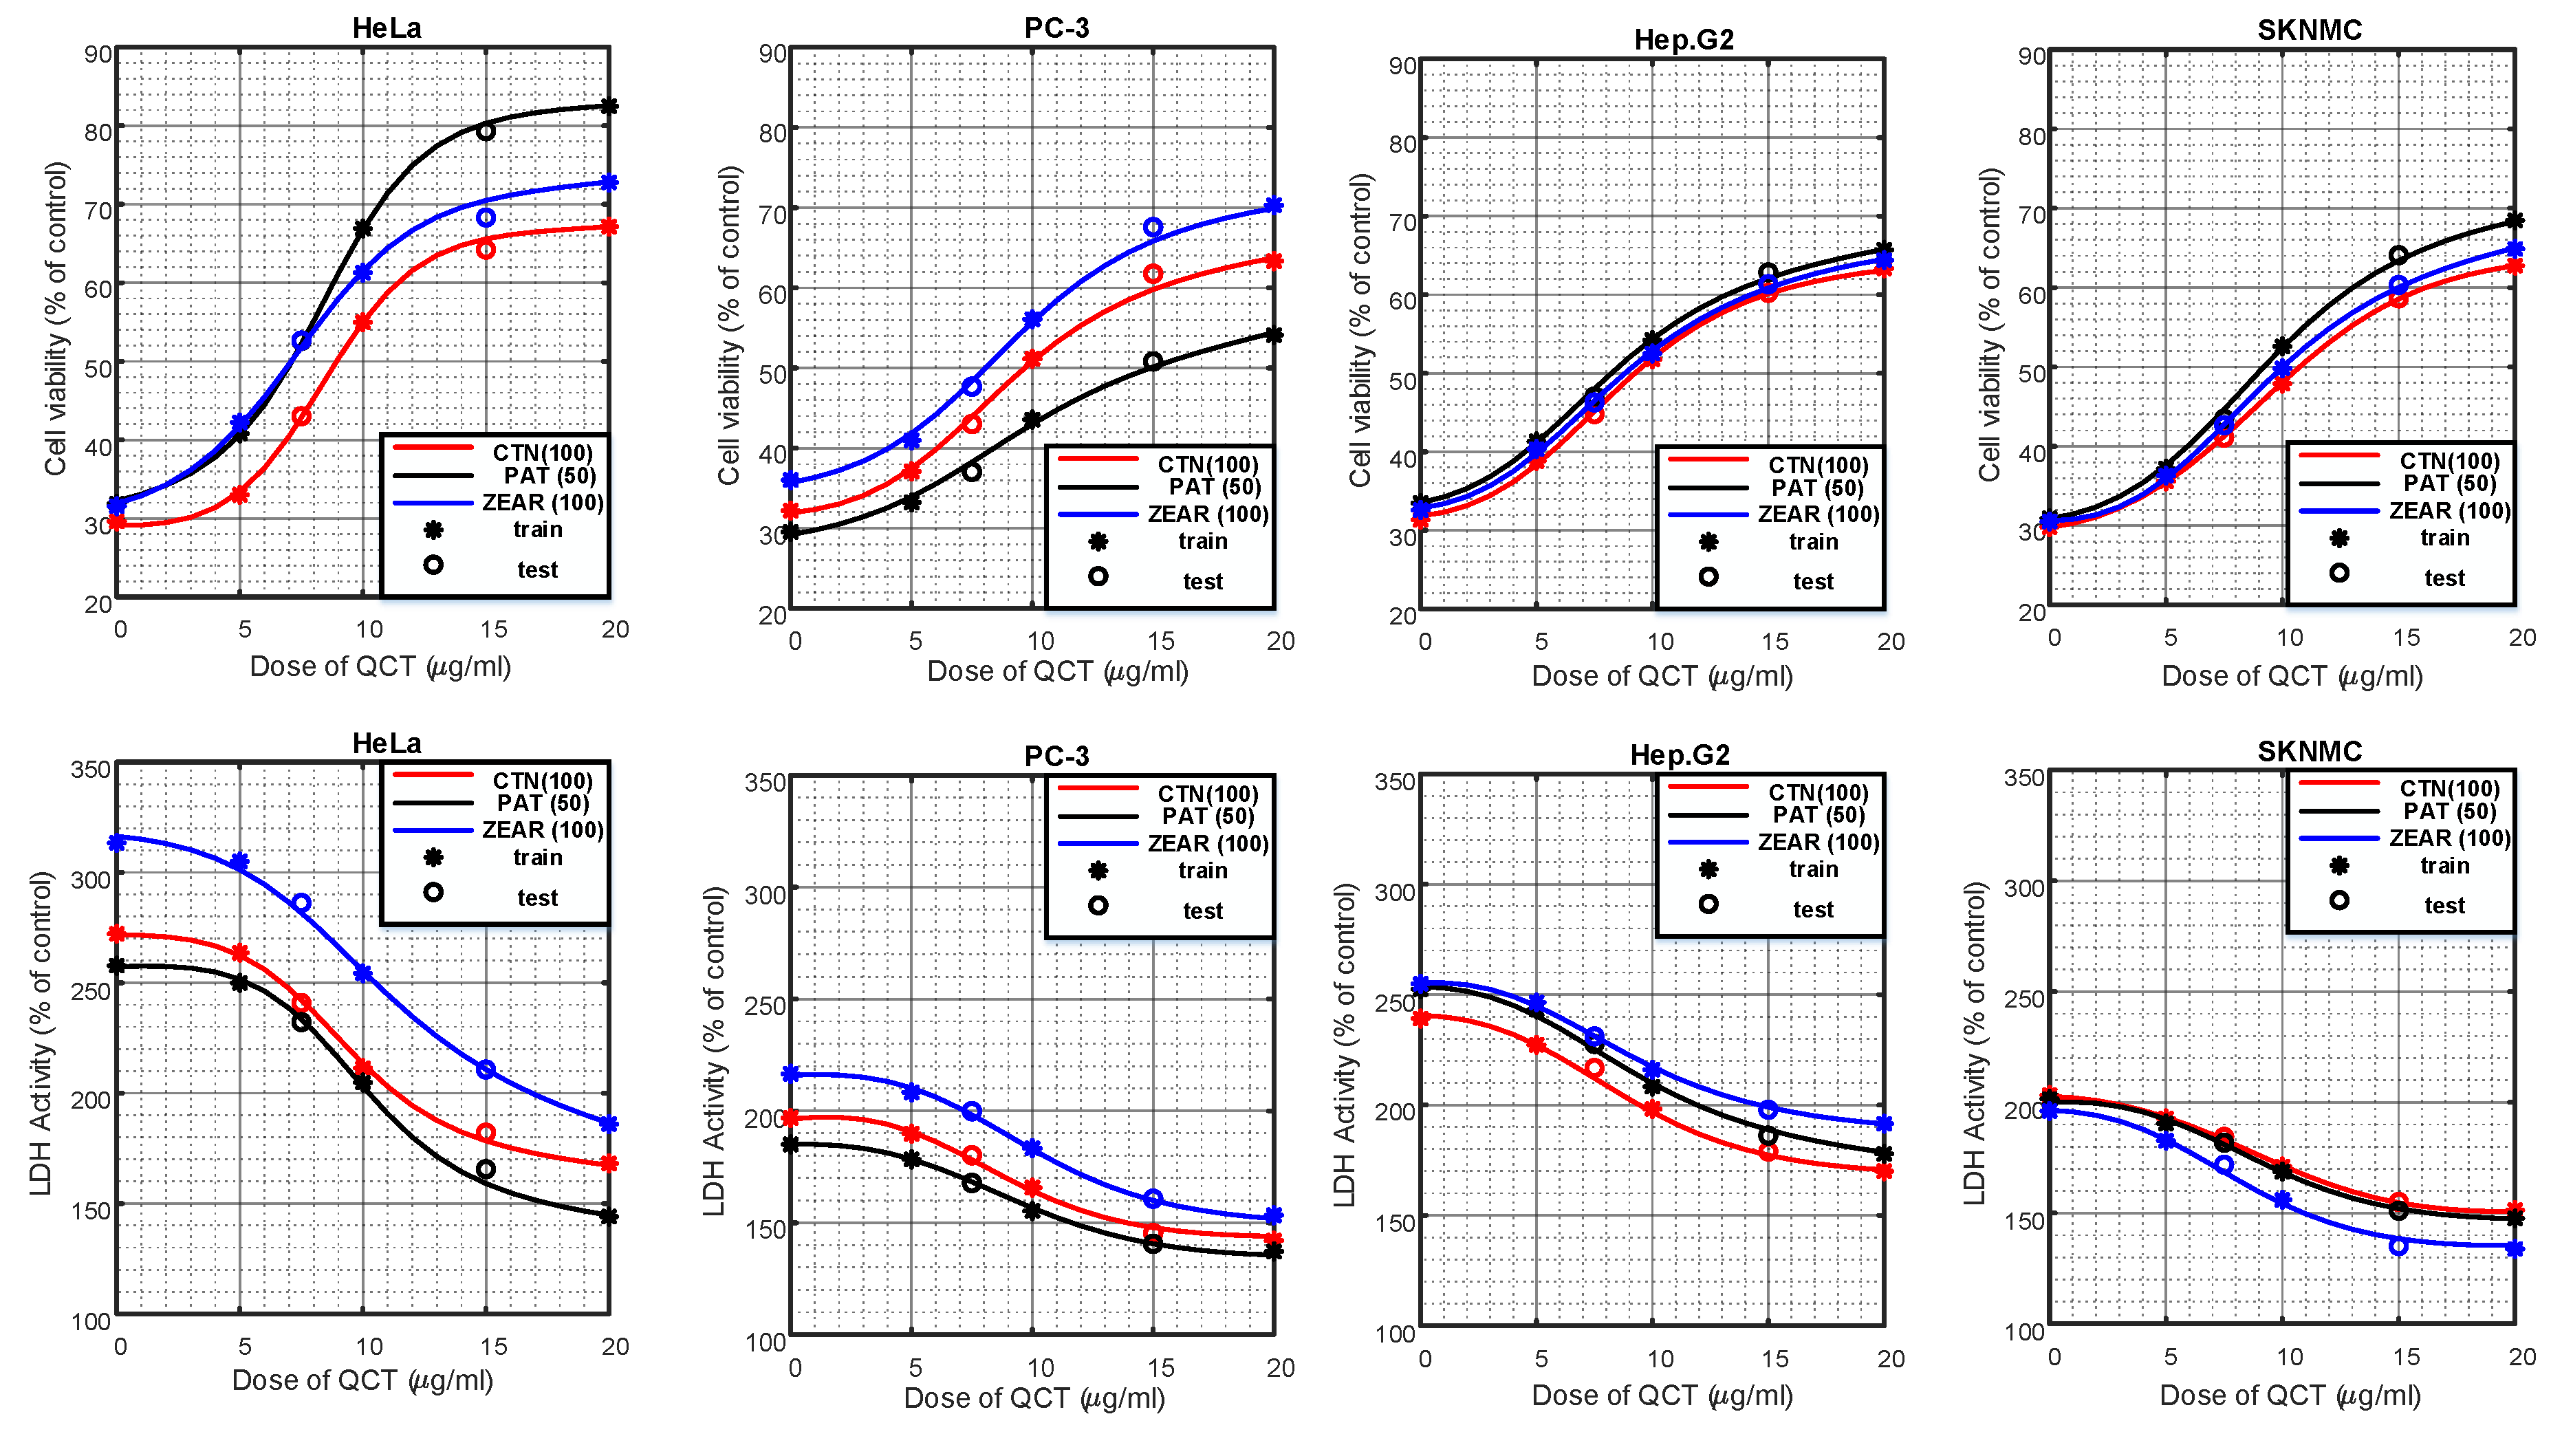
Figure 13.
Cell viability and LDH activity predicted by the neuro-model on different cell lines pretreated with QCT and post-treated with various MTX: CTN (100 µM), PAT (50 µM), and ZEAR (100 µM). ‘*’ marks the locations of training data whereas ‘o’ marks the location of test data.
Figure 13.
Cell viability and LDH activity predicted by the neuro-model on different cell lines pretreated with QCT and post-treated with various MTX: CTN (100 µM), PAT (50 µM), and ZEAR (100 µM). ‘*’ marks the locations of training data whereas ‘o’ marks the location of test data.
Figure 14.
Error in modeling the (a) cell viability and (b) LDH activity on the test data using the artificial neural network.
Figure 14.
Error in modeling the (a) cell viability and (b) LDH activity on the test data using the artificial neural network.
Table 1.
Measured % of inhibition for neural network learning.
Table 1.
Measured % of inhibition for neural network learning.
| Measured % of Inhibition |
|---|
| Types of Cell | Types of MTX | | Dose of MTX (µM) | 0 | 0.78125 | 1.5625 | 3.125 | 6.25 | 12.5 | 25 | 50 | 100 | 200 |
|---|
| Dose of QCT (µg/mL) | |
|---|
| HeLa [25] | CTN | 0.0 | 0.000 | 4.037 | 7.148 | 12.442 | 18.547 | 25.711 | 34.773 | 62.960 | 73.363 | 77.878 |
| 5.0 | 0.000 | 2.552 | 4.725 | 8.745 | 14.436 | 21.066 | 29.509 | 55.722 | 65.976 | 72.426 |
| 10.0 | 0.000 | 1.207 | 2.252 | 4.037 | 7.148 | 11.442 | 17.136 | 34.121 | 48.016 | 60.865 |
| 20.0 | 0.000 | 0.663 | 1.207 | 2.157 | 3.601 | 5.615 | 8.251 | 19.558 | 33.847 | 45.154 |
| PAT | 0.0 | 0.000 | 10.394 | 20.702 | 30.119 | 39.728 | 48.266 | 56.931 | 66.120 | 86.211 | 94.497 |
| 5.0 | 0.000 | 8.528 | 16.427 | 24.212 | 31.912 | 41.947 | 48.993 | 58.207 | 79.298 | 89.532 |
| 10.0 | 0.000 | 3.379 | 5.742 | 9.746 | 12.900 | 19.961 | 26.679 | 33.080 | 58.963 | 73.549 |
| 20.0 | 0.000 | 0.630 | 1.805 | 4.154 | 5.931 | 11.134 | 16.346 | 21.520 | 42.283 | 60.139 |
| ZEAR | 0.0 | 0.000 | 5.744 | 11.029 | 17.033 | 25.506 | 32.597 | 38.322 | 47.308 | 68.444 | 92.675 |
| 5.0 | 0.000 | 4.753 | 8.253 | 14.074 | 20.551 | 27.415 | 31.961 | 39.877 | 57.776 | 80.446 |
| 10.0 | 0.000 | 0.467 | 2.256 | 3.928 | 7.271 | 13.851 | 18.196 | 22.502 | 38.721 | 62.941 |
| 20.0 | 0.000 | 0.396 | 0.829 | 2.104 | 3.426 | 7.433 | 10.569 | 14.425 | 27.220 | 52.217 |
| PC-3 | CTN | 0.0 | 0.000 | 2.746 | 5.031 | 8.530 | 13.621 | 20.016 | 35.176 | 44.174 | 53.834 | 68.469 |
| 5.0 | 0.000 | 2.127 | 4.169 | 6.931 | 10.859 | 17.299 | 33.881 | 42.561 | 51.789 | 66.803 |
| 10.0 | 0.000 | 1.175 | 2.391 | 5.324 | 7.588 | 12.443 | 31.828 | 38.841 | 48.858 | 63.137 |
| 20.0 | 0.000 | 0.595 | 1.422 | 3.591 | 5.422 | 8.888 | 26.740 | 34.864 | 43.502 | 57.151 |
| PAT | 0.0 | 0.000 | 3.871 | 7.305 | 15.559 | 23.058 | 30.820 | 41.563 | 57.171 | 70.441 | 83.875 |
| 5.0 | 0.000 | 3.597 | 5.861 | 11.980 | 19.284 | 25.785 | 37.683 | 55.698 | 66.764 | 80.874 |
| 10.0 | 0.000 | 2.556 | 3.847 | 6.964 | 11.164 | 19.272 | 29.085 | 49.379 | 58.440 | 73.241 |
| 20.0 | 0.000 | 1.120 | 2.094 | 3.409 | 5.186 | 12.736 | 22.571 | 39.810 | 48.884 | 66.569 |
| ZEAR | 0.0 | 0.000 | 3.348 | 4.754 | 7.981 | 16.767 | 31.562 | 40.523 | 51.779 | 60.057 | 69.167 |
| 5.0 | 0.000 | 3.044 | 3.999 | 6.097 | 13.233 | 28.497 | 37.270 | 47.886 | 56.613 | 65.615 |
| 10.0 | 0.000 | 2.188 | 2.750 | 3.923 | 8.593 | 21.893 | 30.612 | 40.493 | 49.285 | 57.291 |
| 20.0 | 0.000 | 1.802 | 1.921 | 2.129 | 3.302 | 11.109 | 20.825 | 31.898 | 40.543 | 48.546 |
| Hep G2 | CTN | 0.0 | 0.000 | 0.357 | 2.480 | 11.010 | 17.209 | 24.668 | 32.108 | 41.636 | 52.204 | 67.657 |
| 5.0 | 0.000 | 0.278 | 2.293 | 8.824 | 14.740 | 21.952 | 29.435 | 38.582 | 49.717 | 65.390 |
| 10.0 | 0.000 | 0.135 | 1.160 | 5.596 | 11.123 | 17.181 | 23.743 | 31.516 | 42.822 | 59.160 |
| 20.0 | 0.000 | 0.022 | 0.777 | 2.847 | 6.236 | 11.694 | 18.509 | 25.229 | 35.645 | 53.168 |
| PAT | 0.0 | 0.000 | 2.571 | 5.199 | 8.137 | 16.763 | 25.955 | 37.198 | 43.070 | 53.062 | 69.132 |
| 5.0 | 0.000 | 1.695 | 3.327 | 5.707 | 11.952 | 23.024 | 34.639 | 40.480 | 50.132 | 67.178 |
| 10.0 | 0.000 | 0.879 | 1.535 | 3.295 | 10.396 | 19.582 | 31.226 | 36.960 | 46.394 | 63.472 |
| 20.0 | 0.000 | 0.250 | 0.565 | 1.304 | 6.122 | 16.175 | 26.296 | 31.880 | 40.779 | 56.756 |
| ZEAR | 0.0 | 0.000 | 2.451 | 4.555 | 8.583 | 15.487 | 25.169 | 31.310 | 40.590 | 55.180 | 69.852 |
| 5.0 | 0.000 | 1.851 | 3.565 | 6.963 | 13.048 | 22.278 | 28.300 | 37.765 | 51.332 | 66.941 |
| 10.0 | 0.000 | 1.291 | 2.495 | 4.820 | 9.110 | 16.094 | 21.458 | 30.619 | 44.090 | 59.257 |
| 20.0 | 0.000 | 0.682 | 1.471 | 3.153 | 6.551 | 12.379 | 17.782 | 25.190 | 38.595 | 53.895 |
| SK-N-MC | CTN | 0.0 | 0.000 | 5.149 | 9.054 | 15.030 | 24.020 | 33.060 | 44.460 | 54.860 | 70.190 | 89.515 |
| 5.0 | 0.000 | 4.116 | 7.303 | 12.658 | 20.801 | 29.273 | 41.660 | 52.521 | 67.797 | 86.988 |
| 10.0 | 0.000 | 2.554 | 4.578 | 8.514 | 14.904 | 23.242 | 35.788 | 44.936 | 59.906 | 77.792 |
| 20.0 | 0.000 | 1.256 | 2.702 | 5.280 | 9.363 | 16.641 | 27.459 | 35.506 | 49.598 | 63.050 |
| PAT | 0.0 | 0.000 | 3.830 | 7.512 | 13.157 | 22.759 | 39.909 | 52.706 | 69.069 | 78.993 | 89.176 |
| 5.0 | 0.000 | 3.215 | 6.264 | 11.385 | 20.793 | 36.114 | 49.039 | 64.793 | 74.542 | 85.105 |
| 10.0 | 0.000 | 2.680 | 4.963 | 9.308 | 17.370 | 31.163 | 44.130 | 59.581 | 68.837 | 79.193 |
| 20.0 | 0.000 | 1.585 | 3.099 | 6.162 | 12.077 | 21.915 | 31.908 | 48.888 | 58.464 | 64.169 |
| ZEAR | 0.0 | 0.000 | 6.051 | 10.256 | 14.708 | 19.469 | 26.018 | 36.300 | 53.844 | 75.113 | 80.588 |
| 5.0 | 0.000 | 4.359 | 7.981 | 11.581 | 15.744 | 22.170 | 32.511 | 49.840 | 72.063 | 78.304 |
| 10.0 | 0.000 | 2.279 | 4.224 | 6.678 | 10.003 | 15.094 | 24.568 | 40.715 | 65.506 | 72.174 |
| 20.0 | 0.000 | 1.370 | 2.463 | 4.262 | 6.809 | 10.899 | 18.943 | 33.655 | 55.343 | 60.131 |
Table 2.
Performance comparison of a single hidden layer neural network by varying the number of nodes in the hidden layer.
Table 2.
Performance comparison of a single hidden layer neural network by varying the number of nodes in the hidden layer.
| No. of Hidden Nodes | Train RMSE | Validation RMSE |
|---|
| 5 | 0.0302 | 0.0282 |
| 7 | 0.0247 | 0.0278 |
| 10 | 0.0223 | 0.0245 |
| 12 | 0.0202 | 0.0208 |
| 15 | 0.0214 | 0.0198 |
| 17 | 0.0200 | 0.0211 |
| 20 | 0.0197 | 0.0190 |
| 22 | 0.0203 | 0.0194 |
| 25 | 0.0200 | 0.0236 |
| 27 | 0.0187 | 0.0192 |
| 30 | 0.0188 | 0.0190 |
| 32 | 0.0193 | 0.0203 |
Table 3.
Performance comparison of a two hidden layer neural network by varying the number of nodes in the last hidden layer. The first and the second elements of the No. of Hidden Nodes are node numbers of the first and the second hidden layers, respectively.
Table 3.
Performance comparison of a two hidden layer neural network by varying the number of nodes in the last hidden layer. The first and the second elements of the No. of Hidden Nodes are node numbers of the first and the second hidden layers, respectively.
| No. of Hidden Nodes | Train RMSE | Validation RMSE |
|---|
| (20, 3) | 0.0129 | 0.0150 |
| (20, 6) | 0.0110 | 0.0173 |
| (20, 9) | 0.0109 | 0.0162 |
| (20, 12) | 0.0113 | 0.0161 |
| (20, 15) | 0.0106 | 0.0147 |
| (20, 18) | 0.0105 | 0.0153 |
| (20, 21) | 0.0108 | 0.0151 |
Table 4.
Performance of the final 9-20-15-1 network on the train and test dataset.
Table 4.
Performance of the final 9-20-15-1 network on the train and test dataset.
| Network | Train RMSE | Test RMSE |
|---|
| 9-20-15-1 | 0.0110 | 0.0111 |
Table 5.
Performance comparison of a single hidden layer neural network by varying the number of nodes in the hidden layer.
Table 5.
Performance comparison of a single hidden layer neural network by varying the number of nodes in the hidden layer.
| No. of Hidden Nodes | Train RMSE | Validation RMSE |
|---|
| 5 | 0.0253 | 0.0597 |
| 7 | 0.0226 | 0.0943 |
| 10 | 0.0174 | 0.0540 |
| 12 | 0.0175 | 0.0737 |
| 15 | 0.0192 | 0.0721 |
| 17 | 0.0197 | 0.0937 |
| 20 | 0.0100 | 0.0545 |
| 22 | 0.0190 | 0.0830 |
| 25 | 0.0175 | 0.0892 |
| 27 | 0.0205 | 0.0852 |
| 30 | 0.0116 | 0.0637 |
| 32 | 0.0193 | 0.0851 |
Table 6.
Performance comparison of a two hidden layer neural network by varying the number of nodes in the last hidden layer. The first and the second elements of the No. of Hidden Nodes are node number of the first and the second hidden layers, respectively.
Table 6.
Performance comparison of a two hidden layer neural network by varying the number of nodes in the last hidden layer. The first and the second elements of the No. of Hidden Nodes are node number of the first and the second hidden layers, respectively.
| No. of Hidden Nodes | Train RMSE | Validation RMSE |
|---|
| (10, 2) | 0.0100 | 0.0612 |
| (10,4) | 0.0100 | 0.0450 |
| (10, 6) | 0.0100 | 0.0384 |
| (10, 8) | 0.0114 | 0.0338 |
| (10, 10) | 0.0100 | 0.0337 |
Table 7.
Performance of the final 9-10-10-2 network on the train and test dataset.
Table 7.
Performance of the final 9-10-10-2 network on the train and test dataset.
| Network | Train RMSE | Test RMSE |
|---|
| 9-10-10-2 | 0.0052 | 0.0364 |

 ,
, 


