Epigenetic Suppression of the T-box Subfamily 2 (TBX2) in Human Non-Small Cell Lung Cancer

 , and
, and 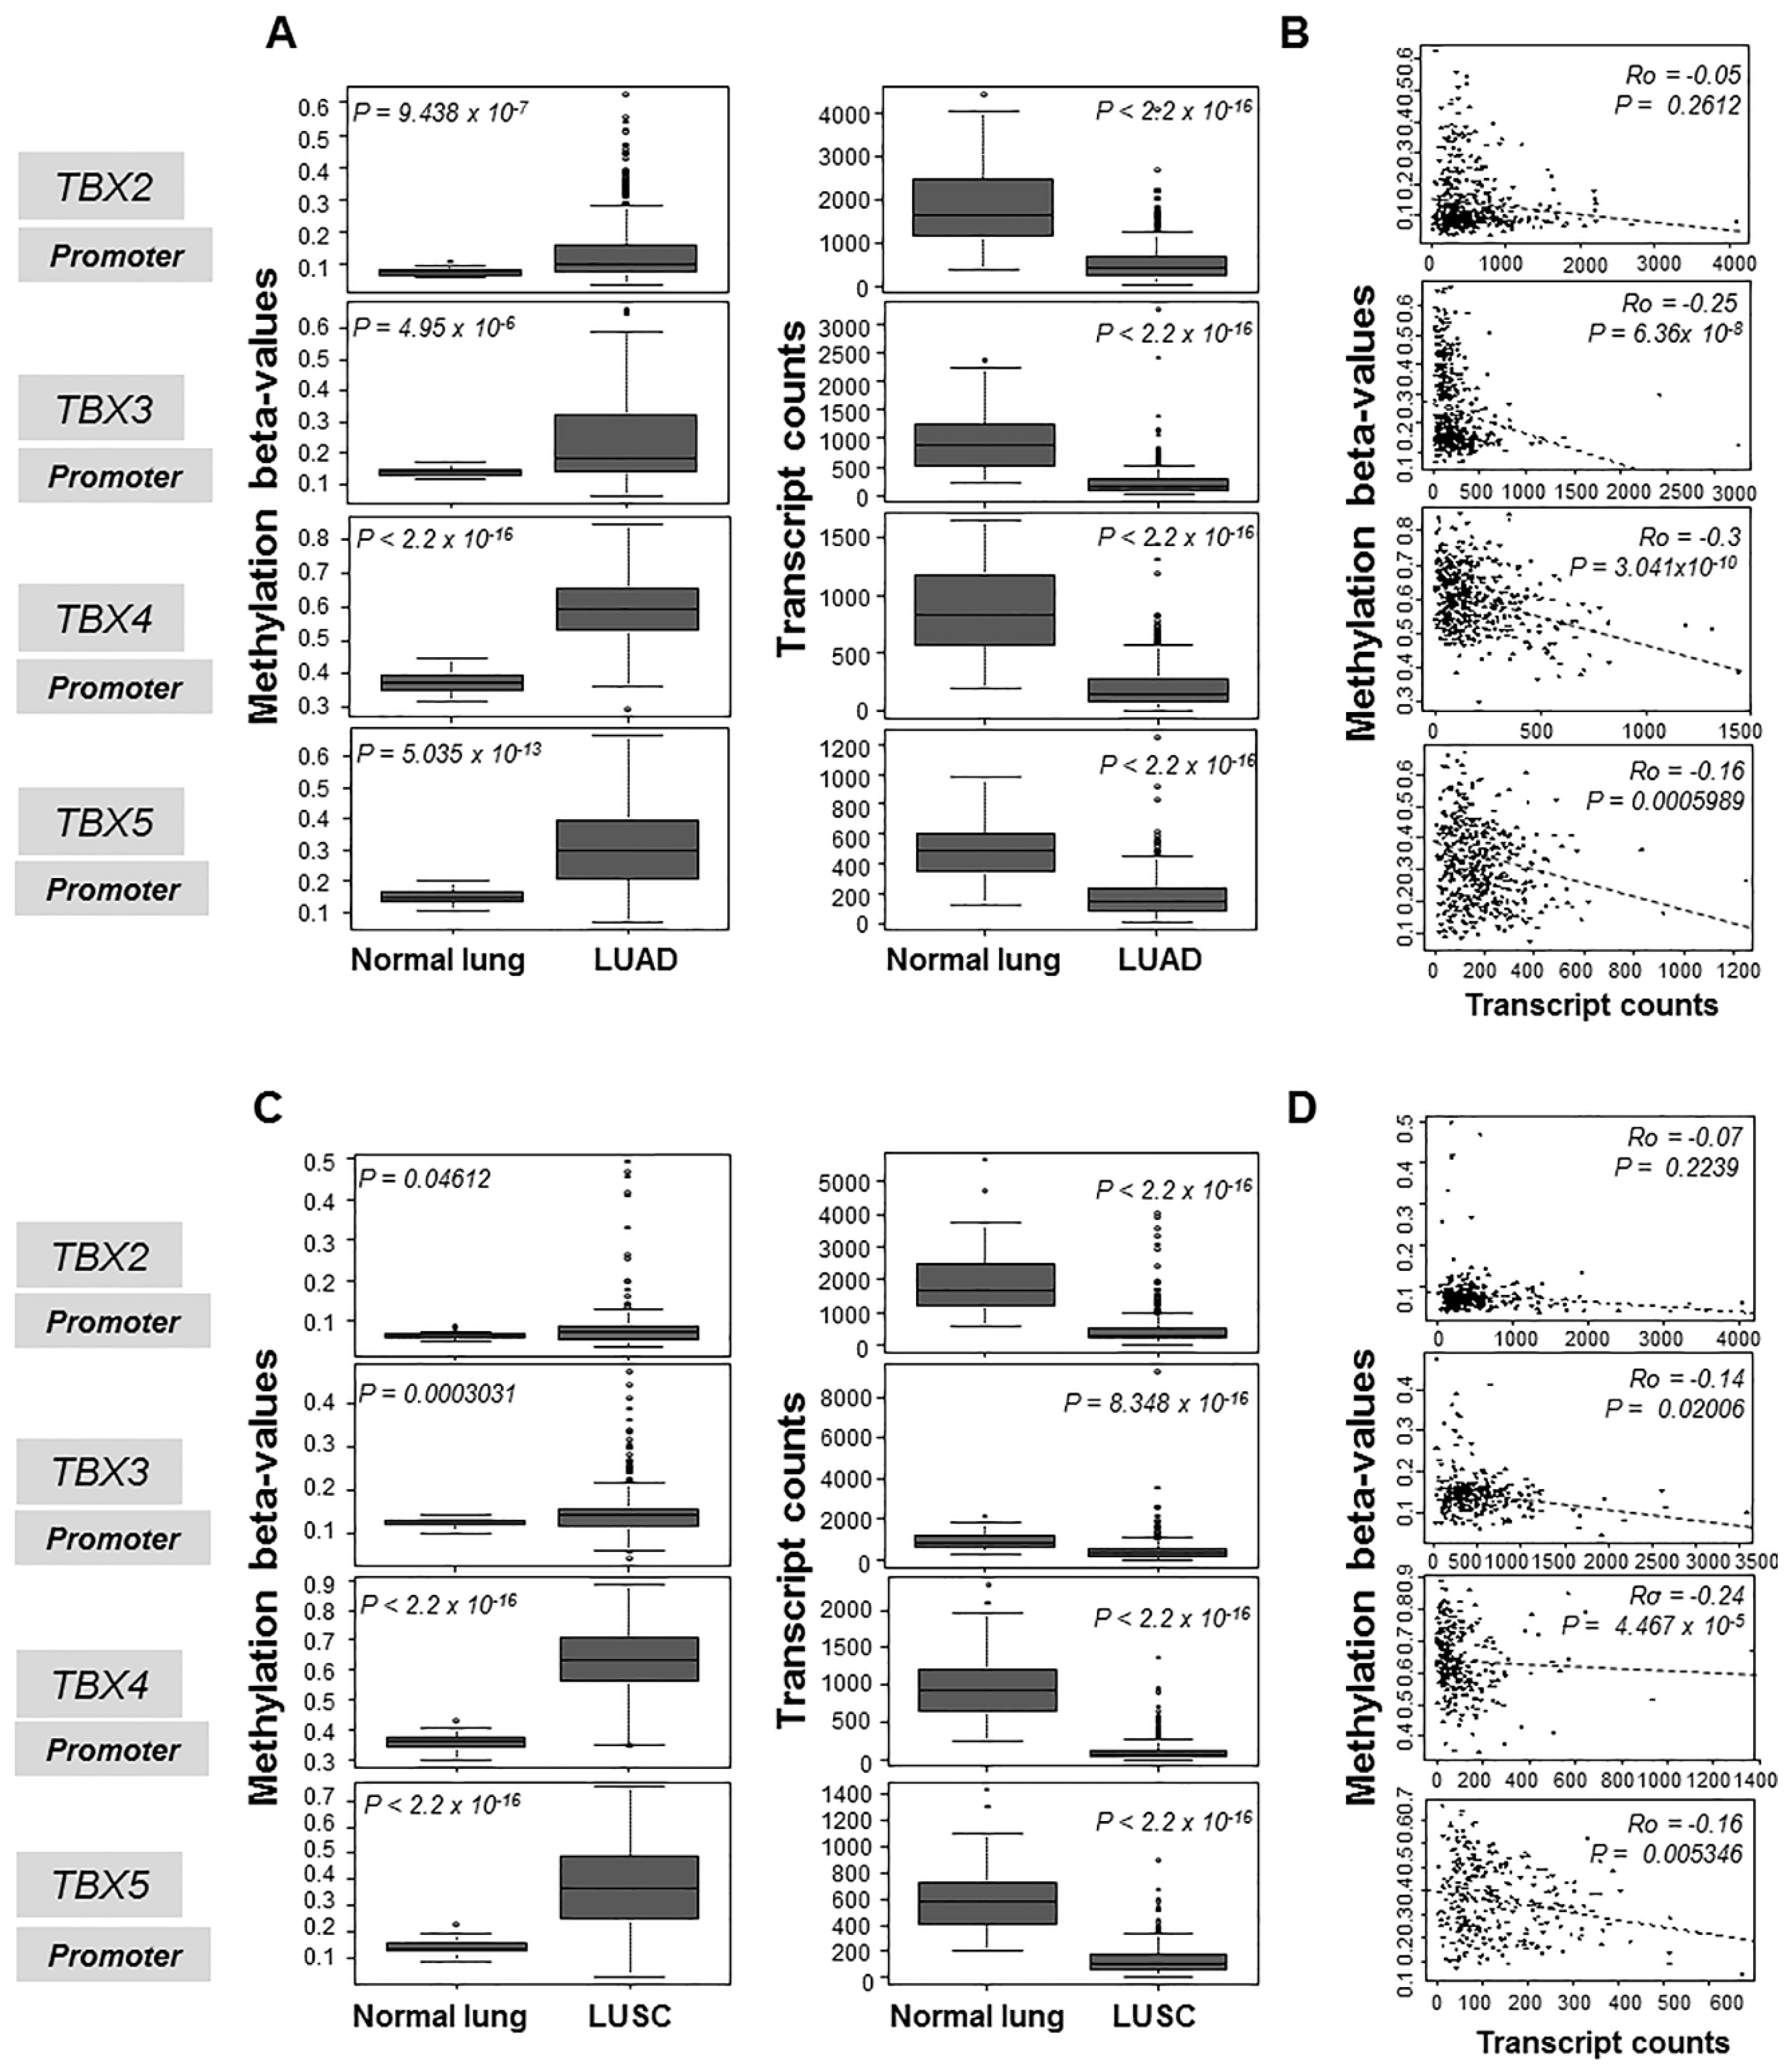
Abstract
1. Introduction
2. Results
2.1. Hypermethylation and Suppressed mRNA Expression of the TBX2 Subfamily in Human NSCLC
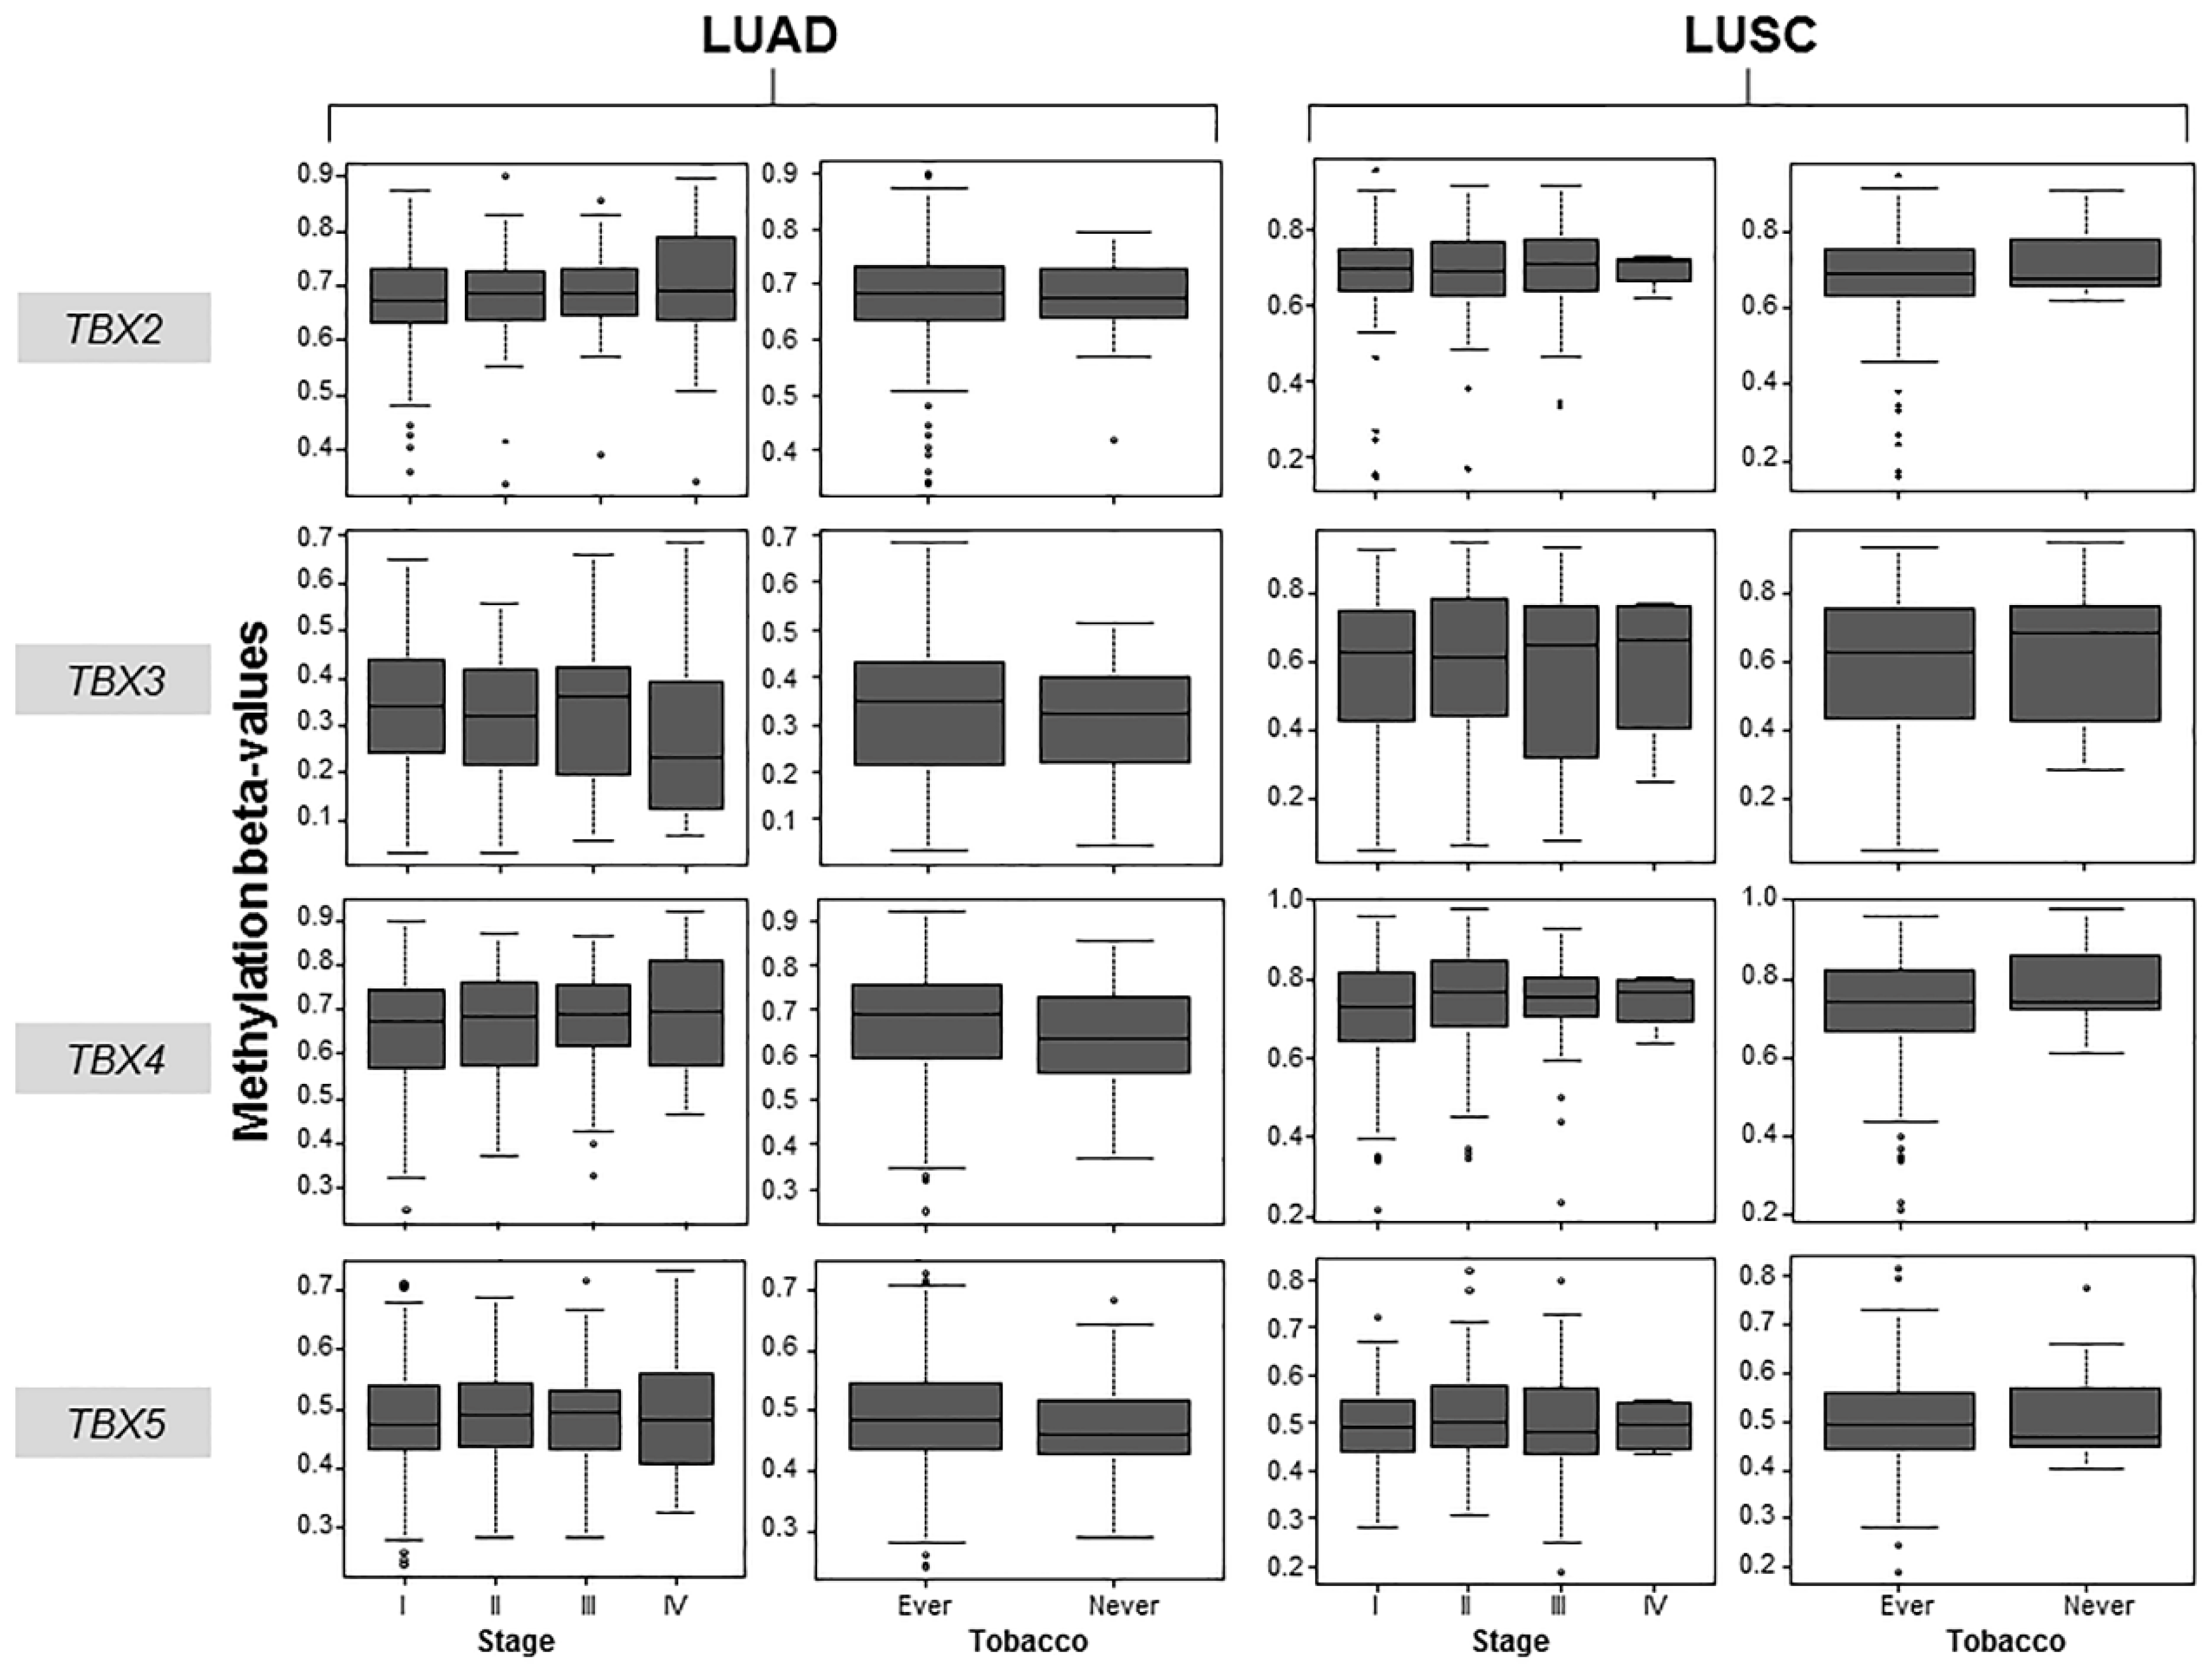
2.2. Association of TBX2 Subfamily Hypermethylation with Clinicopathological Features in Human Clinical NSCLC Samples
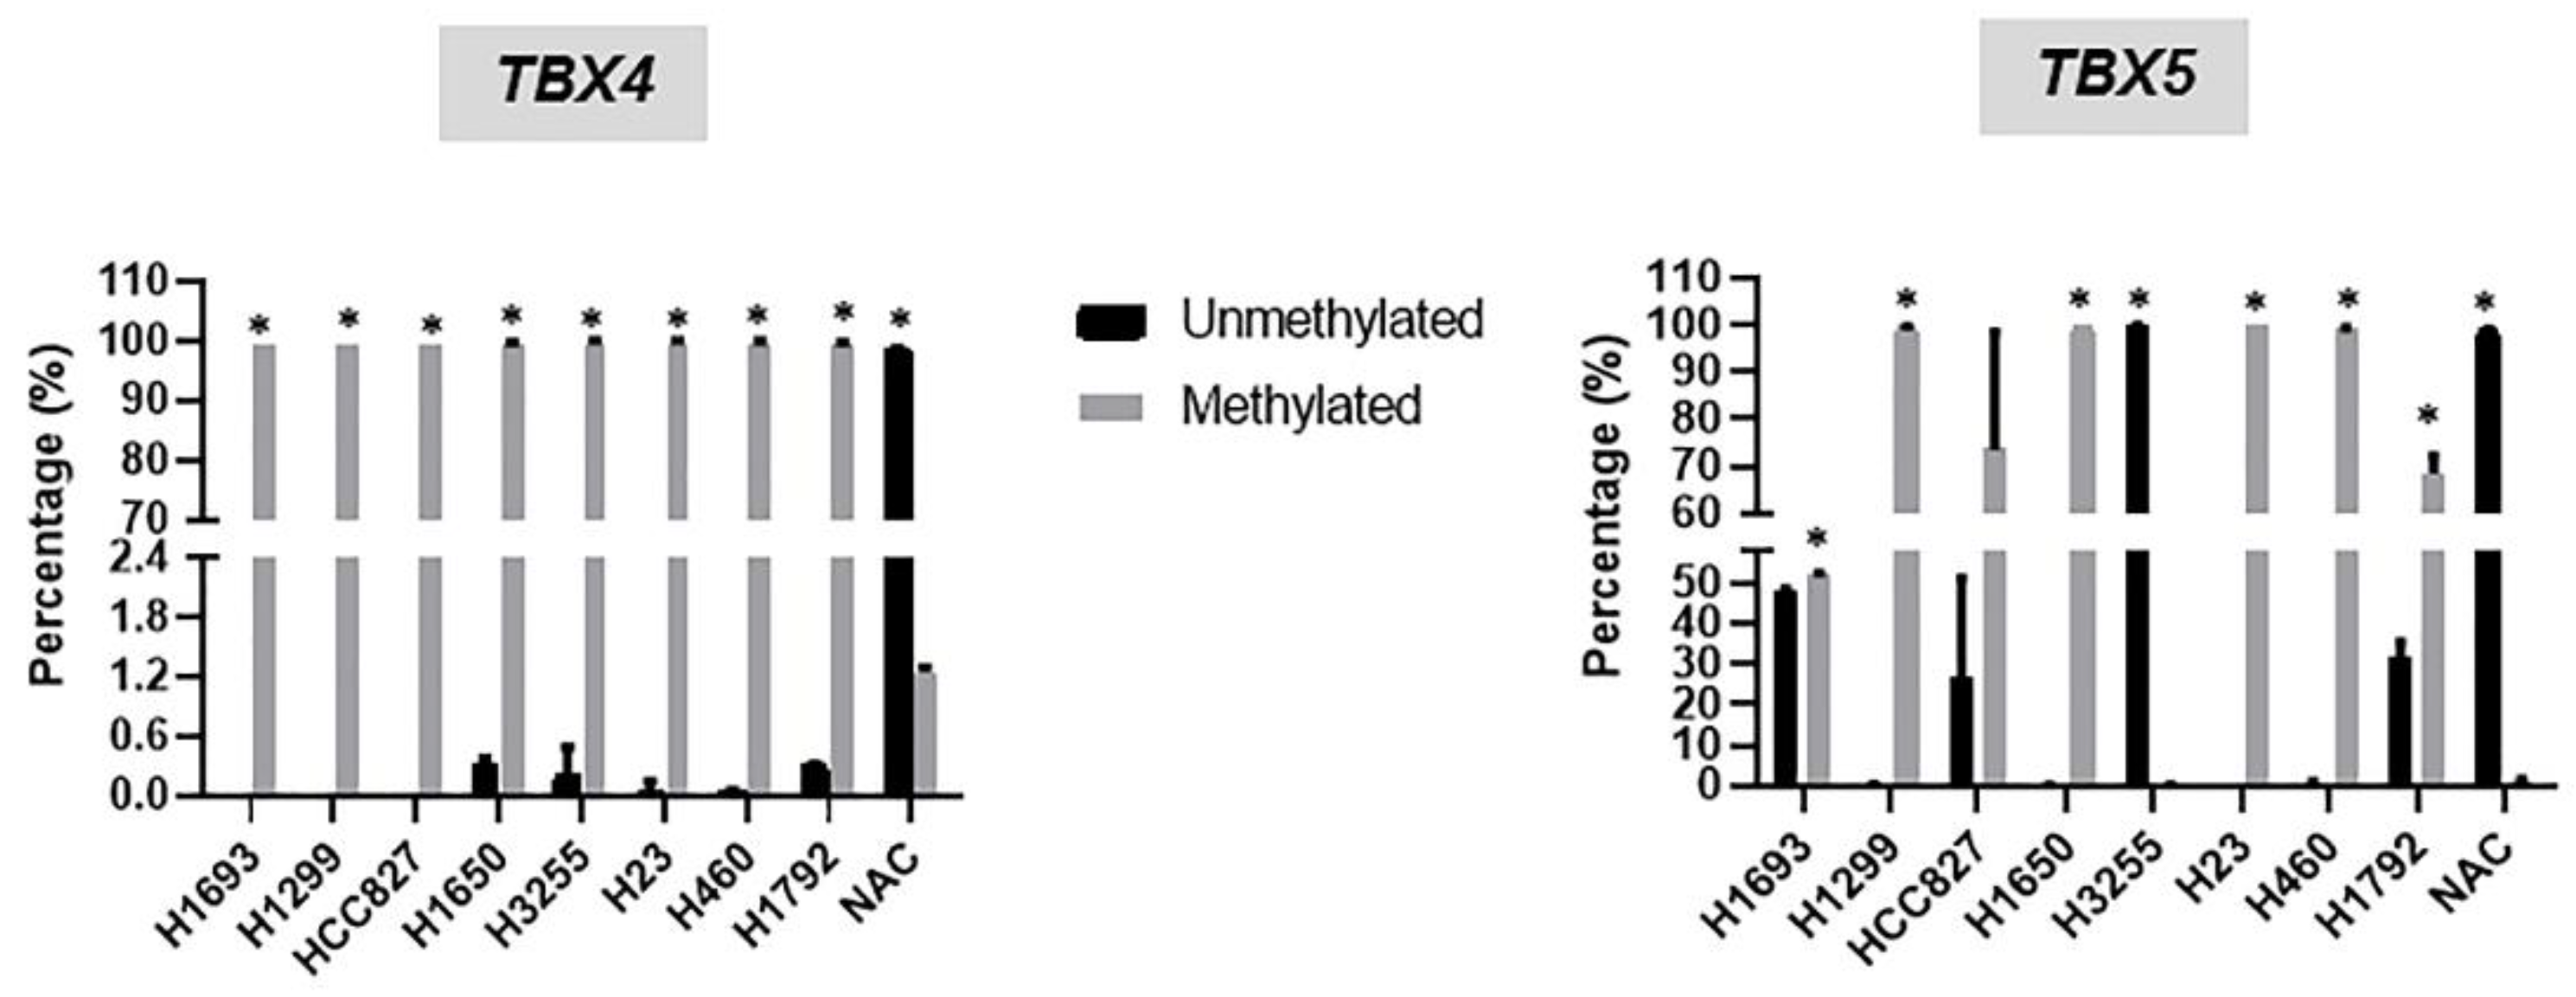
2.3. Hypermethylation and Suppressed mRNA Expression of TBX2 Subfamily Members in NSCLC Cell Lines Relative to Normal Alveolar Cells (NAC)
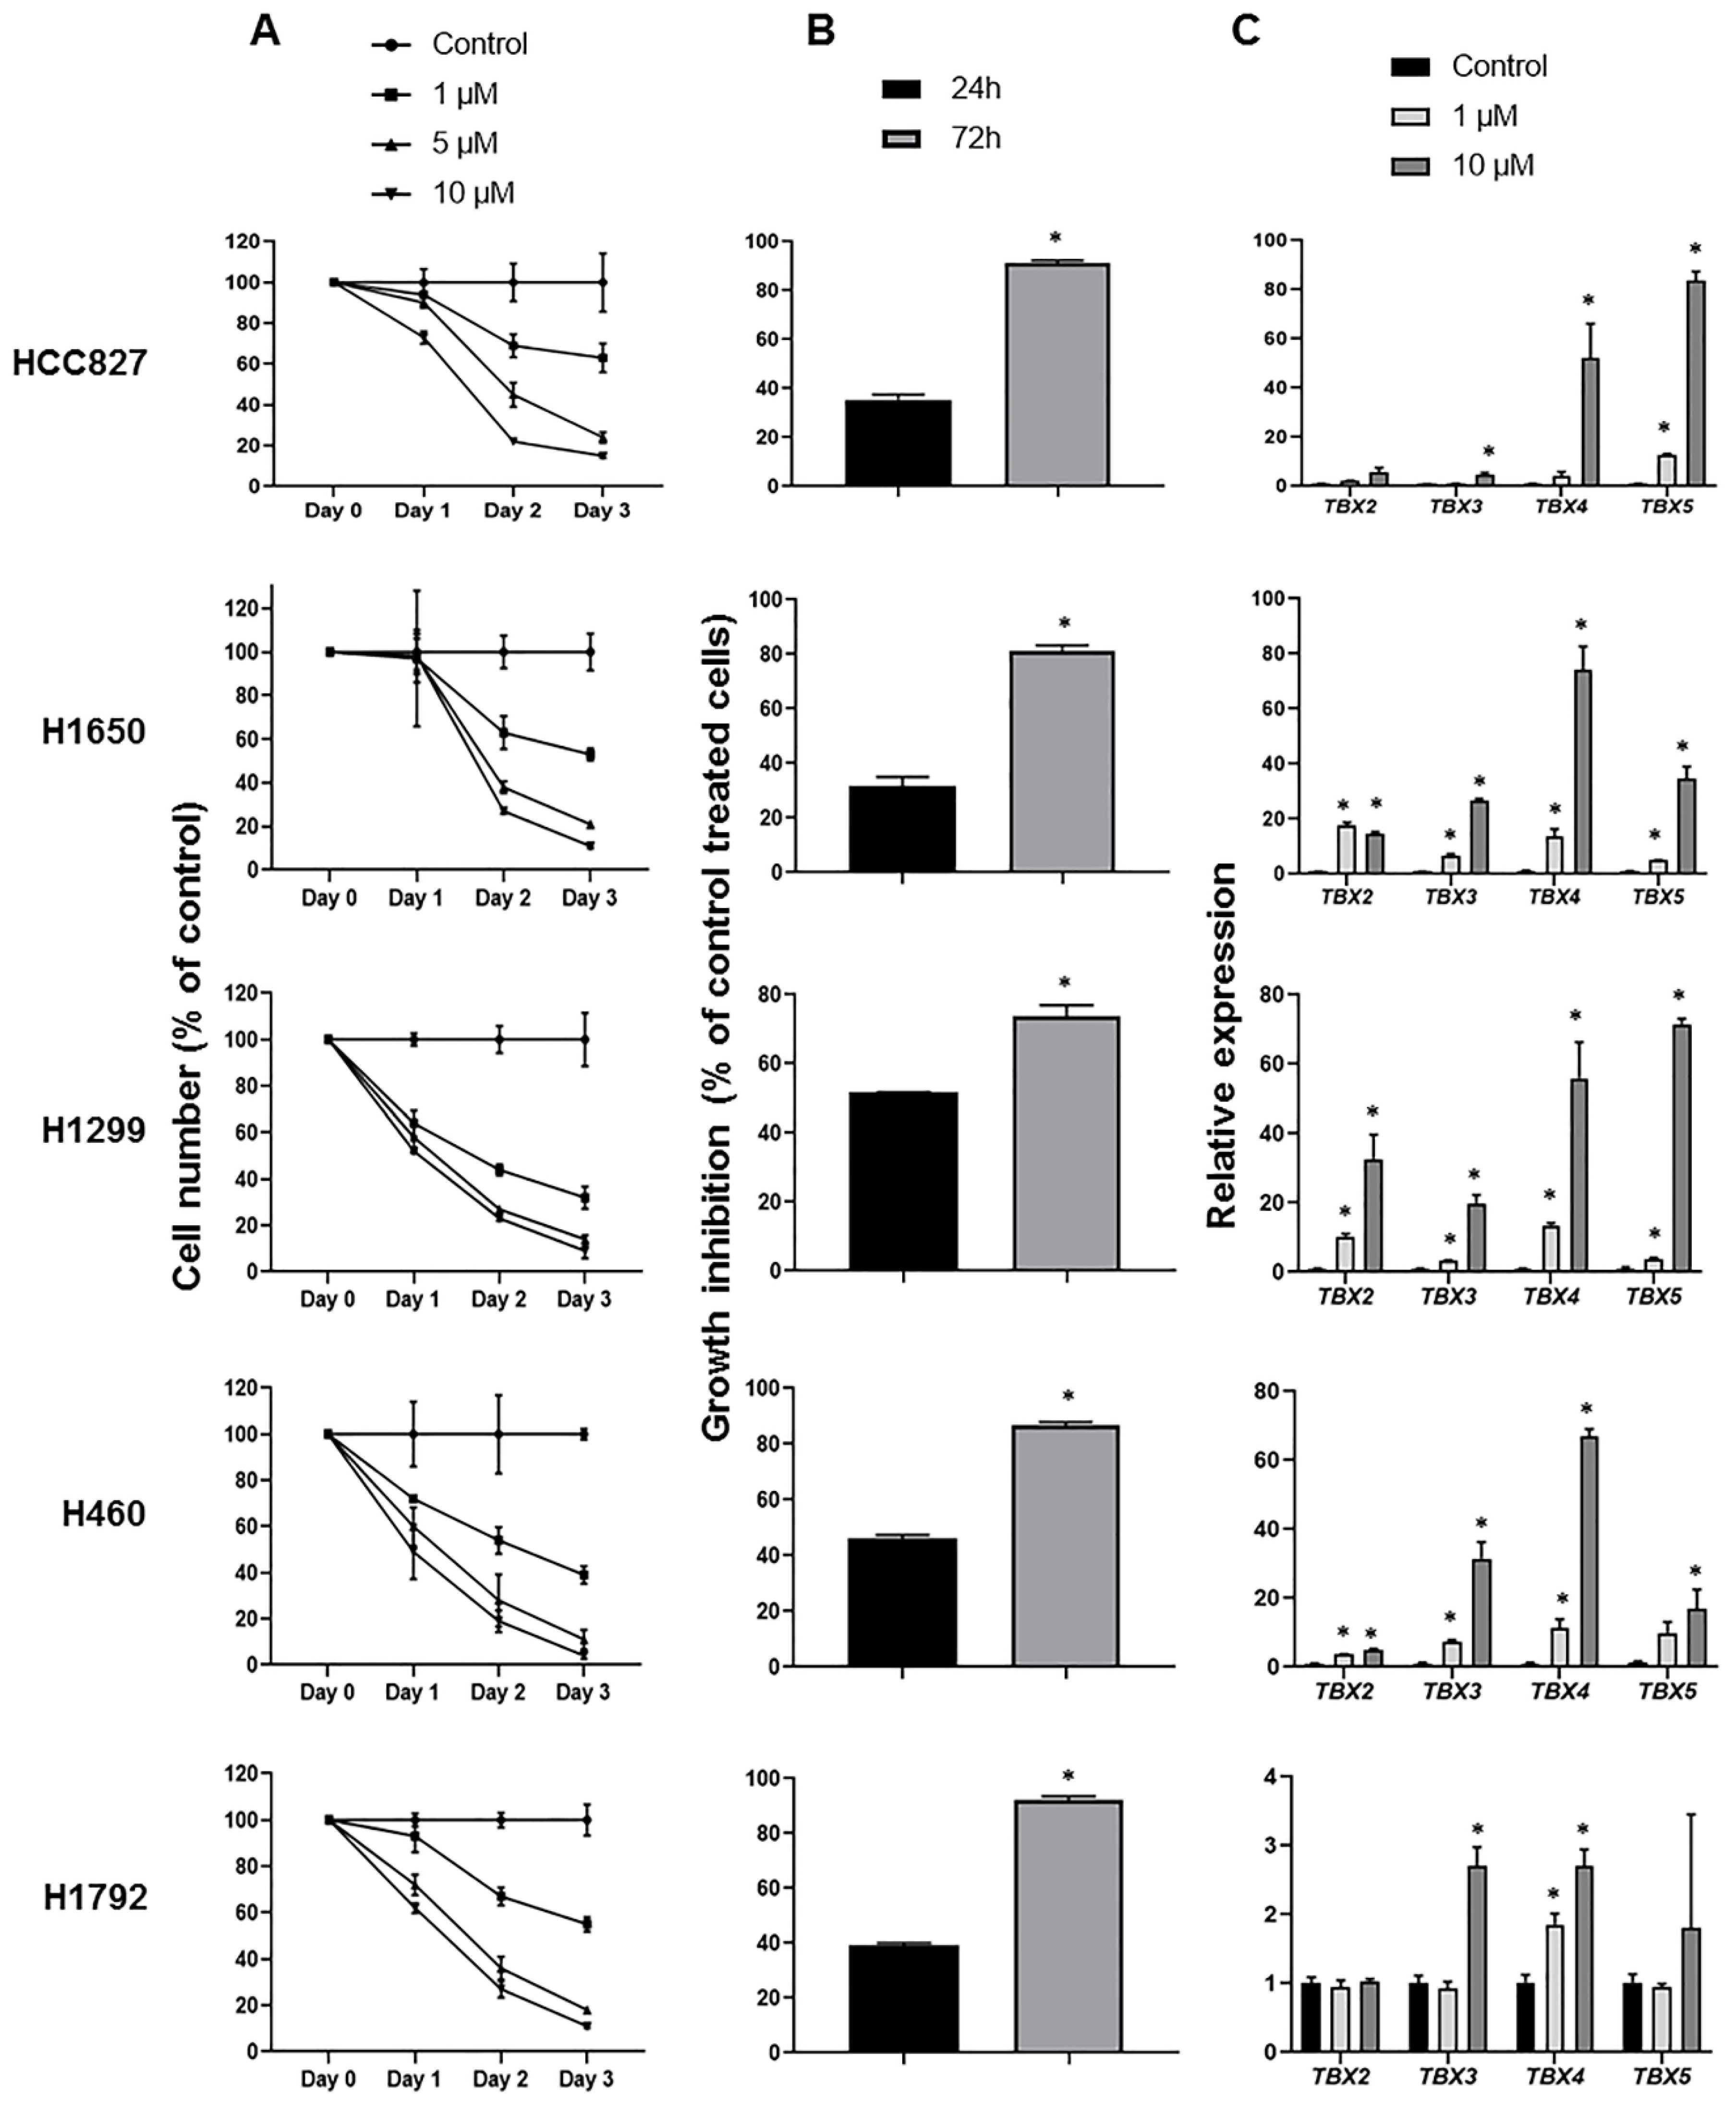
2.4. Induction of TBX2 Subfamily Expression following Treatment with the DNA Methyltransferase Inhibitor 5-Azacytidine
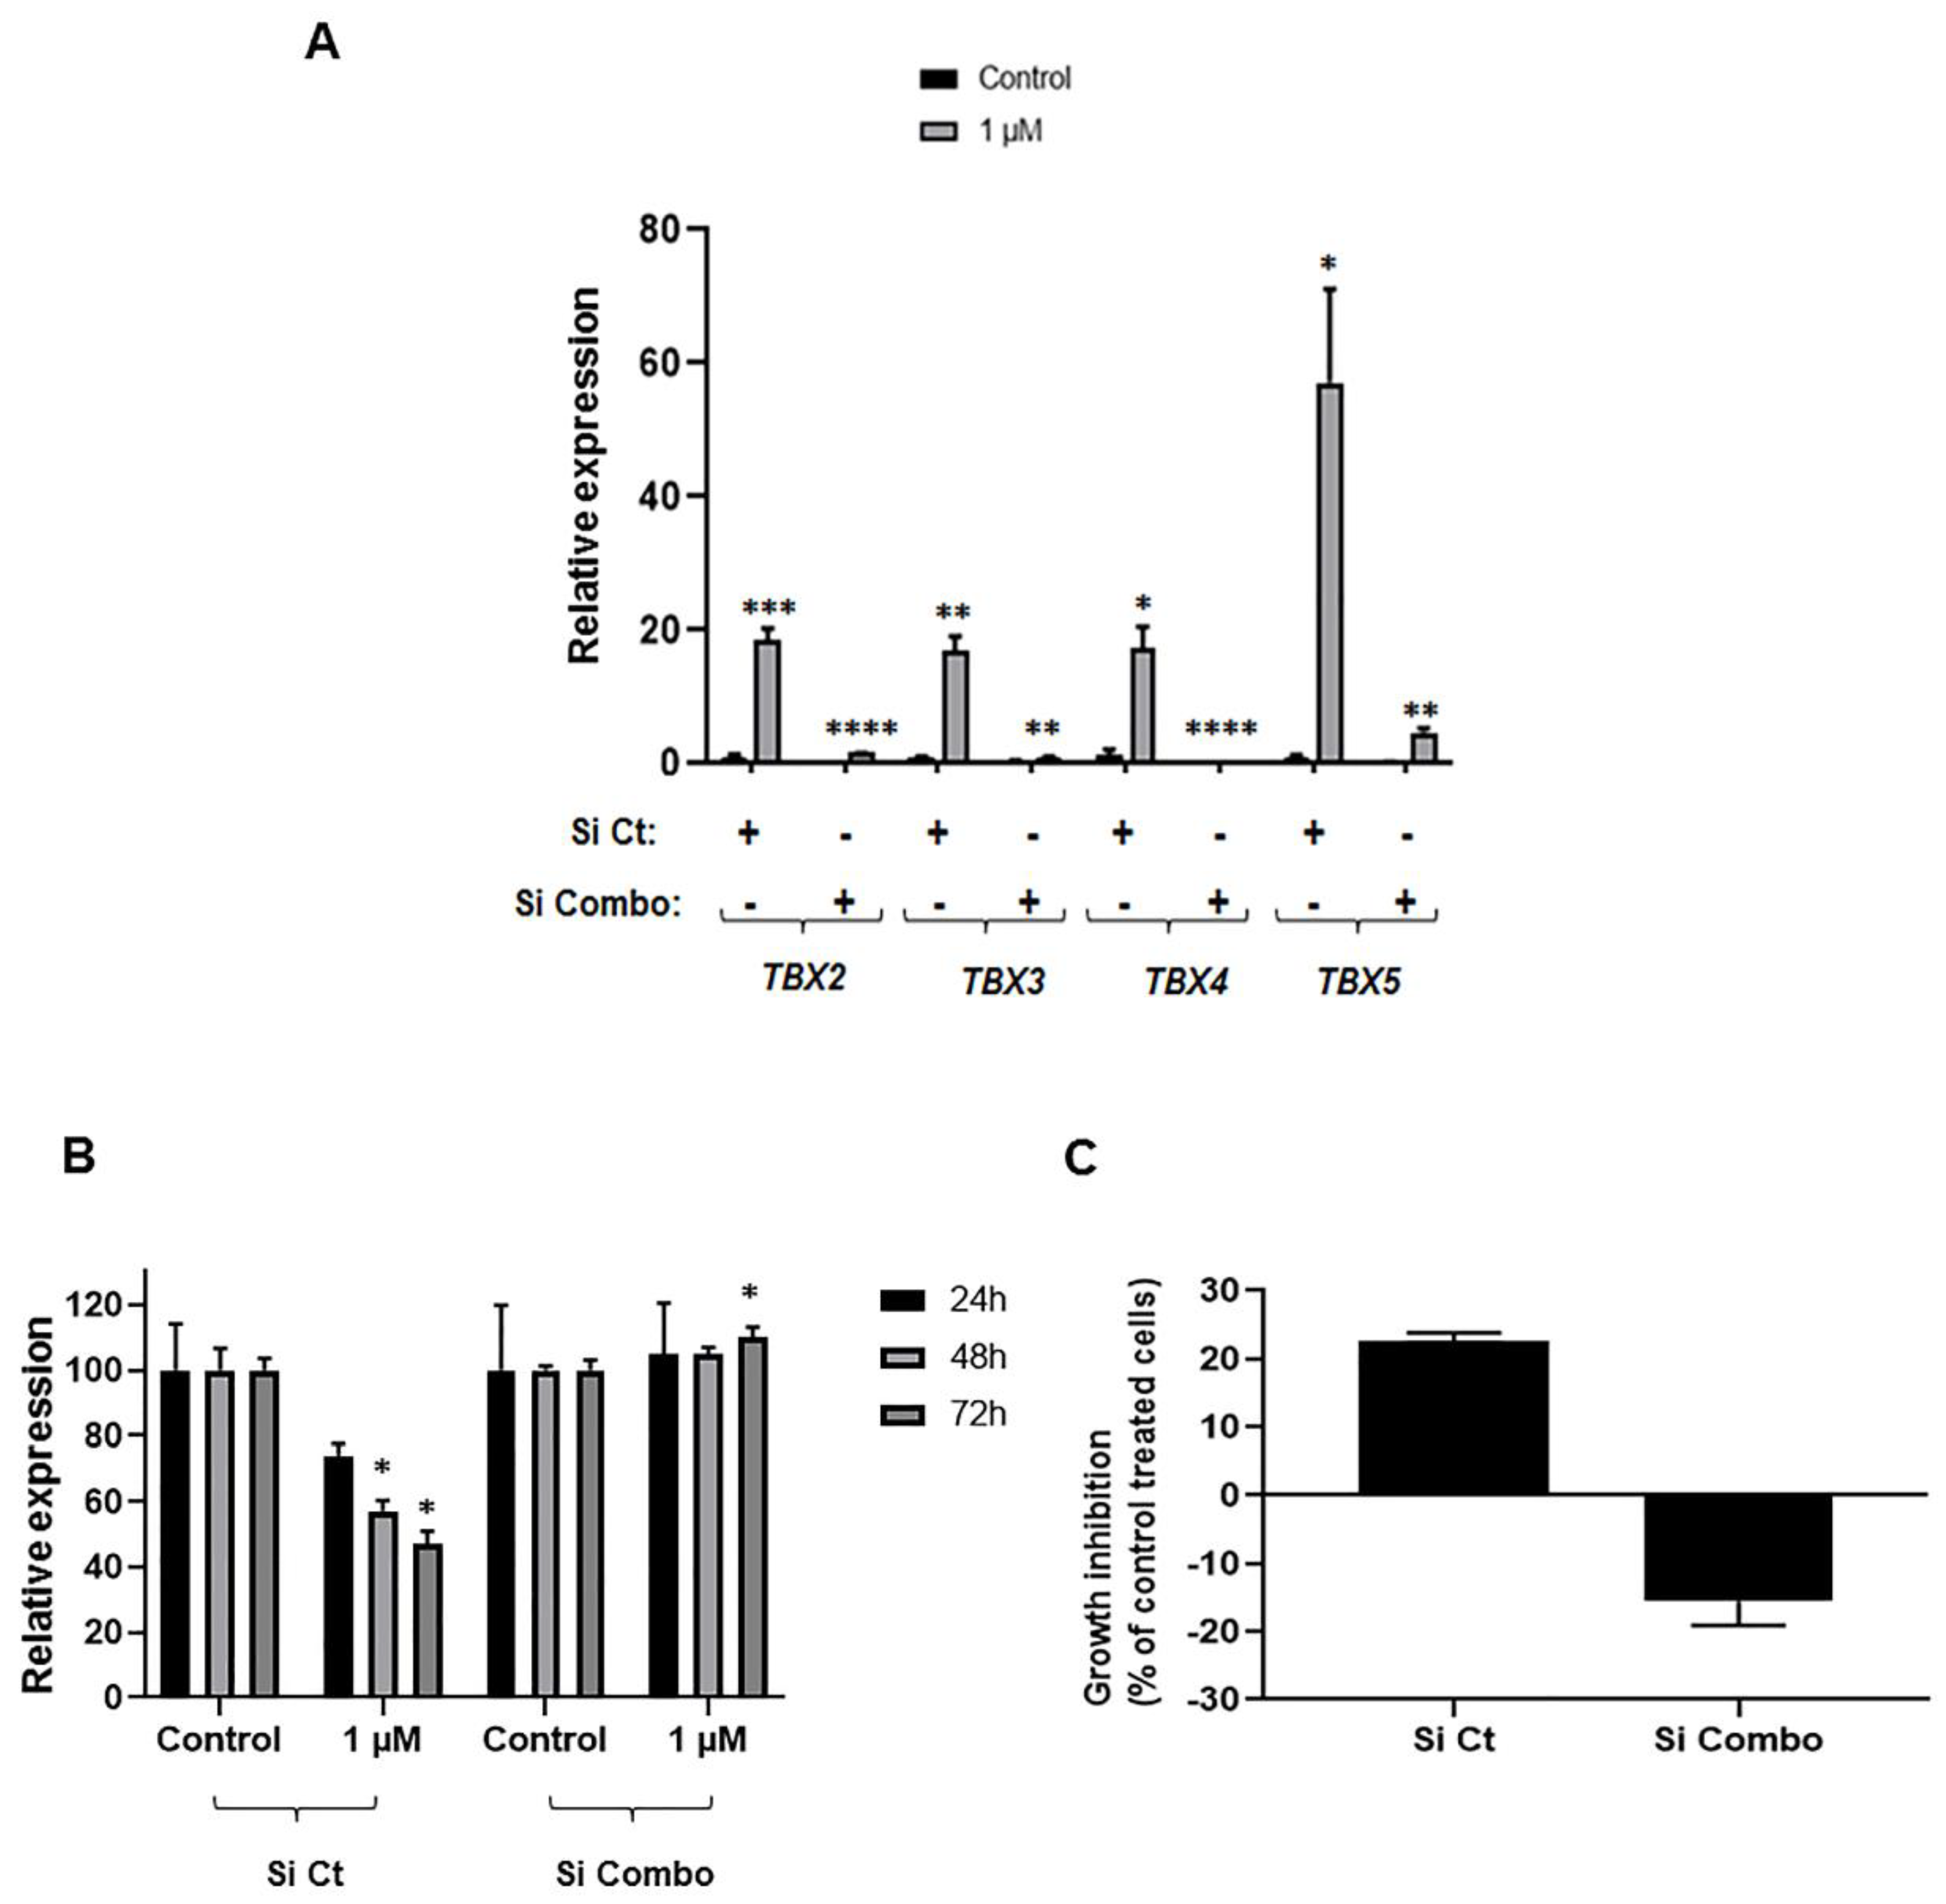
2.5. Impact of TBX2 Subfamily Knockdown on Anti-Growth Effects of 5-Azacytidine in NSCLC Cells
3. Discussion
4. Materials and Methods
4.1. In Silico Analysis of TBX2 Subfamily Methylation and Expression in Clinical Human NSCLC Samples
4.2. Cell Culture
4.3. DNA and RNA Isolation
4.4. Two-Step Quantitative Real-Time Polymerase Chain Reaction (qRT-PCR)
4.5. Methylation-Specific PCR (MSP-PCR)
4.6. Lung Cancer Cell Treatment with 5-Azacytidine
4.6.1. 5-Azacytidine Preparation
4.6.2. MTT Assay
4.6.3. Trypan Blue Exclusion Assay
4.7. Transfection with Small Interfering RNAs
4.8. Statistical Analysis
5. Conclusions
Supplementary Materials
Author Contributions
Funding
Conflicts of Interest
Abbreviations
| Aza | 5-azacytidine |
| DMEM | Dulbecco’s modified eagle media |
| DMSO | dimethyl sulfoxide |
| FBS | fetal bovine serum |
| GAPDH | glyceraldehyde 3-phosphate dehydrogenase |
| LUAD | lung adenocarcinoma |
| LUSC | lung squamous cell carcinoma |
| MSP | methylation specific PCR |
| NSCLC | non-small cell lung cancer |
| PBS | phosphate buffered saline |
| siRNA | small interfering RNA |
| TBX | T-box gene |
| TCGA | The Cancer Genome Atlas |
References
- Siegel, R.L.; Miller, K.D.; Jemal, A. Cancer statistics. CA Cancer J. Clin. 2018, 68, 7–30. [Google Scholar] [CrossRef] [PubMed]
- Kadara, H.; Scheet, P.; Wistuba, I.I.; Spira, A.E. Early Events in the Molecular Pathogenesis of Lung Cancer. Cancer Prev. Res. 2016, 9, 518–527. [Google Scholar] [CrossRef] [PubMed]
- Herbst, R.S.; Heymach, J.V.; Lippman, S.M. Lung cancer. N. Engl. J. Med. 2008, 359, 1367–1380. [Google Scholar] [CrossRef] [PubMed]
- Naiche, L.A.; Harrelson, Z.; Kelly, R.G.; Papaioannou, V.E. T-Box Genes in Vertebrate Development. Annu. Rev. Genet. 2005, 39, 219–239. [Google Scholar] [CrossRef] [PubMed]
- Arora, R.; Metzger, R.J.; Papaioannou, V.E. Multiple Roles and Interactions of Tbx4 and Tbx5 in Development of the Respiratory System. PLoS Genet. 2012, 8, e1002866. [Google Scholar] [CrossRef] [PubMed]
- Horton, A.C.; Mahadevan, N.R.; Minguillon, C.; Osoegawa, K.; Rokhsar, D.S.; Ruvinsky, I.; de Jong, P.J.; Logan, M.P.; Gibson-Brown, J.J. Conservation of linkage and evolution of developmental function within the Tbx2/3/4/5 subfamily of T-box genes: Implications for the origin of vertebrate limbs. Dev. Genes Evol. 2008, 218, 613–628. [Google Scholar] [CrossRef] [PubMed]
- Ludtke, T.H.; Rudat, C.; Wojahn, I.; Weiss, A.C.; Kleppa, M.J.; Kurz, J.; Farin, H.F.; Moon, A.; Christoffels, V.M.; Kispert, A. Tbx2 and Tbx3 Act Downstream of Shh to Maintain Canonical Wnt Signaling during Branching Morphogenesis of the Murine Lung. Dev. Cell 2016, 39, 239–253. [Google Scholar] [CrossRef] [PubMed]
- Lüdtke, T.H.W.; Farin, H.F.; Rudat, C.; Schuster-Gossler, K.; Petry, M.; Barnett, P.; Christoffels, V.M.; Kispert, A. Tbx2 Controls Lung Growth by Direct Repression of the Cell Cycle Inhibitor Genes Cdkn1a and Cdkn1b. PLoS Genet. 2013, 9, e1003189. [Google Scholar] [CrossRef] [PubMed]
- Khalil, A.A.; Sivakumar, S.; Lucas, F.A.S.; McDowell, T.; Lang, W.; Tabata, K.; Fujimoto, J.; Yatabe, Y.; Spira, A.; Scheet, P.; et al. TBX2 subfamily suppression in lung cancer pathogenesis: A high-potential marker for early detection. Oncotarget 2017, 8, 68230–68241. [Google Scholar] [CrossRef] [PubMed]
- Khalil, A.; Dekmak, B.; Boulos, F.; Kantrowitz, J.; Spira, A.; Fujimoto, J.; Kadara, H.; El-Hachem, N.; Nemer, G. Transcriptomic Alterations in Lung Adenocarcinoma Unveil New Mechanisms Targeted by the TBX2 Subfamily of Tumor Suppressor Genes. Front. Oncol. 2018, 8, 482. [Google Scholar] [CrossRef] [PubMed]
- Huang, W.Y.; Hsu, S.D.; Huang, H.Y.; Sun, Y.M.; Chou, C.H.; Weng, S.L.; Huang, H.D. MethHC: A database of DNA methylation and gene expression in human cancer. Nucleic acids Res. 2015, 43, D856–D861. [Google Scholar] [CrossRef] [PubMed]
- Hascher, A.; Haase, A.K.; Hebestreit, K.; Rohde, C.; Klein, H.U.; Rius, M.; Jungen, D.; Witten, A.; Stoll, M.; Schulze, I.; et al. DNA methyltransferase inhibition reverses epigenetically embedded phenotypes in lung cancer preferentially affecting polycomb target genes. Clin. Cancer Res. 2014, 20, 814–826. [Google Scholar] [CrossRef] [PubMed]
- Nguyen, A.N.; Hollenbach, P.W.; Richard, N.; Luna-Moran, A.; Brady, H.; Heise, C.; MacBeth, K.J. Azacitidine and decitabine have different mechanisms of action in non-small cell lung cancer cell lines. Lung Cancer 2010, 1, 119–140. [Google Scholar] [CrossRef] [PubMed]
- Gailhouste, L.; Liew, L.C.; Hatada, I.; Nakagama, H.; Ochiya, T. Epigenetic reprogramming using 5-azacytidine promotes an anti-cancer response in pancreatic adenocarcinoma cells. Cell Death Dis. 2018, 9, 468. [Google Scholar] [CrossRef] [PubMed]
- Papaioannou, V.E. The T-box gene family: Emerging roles in development, stem cells and cancer. Development 2014, 141, 3819. [Google Scholar] [CrossRef] [PubMed]
- Shivapurkar, N.; Gazdar, A.F. DNA methylation based biomarkers in non-invasive cancer screening. Curr. Mol. Med. 2010, 10, 123–132. [Google Scholar] [CrossRef] [PubMed]
- Shi, Y.X.; Wang, Y.; Li, X.; Zhang, W.; Zhou, H.H.; Yin, J.Y.; Liu, Z.Q. Genome-wide DNA methylation profiling reveals novel epigenetic signatures in squamous cell lung cancer. BMC Genomics 2017, 18, 901. [Google Scholar] [CrossRef] [PubMed]
- Beukers, W.; Kandimalla, R.; Masius, R.G.; Vermeij, M.; Kranse, R.; van Leenders, G.J.L.H.; Zwarthoff, E.C. Stratification based on methylation of TBX2 and TBX3 into three molecular grades predicts progression in patients with pTa-bladder cancer. Modern Pathol. 2014, 28, 515. [Google Scholar] [CrossRef] [PubMed]
- Kandimalla, R.; van Tilborg, A.A.G.; Kompier, L.C.; Stumpel, D.J.P.M.; Stam, R.W.; Bangma, C.H.; Zwarthoff, E.C. Genome-wide Analysis of CpG Island Methylation in Bladder Cancer Identified TBX2, TBX3, GATA2, and ZIC4 as pTa-Specific Prognostic Markers. Eur. Urol. 2012, 61, 1245–1256. [Google Scholar] [CrossRef] [PubMed]
- Yu, J.; Ma, X.; Cheung, K.F.; Li, X.; Tian, L.; Wang, S.; Wu, C.W.; Wu, W.K.K.; He, M.; Wang, M.; et al. Epigenetic inactivation of T-box transcription factor 5, a novel tumor suppressor gene, is associated with colon cancer. Oncogene 2010, 29, 6464. [Google Scholar] [CrossRef] [PubMed]
- Du, J.; Zhang, L. Integrated analysis of DNA methylation and microRNA regulation of the lung adenocarcinoma transcriptome. Oncol. Rep. 2015, 34, 585–594. [Google Scholar] [CrossRef] [PubMed]
- Zhang, S.; Li, M.; Ji, H.; Fang, Z. Landscape of transcriptional deregulation in lung cancer. BMC Genomics 2018, 19, 435. [Google Scholar] [CrossRef] [PubMed]
- Wu, X.; Ruan, L.; Yang, Y.; Mei, Q. Analysis of gene expression changes associated with human carcinoma-associated fibroblasts in non-small cell lung carcinoma. Biol.Res. 2017, 50, 6. [Google Scholar] [CrossRef] [PubMed]
- Matthew Rowley, E.G.; Couch, F.J. The Role of Tbx2 and Tbx3 in Mammary Development and Tumorigenesis. J. Mammary Gland Biol. Neoplasia 2004, 9, 109–118. [Google Scholar] [CrossRef] [PubMed]
- Fan, W.; Huang, X.; Chen, C.; Gray, J.; Huang, T. TBX3 and Its Isoform TBX3+2a Are Functionally Distinctive in Inhibition of Senescence and Are Overexpressed in a Subset of Breast Cancer Cell Lines. Cancer Res. 2004, 64, 5132. [Google Scholar] [CrossRef] [PubMed]
- Ma, R.; Yang, Y.; Tu, Q.; Hu, K. Overexpression of T-box Transcription Factor 5 (TBX5) Inhibits Proliferation and Invasion in Non-Small Cell Lung Carcinoma Cells. Oncol. Res. 2017, 25, 1495–1504. [Google Scholar] [CrossRef] [PubMed]
- Argemi, A.; Saurina, J. Study of the degradation of 5-azacytidine as a model of unstable drugs using a stopped-flow method and further data analysis with multivariate curve resolution. Talanta 2007, 74, 176–182. [Google Scholar] [CrossRef] [PubMed]
- Notari, R.E.; DeYoung, J.L. Kinetics and mechanisms of degradation of the antileukemic agent 5-azacytidine in aqueous solutions. J. Pharm. Sci. 1975, 64, 1148–1157. [Google Scholar] [CrossRef] [PubMed]


© 2019 by the authors. Licensee MDPI, Basel, Switzerland. This article is an open access article distributed under the terms and conditions of the Creative Commons Attribution (CC BY) license (http://creativecommons.org/licenses/by/4.0/).
Share and Cite
Nehme, E.; Rahal, Z.; Sinjab, A.; Khalil, A.; Chami, H.; Nemer, G.; Kadara, H. Epigenetic Suppression of the T-box Subfamily 2 (TBX2) in Human Non-Small Cell Lung Cancer. Int. J. Mol. Sci. 2019, 20, 1159. https://doi.org/10.3390/ijms20051159
Nehme E, Rahal Z, Sinjab A, Khalil A, Chami H, Nemer G, Kadara H. Epigenetic Suppression of the T-box Subfamily 2 (TBX2) in Human Non-Small Cell Lung Cancer. International Journal of Molecular Sciences. 2019; 20(5):1159. https://doi.org/10.3390/ijms20051159
Chicago/Turabian StyleNehme, Eliana, Zahraa Rahal, Ansam Sinjab, Athar Khalil, Hassan Chami, Georges Nemer, and Humam Kadara. 2019. "Epigenetic Suppression of the T-box Subfamily 2 (TBX2) in Human Non-Small Cell Lung Cancer" International Journal of Molecular Sciences 20, no. 5: 1159. https://doi.org/10.3390/ijms20051159
APA StyleNehme, E., Rahal, Z., Sinjab, A., Khalil, A., Chami, H., Nemer, G., & Kadara, H. (2019). Epigenetic Suppression of the T-box Subfamily 2 (TBX2) in Human Non-Small Cell Lung Cancer. International Journal of Molecular Sciences, 20(5), 1159. https://doi.org/10.3390/ijms20051159