Discovery of Novel Acetylcholinesterase Inhibitors as Potential Candidates for the Treatment of Alzheimer’s Disease

Abstract
1. Introduction
2. Results and Discussion
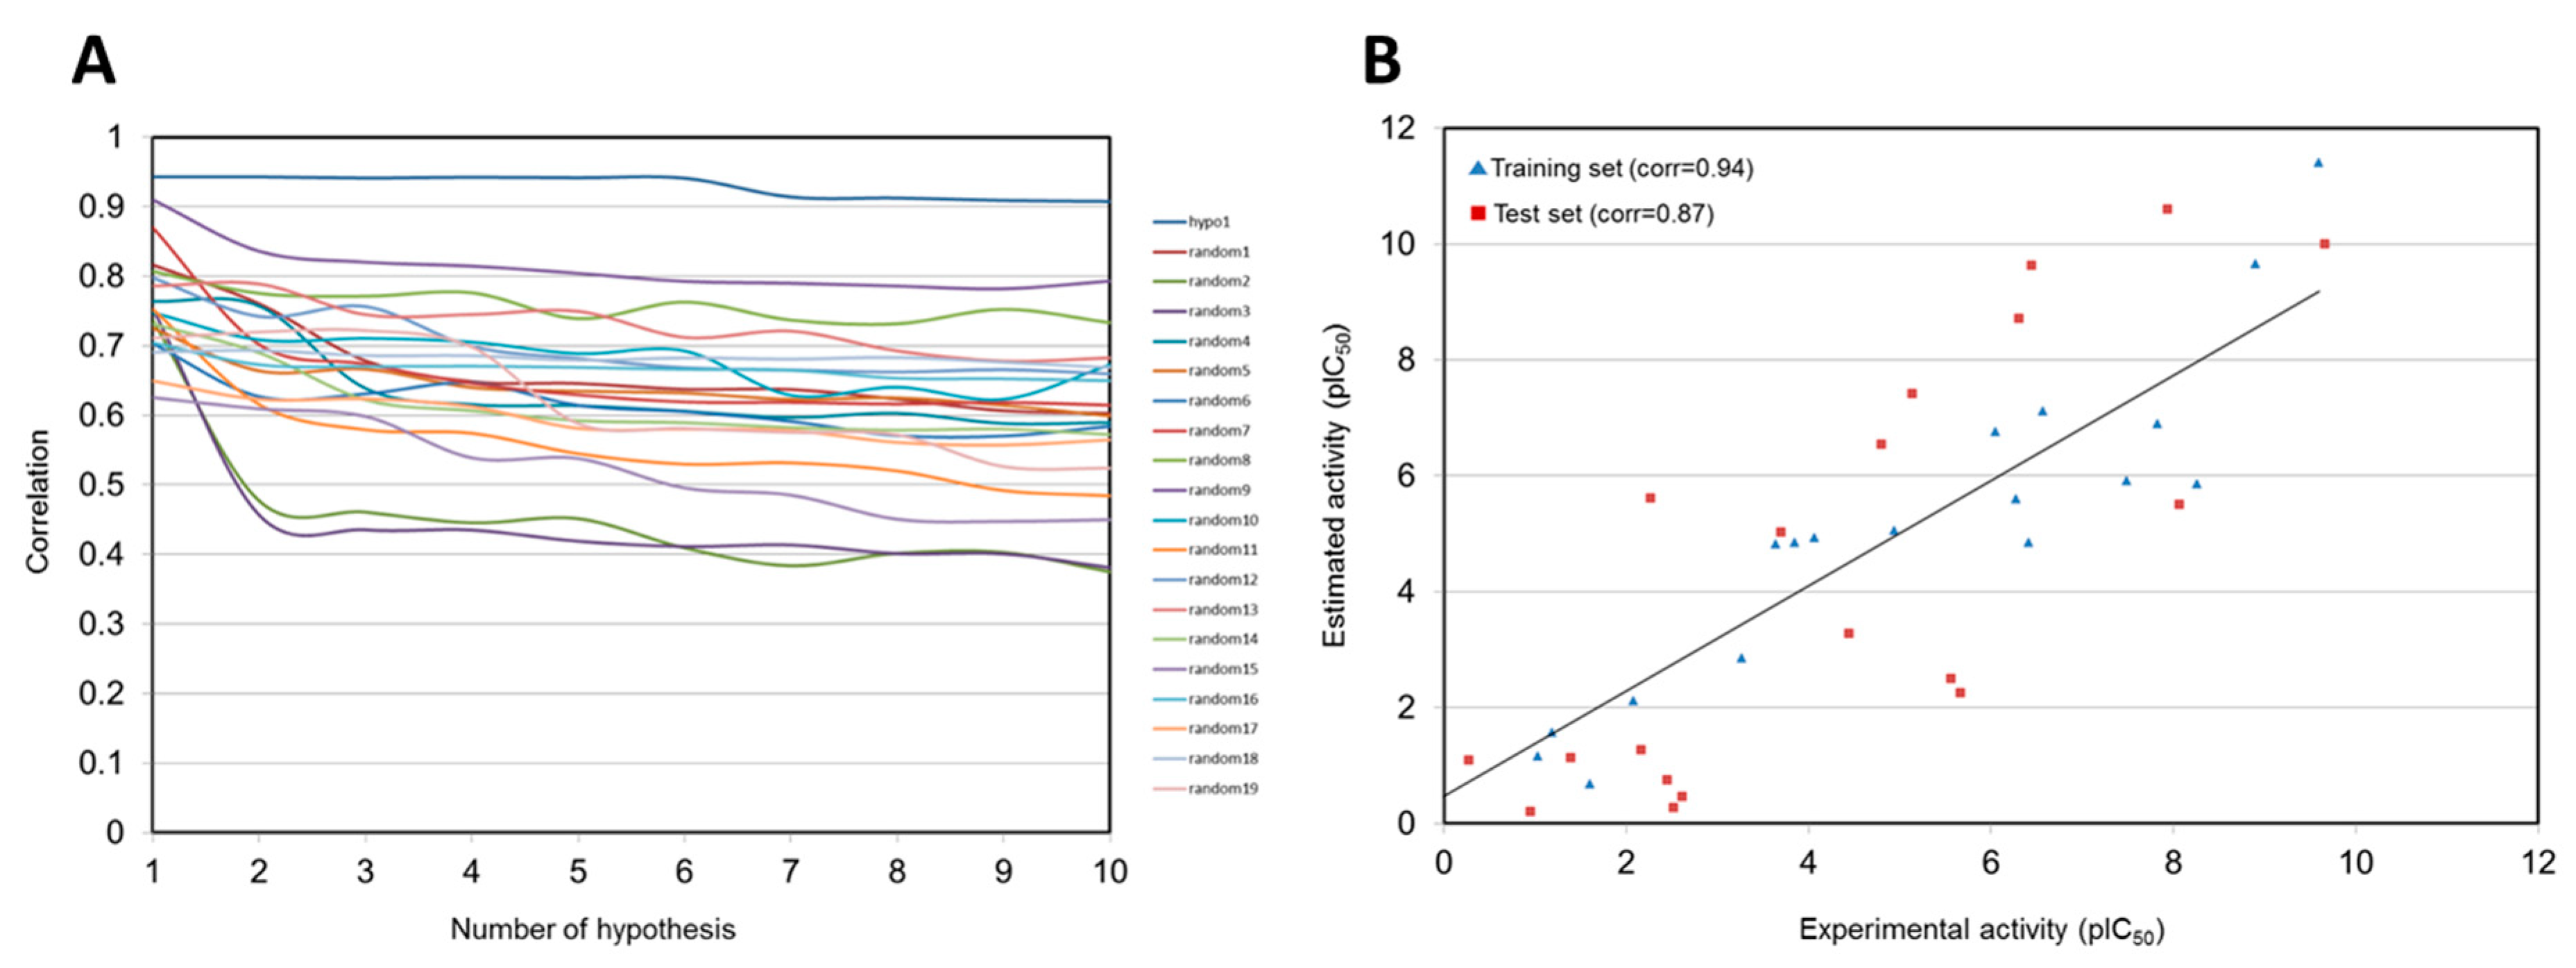
2.1. Generation of 3D QSAR Pharmacophore Model
2.2. Development of Structure-Based Pharmacophore Models
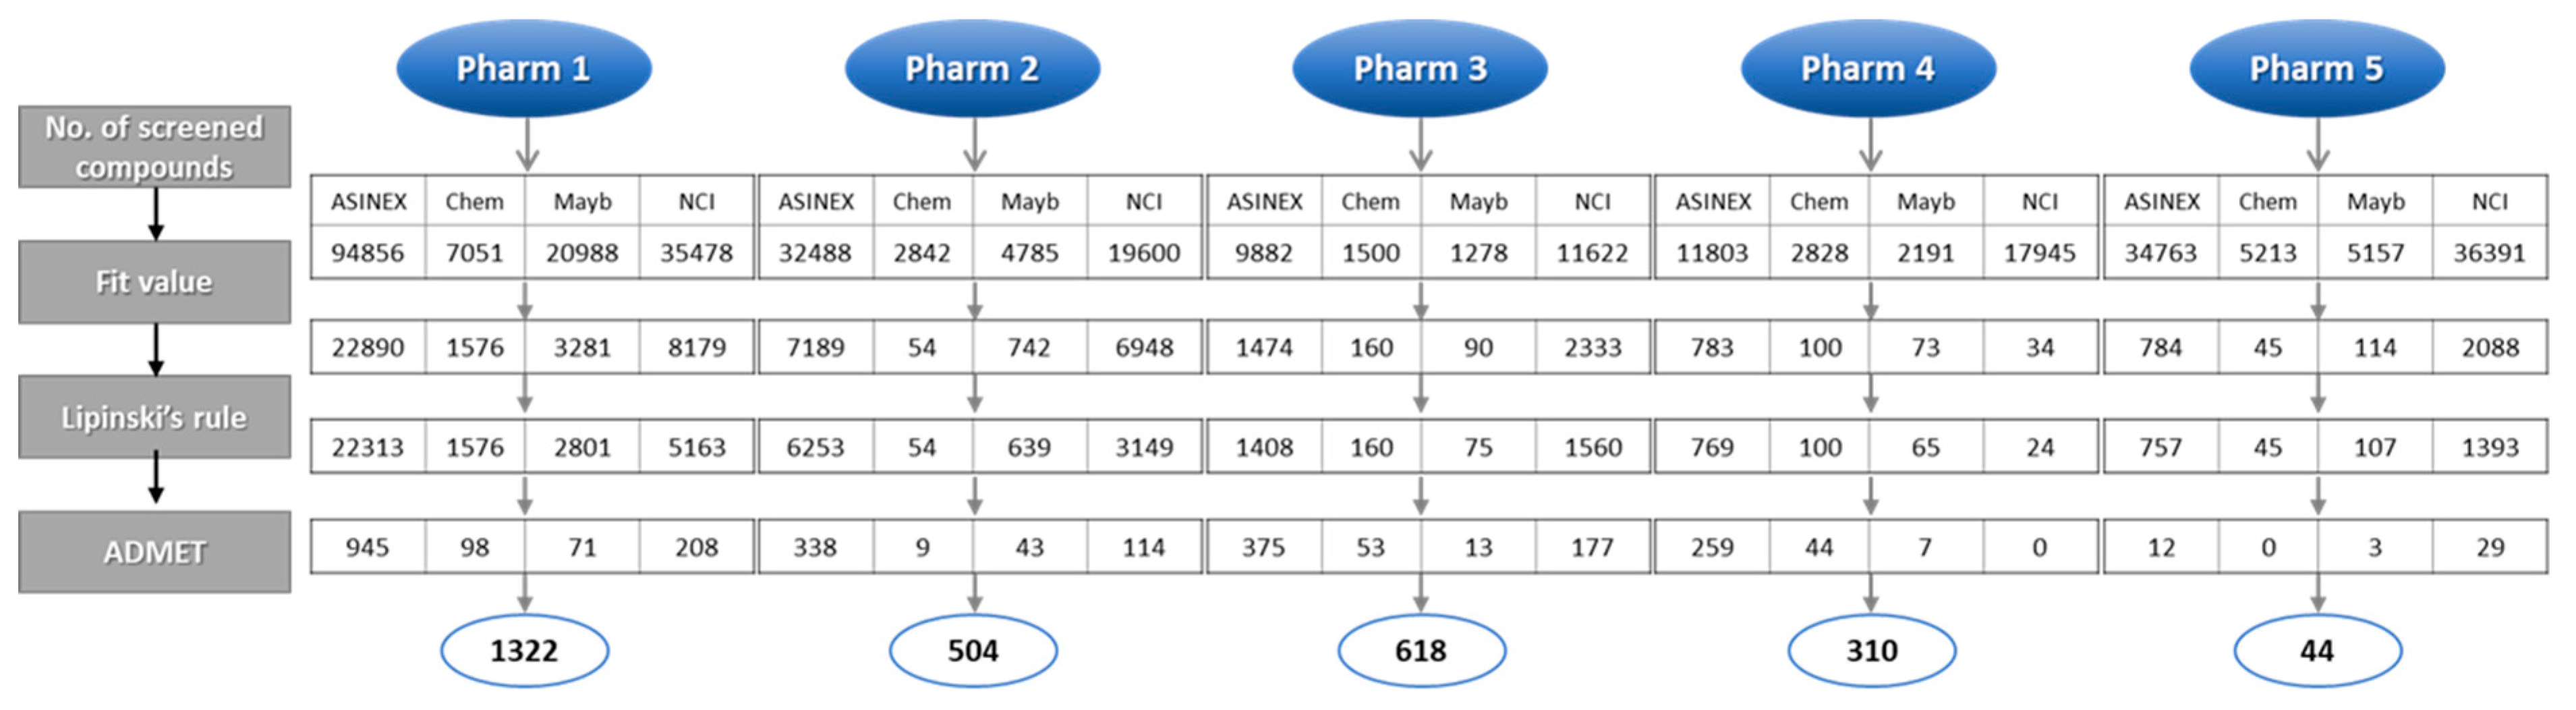
2.3. Identification of Candidate Hits from Database Screening and Molecular Docking
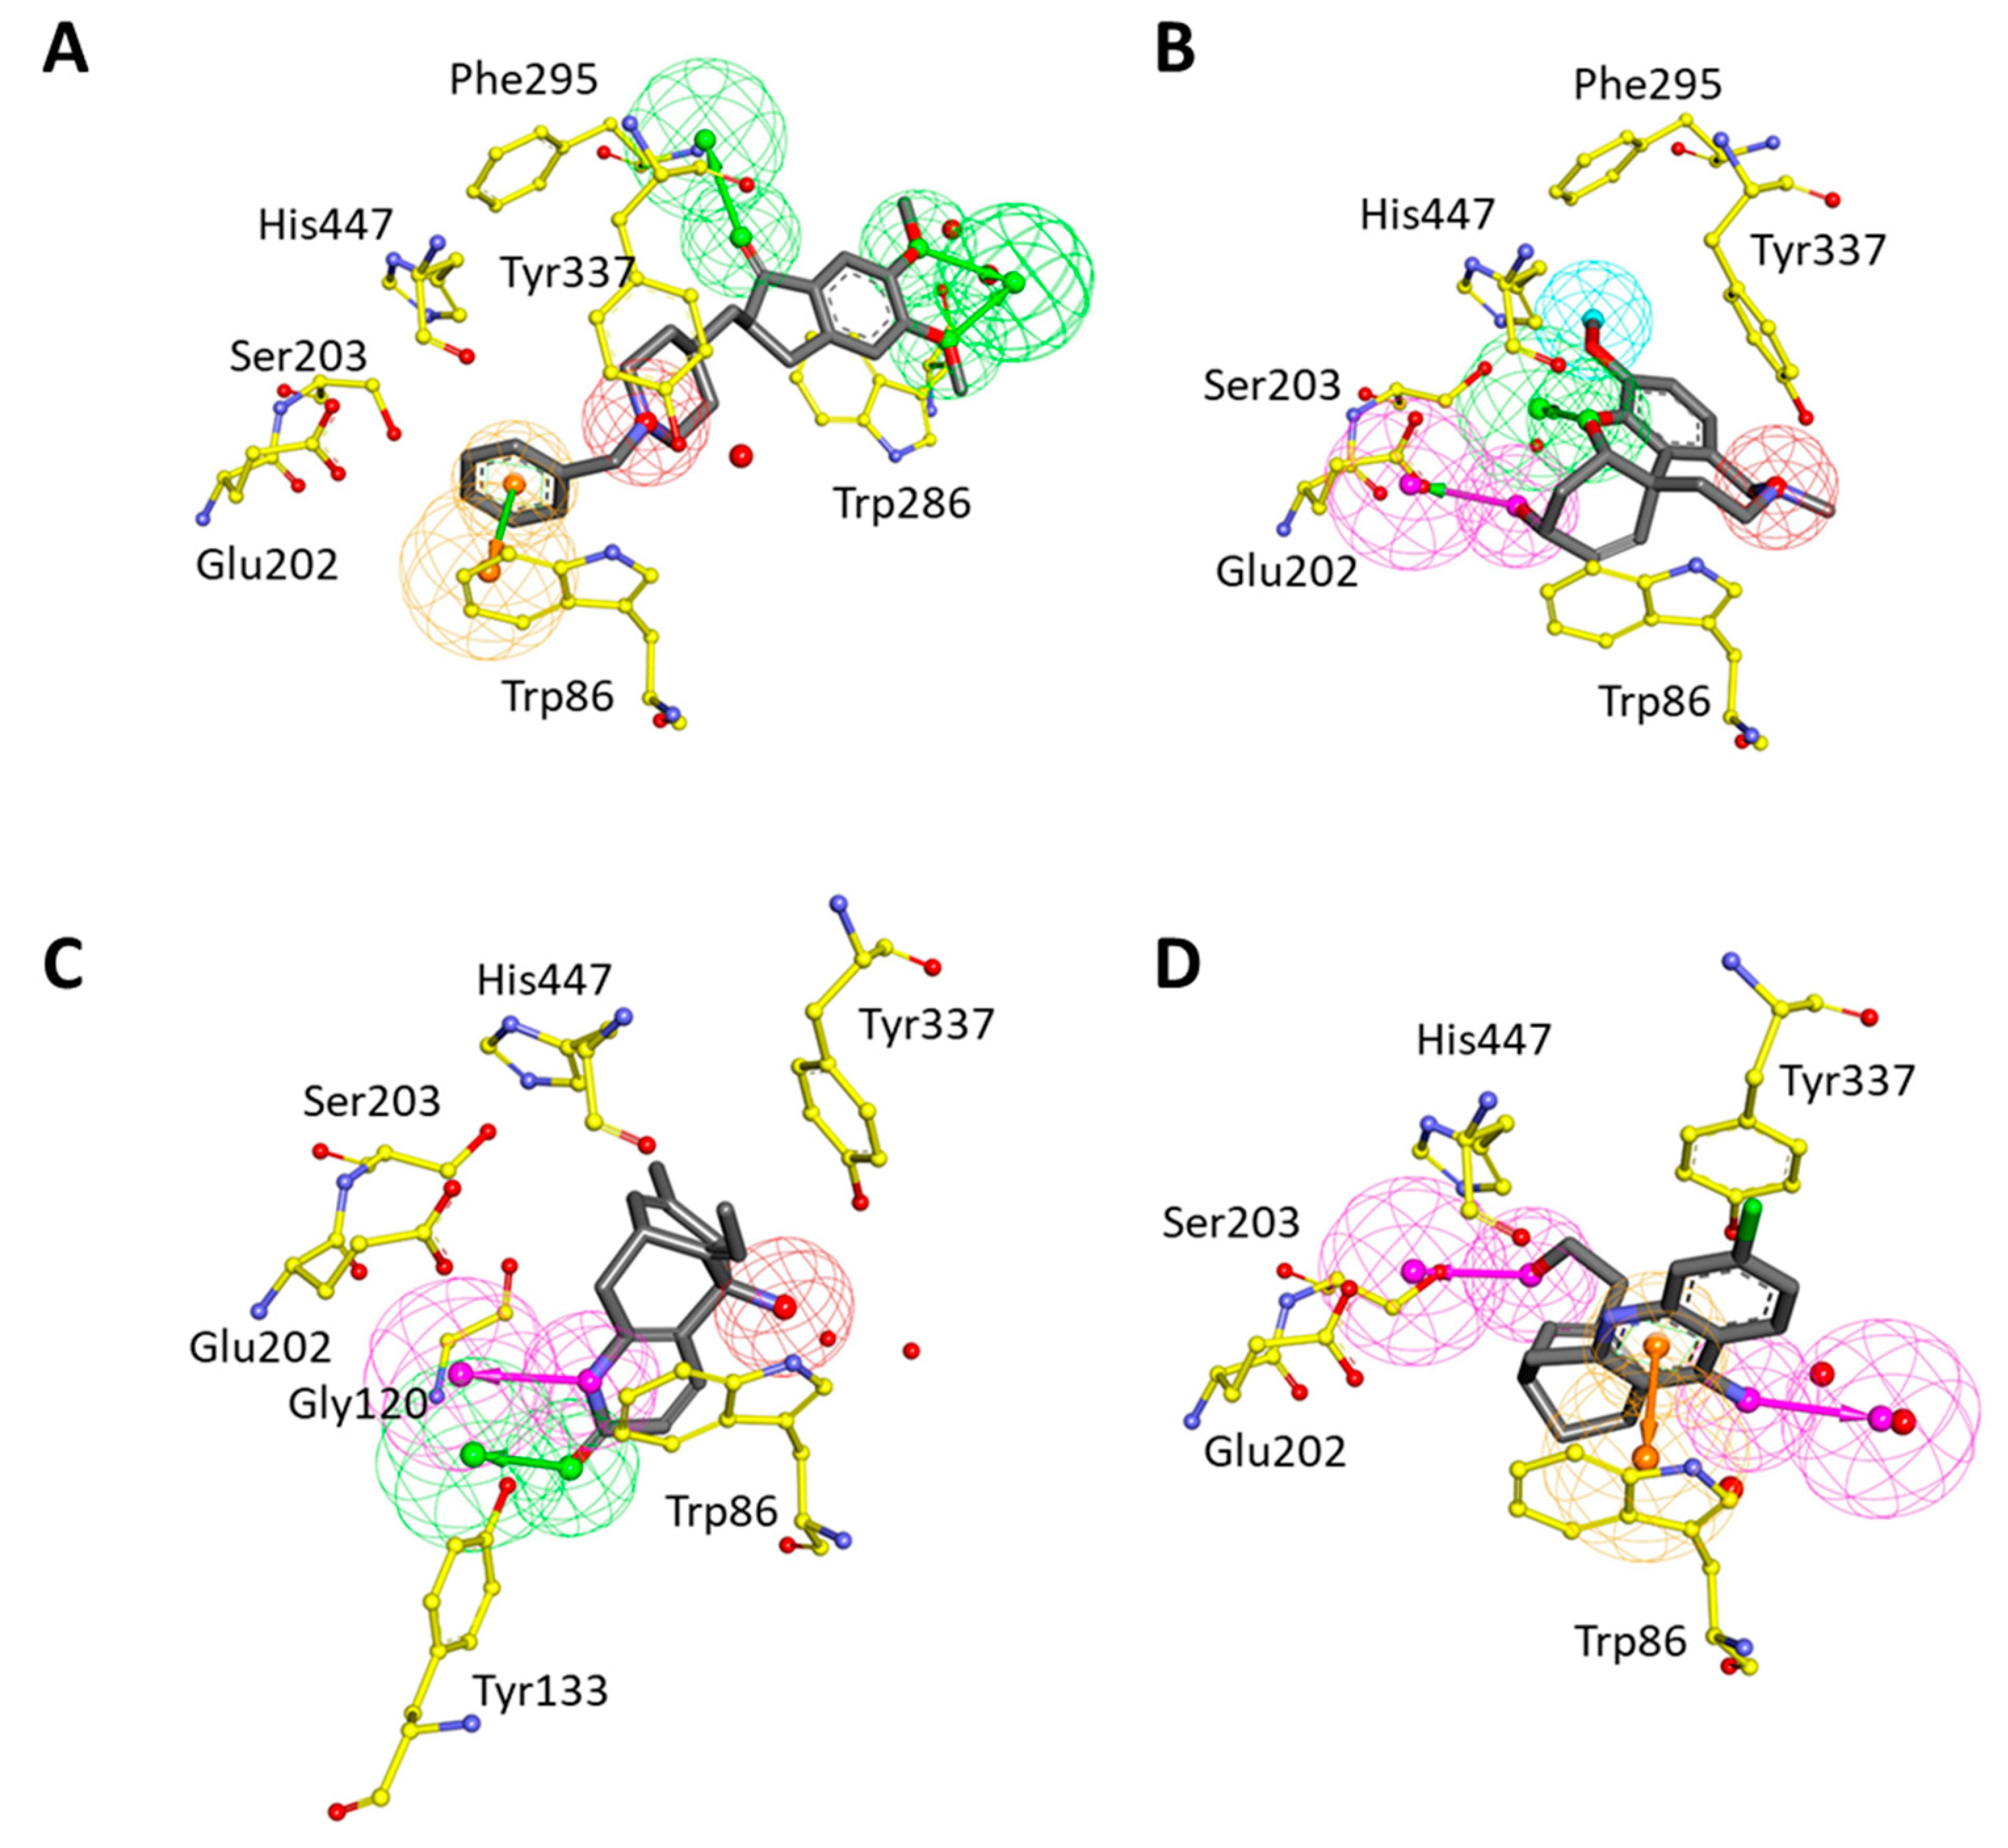
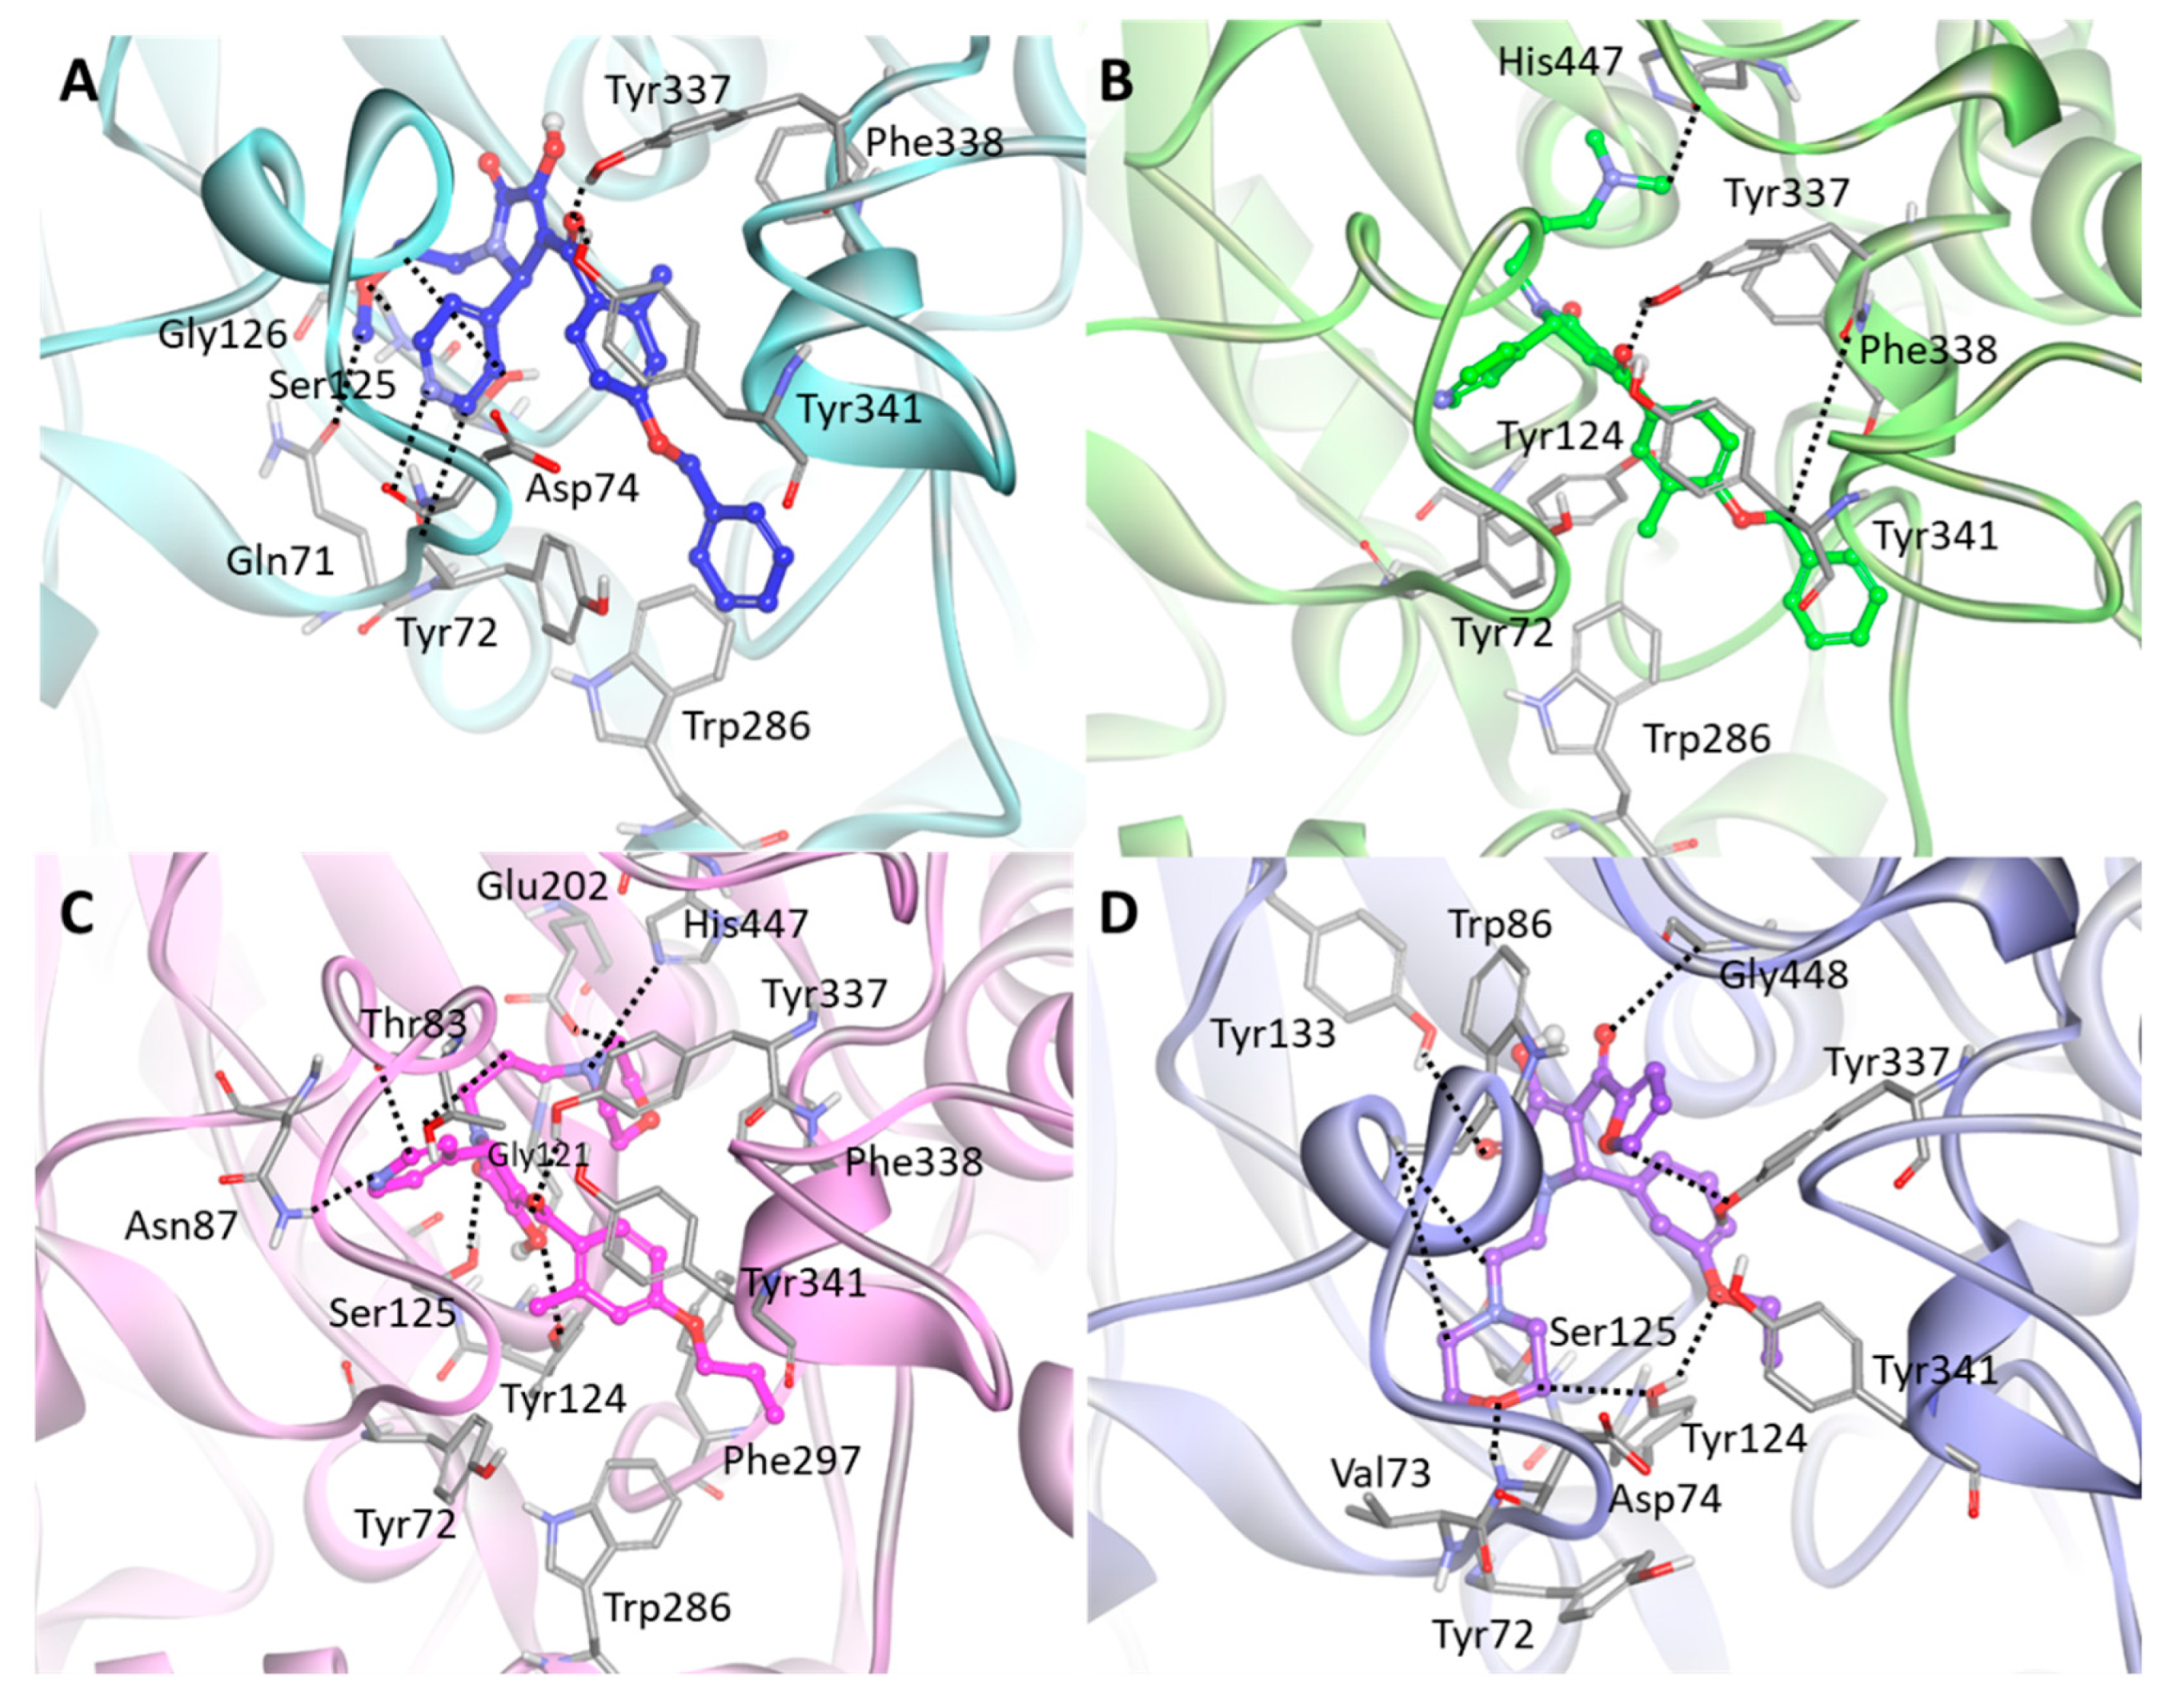
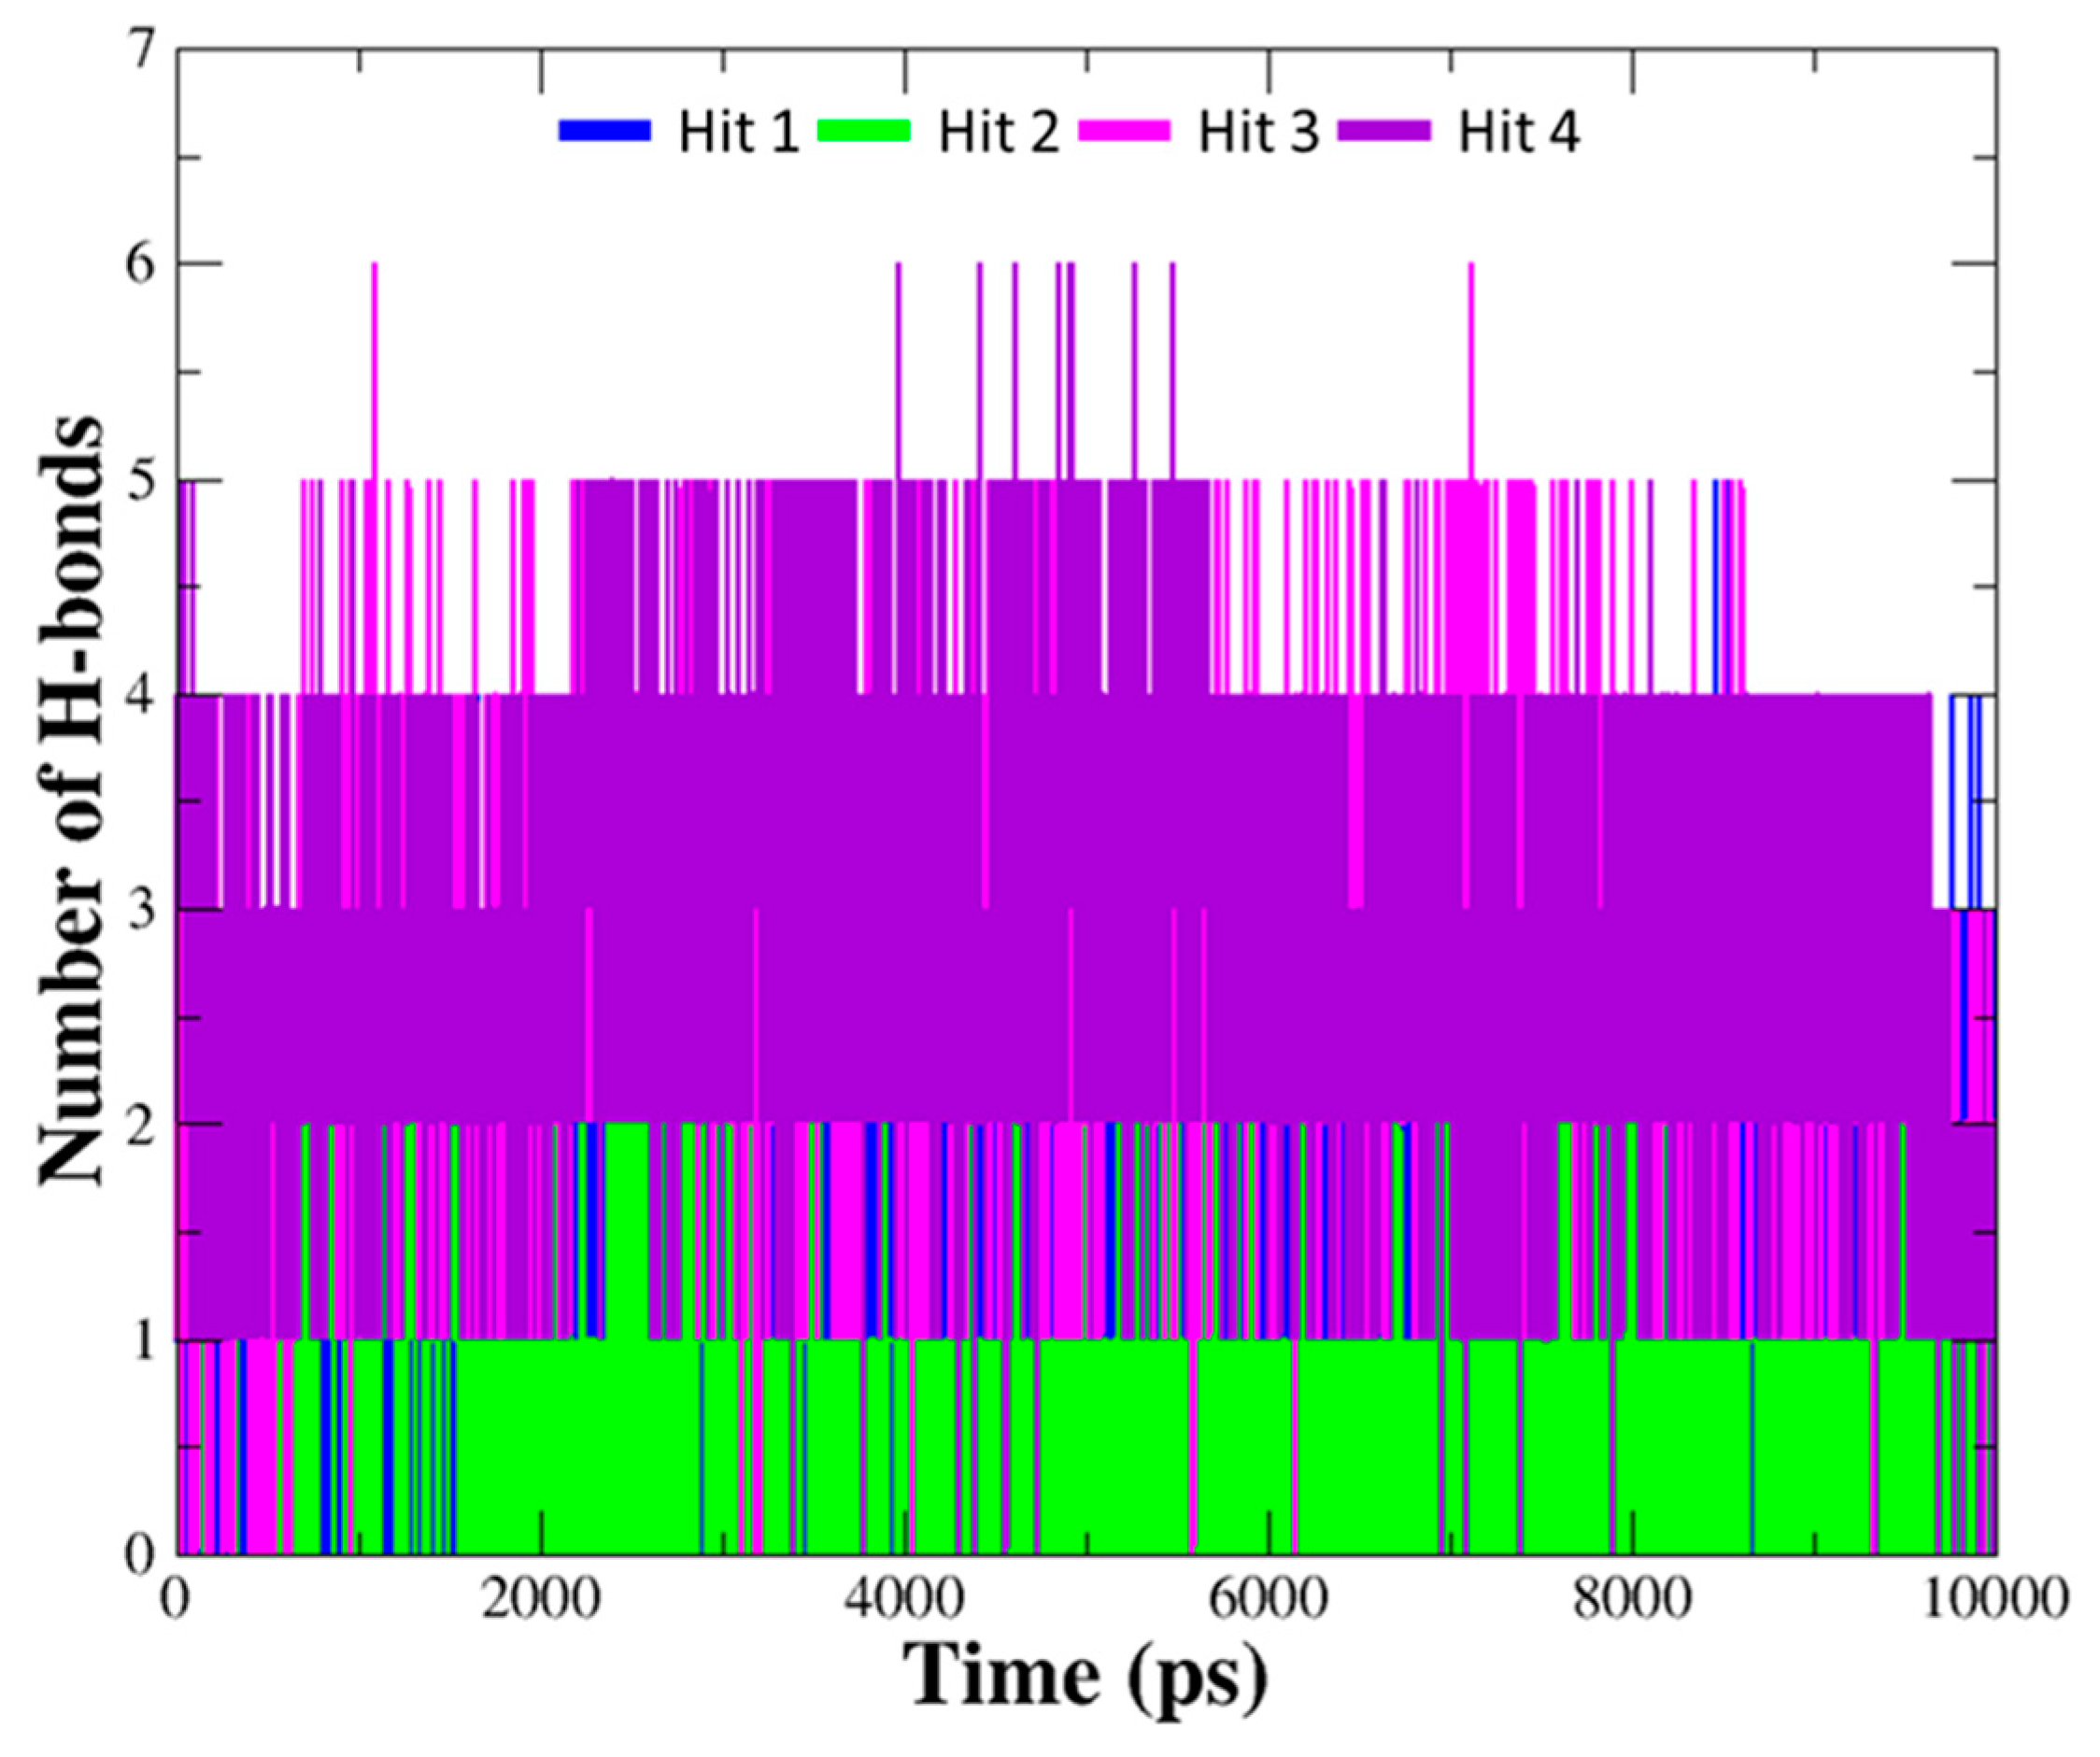
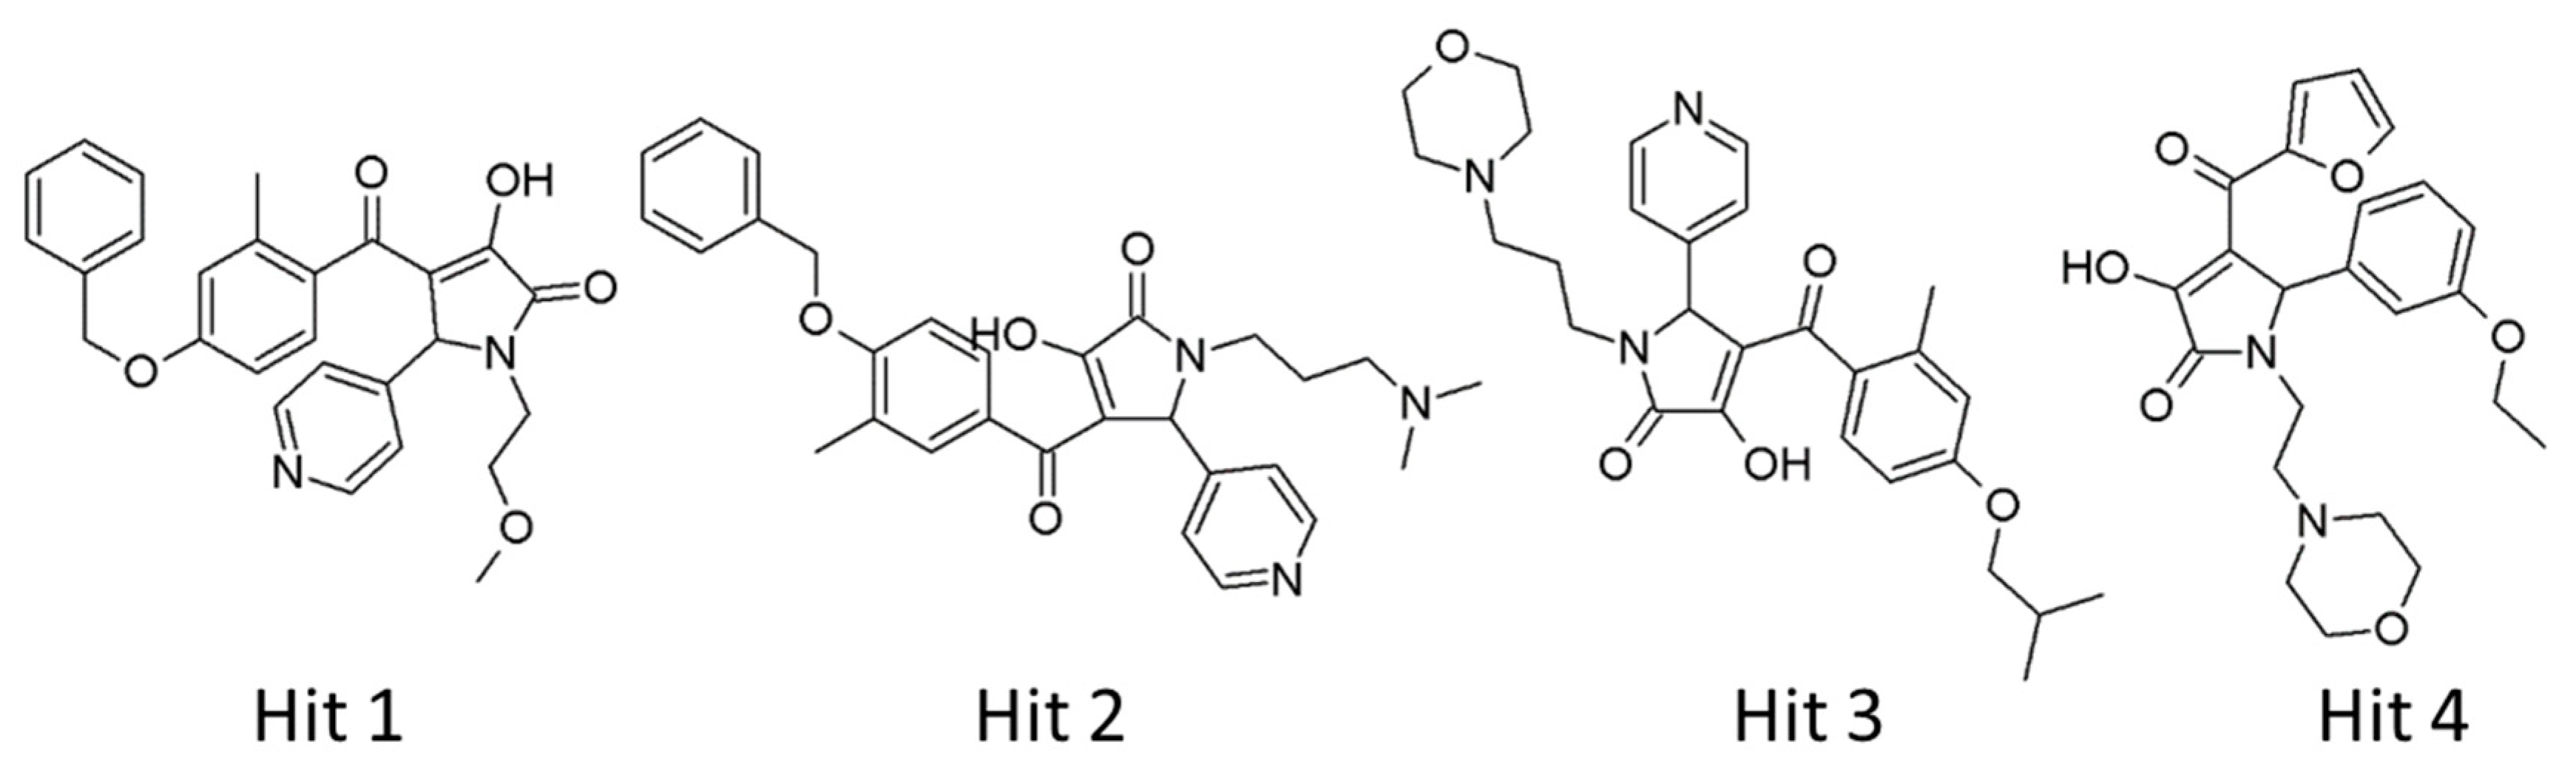
2.4. Selection of Hit Compounds and Their Binding Modes at the active Site of hAChE
3. Materials and Methods
3.1. D QSAR Pharmacophore Modeling
3.2. Structure-Based Pharmacophore Modeling
3.3. Pharmacophore-Based Database Screening
3.4. Molecular Docking
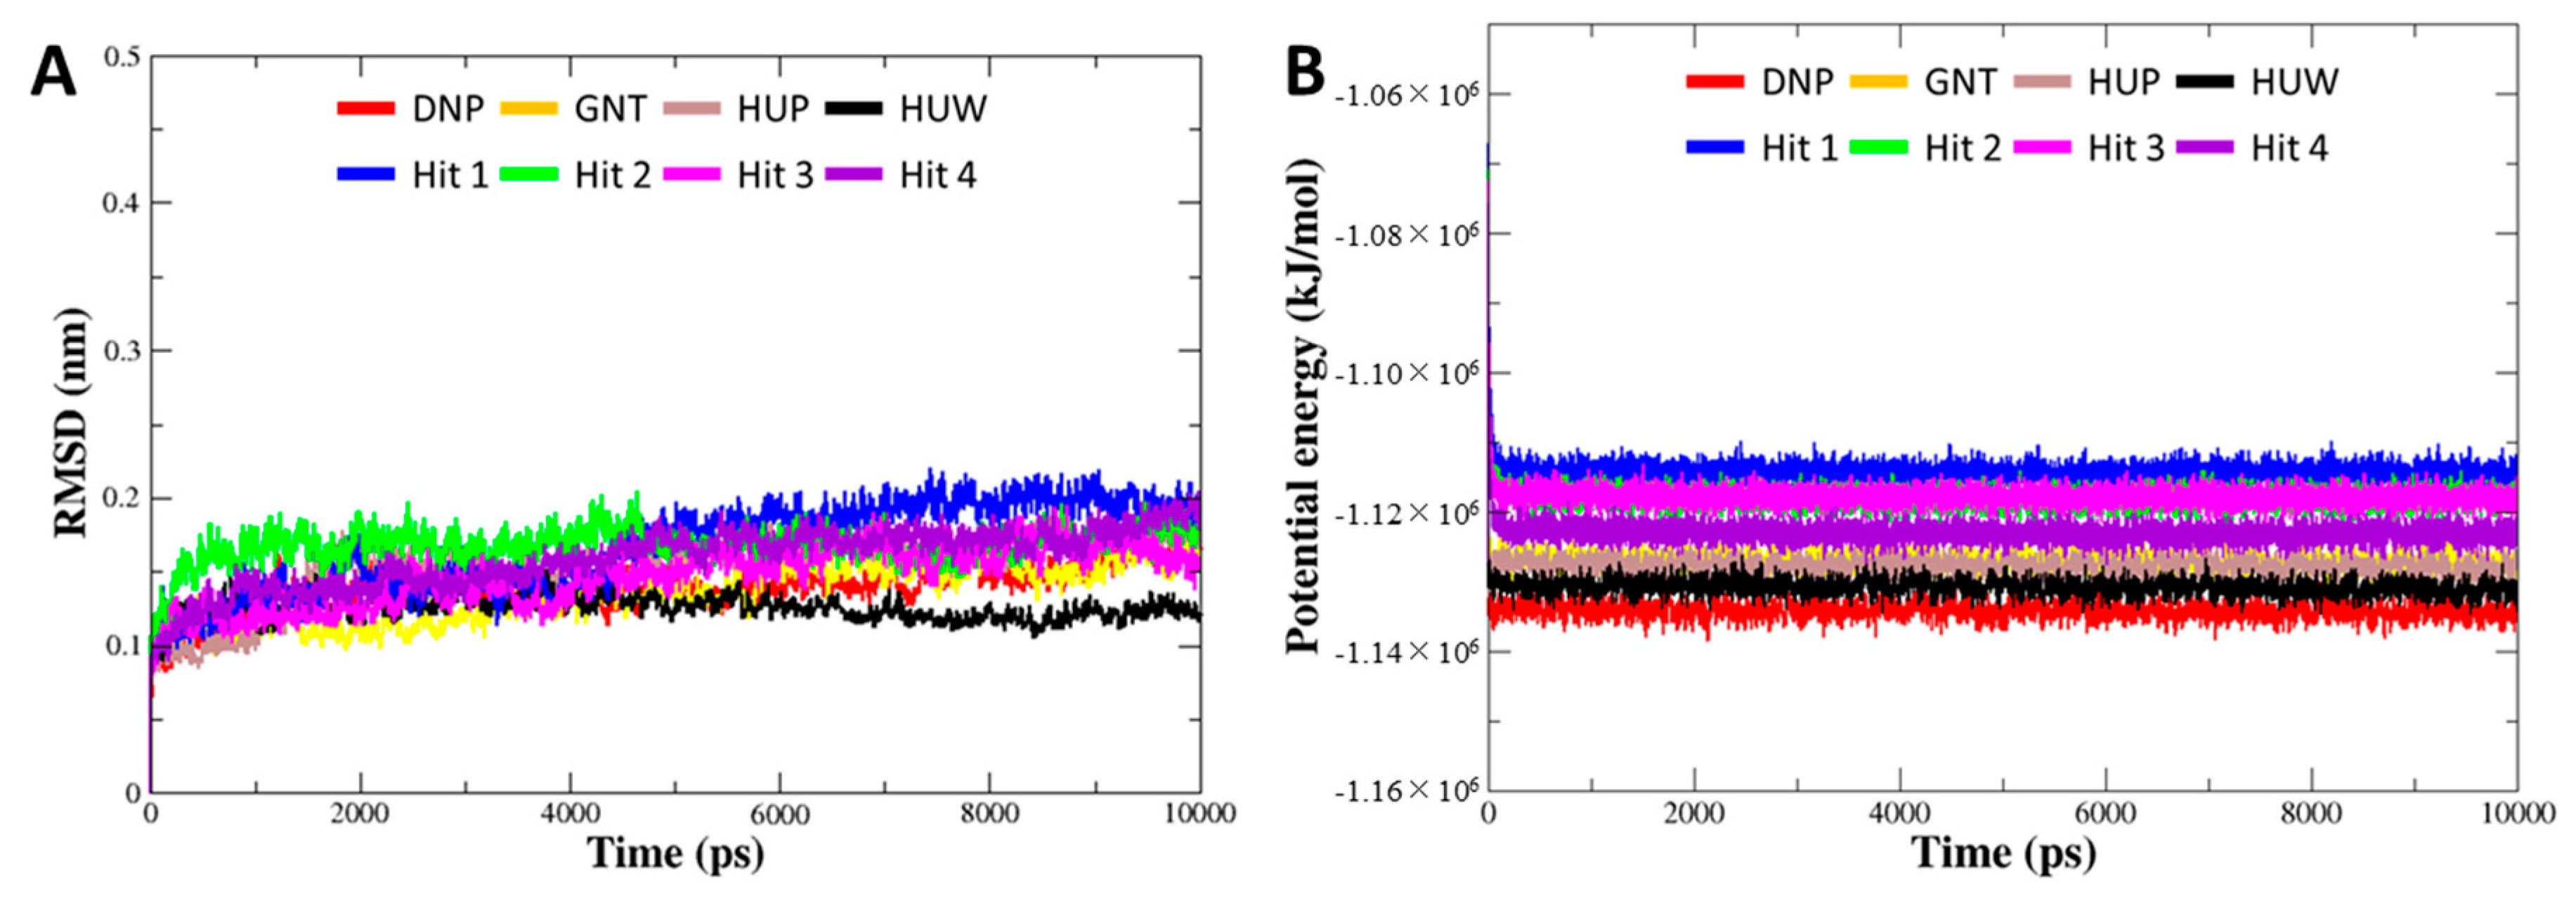
3.5. Molecular Dynamics Simulation
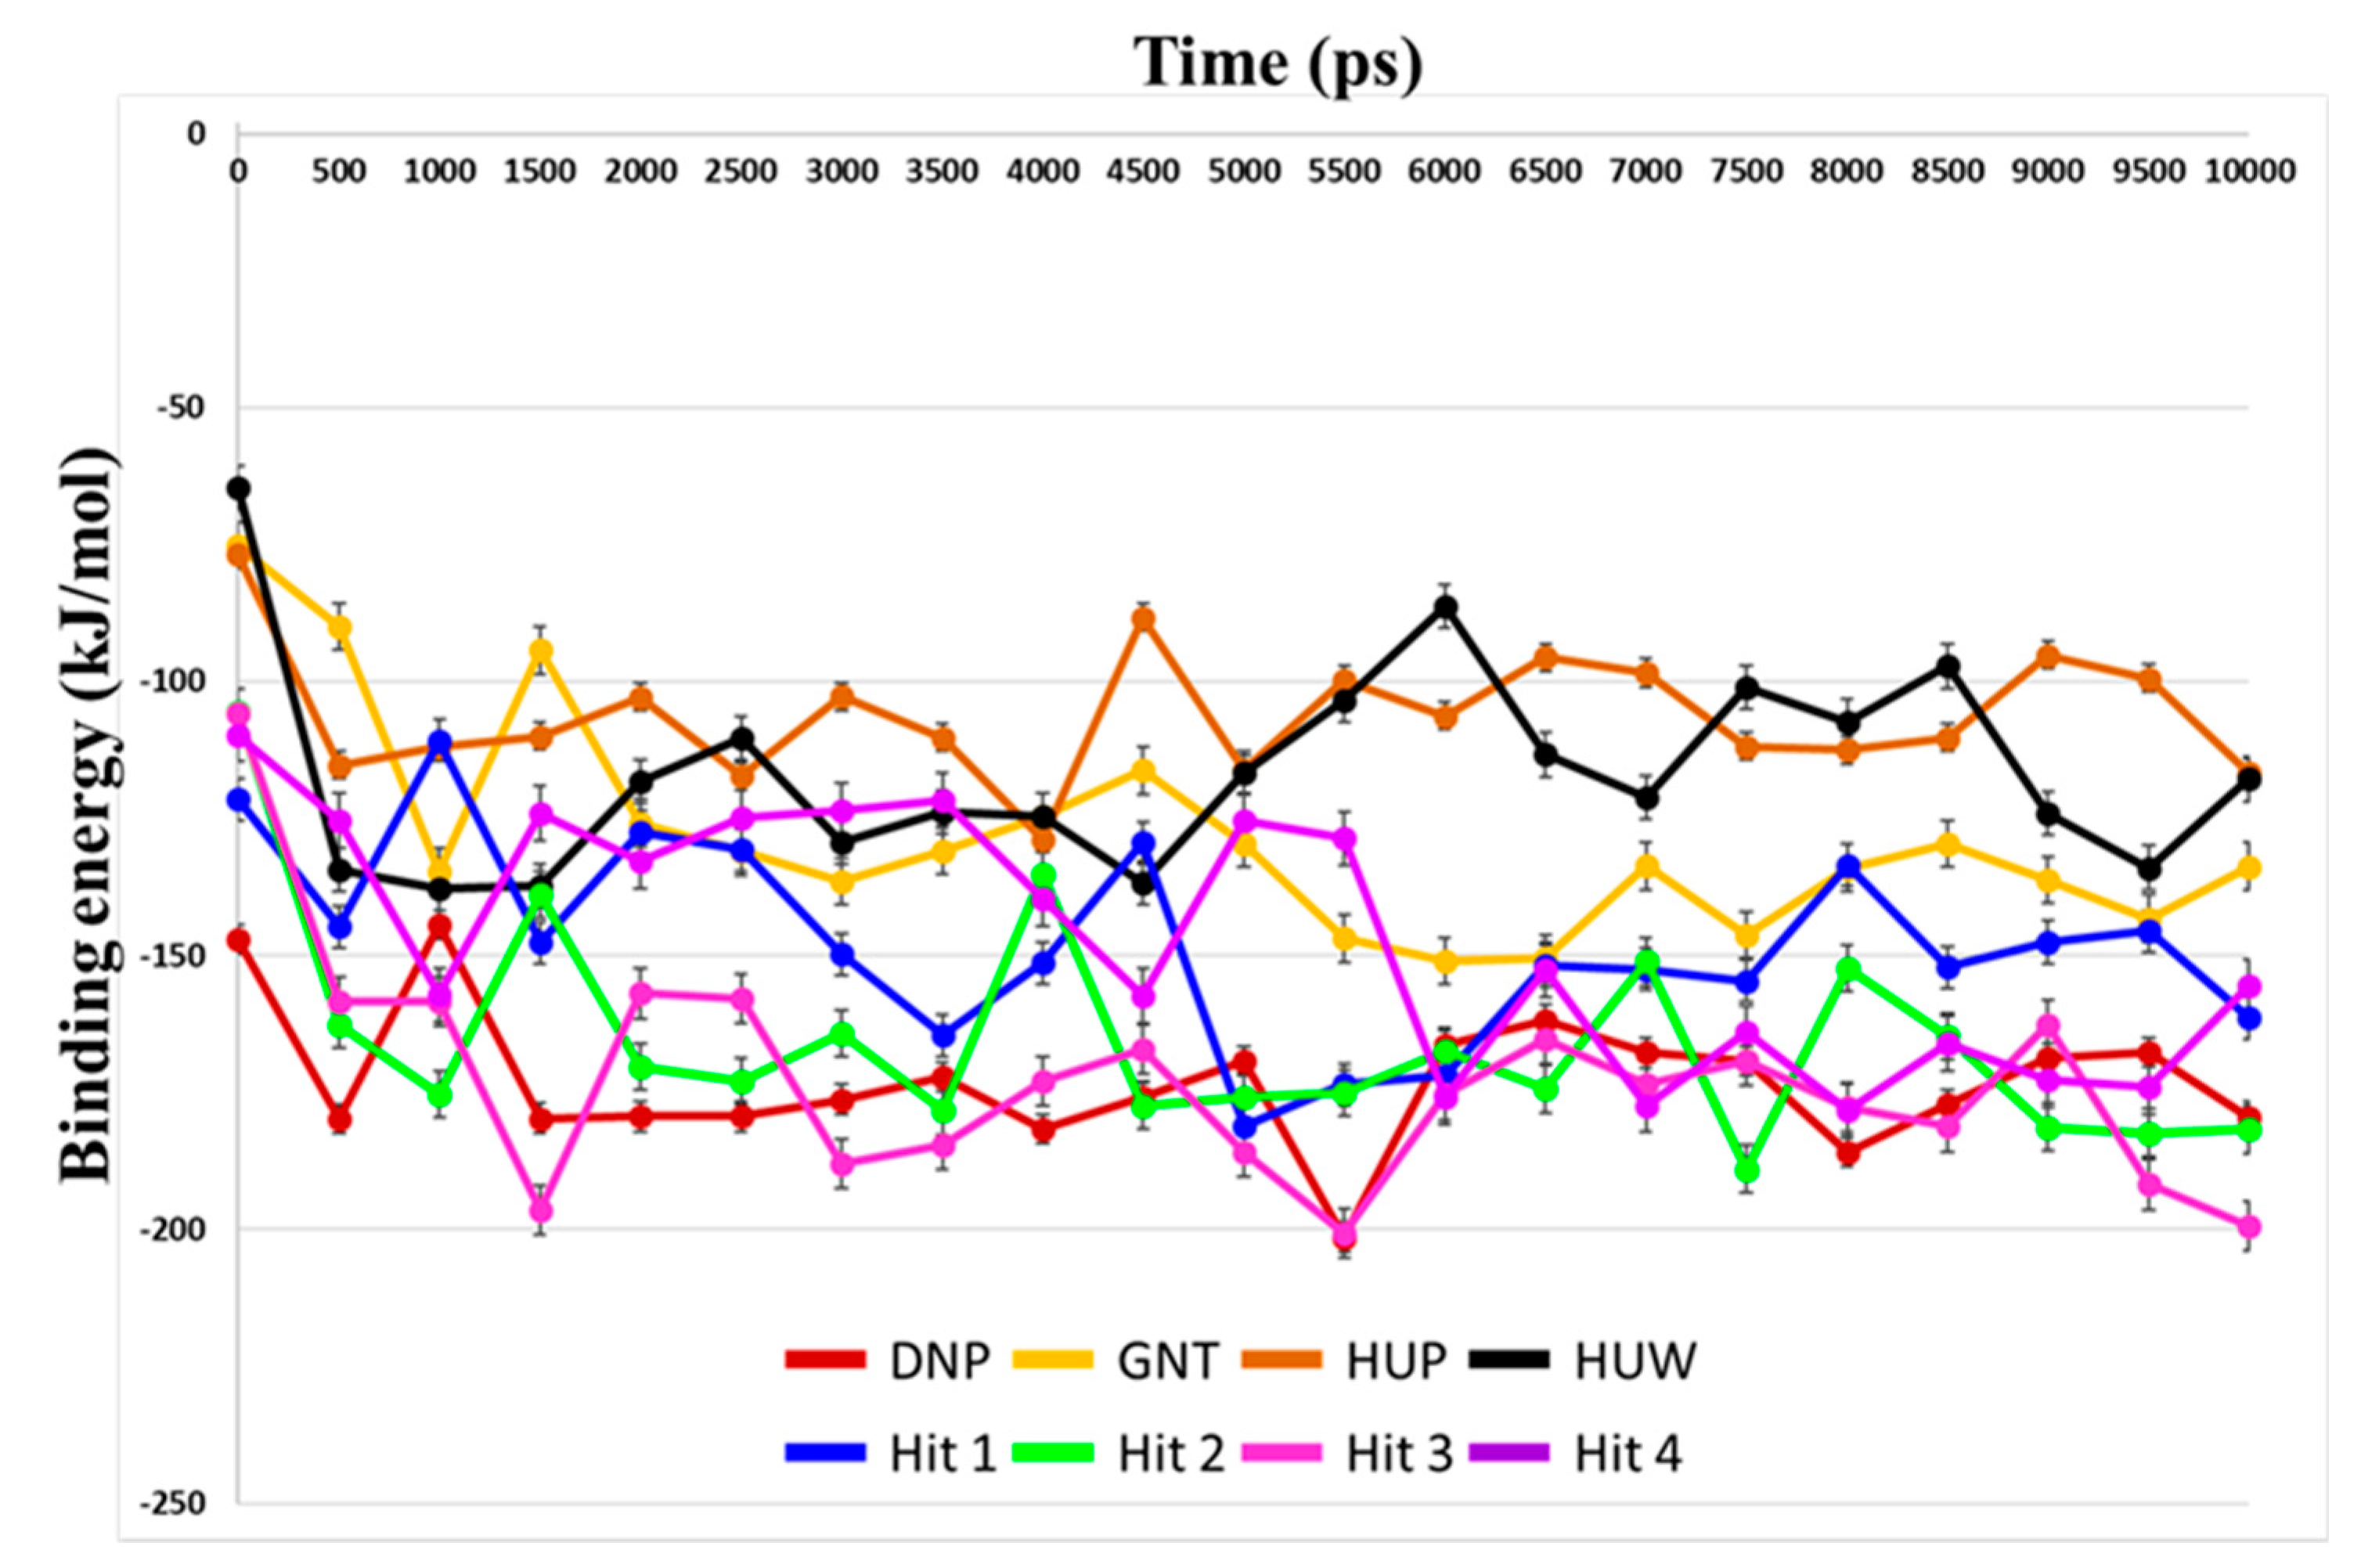
3.6. Binding Free Energy Calculation
4. Conclusions
Supplementary Materials
Author Contributions
Funding
Conflicts of Interest
References
- Perry, E.; Blessed, G.; Tomlinson, B.; Perry, R.; Crow, T.; Cross, A.; Dockray, G.; Dimaline, R.; Arregui, A. Neurochemical activities in human temporal lobe related to aging and Alzheimer-type changes. Neurobiol. Aging 1981, 2, 251–256. [Google Scholar] [CrossRef]
- Francis, P.T.; Palmer, A.M.; Sims, N.R.; Bowen, D.M.; Davison, A.N.; Esiri, M.M.; Neary, D.; Snowden, J.S.; Wilcock, G.K. Neurochemical studies of early-onset Alzheimer’s disease: Possible influence on treatment. N. Engl. J. Med. 1985, 313, 7–11. [Google Scholar] [CrossRef] [PubMed]
- Claassen, J.A.; Jansen, R.W. Cholinergically Mediated Augmentation of Cerebral Perfusion in Alzheimer’s Disease and Related Cognitive Disorders: The Cholinergic–Vascular Hypothesis. J. Gerontol. A Biol. Sci. Med. Sci. 2006, 61, 267–271. [Google Scholar] [CrossRef] [PubMed]
- Coulthard, E.; Singh-Curry, V.; Husain, M. Treatment of attention deficits in neurological disorders. Curr. Opin. Neurol. 2006, 19, 613–618. [Google Scholar] [CrossRef] [PubMed]
- Klafki, H.-W.; Staufenbiel, M.; Kornhuber, J.; Wiltfang, J. Therapeutic approaches to Alzheimer’s disease. Brain 2006, 129, 2840–2855. [Google Scholar] [CrossRef] [PubMed]
- Villarroya, M.; García, A.G.; Marco-Contelles, J.; López, M.G. An update on the pharmacology of galantamine. Exp. Opin. Investig. Drugs 2007, 16, 1987–1998. [Google Scholar] [CrossRef] [PubMed]
- Hogan, D.B.; Patterson, C. Progress in clinical neurosciences: Treatment of Alzheimer’s disease and other dementias-review and comparison of the cholinesterase inhibitors. Canad. J. Neurol. Sci. 2002, 29, 306–314. [Google Scholar] [CrossRef] [PubMed]
- Geldmacher, D.S. Long-term cholinesterase inhibitor therapy for Alzheimer’s disease: Practical considerations for the primary care physician. Prim. Care Compan. J. Clin. Psychiatry 2003, 5, 251. [Google Scholar] [CrossRef]
- Selkoe, D.J.; Schenk, D. Alzheimer’s disease: Molecular understanding predicts amyloid-based therapeutics. Ann. Rev. Pharm. Toxicol. 2003, 43, 545–584. [Google Scholar] [CrossRef] [PubMed]
- Aguglia, E.; Onor, M.; Saina, M.; Maso, E. An open-label, comparative study of rivastigmine, donepezil and galantamine in a real-world setting. Curr. Med. Res. Opin. 2004, 20, 1747–1752. [Google Scholar] [CrossRef] [PubMed]
- Onor, M.L.; Trevisiol, M.; Aguglia, E. Rivastigmine in the treatment of Alzheimer’s disease: An update. Clin. Intervent. Aging 2007, 2, 17. [Google Scholar] [CrossRef]
- Lahiri, D.; Farlow, M.; Hintz, N.; Utsuki, T.; Greig, N. Cholinesterase inhibitors, β-amyloid precursor protein and amyloid β-peptides in Alzheimer’s disease. Acta Neurol. Scandinavica 2000, 102, 60–67. [Google Scholar] [CrossRef]
- Greig, N.H.; Sambamurti, K.; Yu, Q.-s.; Brossi, A.; Bruinsma, G.B.; Lahiri, D.K. An overview of phenserine tartrate, a novel acetylcholinesterase inhibitor for the treatment of Alzheimer’s disease. Curr. Alzheimer Res. 2005, 2, 281–290. [Google Scholar] [CrossRef] [PubMed]
- Guevara-Salazar, J.A.; Espinoza-Fonseca, M.; Beltrán, H.I.; Correa-Basurto, J.; Quintana Zavala, D.; Trujillo-Ferrara, J.G. The electronic influence on the active site-directed inhibition of acetylcholinesterase by N-aryl-substituted succinimides. J. Mex. Chem. Soc. 2007, 51, 222–227. [Google Scholar]
- Hut, R.; Van der Zee, E. The cholinergic system, circadian rhythmicity, and time memory. Behav. Brain Res. 2011, 221, 466–480. [Google Scholar] [CrossRef] [PubMed]
- Chen, Y.L.; Nielsen, J.; Hedberg, K.; Dunaiskis, A.; Jones, S.; Russo, L.; Johnson, J.; Ives, J.; Liston, D. Syntheses, resolution, and structure-activity relationships of potent acetylcholinesterase inhibitors: 8-carbaphysostigmine analogs. J. Med. Chem. 1992, 35, 1429–1434. [Google Scholar] [CrossRef] [PubMed]
- Sowell, J.W.; Tang, Y.; Valli, M.J.; Chapman, J.M., Jr.; Usher, L.A.; Vaughan, C.M.; Kosh, J. Synthesis and cholinergic properties of bis [[(dimethylamino) methyl] furanyl] analogs of ranitidine. J. Med. Chem. 1992, 35, 1102–1108. [Google Scholar] [CrossRef] [PubMed]
- Nagel, A.A.; Liston, D.R.; Jung, S.; Mahar, M.; Vincent, L.A.; Chapin, D.; Chen, Y.L.; Hubbard, S.; Ives, J.L. Design and synthesis of 1-heteroaryl-3-(1-benzyl-4-piperidinyl) propan-1-one derivatives as potent, selective acetylcholinesterase inhibitors. J. Med. Chem. 1995, 38, 1084–1089. [Google Scholar] [CrossRef] [PubMed]
- Rampa, A.; Bisi, A.; Valenti, P.; Recanatini, M.; Cavalli, A.; Andrisano, V.; Cavrini, V.; Fin, L.; Buriani, A.; Giusti, P. Acetylcholinesterase Inhibitors: Synthesis and Structure− Activity Relationships of ω-[N-Methyl-N-(3-alkylcarbamoyloxyphenyl)-methyl] aminoalkoxyheteroaryl Derivatives. J. Med. Chem. 1998, 41, 3976–3986. [Google Scholar] [CrossRef] [PubMed]
- Contreras, J.-M.; Rival, Y.M.; Chayer, S.; Bourguignon, J.-J.; Wermuth, C.G. Aminopyridazines as acetylcholinesterase inhibitors. J. Med. Chem. 1999, 42, 730–741. [Google Scholar] [CrossRef] [PubMed]
- Camps, P.; El Achab, R.; Morral, J.; Muñoz-Torrero, D.; Badia, A.; Baños, J.E.; Vivas, N.M.; Barril, X.; Orozco, M.; Luque, F.J. New tacrine− huperzine A hybrids (huprines): Highly potent tight-binding acetylcholinesterase inhibitors of interest for the treatment of Alzheimer’s disease. J. Med. Chem. 2000, 43, 4657–4666. [Google Scholar] [CrossRef] [PubMed]
- Rampa, A.; Piazzi, L.; Belluti, F.; Gobbi, S.; Bisi, A.; Bartolini, M.; Andrisano, V.; Cavrini, V.; Cavalli, A.; Recanatini, M. Acetylcholinesterase inhibitors: SAR and kinetic studies on ω-[N-methyl-N-(3-alkylcarbamoyloxyphenyl) methyl] aminoalkoxyaryl derivatives. J. Med. Chem. 2001, 44, 3810–3820. [Google Scholar] [CrossRef] [PubMed]
- Sterling, J.; Herzig, Y.; Goren, T.; Finkelstein, N.; Lerner, D.; Goldenberg, W.; Miskolczi, I.; Molnar, S.; Rantal, F.; Tamas, T. Novel dual inhibitors of AChE and MAO derived from hydroxy aminoindan and phenethylamine as potential treatment for Alzheimer’s disease. J. Med. Chem. 2002, 45, 5260–5279. [Google Scholar] [CrossRef] [PubMed]
- Rollinger, J.M.; Hornick, A.; Langer, T.; Stuppner, H.; Prast, H. Acetylcholinesterase inhibitory activity of scopolin and scopoletin discovered by virtual screening of natural products. J. Med. Chem. 2004, 47, 6248–6254. [Google Scholar] [CrossRef] [PubMed]
- Camps, P.; Formosa, X.; Munoz-Torrero, D.; Petrignet, J.; Badia, A.; Clos, M.V. Synthesis and pharmacological evaluation of huprine− tacrine heterodimers: Subnanomolar dual Binding site acetylcholinesterase inhibitors. J. Med. Chem. 2005, 48, 1701–1704. [Google Scholar] [CrossRef] [PubMed]
- Camps, P.; Gómez, E.; Muñoz-Torrero, D.; Badia, A.; Clos, M.V.; Curutchet, C.; Muñoz-Muriedas, J.; Luque, F.J. Binding of 13-amidohuprines to acetylcholinesterase: Exploring the ligand-Induced conformational change of the Gly117-Gly118 peptide bond in the oxyanion hole. J. Med. Chem. 2006, 49, 6833–6840. [Google Scholar] [CrossRef] [PubMed]
- Liu, T.; Lin, Y.; Wen, X.; Jorissen, R.N.; Gilson, M.K. BindingDB: A web-accessible database of experimentally determined protein–ligand binding affinities. Nucleic Acids Res. 2006, 35, D198–D201. [Google Scholar] [CrossRef] [PubMed]
- Luo, W.; Yu, Q.-s.; Kulkarni, S.S.; Parrish, D.A.; Holloway, H.W.; Tweedie, D.; Shafferman, A.; Lahiri, D.K.; Brossi, A.; Greig, N.H. Inhibition of human acetyl-and butyrylcholinesterase by novel carbamates of (−)-and (+)-tetrahydrofurobenzofuran and methanobenzodioxepine. J. Med. Chem. 2006, 49, 2174–2185. [Google Scholar] [CrossRef] [PubMed]
- Marco-Contelles, J.; León, R.; de los Ríos, C.; Guglietta, A.; Terencio, J.; López, M.G.; García, A.G.; Villarroya, M. Novel Multipotent Tacrine− Dihydropyridine Hybrids with Improved Acetylcholinesterase Inhibitory and Neuroprotective Activities as Potential Drugs for the Treatment of Alzheimer’s Disease. J. Med. Chem. 2006, 49, 7607–7610. [Google Scholar] [CrossRef] [PubMed]
- Camps, P.; Formosa, X.; Galdeano, C.; Gómez, T.; Munoz-Torrero, D.; Scarpellini, M.; Viayna, E.; Badia, A.; Clos, M.V.; Camins, A. Novel donepezil-based inhibitors of acetyl-and butyrylcholinesterase and acetylcholinesterase-induced β-amyloid aggregation. J. Med. Chem. 2008, 51, 3588–3598. [Google Scholar] [CrossRef] [PubMed]
- León, R.; de los Ríos, C.; Marco-Contelles, J.; Huertas, O.; Barril, X.; Luque, F.J.; López, M.G.; García, A.G.; Villarroya, M. New tacrine-dihydropyridine hybrids that inhibit acetylcholinesterase, calcium entry, and exhibit neuroprotection properties. Bioorg. Med. Chem. 2008, 16, 7759–7769. [Google Scholar] [CrossRef] [PubMed]
- Ronco, C.; Sorin, G.; Nachon, F.; Foucault, R.; Jean, L.; Romieu, A.; Renard, P.-Y. Synthesis and structure–activity relationship of Huprine derivatives as human acetylcholinesterase inhibitors. Bioorg. Med. Chem. 2009, 17, 4523–4536. [Google Scholar] [CrossRef] [PubMed]
- Fernández-Bachiller, M.I.; Pérez, C.n.; Monjas, L.; Rademann, J.r.; Rodríguez-Franco, M.I. New Tacrine–4-Oxo-4 H-chromene hybrids as multifunctional agents for the treatment of alzheimer’s disease, with cholinergic, antioxidant, and β-amyloid-reducing properties. J. Med. Chem. 2012, 55, 1303–1317. [Google Scholar] [CrossRef] [PubMed]
- Galdeano, C.; Viayna, E.; Sola, I.; Formosa, X.; Camps, P.; Badia, A.; Clos, M.V.; Relat, J.; Ratia, M.; Bartolini, M. Huprine–tacrine heterodimers as anti-amyloidogenic compounds of potential interest against Alzheimer’s and prion diseases. J. Med. Chem. 2012, 55, 661–669. [Google Scholar] [CrossRef] [PubMed]
- Hamulakova, S.; Janovec, L.; Hrabinova, M.; Kristian, P.; Kuca, K.; Banasova, M.; Imrich, J. Synthesis, design and biological evaluation of novel highly potent tacrine congeners for the treatment of Alzheimer’s disease. Eur. J. Med. Chem. 2012, 55, 23–31. [Google Scholar] [CrossRef] [PubMed]
- Debnath, A.K. Pharmacophore mapping of a series of 2, 4-diamino-5-deazapteridine inhibitors of Mycobacterium avium complex dihydrofolate reductase. J. Med. Chem. 2002, 45, 41–53. [Google Scholar] [CrossRef] [PubMed]
- Cheung, J.; Rudolph, M.J.; Burshteyn, F.; Cassidy, M.S.; Gary, E.N.; Love, J.; Franklin, M.C.; Height, J.J. Structures of human acetylcholinesterase in complex with pharmacologically important ligands. J. Med. Chem. 2012, 55, 10282–10286. [Google Scholar] [CrossRef] [PubMed]
- Nachon, F.; Carletti, E.; Ronco, C.; Trovaslet, M.; Nicolet, Y.; Jean, L.; Renard, P.-Y. Crystal structures of human cholinesterases in complex with huprine W and tacrine: Elements of specificity for anti-Alzheimer’s drugs targeting acetyl-and butyryl-cholinesterase. Biochem. J. 2013, 453, 393–399. [Google Scholar] [CrossRef] [PubMed]
- Lipinski, C.A.; Lombardo, F.; Dominy, B.W.; Feeney, P.J. Experimental and computational approaches to estimate solubility and permeability in drug discovery and development settings. Adv. Drug Deliv. Rev. 1997, 23, 3–25. [Google Scholar] [CrossRef]
- Walters, W.P.; Murcko, M.A. Prediction of ‘drug-likeness’. Adv. Drug Deliv. Rev. 2002, 54, 255–271. [Google Scholar] [CrossRef]
- Jones, G.; Willett, P.; Glen, R.C.; Leach, A.R.; Taylor, R. Development and validation of a genetic algorithm for flexible docking. J. Mol. Biol. 1997, 267, 727–748. [Google Scholar] [CrossRef] [PubMed]
- Verdonk, M.L.; Cole, J.C.; Hartshorn, M.J.; Murray, C.W.; Taylor, R.D. Improved protein–ligand docking using GOLD. Proteins 2003, 52, 609–623. [Google Scholar] [CrossRef] [PubMed]
- Duan, Y.; Wu, C.; Chowdhury, S.; Lee, M.C.; Xiong, G.; Zhang, W.; Yang, R.; Cieplak, P.; Luo, R.; Lee, T. A point-charge force field for molecular mechanics simulations of proteins based on condensed-phase quantum mechanical calculations. J. Computat. Chem. 2003, 24, 1999–2012. [Google Scholar] [CrossRef] [PubMed]
- Da Silva, A.W.S.; Vranken, W.F. ACPYPE-Antechamber python parser interface. BMC Res. Notes 2012, 5, 367. [Google Scholar] [CrossRef] [PubMed]
- Jorgensen, W.L.; Chandrasekhar, J.; Madura, J.D.; Impey, R.W.; Klein, M.L. Comparison of simple potential functions for simulating liquid water. J. Chem. Physics 1983, 79, 926–935. [Google Scholar] [CrossRef]
- Nosé, S. A unified formulation of the constant temperature molecular dynamics methods. J. Chem. Physics 1984, 81, 511–519. [Google Scholar] [CrossRef]
- Hoover, W.G. Canonical dynamics: Equilibrium phase-space distributions. Phys. Rev. A 1985, 31, 1695. [Google Scholar] [CrossRef]
- Parrinello, M.; Rahman, A. Polymorphic transitions in single crystals: A new molecular dynamics method. J. Appl. Physics 1981, 52, 7182–7190. [Google Scholar] [CrossRef]
- Nosé, S.; Klein, M. Constant pressure molecular dynamics for molecular systems. Mol. Physics 1983, 50, 1055–1076. [Google Scholar] [CrossRef]
- Ryckaert, J.-P.; Ciccotti, G.; Berendsen, H.J. Numerical integration of the cartesian equations of motion of a system with constraints: Molecular dynamics of n-alkanes. J. Chem. Physics 1977, 23, 327–341. [Google Scholar] [CrossRef]
- Hess, B.; Bekker, H.; Berendsen, H.J.; Fraaije, J.G. LINCS: A linear constraint solver for molecular simulations. J. Computat. Chem. 1997, 18, 1463–1472. [Google Scholar] [CrossRef]
- Miyamoto, S.; Kollman, P.A. Settle: An analytical version of the SHAKE and RATTLE algorithm for rigid water models. J. Computat. Chem. 1992, 13, 952–962. [Google Scholar] [CrossRef]
- Darden, T.; York, D.; Pedersen, L. Particle mesh Ewald: An N⋅ log (N) method for Ewald sums in large systems. J. Chem. Physics 1993, 98, 10089–10092. [Google Scholar] [CrossRef]
- Essmann, U.; Perera, L.; Berkowitz, M.L.; Darden, T.; Lee, H.; Pedersen, L.G. A smooth particle mesh Ewald method. J. Chem. Physics 1995, 103, 8577–8593. [Google Scholar] [CrossRef]
- Kumari, R.; Kumar, R.; Consortium, O.S.D.D.; Lynn, A. g_mmpbsa—A GROMACS tool for high-throughput MM-PBSA calculations. J. Chem. Inform. Model. 2014, 54, 1951–1962. [Google Scholar] [CrossRef] [PubMed]


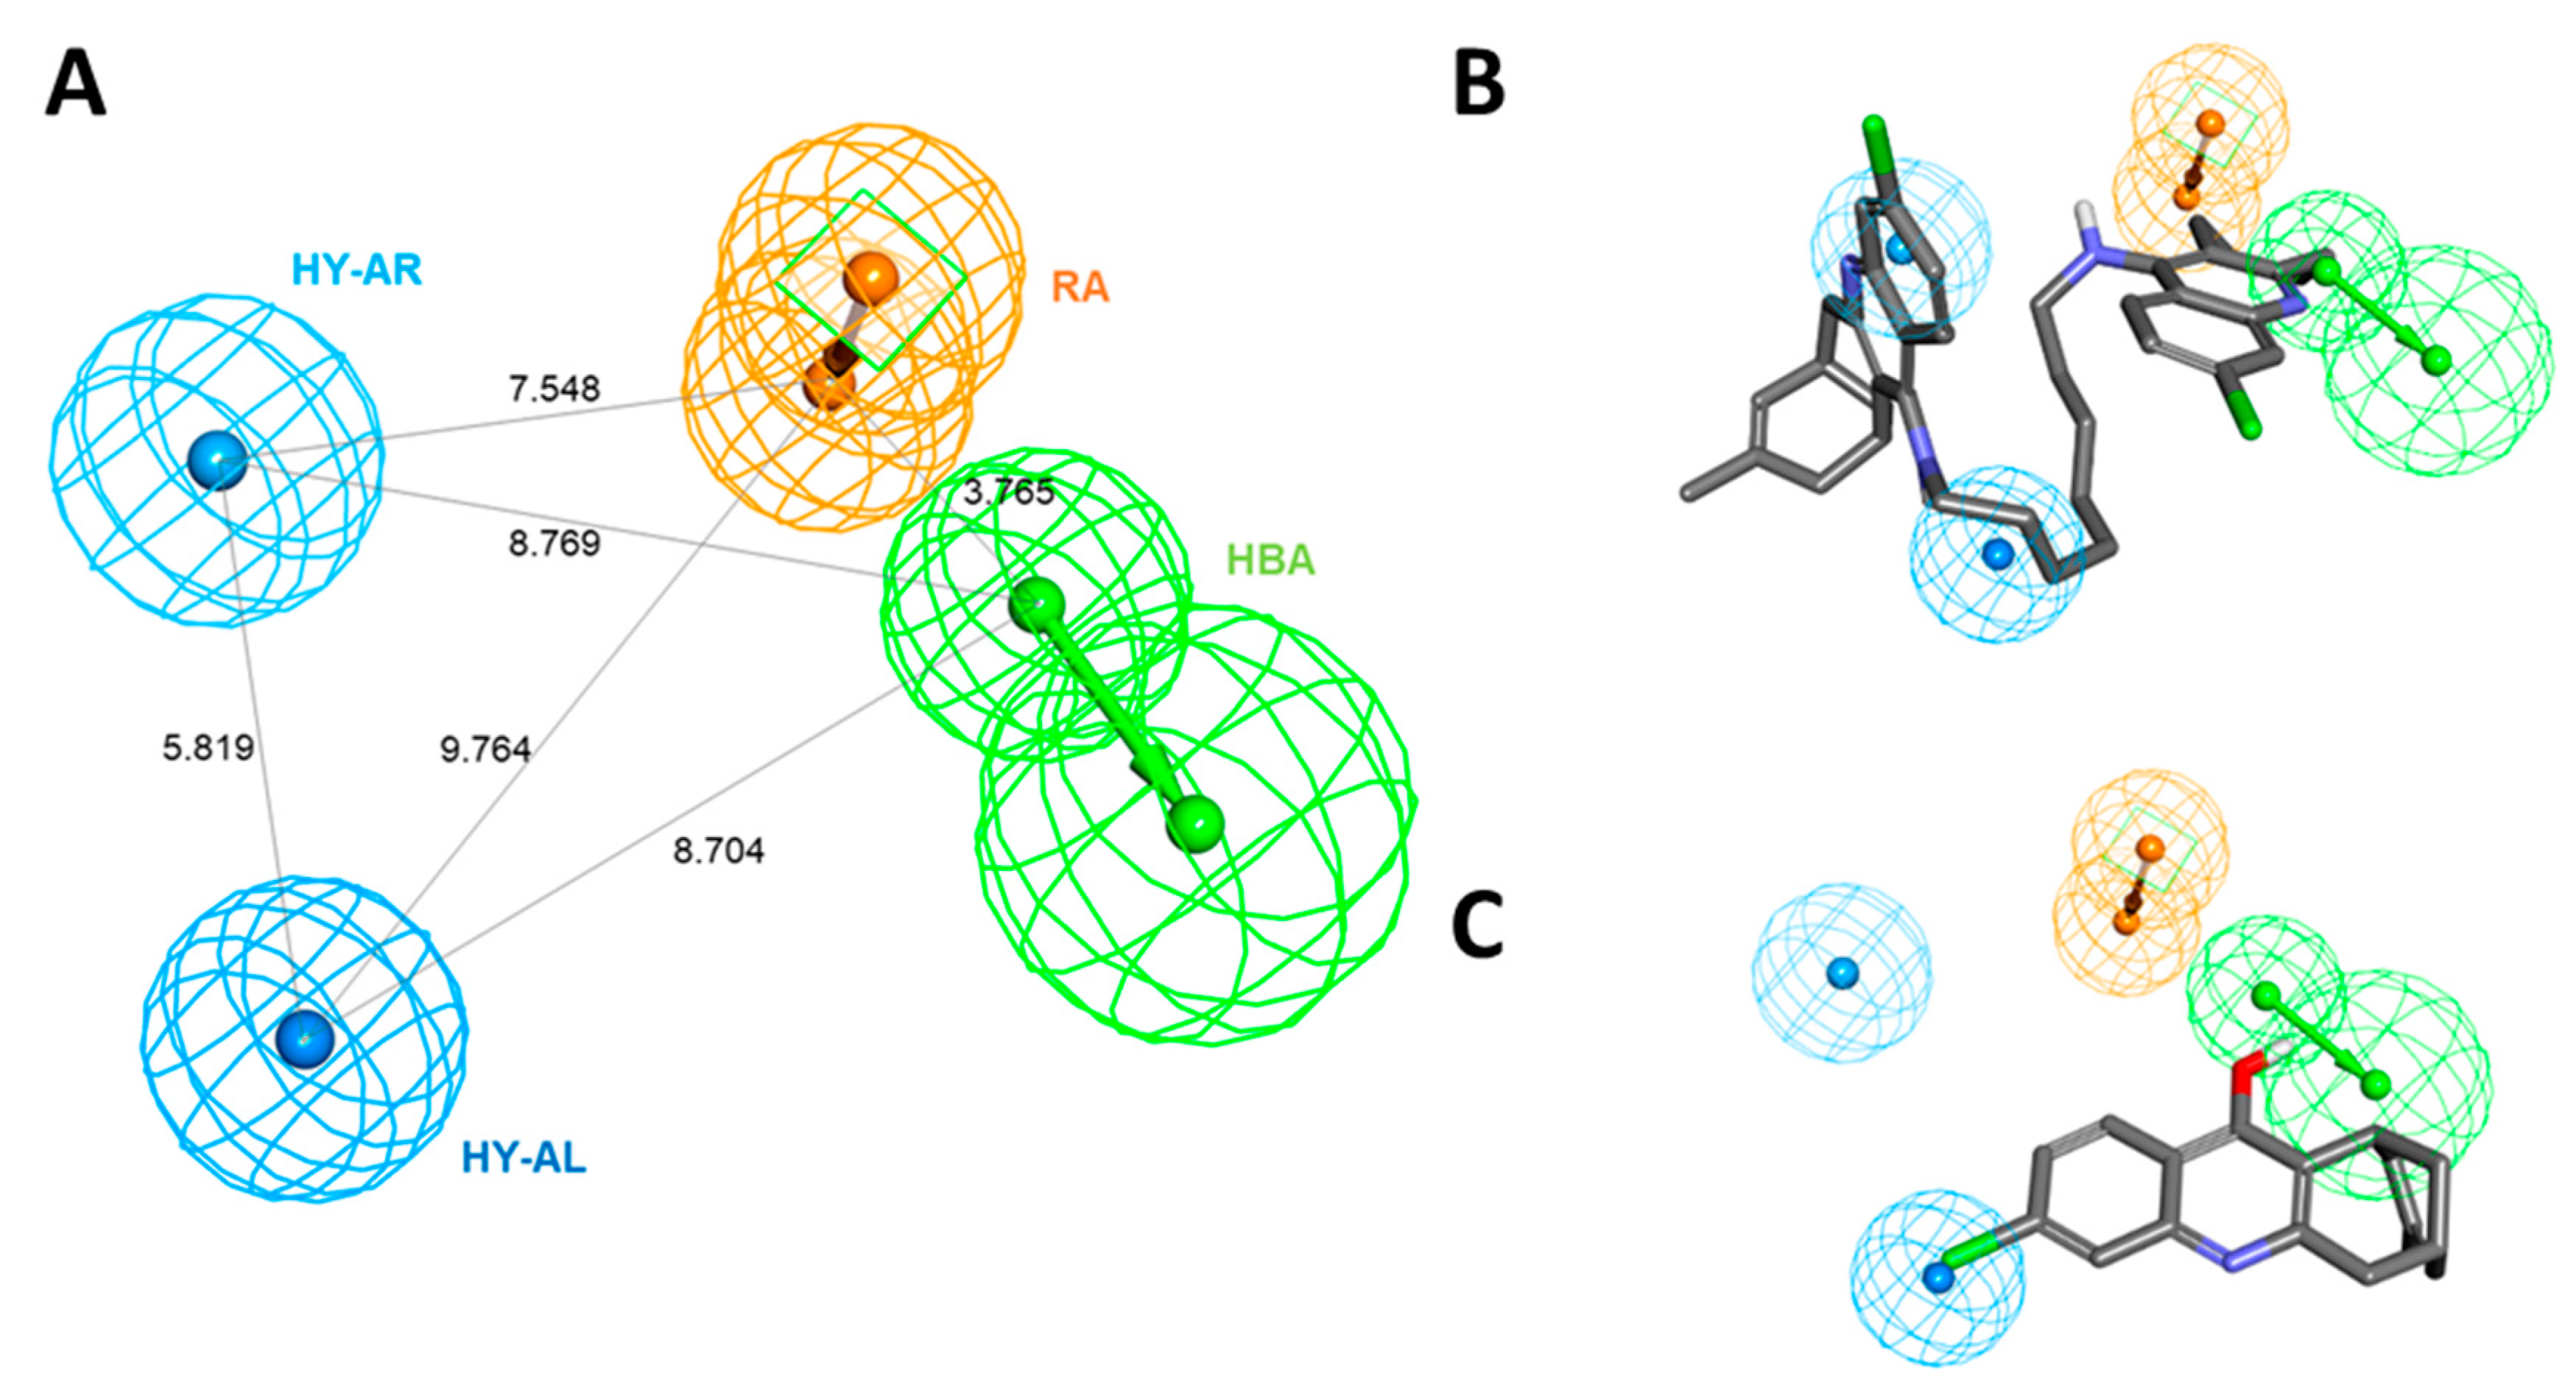
| Hypothesis | Total Cost | Cost Difference a | RMSD b | Correlation | Features c |
|---|---|---|---|---|---|
| Hypo 1 | 99.280 | 116.592 | 1.323 | 0.943 | HBA, HY-AL, HY-AR, RA |
| Hypo 2 | 99.280 | 116.592 | 1.324 | 0.943 | HBA, HY-AL, HY-AR, RA |
| Hypo 3 | 99.681 | 116.191 | 1.343 | 0.941 | HBA, HY-AL, HY-AR, RA |
| Hypo 4 | 99.751 | 116.121 | 1.331 | 0.942 | HBA, HY-AL, HY-AR, RA |
| Hypo 5 | 99.957 | 115.915 | 1.340 | 0.942 | HBA, HY-AL, HY-AR |
| Hypo 6 | 100.012 | 115.860 | 1.346 | 0.941 | HBA, HY-AL, 2HY-AR |
| Hypo 7 | 105.818 | 110.054 | 1.606 | 0.914 | HBA, HY-AL, HY-AR, RA |
| Hypo 8 | 106.957 | 108.915 | 1.620 | 0.913 | HBA, HY-AL, HY-AR, RA |
| Hypo 9 | 108.050 | 107.822 | 1.650 | 0.908 | HBA, HY-AL, HY-AR, RA |
| Hypo 10 | 108.40 | 107.474 | 1.663 | 0.908 | HBA, HY-AL, HY-AR, RA |
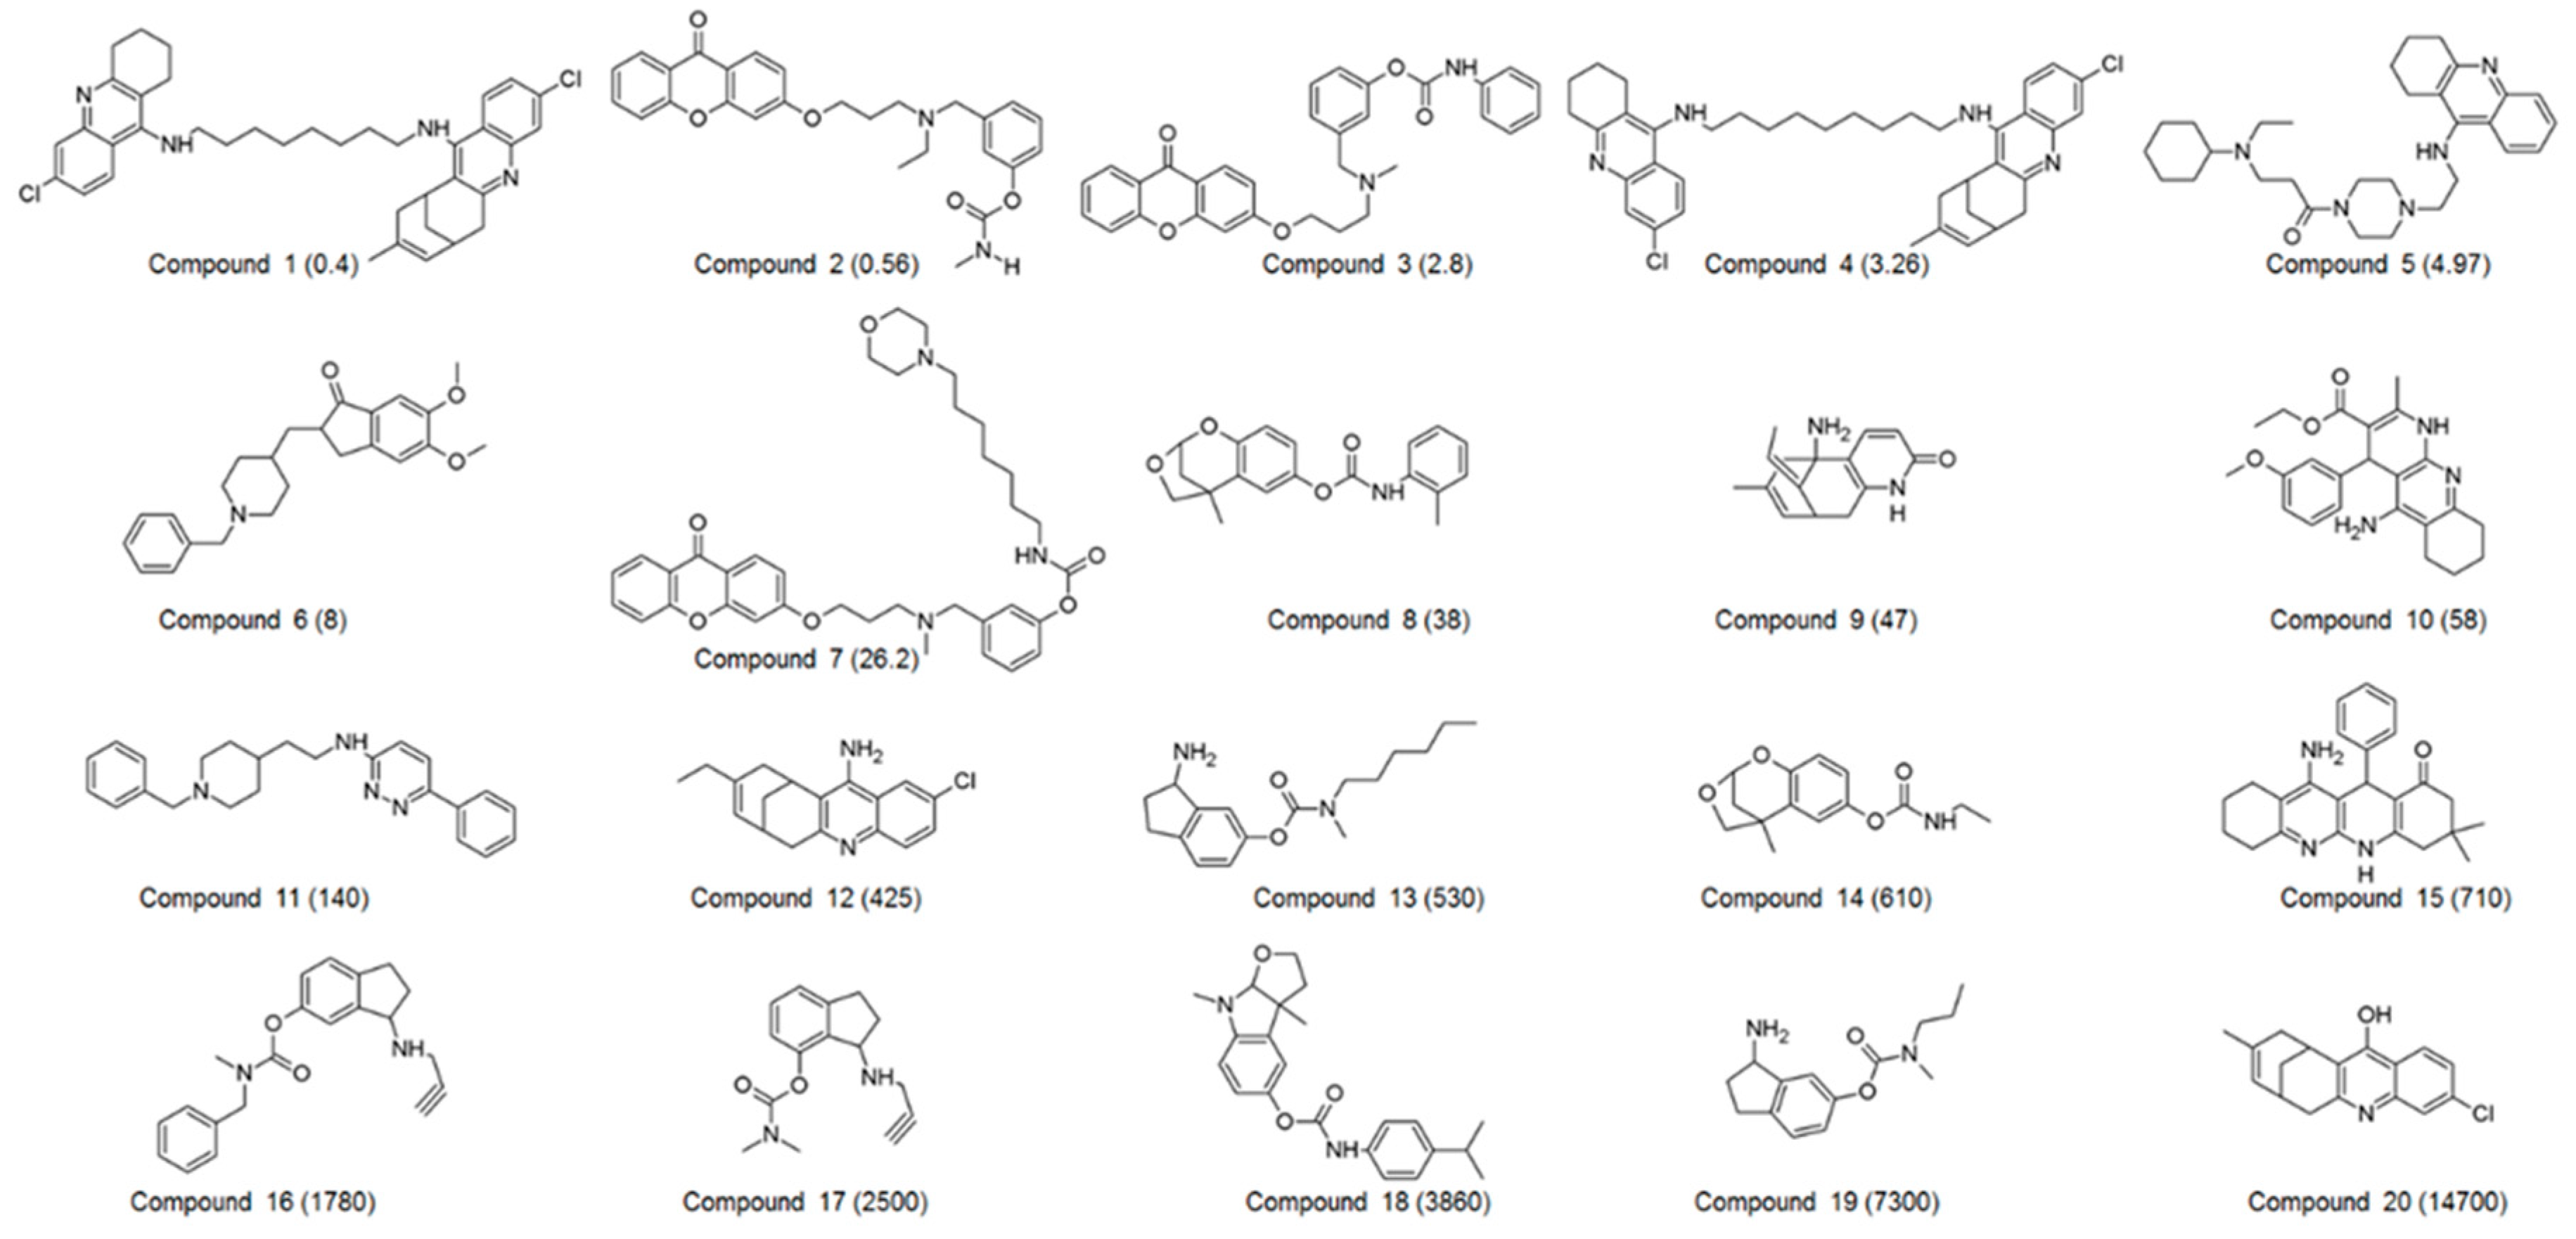
| Compound No. | Experimental IC50 (nM) | Estimated IC50 (nM) | Error a | Experimental Scale b | Estimated Scale b | Fit Value c |
|---|---|---|---|---|---|---|
| 1 | 0.4 | 1.5 | +3.8 | ++++ | ++++ | 7.21 |
| 2 | 0.56 | 0.93 | +1.7 | ++++ | ++++ | 7.42 |
| 3 | 2.8 | 3.2 | +1.1 | ++++ | ++++ | 6.89 |
| 4 | 3.26 | 4.7 | +1.4 | ++++ | ++++ | 6.72 |
| 5 | 4.97 | 2.2 | −2.3 | ++++ | ++++ | 7.05 |
| 6 | 8 | 8.9 | +1.1 | ++++ | ++++ | 6.44 |
| 7 | 26.2 | 20 | −1.3 | +++ | +++ | 6.08 |
| 8 | 38 | 120 | +3.2 | +++ | +++ | 5.30 |
| 9 | 47 | 130 | +2.7 | +++ | +++ | 5.29 |
| 10 | 58 | 140 | +2.3 | +++ | +++ | 5.26 |
| 11 | 140 | 150 | +1.1 | +++ | +++ | 5.21 |
| 12 | 425 | 850 | +2 | ++ | ++ | 4.46 |
| 13 | 530 | 260 | −2 | ++ | ++ | 4.98 |
| 14 | 610 | 130 | −4.7 | ++ | +++ | 5.28 |
| 15 | 710 | 510 | −1.4 | ++ | ++ | 4.68 |
| 16 | 1780 | 360 | −4.9 | ++ | ++ | 4.83 |
| 17 | 2500 | 980 | −2.6 | + | ++ | 4.40 |
| 18 | 3860 | 320 | −12 | + | ++ | 4.88 |
| 19 | 7300 | 15,000 | +2 | + | + | 3.23 |
| 20 | 14,700 | 89,000 | +6.1 | + | + | 2.44 |
| No. | Compound | Hydrogen Bond (Ǻ) | π–π Stacking | π-Alkyl | Hydrophobic |
|---|---|---|---|---|---|
| 1 | Hit 1 | H56—Gln71:OE (2.53); H48—Tyr72:O (2.66); N15—Asp74:H (2.47); H39—Ser125:OG (2.49); O23—Gly126:HA2 (2.73); O11—Tyr337:HH (1.88); O11—Tyr341:HH (2.83) | Tyr72, Trp286, Tyr341 | Phe338 | Val73, Trp86, Pro88, Gly121, Tyr124, Ala127, Leu130, Tyr133, Glu202, Glu292, Ser293, Gly342, Gly448 |
| 2 | Hit 2 | O13—Tyr337:HH (1.87); H46—Phe338:O (2.70); H61—His447:O (2.47) | Tyr341 | Tyr72, Tyr124, Trp286 | Asp74, Thr83, Trp86, Asn87, Ser125, Tyr133, Glu202, Glu292, Ser293, Val294, Phe295, Phe297, Leu339, Gly342, Ala343, Gly448, Ile451 |
| 3 | Hit 3 | H58—Thr83:O (2.38); N16—Asn87:HD21 (2.74); H40—Gly121:O (3.05); O10—Gly121:HA (2.51); O15—Tyr124:HH (2.56); O10—Ser125:HG (2.25); H40—Ser125:OG (1.81); H60—Glu202:OE2 (2.71); O12—Tyr337:HH (2.16); H52—His447:NE2 (2.55); H53—His447:NE2 (2.72) | Tyr124, Tyr341 | Tyr72, Trp286, Phe297, Phe338 | Asp74, Trp86, Pro88, Gly122, Gly126, Ser203 Glu292, Ser293, Val294, Phe295, Arg296, Gly342 |
| 4 | Hit 4 | H50—Tyr72:O (2.02); O20—Asp74:H (2.72); H41—Trp86:O (2.97); H46—Trp86:O (2.94); O23—Tyr124:HH (2.41); H44—Tyr124:OH (2.99); N10—Ser125:HG (1.94); O11—Tyr133:HH (2.85); 17—Tyr337:HH (2.92); O14—Gly448:HA1 (2.84) | Trp86, Tyr337 | Val73, Tyr124, Tyr341 | Gln71, Gly82, Thr83, Asn87, Pro88, Gly120, Gly121, Gly122, Gly126, Leu130, Ser203, Phe297, Phe338, Trp439, His447 |
| No. | Compound | Evdw | Eelec | Gpolar | Gnonpolar | Gbinding |
|---|---|---|---|---|---|---|
| 1 | DNP | −229.18 ± 11.96 | −25.55 ± 6.77 | 104.57 ± 15.24 | −22.69 ± 0.89 | −172.86 ± 12.06 |
| 2 | GNT | −176.69 ± 8.24 | −52.49 ± 18.03 | 116.92 ± 26.18 | −16.00 ± 0.66 | −128.25 ± 19.27 |
| 3 | HUP | −174.90 ± 6.68 | −37.84 ± 9.05 | 121.42 ± 15.04 | −14.65 ± 0.65 | −105.98 ± 11.26 |
| 4 | HUW | −169.03 ± 13.95 | −19.49 ± 15.20 | 89.95 ± 31.79 | −17.54 ± 0.90 | −116.11 ± 17.99 |
| 5 | Hit 1 | −246.59 ± 10.98 | −26.22 ± 7.66 | 149.92 ± 18.92 | −24.87 ± 0.99 | −147.77 ± 17.30 |
| 6 | Hit 2 | −263.92 ± 14.68 | −12.06 ± 9.93 | 137.80 ± 23.00 | −27.32 ± 0.80 | −165.51 ± 19.17 |
| 7 | Hit 3 | −273.73 ± 15.13 | −51.68 ± 11.30 | 179.79 ± 24.75 | −27.18 ± 0.94 | −172.80 ± 20.28 |
| 8 | Hit 4 | −251.71 ± 16.46 | −62.46 ± 15.70 | 190.82 ± 27.06 | −23.61 ± 0.76 | −146.96 ± 22.08 |
© 2019 by the authors. Licensee MDPI, Basel, Switzerland. This article is an open access article distributed under the terms and conditions of the Creative Commons Attribution (CC BY) license (http://creativecommons.org/licenses/by/4.0/).
Share and Cite
Son, M.; Park, C.; Rampogu, S.; Zeb, A.; Lee, K.W. Discovery of Novel Acetylcholinesterase Inhibitors as Potential Candidates for the Treatment of Alzheimer’s Disease. Int. J. Mol. Sci. 2019, 20, 1000. https://doi.org/10.3390/ijms20041000
Son M, Park C, Rampogu S, Zeb A, Lee KW. Discovery of Novel Acetylcholinesterase Inhibitors as Potential Candidates for the Treatment of Alzheimer’s Disease. International Journal of Molecular Sciences. 2019; 20(4):1000. https://doi.org/10.3390/ijms20041000
Chicago/Turabian StyleSon, Minky, Chanin Park, Shailima Rampogu, Amir Zeb, and Keun Woo Lee. 2019. "Discovery of Novel Acetylcholinesterase Inhibitors as Potential Candidates for the Treatment of Alzheimer’s Disease" International Journal of Molecular Sciences 20, no. 4: 1000. https://doi.org/10.3390/ijms20041000
APA StyleSon, M., Park, C., Rampogu, S., Zeb, A., & Lee, K. W. (2019). Discovery of Novel Acetylcholinesterase Inhibitors as Potential Candidates for the Treatment of Alzheimer’s Disease. International Journal of Molecular Sciences, 20(4), 1000. https://doi.org/10.3390/ijms20041000