Article

Proteome Alterations in Equine Osteochondrotic Chondrocytes

1
Department of Veterinary Medicine, University of Perugia, 06126 Perugia, Italy
2
Department of Experimental Medicine, University of Perugia, 06132 Perugia, Italy
3
ISPAAM, National Research Council, 80147 Naples, Italy
4
Department of Chemistry, Biology and Biotechnology, University of Perugia, 06123 Perugia, Italy
5
CEMIN-Center of Excellence for Innovative Nanostructured Material, 06123 Perugia, Italy
*
Author to whom correspondence should be addressed.
Int. J. Mol. Sci. 2019, 20(24), 6179; https://doi.org/10.3390/ijms20246179
Submission received: 14 November 2019 / Revised: 27 November 2019 / Accepted: 4 December 2019 / Published: 7 December 2019
(This article belongs to the Special Issue Molecular Processes in Chondrocyte Biology)

Abstract

:
Osteochondrosis is a failure of the endochondral ossification that affects developing joints in humans and several animal species. It is a localized idiopathic joint disorder characterized by focal chondronecrosis and growing cartilage retention, which can lead to the formation of fissures, subchondral bone cysts, or intra-articular fragments. Osteochondrosis is a complex multifactorial disease associated with extracellular matrix alterations and failure in chondrocyte differentiation, mainly due to genetic, biochemical, and nutritional factors, as well as traumas. This study describes the main proteomic alterations occurring in chondrocytes isolated from osteochondrotic cartilage fragments. A comparative analysis performed on equine osteochondrotic and healthy chondrocytes showed 26 protein species as differentially represented. In particular, quantitative changes in the extracellular matrix, cytoskeletal and chaperone proteins, and in cell adhesion and signaling molecules were observed in osteochondrotic cells, compared to healthy controls. Functional group analysis annotated most of these proteins in “growth plate and cartilage development”, while others were included in “glycolysis and gluconeogenesis”, “positive regulation of protein import”, “cell–cell adhesion mediator activity”, and “mitochondrion nucleoid”. These results may help to clarify some chondrocyte functional alterations that may play a significant role in determining the onset and progression of equine osteochondrosis and, being related, of human juvenile osteochondrosis.

1. Introduction

Osteochondrosis (OC) is a multifocal disease, which affects articular-epiphyseal cartilage complexes and growth plates in various mammalian species such as horses and humans. The cause of OC is not fully understood, even if different factors, including skeletal growth rates, nutrition, genetics, or physical activity, have been implicated [1,2,3,4,5,6]. The pathogenesis of OC is similar across the species [7]. In humans, osteochondroses are a group of disorders with a different name according to the affected anatomical sites. In particular, equine OC has similar symptoms, predilection sites, and clinical presentation as human juvenile OC [7]. In both humans and horses, OC is characterized by focal chondronecrosis and retention of growth cartilage, which can lead to the formation of fissures, subchondral bone cysts, and intra-articular fragments (osteochondrosis dissecans or OCD) [2,3]. This disorder is one of the most common causes of degenerative joint diseases. Indeed, the progression of cartilage lesions and the presence of intra-articular fragments can also develop in early onset osteoarthritis (OA) [4,5]. The molecular events that can drive the chondrocyte biogenesis impairment and extracellular matrix (ECM) alteration, common features in OC, seem to be related to mitochondrial and endoplasmic reticulum alterations, oxidative stress, and endocrinological dysfunction [8].
As for other joint diseases, interactions between chondrocytes and ECM may play key roles in OC. Indeed, chondrocytes, the only cell type present in articular cartilage, represent the main coordinators of endochondral ossification. They synthetize molecular components of ECM and the enzymes involved in the normal cartilage turnover. However, alterations in molecular ECM composition represent further signals for modulating chondrocyte metabolism [9].
In this study, differential gel electrophoresis analysis followed by mass spectrometry-based protein identification were performed in order to determine the protein alterations that occur in equine OC chondrocytes, and to clarify molecular processes and metabolic aspects of damaged tissues. In recent years, proteomics has been used to investigate the pathogenesis of joint diseases such as OA and rheumatoid arthritis [10,11,12,13]. However, there are few proteomic studies on osteochondrosis, and most of them are focused on tissue (cartilage and subchondral bone) [14,15] or synovial fluid [16,17] analysis. To the best of our knowledge, this work describes the first proteomic analysis of osteochondrotic chondrocytes and corresponding molecular signatures, which could be indicative of the alterations of cell functions involved in osteochondrosis. This study also provides suggestions for new research topics and for clarifying the molecular aspects of OC across different animal species.

2. Results

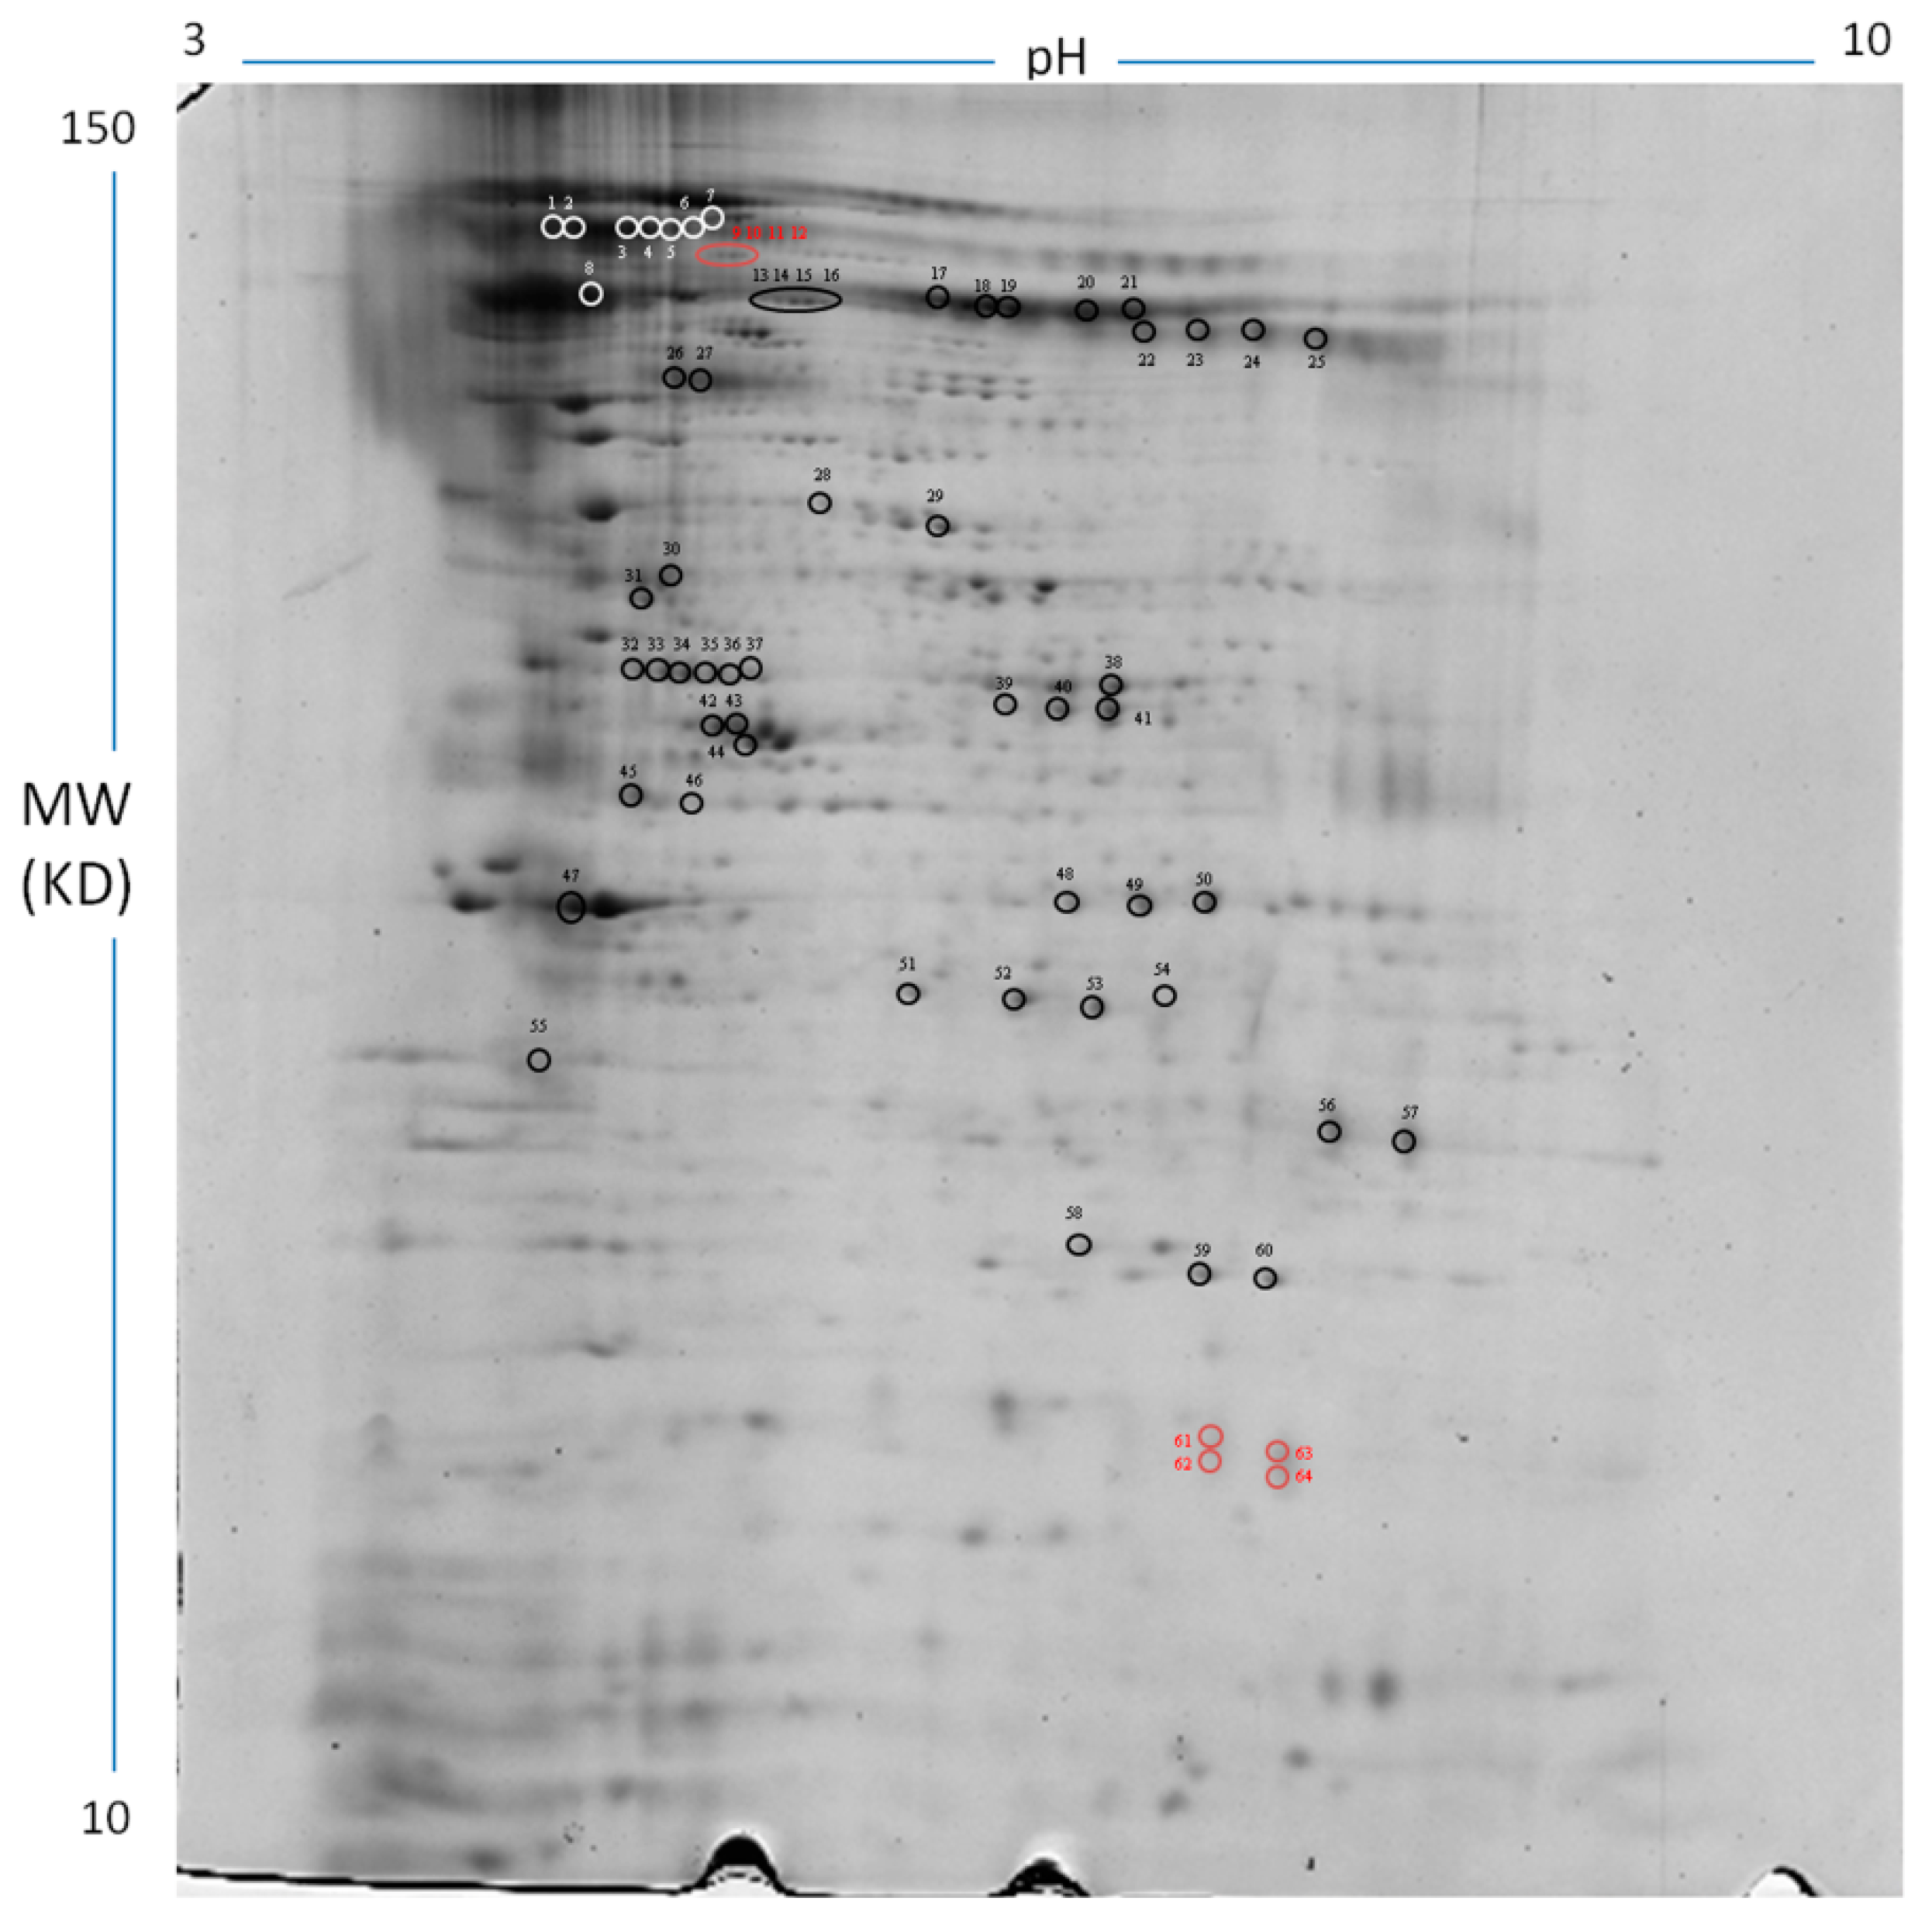
2.1. 2DE Analysis of Proteins Extracted from OC and Normal Chondrocytes

Proteomic profiles of chondrocytes isolated from normal (Controls) and osteochondrotic (OC) cartilage were analyzed using 2DE combined with mass spectrometry (MS) procedures in order to identify protein signatures, which may be indicative of the molecular alterations occurring in the disease. The analyses were performed by comparing protein spots resolved in 2DE gel within pI 3–10 and Mr 10–150 kDa ranges (Figure 1). Coomassie staining evidenced an average of 188 ± 20 and 177 ± 12 spots in CTR-gels and OC-gels, respectively, with a degree of similarity 88.91%.
Quantitative comparative analysis evidenced 64 peptide spots (marked in Figure 1) having a representation variation greater than twofold in OC gels, with respect to controls (p < 0.05). They corresponded to 26 different gene products. These protein spots and corresponding fold changes are reported in Table 1. The protein identification and MS analysis data are described in Table S1.
Thirty-one spots corresponded to three alpha chains of collagen VI, namely collagen alpha-1 (VI) chain (COL6A1), collagen alpha-2 (VI) chain (COL6A2), and collagen alpha 3 (VI) chain (COL6A3). More specifically, we observed a decrease in spots with similar experimental and theoretical molecular mass values, while spots identified as probable fragments (experimental molecular mass < theoretical molecular mass) were highly abundant. Some of these fragments were only detected in the OC gels. Other deregulated ECM and perichondrium proteins were hyaluronan and proteoglycan link protein 1 (HAPLN1) and cartilage intermediate layer protein 1 (CILP-1). The proteomic analysis also showed alterations in cytoskeletal proteins, such as vimentin (VIM), junction plakoglobin (JUC), and actin cytoplasmic 1 (ACTG1), as well as in chaperone proteins. In particular, increases were observed for endoplasmic reticulum resident protein 44 (ERp44), while decreases were observed for endoplasmin (HSP90B1) and 14-3-3 protein theta (YWHAQ). There was also a down-representation of enzymes involved in amino acid metabolism, such as mitochondrial ornithine aminotransferase (OAT) and adenosylhomocysteinase (AHCY).
The OC cells also showed over-representation of glycolytic enzymes, namely triosephosphate isomerase (TPI1), enolase 1 (ENO1), and L-lactate dehydrogenase (L-LDH), as well as the enzymes involved in the mitochondrial energy production, such as ATP synthase beta subunit (ATP5B), succinyl-CoA ligase (SUCLG1), trifunctional mitochondrial enzyme subunit beta (HADHB), and enoyl-CoA hydratase mitochondrial (ECHS1). Moreover, the osteochondrotic cells showed increases in voltage-dependent anion-selective channel protein 2 (VDAC2), lactadherin (MFGE8), annexin A1 (ANXA1), and annexin A2 (ANXA2). Lastly, three spots with different fold change trends corresponding to superoxide dismutase (SOD) were also identified.

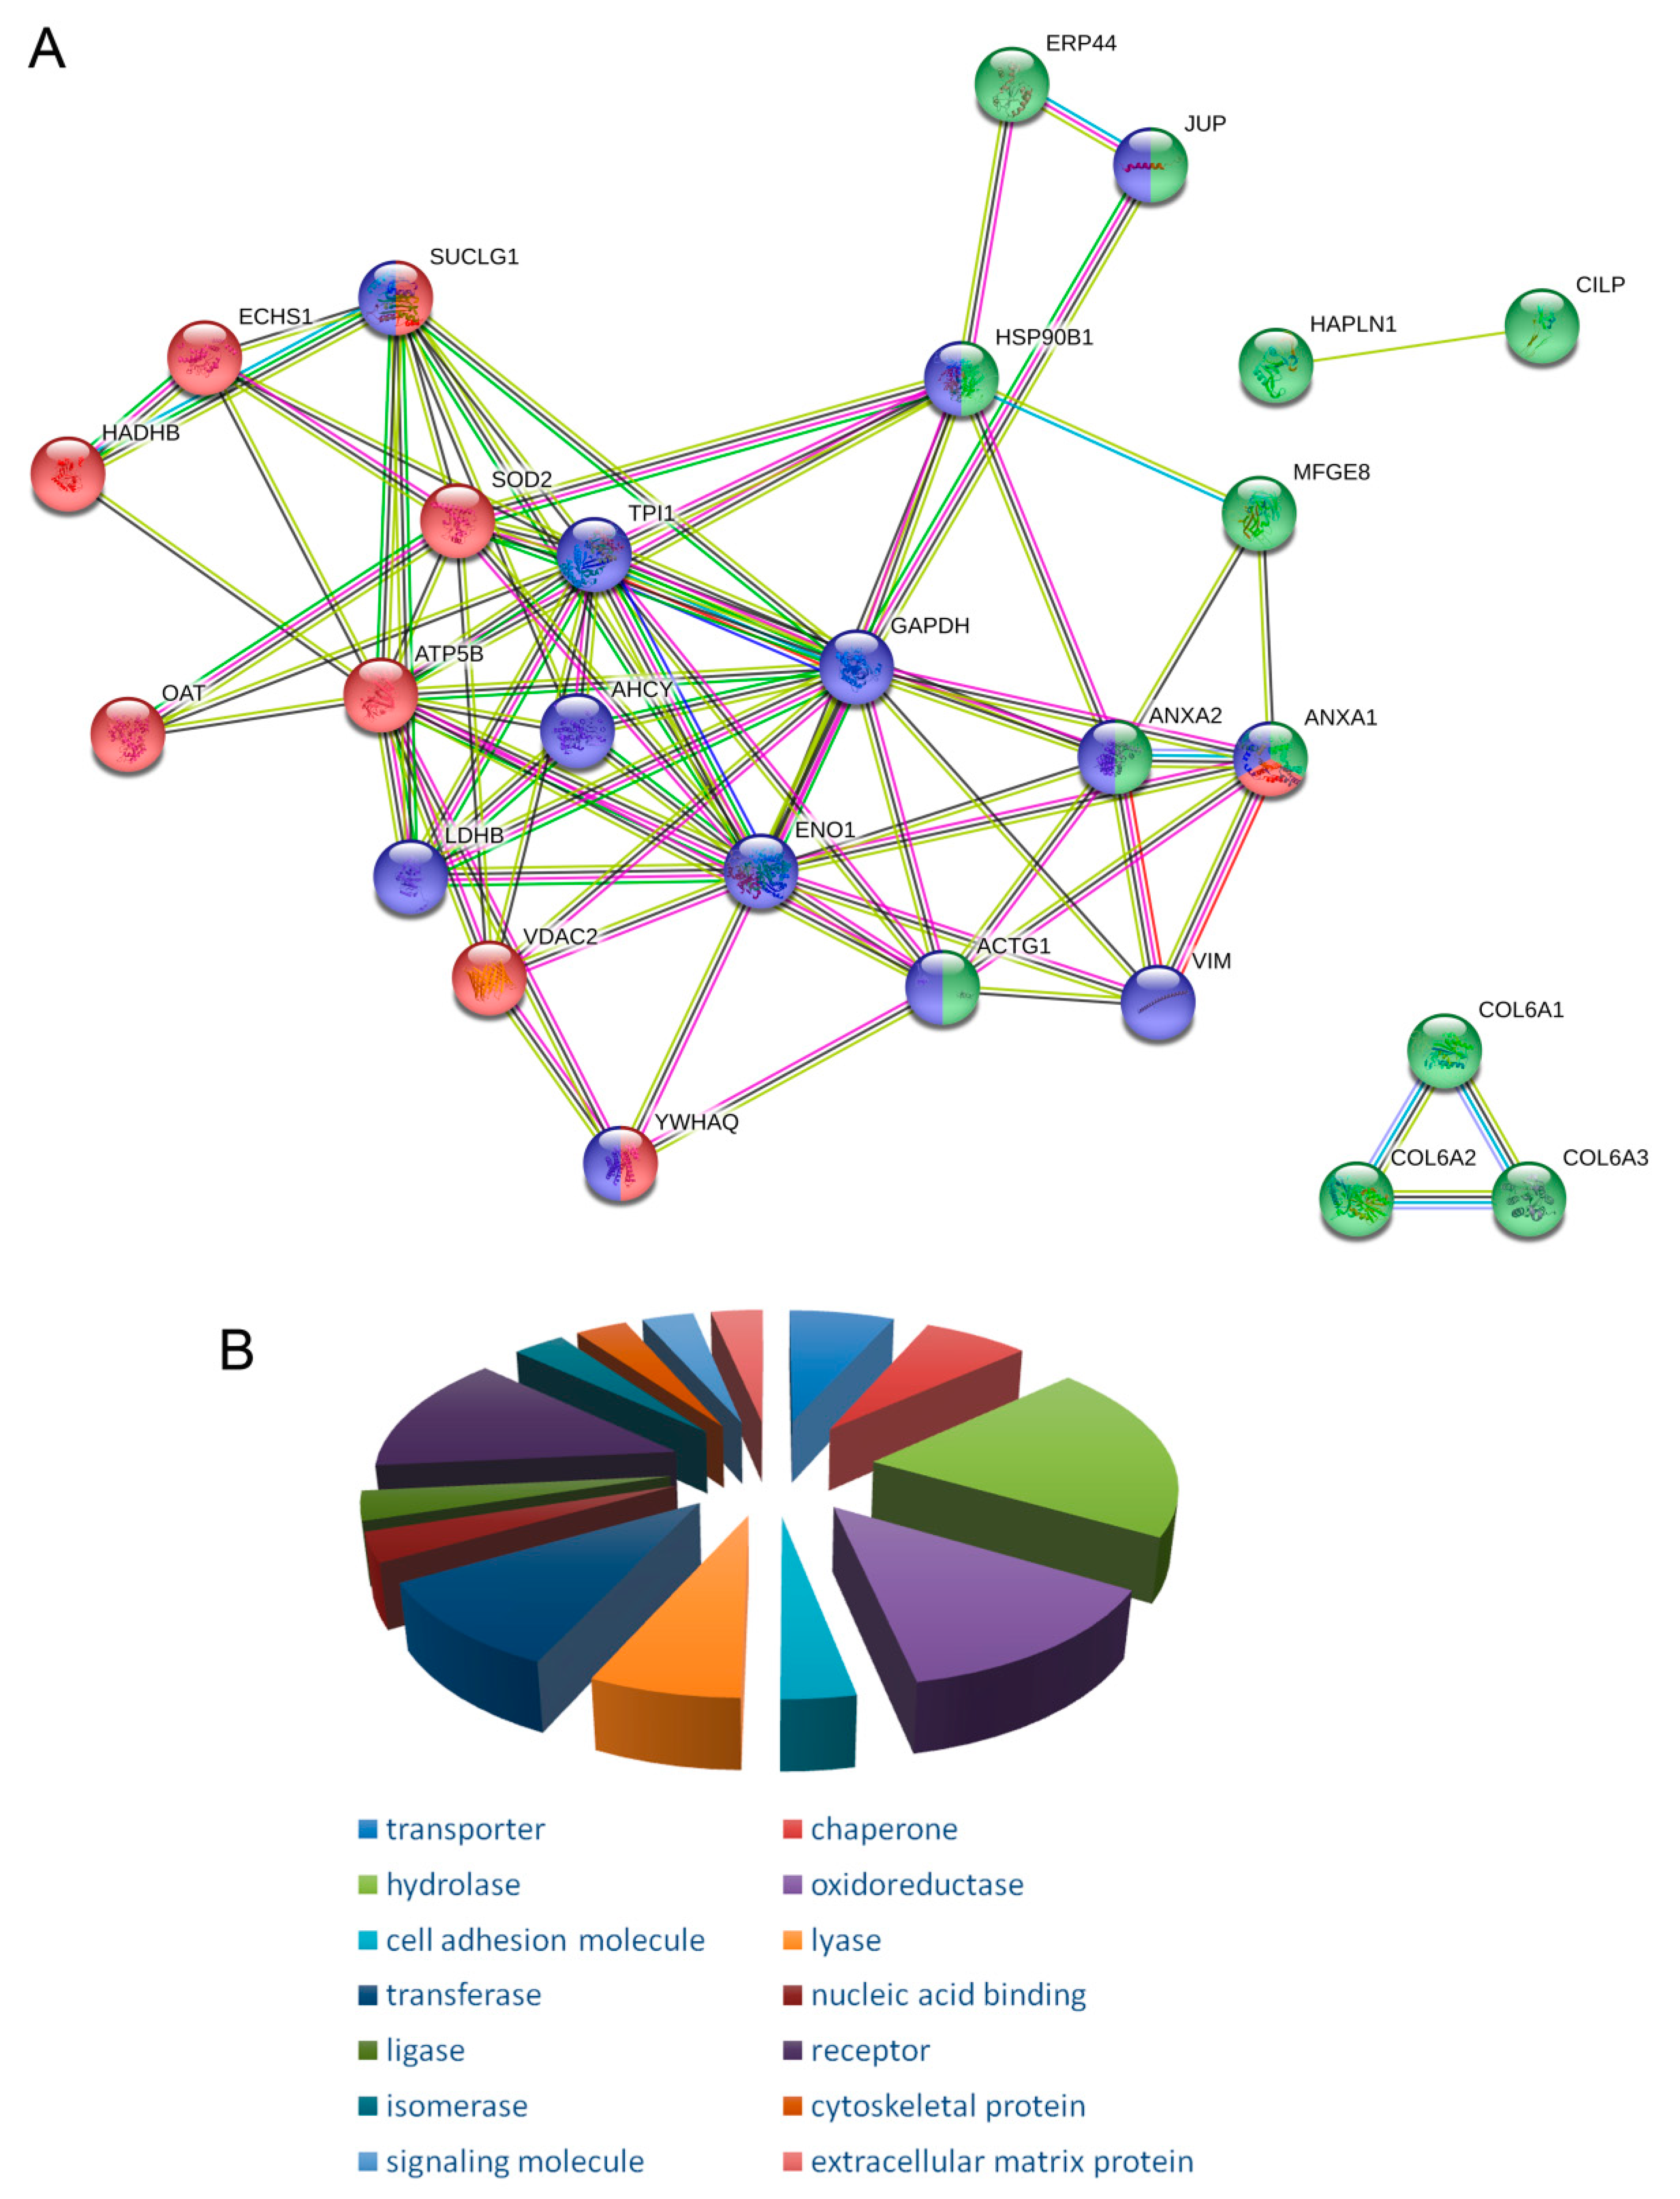
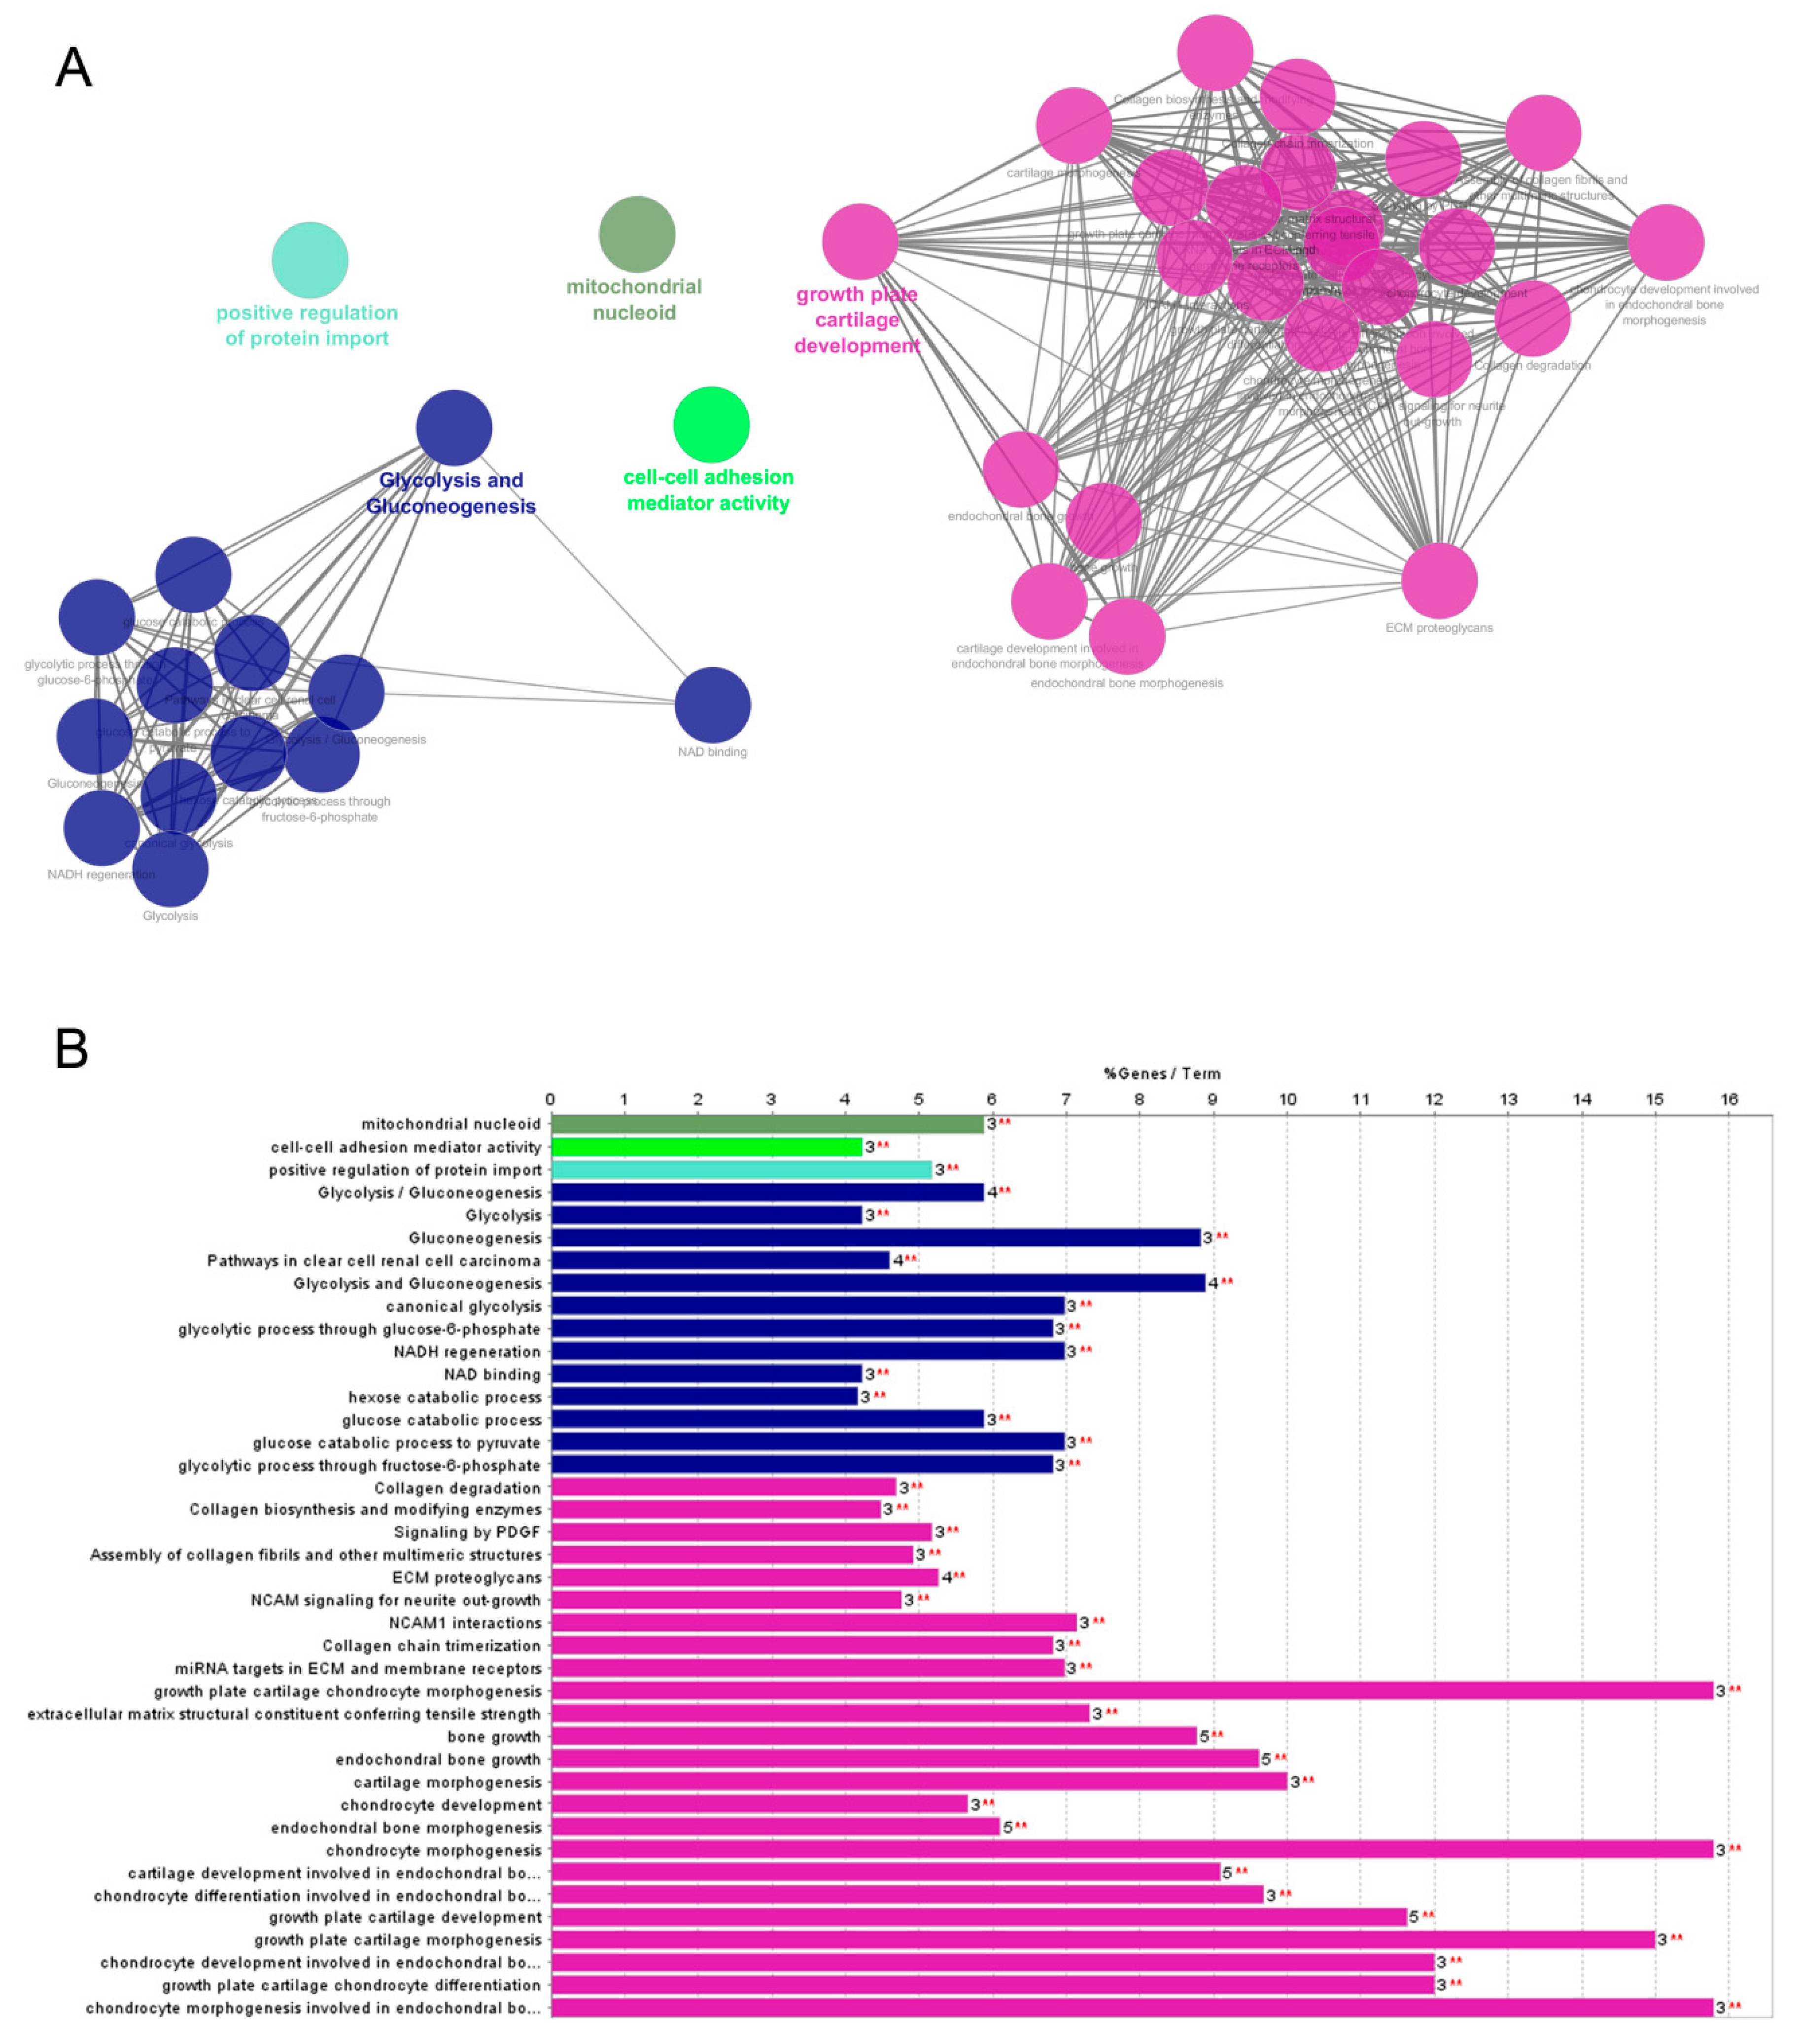
2.2. Protein Enrichment Analysis

The protein–protein interaction analysis performed using STRING (Figure 2A) indicated that the proteins differentially represented in OC cells are highly functionally correlated (p < 1.0 × 10⁻¹⁶), and none of our proteins proved to be individual proteins without connections to others. The extracted interactome obtained was comprised of 26 nodes and 78 edges, while the average node degree and average local clustering coefficient of the network were 6 and 0.723, respectively. The gene ontology (GO) category cellular component associated 12 proteins to extracellular regions (GO:005576), 9 to mitochondrion (GO:005739), and 13 to Cytosol (GO:005829), which are shown in Figure 2A, in green, red, and blue color, respectively. The complete cell component annotation, including the 42 significantly enriched GO terms, proteins, and false discovery rate (FDR), are listed in Table S2. Panther analysis identified the most represented protein classes (Figure 2B), namely chaperone, transporter, hydrolase, oxidoreductase, cell adhesion molecule, lyase, transferase, nucleic acid binding, ligase, receptor, isomerase, cytoskeletal protein, signaling molecules, and extracellular matrix proteins.
The two Cytoscape plugins, ClueGO and the CluePedia, were used to investigate the functionally grouped networks of deregulated proteins in OC in detail. In particular, biological processes, molecular functions, cellular component, Reactome, Kyoto Encyclopedia of Genes annotations and Genomes (KEGG), and WikiPathways were integrated. The κ score level was set at ≥0.4. The statistically significant (p < 0.05) enrichment terms are shown in Figure 3A. The most significant functional groups evidenced were glycolysis and gluconeogenesis, growth plate and cartilage development, positive regulation of protein import, cell–cell adhesion mediator activity, and mitochondrion nucleoid. All functional groups/pathway terms and the relative percentage (%) of deregulated genes in OC are shown in Figure 3B.

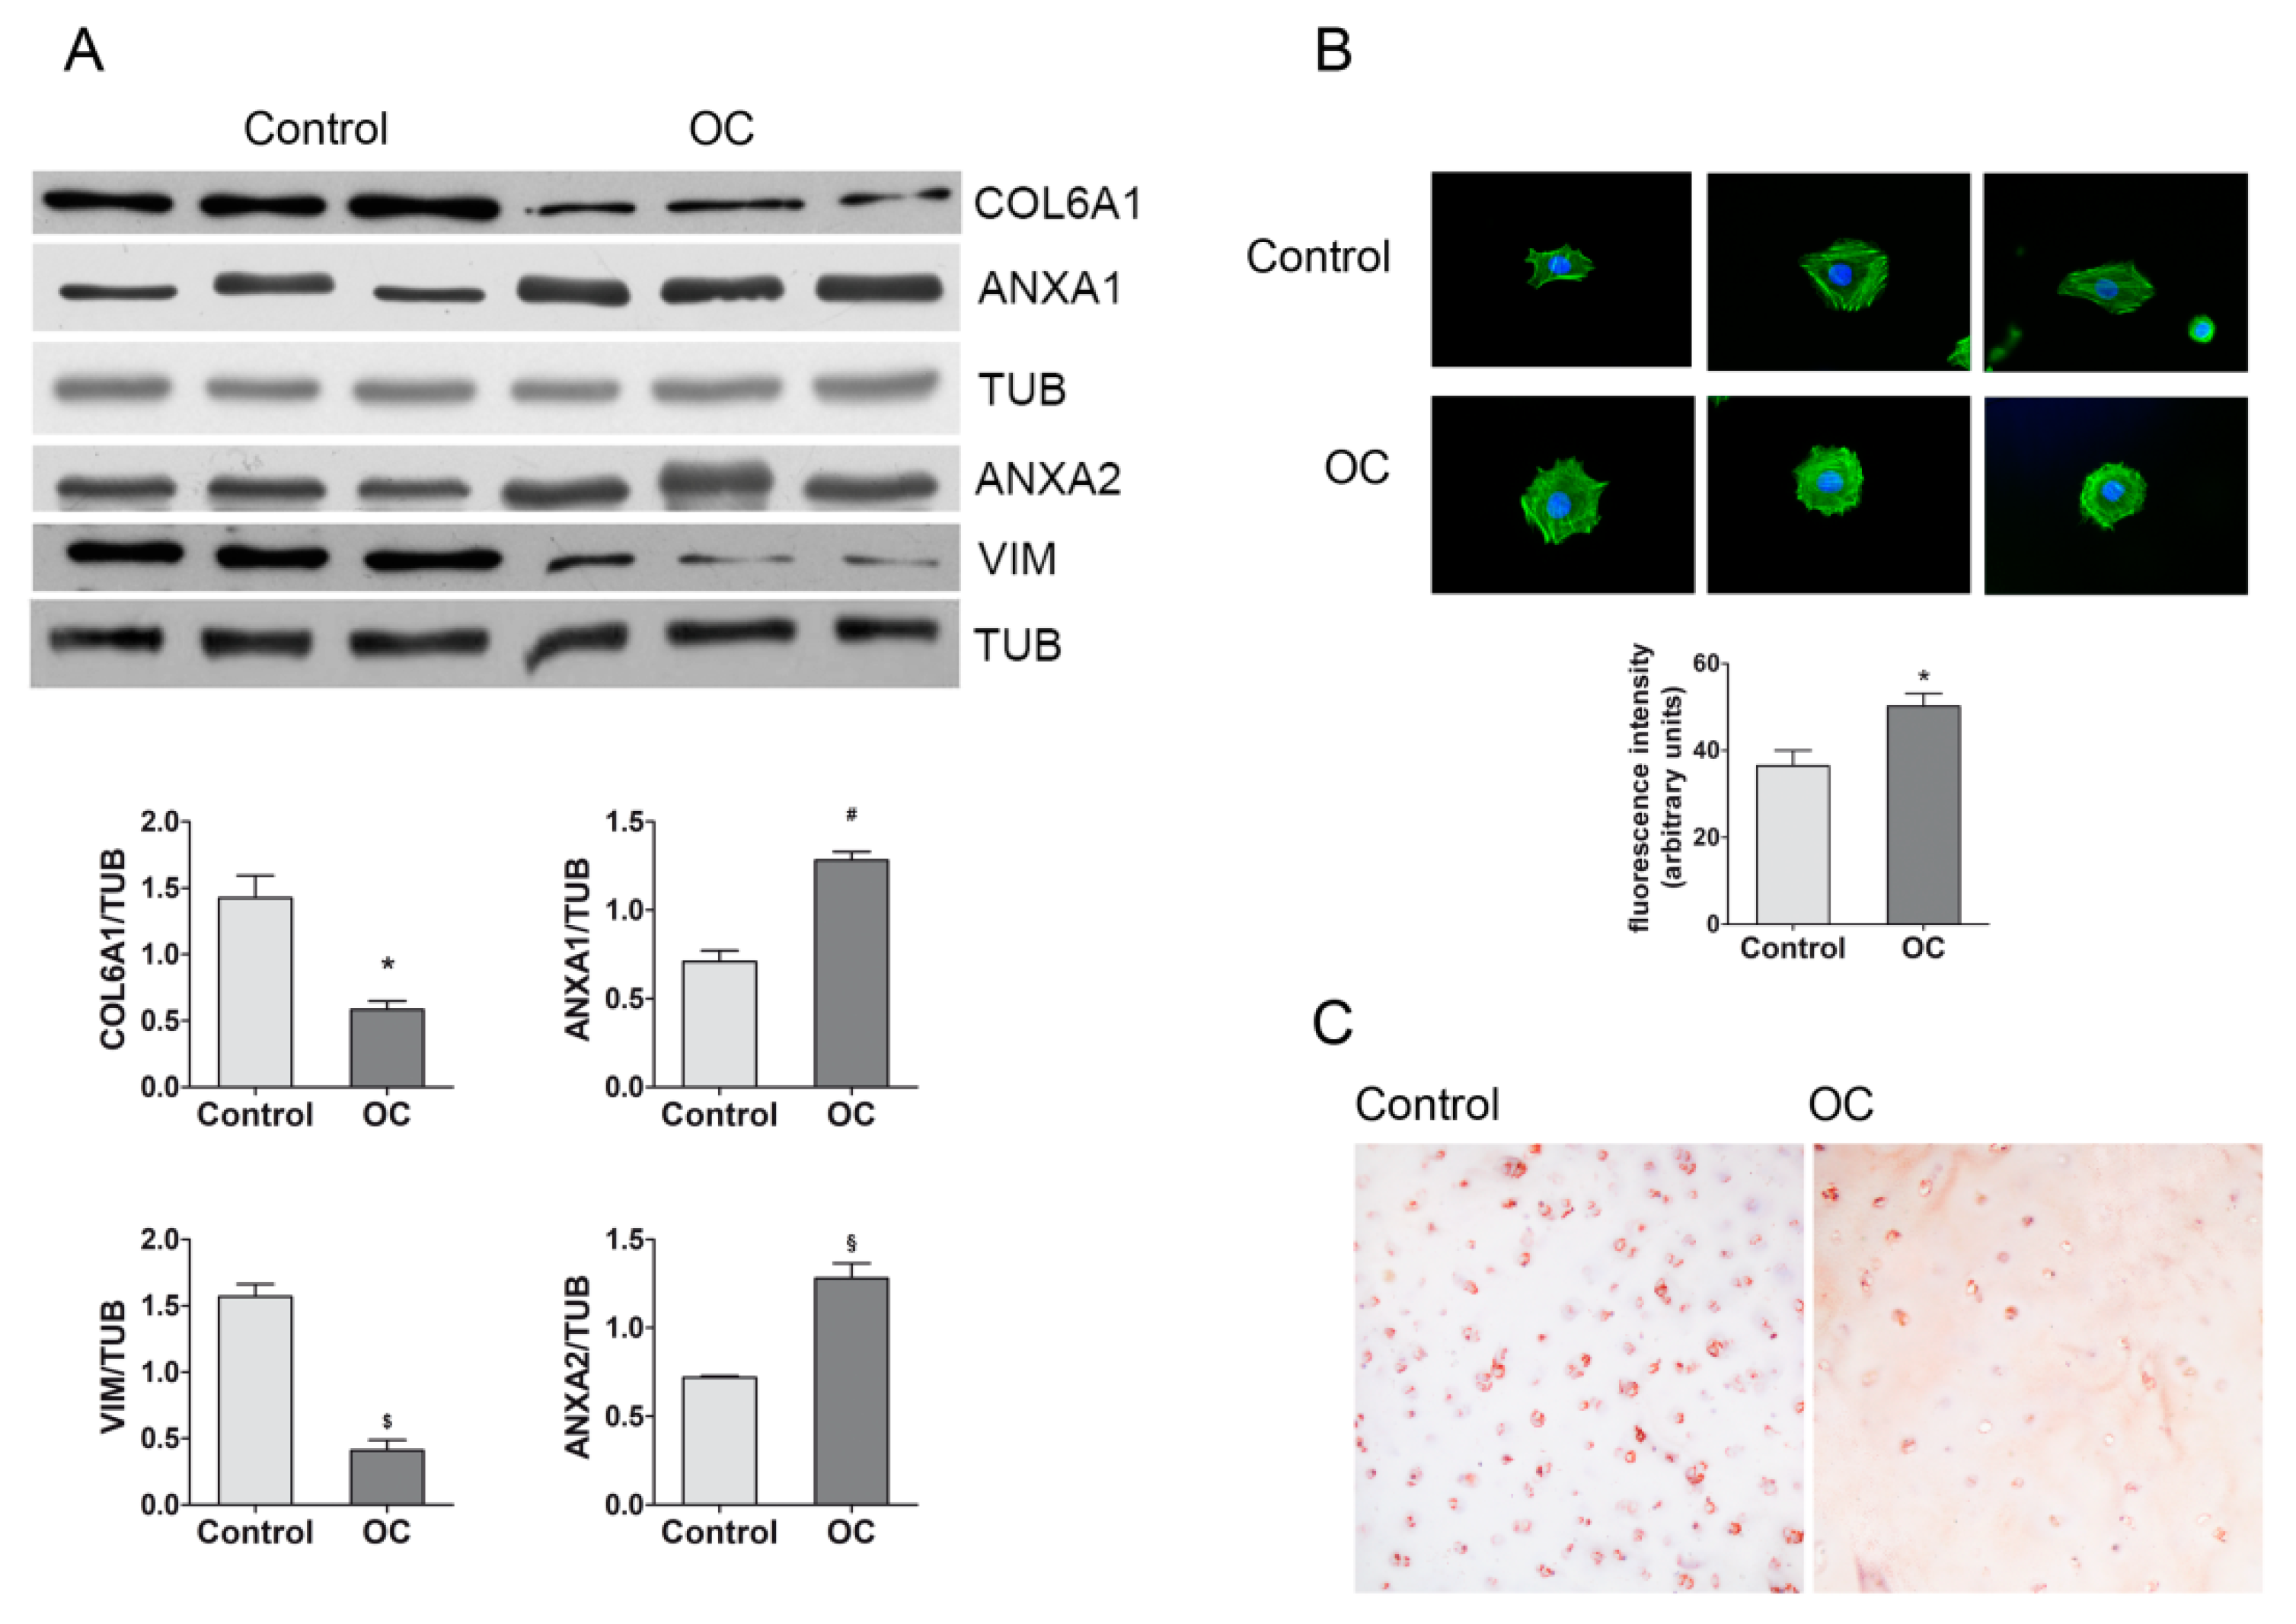
2.3. Validation of Proteomics Results

In order to validate quantitative variations evidenced by the proteomic analysis, various approaches were used. More specifically, immunoblotting was performed for VIM, ANX1 and ANX2, and collagen V alpha 1 chain (Figure 4A), which confirmed the results obtained by the comparative densitometric analysis of 2DE gel spots. Interestingly, no changes were observed when tubulin (TUB) was immunodetected, excluding the involvement of this protein in OC cell cytoskeleton alterations; therefore, the Western Blotting and of TUB was used as a housekeeping gene for the densitometric analysis of other protein bands. VIM, ANX1, and ANX2 were chosen to validate the quantitative changes impacting alterations of cytoskeleton, also assayed by florescence analysis, occurring in OC cells. Definitively, variations in actin cytoskeleton were confirmed by staining the cells with fluorescent-labelled phalloidin (Figure 4B), which showed a significant increase in OC cell signals. The decrease in COL6A1, indicating alterations in the perichondrium, was also confirmed by the immunohistochemical evaluation of OC and the control cartilage through the use of specific antibodies (Figure 4C). Indeed, the control cartilage showed an extensive and high pericellular expression of collagen VI, while a significant decrease in pericellular immunoreaction was observed in the OC samples.

3. Discussion

In this study, a proteomic approach was used to clarify the functional alterations that occur in osteochondrotic chondrocytes. The identification of deregulated proteins, their location, and the pathways in which they are involved could enhance our knowledge about the pathogenic processes related to OC. More specifically, a gel-based proteomic analysis was carried out, followed by spot identification with mass spectrometry procedures in order to detect changes in protein abundance in OC cells. To gain a better understanding of the biological relevance of deregulated proteins, bioinformatics tools were also used and validation tests were performed to confirm the results.
Some proteins found as differentially represented in OC cells were annotated to the functional term “growth plate and cartilage development”. It is worth noting that OC is a multifactorial disorder that affects the growing skeleton and it is characterized by abnormal cartilage and subchondral bone formation, for which our results may prove useful for identifying key protein players of OC pathogenesis.
Proteomic analysis of OC cells identified proteins that may be responsible for the ECM alterations characterizing OC cartilage, such as the HAPLN1 and CILP-1. HAPLN1 plays a key role in stabilizing the ECM as it links the aggregates of aggrecan and hyaluronic acid, and acts as a growth factor by stimulating the synthesis of aggrecan and type II collagen [18,19]; CILP-1 proved to be essential for cartilage structure and scaffolding [20]. Synthesis of both these proteins is modulated by SOX-9, (key modulator of chondrogenesis and synthesis of cartilage proteins) [21], which is altered in OC [22]. In agreement with to a histological study [23], our results also revealed changes in the pericellular matrix that surrounds the chondrocytes, due to a global decrease in COL VI chains, probably induced by high proteolytic activity, which has been well-documented in literature [24] and biosynthesis defects. Protein changes associated with proteolytic degradation should eventually have escaped detection whenever gel-free shotgun proteomic procedures should have been used. Indeed, we also found low levels of OAT, the key enzyme involved in biosynthesis of proline, which is the most abundant amino acid in collagen. A reduction in COLVI can lead to a decrease in cartilage elasticity and flexibility in the adaptation to mechanical stress-induced and load-induced changes [25,26]. In addition, disruption of the pericellular matrix has consequences in important processes involved in development, maintenance, and degeneration of articular cartilage, which modulate the organization of the growth plate [27].
In accordance with Desjardin and coworkers [14], our results revealed cytoskeletal alterations, which play an important role in maintaining the chondrogenic phenotype and structural integrity, and are essential for collagen transport and secretion [28,29]. In particular, we observed changes in ACTG1 and VIM, which were confirmed by fluorescence analysis using labeled phalloidin and Western blotting, respectively. Both proteins are involved in chondrogenesis and chondrocyte differentiation [30,31], in determining mechanical properties, as well as in regulating the response of chondrocytes to compressive loading conditions [32]. Low levels of VIM have been reported for other skeletal system diseases [33,34]. Moreover, it has been demonstrated that cytoskeletal alterations can induce chondrocyte apoptosis, ECM alterations, downregulating aggrecan and collagen II expression, and inducing matrix metallopeptidases (MMP) synthesis [35]. Cytoskeletal alterations may also be due to changes in the levels of JUP (a junctional plaque protein), which plays an important role in intercellular junctions and ECM adhesions. It binds to cell adhesion molecules and transmembrane components of the intermediate filaments [36], modulating the cell–matrix interactions that are essential for chondrogenesis [37]. JUP is directly involved in the arrangement and function of the cytoskeleton and the cells within the tissue. Thus, as indicated by the bioinformatic analysis, cell adhesion seems to be highly compromised in OC. Further modifications of the cytoskeleton, plasma membrane, and extracellular matrix interactions may be due to increased AnxA1 and AnxA2 levels, which are both involved in actin cytoskeletal rearrangements and/or extracellular proteins [38]. Moreover, AnxA1 and AnxA2 are involved in controlling cellular proliferation, differentiation, migration, and apoptosis [39,40,41]. Similar effects on cytoskeletal structure and cell adhesion may be due to changes in endoplasmic reticulum proteins such as YWHAQ, endoplasmin, and ERp44. More specifically, YWHAQ (also named 14-3-3 theta protein) is an adapter protein that binds protein kinases, receptor proteins, cytoskeleton, and scaffolding proteins [42,43]. Endoplasmin, also called HSP90B1, gp96 or grp94, is known to be involved in chondrocyte differentiation and growth plate vascularization [43]. Moreover, it assists in the folding of growth signaling and cell adhesion proteins [44]. In fact, chaperones play a key role in endochondral ossification and cartilage pathology [45]. The alterations in chaperone levels, in addition to the impairment in some amino acid’s metabolism, such as proline, previously mentioned, and sulfur amino acids [46], due to the low levels of AHCY found in OC cells, could be also indicative of alteration of protein quality. Moreover, impairment in transsulfuration pathways may have consequences in epigenetic modulation of gene expression, glutathione, and taurine synthesis, as well as in proteoglycan sulfation, which is crucial for cartilage and bone homeostasis, and remodeling [47,48,49,50,51,52].
These results also showed a general increase in cytosolic (TPI1, GAPDH, ENO1), L-LDH, and mitochondrial (SUCLG1, HADHB and ECHS1, ATP synthase) enzymes, which are involved in energy production. These findings could be interpreted as an adaptative response to the reduction of nutrient supply, which occurs in OC fragments, where chondrocytes are far from the capillaries originated from the epiphyseal artery, the only source of glucose for growth plate cartilage [53].
Finally, some of our results sustain the hypothesis that the increased apoptosis of chondrocytes may play a role in OC [54]. Most of the previously discussed protein changes, including chaperones ANAX1-2, COL VI, and cytoskeleton proteins, suggested the occurrence of proapoptotic conditions in OC cartilage [35,55,56], which could be worsened by the increase of VDAC2, also known as the mitochondrial porin protein, which is a key molecule in mitochondria-mediated apoptosis [57,58].
Taken together, these results reveal the molecular signatures of OC chondrocytes that could be indicative of alterations in cell functions associated with osteochondrosis. In particular, this study provides insights into the role of deregulated proteins and describes the pathways in which they are involved. Most of these pathways are related to chondrocyte and bone development processes, as well as to chondrogenesis, thus confirming that the proteins we found can trigger endochondral ossification that failed in OC. Since horse disease is the best animal model of human juvenile OC, this study also provides suggestions for new research topics and for clarifying the molecular aspects of OC across the species.

4. Materials and Methods

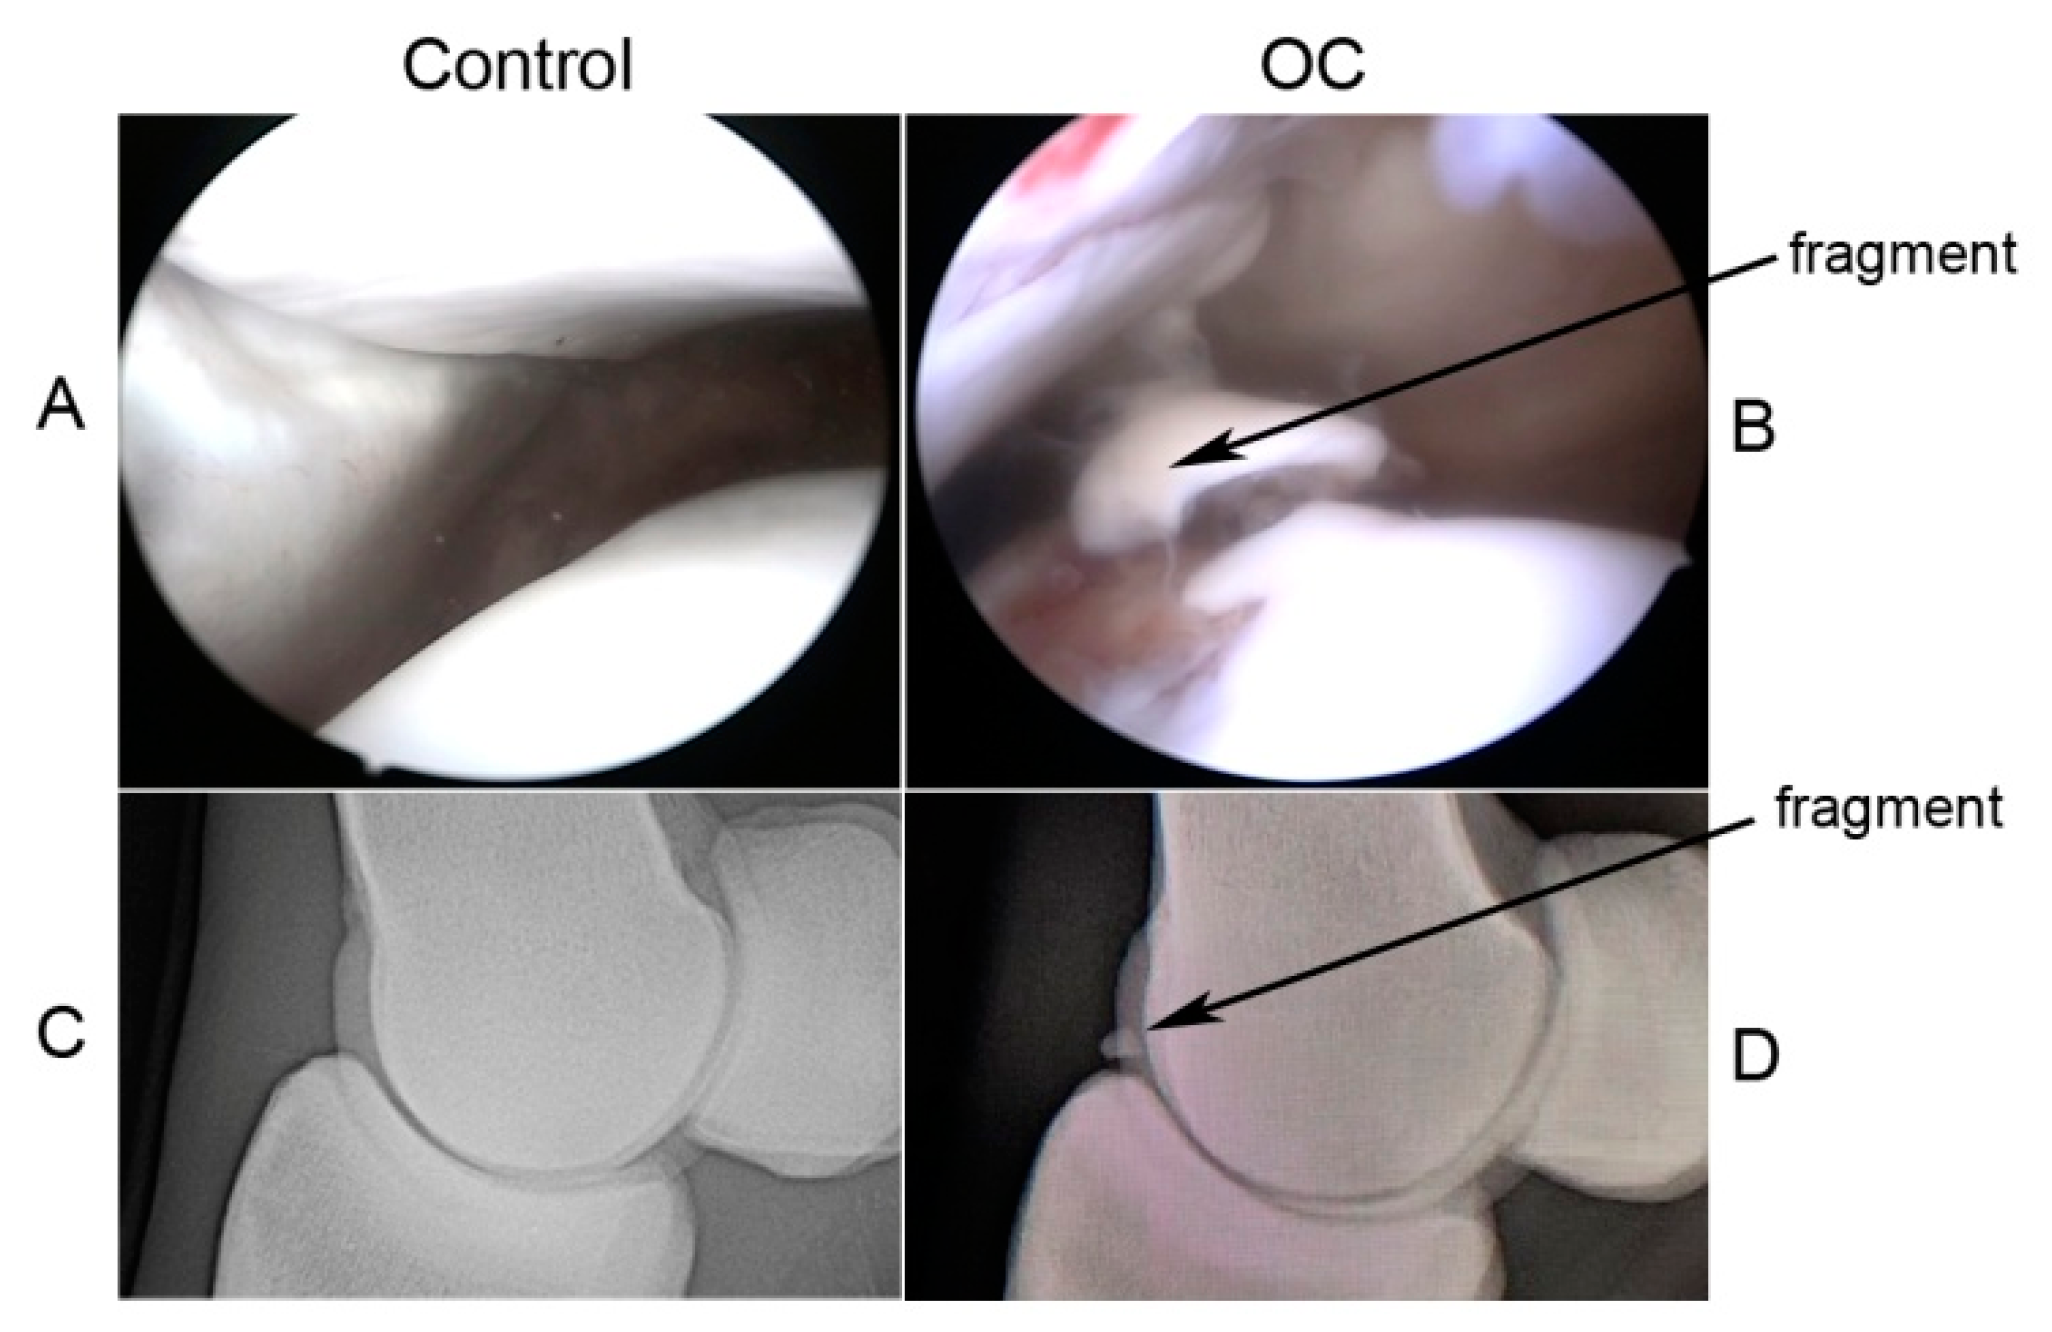
4.1. Cartilage Sampling and Processing

Equine chondrocytes were isolated from macroscopically normal healthy articular cartilage (Control) and from osteochondritic fragments (OC) of the sagittal ridge of the metacarpus/metatarsus and dorsoproximal aspect of the proximal phalanx for metacarpo/metatarsophalangeal joints and from the lateral trochlear ridge of femur for femoropatellar joints; these samples were obtained from 14 male thoroughbred horses aged 1–4 years old, 7 with OC and 7 healthy (Control), respectively. Pathological samples were obtained during diagnostic arthroscopy from clinical cases referred to the University of Perugia Veterinary Teaching Hospital, following guidelines of the Animal Care and Use Committee of the University of Perugia. Owners of clinical patients signed waivers for their samples to be used in this study. OC diagnosis was obtained from radiographic and arthroscopic findings by revealing the presence of osteochondral fragments of metacarpo/metatarsophalangeal (sagittal ridge of the third metacarpus/metatarsus) and femoropatellar (lateral trochlear ridge of femur) joints. Control samples were obtained from animals euthanized for reasons other than orthopedic diseases. The joints were selected based on the absence of macroscopic abnormalities/changes consisting of OC or osteoarthritic (OA) lesions. Representative examples of OC fragment and normal cartilage are reported in Figure 5.
Chondrocytes were obtained from cartilage slices harvested using sterile scalpels, according to Mancini and coworkers [59]. Cell pellets were solubilized by vortexing for 3 h in a buffer (2DE lysis buffer) containing 8 M urea, 2 M thiourea, 4% CHAPS, 40 mM Tris, and 100 mM DTT. Protein concentration was estimated by using the Bradford assay.

4.2. 2D-Gel Electrophoresis

Six hundred µg of proteins in 2DE lysis buffer (added with 0.8% ampholytes and a trace of bromophenol blue) were used to dehydrate Immobiline Dry Strips (IPG 18 cm, linear 3–10 pH range, Bio-Rad, Hercules, CA, USA). Isoelectrofocusing was performed using a Protean IEF Cell (Bio-Rad, Hercules, CA, USA) at 20 °C; low initial voltage was followed by a voltage gradient from 10,000 to 95,000 Vh, with a limiting current of 50 mA/strip. After focusing, proteins were reduced with 2% w/v DTT, and then alkylated with 2.5% w/v iodoacetamide in equilibration buffer (375 mM Tris–HCl pH 8.8, 6 M urea, 20% w/v glycerol, 2% w/v SDS). The second dimension was carried out in 12% T gradient slab polyacrylamide gels. 2DE gels were stained with colloidal Coomassie G250 and the resulting images were acquired by using a GS-800 imaging system (Bio-Rad, Hercules, CA, USA). Digitized images of the stained gels were analyzed by using the PDQuest (ver 7.4) 2D analysis software (Bio-Rad, Hercules, CA, USA), which allowed spot detection, landmark identification, aligning/matching of spots within gels, quantification of matched spots, and their analysis, according to manufacturer′s instructions. Manual inspection of the spots was performed to verify the accuracy of automatic gel matching; any errors in the automatic procedure were manually corrected prior to the final data analysis. The spot volume was used as the analysis parameter for quantifying protein expression. The “total quantity in valid spots” was used as normalization mode. 2DE maps were grouped together by using the “replicate group” function. Fold changes in protein spot levels were calculated as ratio of average of spot value in OC vs. those of Control. Spots exhibiting a fold change ≥2 or ≤0.5 were further considered for statistical analysis (t-test analysis) performed by R program, version 2.13.2. (R Development Core Team, Vienna, Austria). Spots showing a p value <0.05 were considered as significantly different in OC vs. Control groups, and were further analyzed by mass spectrometry for protein identification.

4.3. Protein Digestion and MS Analysis

Spots from 2DE were manually excised from gels, triturated, and washed with water. Proteins were in-gel reduced, S-alkylated, and digested with trypsin, as previously reported [60]. Protein digests were subjected to a desalting/concentration step on μZipTipC18 pipette tips (Millipore, Bedford, MA, USA). The obtained peptide mixtures were then analyzed by nanoLC-ESI-LIT-MS/MS using an LTQ XL mass spectrometer (Thermo Fisher, Foster City, CA, USA) equipped with a Proxeon nanospray source connected to an Easy-nanoLC (Proxeon, Odense, Denmark) [61]. Peptide samples were separated on an Easy C18 column (100 × 0.075 mm, 3 μm) (Proxeon, Odense, Denmark) using a gradient of acetonitrile containing 0.1% v/v formic acid in aqueous 0.1% v/v formic acid. Briefly, acetonitrile ramped from 5% to 35% over 15 min and from 35% to 95% over 2 min, at a flow rate of 300 nL/min. Mass spectra were acquired in the range m/z 400–2000. Acquisition was performed by a data-dependent product ion scanning procedure over the three most abundant ions, enabling dynamic exclusion (repeat count 2 and exclusion duration 1 min). Mass isolation window and collision energy were set to m/z 3 and 35%, respectively. MASCOT software package version 2.3.02 (Matrix Science, London, UK) [62] was used for unambiguous protein identification by searching MS data against a nonredundant database of Equus caballus protein sequences downloaded from UniProtKB (09/2019). A mass tolerance value of 2 Da for precursor ion and 0.8 Da for MS/MS fragments, trypsin as proteolytic enzyme, a missed cleavage maximum value of 2, and Cys carbamidomethylation and Met oxidation as fixed and variable modification, respectively, were set as MS data search parameters. Protein candidates with at least 2 assigned peptides with an individual MASCOT score >25, corresponding to p < 0.05 for a significant identification, were further evaluated by the comparison of their calculated Mr and pI values with the experimental ones from 2DE.

4.4. Protein Enrichment Analysis

STRING (http://string-db.org/), Panther (Protein ANalysis THrough Evolutionary Relationships) (http://www.pantherdb.org/), and the Cluego + Clupedia plugin [63,64] of Cytoscape platform version 3.7.2 (https://cytoscape.org) were used to perform GO annotation, PPI enrichment, and integrative analysis.

4.5. Validation of Proteomics Results

4.5.1. Western Blotting

Different OC (6) and healthy cartilage (6) samples, obtained with the same conditions and from the same kind of joints used for proteomics, were used to extract cells to validate proteomic results. To this aim, cells were lysated using Ripa Buffer (50 mM Tris-HCl pH 8.0, 250 mM NaCl, 1% NP-40, 0.1% SDS, 1% Na-deoxycholate). The extracted proteins were mixed in three pools and used to perform immunoblotting. Briefly, proteins were separated in SDS-PAGE (10% or 12% T, according to the molecular mass of protein under evaluation) and blotted on Polyvinylidene Difluoride (PVDF) membranes. The immunodetection of proteins was performed incubating blotted membrane with Ab-COL6A1 (Santa Cruz, Dallas, Texas, USA, 1:500), Ab-Annexin II (Santa Cruz, Dallas, Texas, USA, 1:1000), Ab-Annexin I (Santa Cruz, Dallas, Texas, USA, 1:1000), and Ab-Vimentin (Cell Signaling Technology, Leiden, The Netherlands, 1:1000). Detection was carried out using the appropriate secondary antibody, i.e., horseradish peroxidase-conjugated secondary antibody anti-mouse (Sigma-Aldrich Corp., MO, USA, 1:5000) or anti-rabbit (Sigma-Aldrich Corp., MO, USA, 1:5000), based on the first antibody. Immunoreactive proteins were finally evidenced by chemiluminescence using the ECL system and film images were then acquired using a GS-800 imaging systems scanner. Densitometric analysis was performed by QuantityOne 4.5.0 (BioRad, Hercules, CA, USA) using tubulin as normalization factor for band optical density. t-tests were used for statistical analysis; p < 0.05 was deemed as significant.

4.5.2. Actin Labeling by Fluorescently Labeled Phalloidin

Control and OC cells, isolated as before referred [59], were seeded on glass slips at a density of 4 × 10⁴ cells cm2 in six-well plates and incubated at 37 °C in a humidified atmosphere of 5% CO2 for 24 h. Cells were then washed twice with PBS and fixed with 4% (v/v) paraformaldehyde for 20 min at room temperature, washed three times with D-PBS, and blocked in D-PBS containing 5% (v/v) FBS and 0.3% (v/v) Triton X-100 for 1 h at RT. The cells were washed three times with D-PBS and incubated for 1 h in Alexa FluorVR 488 Phalloidin (Thermo Fisher Scientific, Waltham, MA, USA, 1:1000). After washing, the cells were counterstained with DAPI. Fluorescence microscopy analysis was performed using a Nikon TE2000 microscope (Nikon Instruments Spa, Florence, Italy) through a 60× oil immersion objective. Fluorescence intensity analysis was achieved by using ImageJ software (NIH). T-test was used for statistical analysis, p < 0.05 was deemed as significant.

4.5.3. Immunohistochemical Evaluation of COL6A1 in Cartilage

Cartilage obtained from healthy joints (Control) and OC fragments (OC) were embedded in Cryomatrix embedding resin (Shandon) and frozen in isopentane cooled in liquid nitrogen. Tissue samples were stored at −80 °C before sectioning on a Leica CM1900 Cryostat into slices of 5 µm, subsequently mounted on poly-L-lysine–coated slides, and stored at −80 °C. Serial cryosections were warmed to room temperature and incubated for 2 h with antibody against COL6A1 (Santa Cruz Biotechnology, Dallas, Texas, US, 1:100). Slides were then treated with an ABC ready-to-use kit (Abcam, Cambridge, UK) following the manufacturer’s instructions. Positive reaction was revealed with 3-amino-9-ethilcarbazole (Abcam, Cambridge, UK); Mayer’s hematoxylin was applied as a counterstain.

Supplementary Materials

Supplementary materials can be found at https://www.mdpi.com/1422-0067/20/24/6179/s1. Table S1—Proteins identified and MS information-dependent acquisition. Table S2—Cellular component annotation by STRING annotation system.

Author Contributions

Conceptualization, E.C., M.P., A.D.M. and A.S.; data curation, P.L.O., G.R., A.M. and M.S.; formal analysis, E.C., P.L.O., G.R., A.M. and M.S.; investigation, A.M.; methodology, E.C., P.L.O., G.R., M.S. and A.S.; supervision, M.P., C.E., A.D.M. and A.S.; writing—original draft, E.C.; writing—review and editing, M.P., G.R., M.S., C.E., A.D.M. and A.S.

Funding

This research received no external funding.

Acknowledgments

The authors are grateful to the personnel of Veterinary Teaching Hospital of University of Perugia for the help in the sample collection.

Conflicts of Interest

The authors declare no conflict of interest.

Abbreviations

MDPIMultidisciplinary Digital Publishing Institute
YWHAQ14-3-3 protein theta
ACTG1Actin, cytoplasmic 1
AHCYAdenosylhomocysteinase
ANXA1Annexin A1
ANXA2Annexin A2
ATP5F1BATP synthase subunit beta
CILPCartilage intermediate layer protein
COL6A1Collagen alpha-1(VI) chain
COL6A2Collagen alpha-2(VI) chain
COL6A3Collagen alpha-3(VI) chain
ERP44Endoplasmic reticulum resident protein 44
HSP90B1Endoplasmin
ENO1Enolase 1
ECHS1Enoyl-CoA hydratase
GAPDHGlyceraldehyde-3-phosphate dehydrogenase
HAPLN1Hyaluronan and proteoglycan link protein 1
JUPJunction plakoglobin
MFGE8Lactadherin
LDHBL-lactate dehydrogenase
OATOrnithine aminotransferase
SUCLG1Succinyl-CoA ligase
SODSuperoxide dismutase
HADHBTrifunctional enzyme mitochondrial.
TPI1Triosephosphate isomerase
VIMVimentin
VDAC2Voltage dependent anion channel 2
ECMExtracellular matrix
OCOsteochondrosis
OAOsteoarthritis

References

  1. Ytrehus, B.; Carlson, C.S.; Ekman, S. Etiology and pathogenesis of osteochondrosis. Vet. Pathol. 2007, 44, 429–448. [Google Scholar] [CrossRef]
  2. Bates, J.T.; Jacobs, J.C.; Shea, K.G.; Oxford, J.T. Emerging genetic basis of osteochondritis dissecans. Clin. Sports Med. 2014, 33, 199–220. [Google Scholar] [CrossRef] [PubMed] [Green Version]
  3. Naccache, F.; Metzger, J.; Distl, O. Genetic risk factors for osteochondrosis in various horse breeds. Equine Vet. J. 2018, 50, 556–563. [Google Scholar] [CrossRef] [PubMed] [Green Version]
  4. Van Weeren, P.R.; Jeffcott, L.B. Problems and pointers in osteochondrosis: Twenty years on. Vet. J. 2013, 197, 96–102. [Google Scholar] [CrossRef] [PubMed]
  5. Van Weeren, R. Fifty years of osteochondrosis. Equine Vet. J. 2018, 50, 554–555. [Google Scholar] [CrossRef]
  6. Olstad, K.; Ekman, S.; Carlson, C.S. An Update on the Pathogenesis of Osteochondrosis. Vet. Pathol. 2015, 52, 785–802. [Google Scholar] [CrossRef] [Green Version]
  7. McCoy, A.M.; Toth, F.; Dolvik, N.I.; Ekman, S.; Ellermann, J.; Olstad, K.; Ytrehus, B.; Carlson, C.S. Articular Osteochondrosis: A Comparison of Naturally Occurring Human and Animal Disease. Osteoarthr. Cartil. 2013, 21, 1638–1647. [Google Scholar] [CrossRef] [Green Version]
  8. Bourebaba, L.; Röcken, M.; Marycz, K. Osteochondritis dissecans (OCD) in Horses—Molecular Background of its Pathogenesis and Perspectives for Progenitor Stem Cell Therapy. Stem Cell Rev. Rep. 2019, 15, 374–390. [Google Scholar] [CrossRef] [Green Version]
  9. Carballo, C.B.; Nakagawa, Y.; Sekiya, I.; Rodeo, S.A. Basic Science of Articular Cartilage. Clin. Sports Med. 2017, 36, 413–425. [Google Scholar] [CrossRef]
  10. Ruiz-Romero, C.; Fernández-Puente, P.; Calamia, V.; Blanco, F.J. Lessons from the proteomic study of osteoarthritis. Expert Rev. Proteom. 2015, 12, 433–443. [Google Scholar] [CrossRef]
  11. Lourido, L.; Blanco, F.J.; Ruiz-Romero, C. Defining the proteomic landscape of rheumatoid arthritis: Progress and prospective clinical applications. Expert Rev. Proteom. 2017, 14, 431–444. [Google Scholar] [CrossRef] [PubMed]
  12. Mobasheri, A.; Bay-Jensen, A.-C.; van Spil, W.E.; Larkin, J.; Levesque, M.C. Osteoarthritis Year in Review 2016: Biomarkers (biochemical markers). Osteoarthr. Cartil. 2017, 25, 199–208. [Google Scholar] [CrossRef] [PubMed] [Green Version]
  13. Trachana, V.; Mourmoura, E.; Papathanasiou, I.; Tsezou, A. Understanding the role of chondrocytes in osteoarthritis: Utilizing proteomics. Expert Rev. Proteom. 2019, 16, 201–213. [Google Scholar] [CrossRef] [PubMed]
  14. Desjardin, C.; Chat, S.; Gilles, M.; Legendre, R.; Riviere, J.; Mata, X.; Balliau, T.; Esquerré, D.; Cribiu, E.P.; Betch, J.-M.; et al. Involvement of mitochondrial dysfunction and ER-stress in the physiopathology of equine osteochondritis dissecans (OCD). Exp. Mol. Pathol. 2014, 96, 328–338. [Google Scholar] [CrossRef]
  15. Desjardin, C.; Riviere, J.; Vaiman, A.; Morgenthaler, C.; Diribarne, M.; Zivy, M.; Robert, C.; Le Moyec, L.; Wimel, L.; Lepage, O.; et al. Omics technologies provide new insights into the molecular physiopathology of equine osteochondrosis. BMC Genom. 2014, 15, 947. [Google Scholar] [CrossRef] [Green Version]
  16. Chiaradia, E.; Pepe, M.; Tartaglia, M.; Scoppetta, F.; D’Ambrosio, C.; Renzone, G.; Avellini, L.; Moriconi, F.; Gaiti, A.; Bertuglia, A.; et al. Gambling on putative biomarkers of osteoarthritis and osteochondrosis by equine synovial fluid proteomics. J. Proteom. 2012, 75, 4478–4493. [Google Scholar] [CrossRef]
  17. Anderson, J.R.; Smagul, A.; Simpson, D.; Clegg, P.D.; Rubio-Martinez, L.M.; Peffers, M.J. The synovial fluid proteome differentiates between septic and nonseptic articular pathologies. J. Proteom. 2019, 202, 103370. [Google Scholar] [CrossRef]
  18. Roughley, P.J.; Mort, J.S. The role of aggrecan in normal and osteoarthritic cartilage. J. Exp. Orthop. 2014, 1, 8. [Google Scholar] [CrossRef] [Green Version]
  19. Zheng, J.; Wu, C.; Ma, W.; Zhang, Y.; Hou, T.; Xu, H.; Wu, S.; Yao, X.; Guo, X. Abnormal expression of chondroitin sulphate N-Acetylgalactosaminyltransferase 1 and Hapln-1 in cartilage with Kashin-Beck disease and primary osteoarthritis. Int. Orthop. 2013, 37, 2051–2059. [Google Scholar] [CrossRef] [Green Version]
  20. Lorenzo, P.; Bayliss, M.T.; Heinegård, D. Altered patterns and synthesis of extracellular matrix macromolecules in early osteoarthritis. Matrix Biol. 2004, 23, 381–391. [Google Scholar] [CrossRef]
  21. Tew, S.R.; Clegg, P.D.; Brew, C.J.; Redmond, C.M.; Hardingham, T.E. SOX9 transduction of a human chondrocytic cell line identifies novel genes regulated in primary human chondrocytes and in osteoarthritis. Arthritis Res. Ther. 2007, 9, R107. [Google Scholar] [CrossRef] [Green Version]
  22. Garvican, E.R.; Vaughan-Thomas, A.; Redmond, C.; Clegg, P.D. Chondrocytes harvested from osteochondritis dissecans cartilage are able to undergo limited in vitro chondrogenesis despite having perturbations of cell phenotype in vivo. J. Orthop. Res. 2008, 26, 1133–1140. [Google Scholar] [CrossRef]
  23. Henson, F.M.; Davies, M.E.; Jeffcott, L.B. Equine dyschondroplasia (osteochondrosis)—Histological findings and type VI collagen localization. Vet. J. 1997, 154, 53–62. [Google Scholar] [CrossRef]
  24. Riddick, T.L.; Duesterdieck-Zellmer, K.; Semevolos, S.A. Gene and protein expression of cartilage canal and osteochondral junction chondrocytes and full-thickness cartilage in early equine osteochondrosis. Vet. J. 2012, 194, 319–325. [Google Scholar] [CrossRef] [PubMed]
  25. Wilusz, R.E.; Sanchez-Adams, J.; Guilak, F. The structure and function of the pericellular matrix of articular cartilage. Matrix Biol. 2014, 39, 25–32. [Google Scholar] [CrossRef] [PubMed]
  26. Zelenski, N.A.; Leddy, H.A.; Sanchez-Adams, J.; Zhang, J.; Bonaldo, P.; Liedtke, W.; Guilak, F. Type VI collagen regulates pericellular matrix properties, chondrocyte swelling, and mechanotransduction in mouse articular cartilage. Arthritis Rheumatol. 2015, 67, 1286–1294. [Google Scholar] [CrossRef] [PubMed] [Green Version]
  27. Guilak, F.; Nims, R.J.; Dicks, A.; Wu, C.-L.; Meulenbelt, I. Osteoarthritis as a disease of the cartilage pericellular matrix. Matrix Biol. 2018, 71–72, 40–50. [Google Scholar] [CrossRef]
  28. Blain, E.J. Involvement of the cytoskeletal elements in articular cartilage homeostasis and pathology. Int. J. Exp. Pathol. 2009, 90, 1–15. [Google Scholar] [CrossRef]
  29. Chahine, N.O.; Blanchette, C.; Thomas, C.B.; Lu, J.; Haudenschild, D. Effect of Age and Cytoskeletal Elements on the Indentation-Dependent Mechanical Properties of Chondrocytes. PLoS ONE 2013, 8, 61651. [Google Scholar] [CrossRef] [Green Version]
  30. Woods, A.; Wang, G.; Beier, F. Regulation of chondrocyte differentiation by the act in cytoskeleton and adhesive interactions. J. Cell. Physiol. 2007, 213, 1–8. [Google Scholar] [CrossRef]
  31. Bobick, B.E.; Tuan, R.S.; Chen, F.H. The intermediate filament vimentin regulates chondrogenesis of adult human bone marrow-derived multipotent progenitor cells. J. Cell. Biochem. 2010, 109, 265–276. [Google Scholar] [CrossRef] [PubMed]
  32. Chen, C.; Yin, L.; Song, X.; Yang, H.; Ren, X.; Gong, X.; Wang, F.; Yang, L. Effects of vimentin disruption on the mechanoresponses of articular chondrocyte. Biochem. Biophys. Res. Commun. 2016, 469, 132–137. [Google Scholar] [CrossRef] [PubMed]
  33. Ao, X.; Wang, L.; Shao, Y.; Chen, X.; Zhang, J.; Chu, J.; Jiang, T.; Zhang, Z.; Huang, M. Development and Characterization of a Novel Bipedal Standing Mouse Model of Intervertebral Disc and Facet Joint Degeneration. Clin. Orthop. Relat. Res. 2019, 477, 1492–1504. [Google Scholar] [CrossRef] [PubMed]
  34. Geminiani, M.; Gambassi, S.; Millucci, L.; Lupetti, P.; Collodel, G.; Mazzi, L.; Frediani, B.; Braconi, D.; Marzocchi, B.; Laschi, M.; et al. Cytoskeleton Aberrations in Alkaptonuric Chondrocytes. J. Cell. Physiol. 2017, 232, 1728–1738. [Google Scholar] [CrossRef]
  35. Duan, W.; Wei, L.; Cao, X.; Guo, H.; Wang, L.; Hao, Y.; Wei, X. Effect of the disruption of three cytoskeleton components on chondrocyte metabolism in rabbit knee cartilage. Chin. Med. J. 2014, 127, 3764–3770. [Google Scholar]
  36. Al-Amoudi, A.; Castano-Diez, D.; Devos, D.P.; Russell, R.B.; Johnson, G.T.; Frangakis, A.S. The three-dimensional molecular structure of the desmosomal plaque. Proc. Natl. Acad. Sci. USA 2011, 108, 6480–6485. [Google Scholar] [CrossRef] [Green Version]
  37. Gao, Y.; Liu, S.; Huang, J.; Guo, W.; Chen, J.; Zhang, L.; Zhao, B.; Peng, J.; Wang, A.; Wang, Y.; et al. The ECM-cell interaction of cartilage extracellular matrix on chondrocytes. BioMed Res. Int. 2014, 2014. [Google Scholar] [CrossRef] [Green Version]
  38. Hayes, M.J.; Rescher, U.; Gerke, V.; Moss, S.E. Annexin-Actin interactions. Traffic 2004, 5, 571–576. [Google Scholar] [CrossRef]
  39. Bizzarro, V.; Petrella, A.; Parente, L. Annexin A1: Novel roles in skeletal muscle biology. J. Cell. Physiol. 2012, 227, 3007–3015. [Google Scholar] [CrossRef]
  40. Lim, L.H.K.; Pervaiz, S. Annexin 1: The new face of an old molecule. FASEB J. 2007, 21, 968–975. [Google Scholar] [CrossRef] [Green Version]
  41. Kirsch, T. Annexins—Their role in cartilage mineralization. Front. Biosci. 2005, 10, 576–581. [Google Scholar] [CrossRef] [Green Version]
  42. Sluchanko, N.N.; Gusev, N.B. 14-3-3 Proteins and regulation of cytoskeleton. Biochemistry 2010, 75, 1528–1546. [Google Scholar] [CrossRef]
  43. Herzog, A.; Genin, O.; Hasdai, A.; Shinder, D.; Pines, M. Hsp90 and angiogenesis in bone disorders-lessons from the avian growth plate. Am. J. Physiol. Regul. Integr. Comp. Physiol. 2011, 301, R140–R147. [Google Scholar] [CrossRef] [Green Version]
  44. Zhu, G.; Lee, A.S. Role of the unfolded protein response, GRP78 and GRP94 in organ homeostasis. J. Cell. Physiol. 2015, 230, 1413–1420. [Google Scholar] [CrossRef] [Green Version]
  45. Hughes, A.; Oxford, A.E.; Tawara, K.; Jorcyk, C.L.; Oxford, J.T. Endoplasmic Reticulum Stress and Unfolded Protein Response in Cartilage Pathophysiology; Contributing Factors to Apoptosis and Osteoarthritis. Int. J. Mol. Sci. 2017, 18, 665. [Google Scholar] [CrossRef] [Green Version]
  46. Reddy, V.S.; Trinath, J.; Reddy, G.B. Implication of homocysteine in protein quality control processes. Biochimie 2019, 165, 19–31. [Google Scholar] [CrossRef]
  47. Cho, Y.R.; Lee, S.J.; Jeon, H.B.; Park, Z.Y.; Chun, J.-S.; Yoo, Y.J. Under-sulfation by PAPS synthetase inhibition modulates the expression of ECM molecules during chondrogenesis. Biochem. Biophys. Res. Commun. 2004, 323, 769–775. [Google Scholar] [CrossRef]
  48. Pecora, F.; Gualeni, B.; Forlino, A.; Superti-Furga, A.; Tenni, R.; Cetta, G.; Rossi, A. In vivo contribution of amino acid sulfur to cartilage proteoglycan sulfation. Biochem. J. 2006, 398, 509–514. [Google Scholar] [CrossRef] [Green Version]
  49. Ursini, F.; Pipicelli, G. Nutritional Supplementation for Osteoarthritis. Altern. Complement. Ther. 2009, 15, 173–177. [Google Scholar] [CrossRef]
  50. Vijayan, V.; Khandelwal, M.; Manglani, K.; Gupta, S.; Surolia, A. Methionine down-regulates TLR4/MyD88/NF-κB signalling in osteoclast precursors to reduce bone loss during osteoporosis. Br. J. Pharmacol. 2014, 171, 107–121. [Google Scholar] [CrossRef] [Green Version]
  51. Pajares, M.A.; Pérez-Sala, D. Mammalian Sulfur Amino Acid Metabolism: A Nexus Between Redox Regulation, Nutrition, Epigenetics, and Detoxification. Antioxid. Redox Signal. 2018, 29, 408–452. [Google Scholar] [CrossRef] [PubMed] [Green Version]
  52. Feigerlova, E.; Demarquet, L.; Guéant, J.-L. One carbon metabolism and bone homeostasis and remodeling: A review of experimental research and population studies. Biochimie 2016, 126, 115–123. [Google Scholar] [CrossRef] [PubMed]
  53. Hollander, J.M.; Zeng, L. The Emerging Role of Glucose Metabolism in Cartilage Development. Curr. Osteoporos. Rep. 2019, 17, 59–69. [Google Scholar] [CrossRef] [PubMed]
  54. Semevolos, S.A.; Duesterdieck-Zellmer, K.F.; Larson, M.; Kinsley, M.A. Expression of pro-apoptotic markers is increased along the osteochondral junction in naturally occurring osteochondrosis. Bone Rep. 2018, 9, 19–26. [Google Scholar] [CrossRef] [PubMed]
  55. Nugent, A.E.; McBurney, D.L.; Horton, W.E. The presence of extracellular matrix alters the chondrocyte response to endoplasmic reticulum stress. J. Cell. Biochem. 2011, 112, 1118–1129. [Google Scholar] [CrossRef] [Green Version]
  56. Peters, H.C.; Otto, T.J.; Enders, J.T.; Jin, W.; Moed, B.R.; Zhang, Z. The protective role of the pericellular matrix in chondrocyte apoptosis. Tissue Eng. Part A 2011, 17, 2017–2024. [Google Scholar] [CrossRef] [Green Version]
  57. Shoshan-Barmatz, V.; De Pinto, V.; Zweckstetter, M.; Raviv, Z.; Keinan, N.; Arbel, N. VDAC, A multi-functional mitochondrial protein regulating cell life and death. Mol. Asp. Med. 2010, 31, 227–285. [Google Scholar] [CrossRef]
  58. Maurya, S.R.; Mahalakshmi, R. Mitochondrial VDAC2 and cell homeostasis: Highlighting hidden structural features and unique functionalities. Biol. Rev. Camb. Philos. Soc. 2017, 92, 1843–1858. [Google Scholar] [CrossRef]
  59. Mancini, F.; Nannarone, S.; Buratta, S.; Ferrara, G.; Stabile, A.M.; Vuerich, M.; Santinelli, I.; Pistilli, A.; Chiaradia, E. Effects of xylazine and dexmedetomidine on equine articular chondrocytes in vitro. Vet. Anaesth. Analg. 2017, 44, 295–308. [Google Scholar] [CrossRef]
  60. Shevchenko, A.; Tomas, H.; Havlis, J.; Olsen, J.V.; Mann, M. In-gel digestion for mass spectrometric characterization of proteins and proteomes. Nat. Protoc. 2006, 1, 2856–2860. [Google Scholar] [CrossRef]
  61. Perkins, D.N.; Pappin, D.J.C.; Creasy, D.M.; Cottrell, J.S. Probability-based protein identification by searching sequence databases using mass spectrometry data. ELECTROPHORESIS Int. J. 1999, 20, 3551–3567. [Google Scholar] [CrossRef]
  62. Chiaradia, E.; Valiani, A.; Tartaglia, M.; Scoppetta, F.; Renzone, G.; Arena, S.; Avellini, L.; Benda, S.; Gaiti, A.; Scaloni, A. Ovine subclinical mastitis: Proteomic analysis of whey and milk fat globules unveils putative diagnostic biomarkers in milk. J. Proteom. 2013, 83, 144–159. [Google Scholar] [CrossRef]
  63. Bindea, G.; Mlecnik, B.; Hackl, H.; Charoentong, P.; Tosolini, M.; Kirilovsky, A.; Fridman, W.H.; Pagès, F.; Trajanoski, Z.; Galon, J. ClueGO: A Cytoscape plug-in to decipher functionally grouped gene ontology and pathway annotation networks. Bioinformatics 2009, 25, 1091–1093. [Google Scholar] [CrossRef] [Green Version]
  64. Bindea, G.; Galon, J.; Mlecnik, B. CluePedia Cytoscape plugin: Pathway insights using integrated experimental and in silico data. Bioinformatics 2013, 29, 661–663. [Google Scholar] [CrossRef]
Figure 1. Representative image of a 2D gel of equine chondrocytes obtained using linear IPG (immobilized pH gradient) strip 3–10 and 12% T SDS-PAGE. The differentially represented protein spots (fold change > 2 and p < 0.05) were marked and numbered. Corresponding identified proteins are listed in Table 1. Spots found in OC and Control gels are marked in black and white circles, while spots found in OC gels only are marked in red circles.
Ijms 20 06179 g001
Figure 2. (A) STRING Protein Protein Interaction (PPI) analysis of differentially expressed proteins in OC, nodes colors are in accordance with cell component categories: green = extracellular regions (GO:005576); red = mitochondrion (GO:005739); blue = cytosol (GO:005829); (B) PANTHER analysis classified the proteins identified according to the corresponding “Protein Class”.
Ijms 20 06179 g002
Figure 3. ClueGO + CluePedia analyses of identified deregulated proteins in OC chondrocytes. Analysis was performed integrating biological processes, molecular functions, cellular component, Reactome, Kyoto Encyclopedia of Genes and Genomes (KEGG), and WikiPathways. (A) Functionally grouped network with terms as nodes linked based on their kappa score level (≥0.4), where only the label of the most significant term per group is shown; (B) GO/pathway terms specific for deregulated proteins. The bars represent the number of proteins associated with the terms. The percentage of genes per term is shown as bar label. Term/group resulted over significance ** p < 0.001.
Ijms 20 06179 g003
Figure 4. Validation of a panel of five proteins found to be modulated in equine OC cells using different approaches. (A) Representative images of Wester Blotting of vimentin (VIM), annexin A2 and A1 (ANXA1-2), and collagen VI alpha 1 chain (COL6A1), as well as tubulin (TUB), which were used as housekeeping proteins. The bar graph shows normalized Western blot band densities. Images of independent blots were acquired and quantified using Quantity One Software. Data represent the mean ± SEM of three independent experiments. (* p = 0.01; # p = 0.0018; $ p = 0.001; § p = 0.0027). (B) Actin analysis by fluorescent phalloidine of Control and OC cells (scale bar 50 μm), seeded on glass slips. Data represent the mean ± SEM of 3 independent experiments. (C) Immunohistochemistry of equine cartilage samples (from the lateral trochlear ridge of femur) for COL6A1 (characterized by pericellular immunolabeling) (magnification 200×).
Ijms 20 06179 g004
Figure 5. Representative images of healthy (Control) and OC equine joint. (A,B) Control and OC lateral trochlear ridge of the femur with fragment obtained during arthroscopy. (C,D) Lateromedial radiographic images of healthy (Control) and OC metacarpophalangeal joint with OC fragment of the dorsoproximal aspect of the proximal phalanx.
Ijms 20 06179 g005
Table 1. Differentially represented protein spots in OC chondrocytes. Spot number (marked and numbered in Figure 1), protein name, SwissProt accession, theoretical and experimental pI and Mr values, fold changes, and relative p values are listed. Asterisk indicates proteins identified as probable fragments. “+++” indicates spots present only in OC gels.
N° SpotProtein NameUniProt AccessionGene NamepI/Mw Theor(kDa)pI/Mw Exp(kDa)Fold Changep Value
1Collagen alpha-1(VI) chainF6UW03_HORSECOL6A15.24/1104.55/1050.440.035
2Collagen alpha-1(VI) chainF6UW03_HORSECOL6A15.24/1104.68/1050.400.035
3Collagen alpha-1(VI) chainF6UW03_HORSECOL6A15.24/1104.96/1050.420.0001
4Collagen alpha-1(VI) chainF6UW03_HORSECOL6A15.24/1105.05/1050.360.0001
5Collagen alpha-1(VI) chainF6UW03_HORSECOL6A15.24/1105.11/1050.300.0001
6Collagen alpha-1(VI) chainF6UW03_HORSECOL6A15.24/1105.18/1050.490.005
7Collagen alpha-1(VI) chainF6UW03_HORSECOL6A15.24/1105.25/1060.410.045
8EndoplasminF6ZUJ2_HORSEHSP90B14.76/92.64.71/83.20.440.045
9Collagen alpha-3(VI) chain *F6QAT0_HORSECOL6A36.07/342.25.27/95+++
10Collagen alpha-3(VI) chain *F6QAT0_HORSECOL6A36.07/342.25.33/95+++
11Collagen alpha-3(VI) chain *F6QAT0_HORSECOL6A36.07/342.25.39/95.2+++
12Collagen alpha-3(VI) chain *F6QAT0_HORSECOL6A36.07/342.25.45/95.2+++
13Collagen alpha-3(VI) chain *F6QAT0_HORSECOL6A36.07/342.25.68/82.43.010.011
14Collagen alpha-3(VI) chain *F6QAT0_HORSECOL6A36.07/342.25.78/81.84.020.017
15Collagen alpha-3(VI) chain *F6QAT0_HORSECOL6A36.07/342.25.87/81.83.640.002
16Collagen alpha-3(VI) chain *F6QAT0_HORSECOL6A36.07/342.26.00/81.72.730.031
17Collagen alpha-2(VI) chainF7CGV8_HORSECOL6A25.93/105.66.41/81.40.480.009
18Collagen alpha-2(VI) chainF7CGV8_HORSECOL6A25.93/105.66.65/80.80.460.0001
19Collagen alpha-2(VI) chainF7CGV8_HORSECOL6A25.93/105.66.79/80.60.470.002
20Collagen alpha-2(VI) chainF7CGV8_HORSECOL6A25.93/105.67.11/80.40.280.0001
21Collagen alpha-2(VI) chainF7CGV8_HORSECOL6A25.93/105.67.33/80.10.360.001
22Collagen alpha-2(VI) chainF7CGV8_HORSECOL6A25.93/105.67.39/77.10.150.0001
23Collagen alpha-2(VI) chainF7CGV8_HORSECOL6A25.93/105.67.66/76.60.250.0001
24Collagen alpha-2(VI) chainF7CGV8_HORSECOL6A25.93/105.67.94/75.60.200.0001
25Collagen alpha-2(VI) chainF7CGV8_HORSECOL6A25.93/105.68.20/75.30.420.0001
26VimentinF7B5C4_HORSEVIM4.67/42.25.18/74.30.280.005
27VimentinF7B5C4_HORSEVIM4.67/42.25.29/73.90.400.003
28LactadherinF7B0S3_HORSEMFGE86.22/46.46.06/65.22.760.014
29LactadherinF7B0S3_HORSEMFGE86.22/46.46.70/64.22.100.0002
30ATP synthase subunit betaF6U187_HORSEATP5F1B5.15/56.25.24/55.53.150.017
31ATP synthase subunit betaF6U187_HORSEATP5F1B5.15/56.25.16/54.55.900.038
32Hyaluronan and proteoglycan link protein 1HPLN1_HORSEHAPLN18.19/40. 75.13/50.16.590.001
33Endoplasmic reticulum resident protein 44F6WY40_HORSEERP445.00/47.445.25/50.92.270.005
34Trifunctional enzyme mitochondrial.F6TCZ6_HORSEHADHB9.49/51.45.36/50.97.270.0001
35Collagen alpha-1(VI) chainF6UW03_HORSECOL6A15.24/1105.45/50.83.600.006
36Junction plakoglobin *F6V1T9_HORSEJUP5.73/82.55.54/50.96.640.004
37Enolase 1F6V7C1_HORSEENO16.37/47.55.63/51.02.760.007
38Ornithine aminotransferaseF7C9Y5_HORSEOAT6.84/48.77.45/50.40.290.0001
39AdenosylhomocysteinaseF6VIG9_HORSEAHCY5.86/48.16.90/48.70.210.009
40AdenosylhomocysteinaseF6VIG9_HORSEAHCY5.86/48.17.15/48.40.150.001
41Cartilage intermediate layer proteinF7C2J3_HORSECILP8.85/1357.37/48.30.370.0001
42Actin, cytoplasmic 1F7AAK7_HORSEACTG15.31/42.15.51/43.211.90.0001
43Actin, cytoplasmic 1F7AAK7_HORSEACTG15.31/42.15.60/43.34.220.008
44Hyaluronan and proteoglycan link protein 1HPLN1_HORSEHAPLN18.19/40.65.66/42.78.640.0005
45Hyaluronan and proteoglycan link protein 1HPLN1_HORSEHAPLN18.19/40.65.26/40.10.090.004
46Hyaluronan and proteoglycan link protein 1HPLN1_HORSEHAPLN18.19/40.65.45/40.00.230.0006
47Collagen alpha-2(VI) chainF7CGV8_HORSECOL6A25.93/105.64.94/37.90.420.012
48Annexin A2F6ZI51_HORSEANXA26.92/38.87.21/37.92.000.0023
49Annexin A1ANXA1_HORSEANXA16.57/39 7.42/38.02.020.0002
50Glyceraldehyde-3-phosphate dehydrogenaseF6YV40_HORSEGAPDH8.22/36.07.75/38.23.110.0001
51L-lactate dehydrogenaseC6L1J5_HORSELDHB5.85/36.86.58/33.92.930.004
52Collagen alpha-1(VI) chainF6UW03_HORSECOL6A15.24/110.7.01/33.72.80.0004
53Succinyl-CoA ligaseF6QTC9_HORSESUCLG19.27/36.67.28/33.22.220.0003
54Voltage dependent anion channel 2 F6TLU0_HORSEVDAC27.60/32.37.62/33.74.010.0001
5514-3-3 protein thetaF6SP02_HORSEYWHAQ4.68/28.04.72/30.40.390.015
56Triosephosphate isomeraseF6TZS9_HORSETPI16.96/26.98.10/28.22.980.0001
57Enoyl-CoA hydrataseF6QV70_HORSEECHS17.55/28.28.64/27.13.490.0001
58Superoxide dismutaseF6U991_HORSEHADHB8.44/24.47.24/26.44.390.0001
59Superoxide dismutaseF6U991_HORSEHADHB8.44/24.47.75/25.50.270.0001
60Superoxide dismutaseF6U991_HORSEHADHB8.44/24.48.11/25.40.230.0001
61Collagen alpha-1(VI) chain *F6UW03_HORSECOL6A15.24/1107.82/23.1+++
62Collagen alpha-1(VI) chain *F6UW03_HORSECOL6A15.24/1107.81/22.4+++
63Collagen alpha-1(VI) chain *F6UW03_HORSECOL6A15.24/1108.11/22.7+++
64Collagen alpha-1(VI) chain *F6UW03_HORSECOL6A15.24/1108.11/22.2+++

