Article

Genome-Wide Identification and Expression Analysis of the Ascorbate Oxidase Gene Family in Gossypium hirsutum Reveals the Critical Role of GhAO1A in Delaying Dark-Induced Leaf Senescence

1
Key Laboratory of Xinjiang Phytomedicine Resource and Utilization of Ministry of Education, College of Life Sciences, Shihezi University, Shihezi 832003, China
2
Ministry of Education Key Laboratory for Ecology of Tropical Islands, College of Life Sciences, Hainan Normal University, Haikou 571158, China
*
Authors to whom correspondence should be addressed.
These authors contributed equally to this work.
Int. J. Mol. Sci. 2019, 20(24), 6167; https://doi.org/10.3390/ijms20246167
Submission received: 10 November 2019 / Revised: 3 December 2019 / Accepted: 4 December 2019 / Published: 6 December 2019
(This article belongs to the Section Molecular Plant Sciences)

Abstract

:
Ascorbate oxidase (AO) plays important roles in plant growth and development. Previously, we reported a cotton AO gene that acts as a positive factor in cell growth. Investigations on Gossypium hirsutum AO (GhAO) family genes and their multiple functions are limited. The present study identified eight GhAO family genes and performed bioinformatic analyses. Expression analyses of the tissue specificity and developmental feature of GhAOs displayed their diverse expression patterns. Interestingly, GhAO1A demonstrated the most rapid significant increase in expression after 1 h of light recovery from the dark. Additionally, the transgenic ao1-1/GhAO1A Arabidopsis lines overexpressing GhAO1A in the Arabidopsis ao1-1 late-flowering mutant displayed a recovery to the normal phenotype of wild-type plants. Moreover, compared to the ao1-1 mutant, the ao1-1/GhAO1A transgenic Arabidopsis presented delayed leaf senescence that was induced by the dark, indicating increased sensitivity to hydrogen peroxide (H2O2) under normal conditions that might be caused by a reduction in ascorbic acid (AsA) and ascorbic acid/dehydroascorbate (AsA/DHA) ratio. The results suggested that GhAOs are functionally diverse in plant development and play a critical role in light responsiveness. Our study serves as a foundation for understanding the AO gene family in cotton and elucidating the regulatory mechanism of GhAO1A in delaying dark-induced leaf senescence.

1. Introduction

Ascorbate oxidase (AO; EC 1.10.3.3), is an enzyme that exists only in plants and fungi [1] and participates in numerous physiological processes, including plant growth and development, responses to environmental stress, and regulation of cellular reduction/oxidation (redox) homeostasis. As a glycoprotein of the blue copper oxidase enzyme family [2,3], AO contains three distinct copper domains [4,5,6,7] that endow the function of oxidizing ascorbic acid (AsA) to monodehydroascorbate (MDHA) and of synchronously catalyzing molecular oxygen reduction to water [6,8]. The expression of AO is regulated by complex transcriptional and post-transcriptional controls [9], including induced and reduced expression at the mRNA level by hormones [10,11] and abiotic stresses [11,12,13], respectively.
In plants, AOs perform multiple functional roles. AO abundance is relatively high in rapidly growing tissues and young fruits [10,13,14]. Transgenic tomato with suppressed AO expression displays high levels of AsA in fruits and improved fruit yield [15,16]. Enhancing AO expression in tobacco reduces stomatal aperture [11]. AO decreases the production of dehydroascorbate (DHA) by catalyzing the oxidation of AsA, which in turn regulates cell division and cell cycle [17,18,19]. Overexpression of AO has also been utilized as a strategy to downregulate oxygen diffusion in root nodules [20]. Higher or lower AO activity results in increased sensitivity to ozone or enhanced tolerance to salt stress, respectively [11,12,21]. In addition, previous studies have also shown that AO may be involved in light responsiveness, with cis-elements for light regulation in a known AO promoter region, and the suppression or overexpression of AO causes late flowering or delayed dark-induced senescence in vitro [2,10,12,22].
Reactive oxygen species (ROS) are regarded as signaling molecules that participate in plant development, programmed cell death (PCD), and environmental stress responses [23,24,25]. The enzymes of the AsA antioxidant system play different roles; ascorbate peroxidase (APX) acts as a ROS-scavenging enzyme that reduces hydrogen peroxide (H2O2) to water, while AO utilizes AsA as a substrate to reduce O2 to water [25,26]. A close link between AO and ROS was reported in cotton, wherein H2O2 significantly accumulates in AO-overexpressing tobacco plants [7], suggesting the potential role of AO in modulating cellular ROS-mediated redox homeostasis. It has been reported that AO plays a crucial role in cell growth by regulating the cellular redox state in connection with ROS, demonstrating that AO is upregulated in rapidly expanding tissues [9,27,28,29], and the overexpression of cotton Gossypium hirsutum ascorbate oxidase 1 (GhAO1) and pumpkin AO promotes cell elongation in tobacco [7,30].
Upland cotton (Gossypium hirsutum) is one of the most important global economic crops and provides the major material of fibers utilized in the textile industry. Previously, we reported that APX is involved in fiber development by regulating H2O2 homeostasis, and fiber-specific AO promotes tobacco cell growth by H2O2-mediated accumulation [7,25]. In higher plants, a total of three, five, seven, four, and six AOs have been identified in Arabidopsis thaliana, Oryza sativa, Glycine max, Zea mays, and Sorghum bicolor, respectively, with different response patterns to diverse abiotic stresses and development cues [3]. The AO gene family members and their functions in cotton, however, are largely unknown. In this study, we performed a genome-wide investigation and expression profiling of the AO gene family in G. hirsutum. A total of eight GhAO genes were identified, and the systematic analyses of chromosomal location, phylogenetic relationship, gene structure, and motif distribution were obtained. Cis-element distribution and expression pattern analyses of tissue-specificity and developmental feature suggested that GhAOs have diverse functions. Particularly, an expression analysis in the process from dark to light, coupled with a complementary analysis of GhAO1A in the ao1-1 Arabidopsis mutant, revealed that GhAO1A is a functional gene that influences plant flowering and delays dark-induced leaf senescence by regulating AsA-mediated ROS homeostasis. These results provide comprehensive evolutionary and functional information on the GhAO gene family and lay the foundation for understanding the function and mechanism of GhAO1A in light responsiveness by controlling cellular redox balance.

2. Results

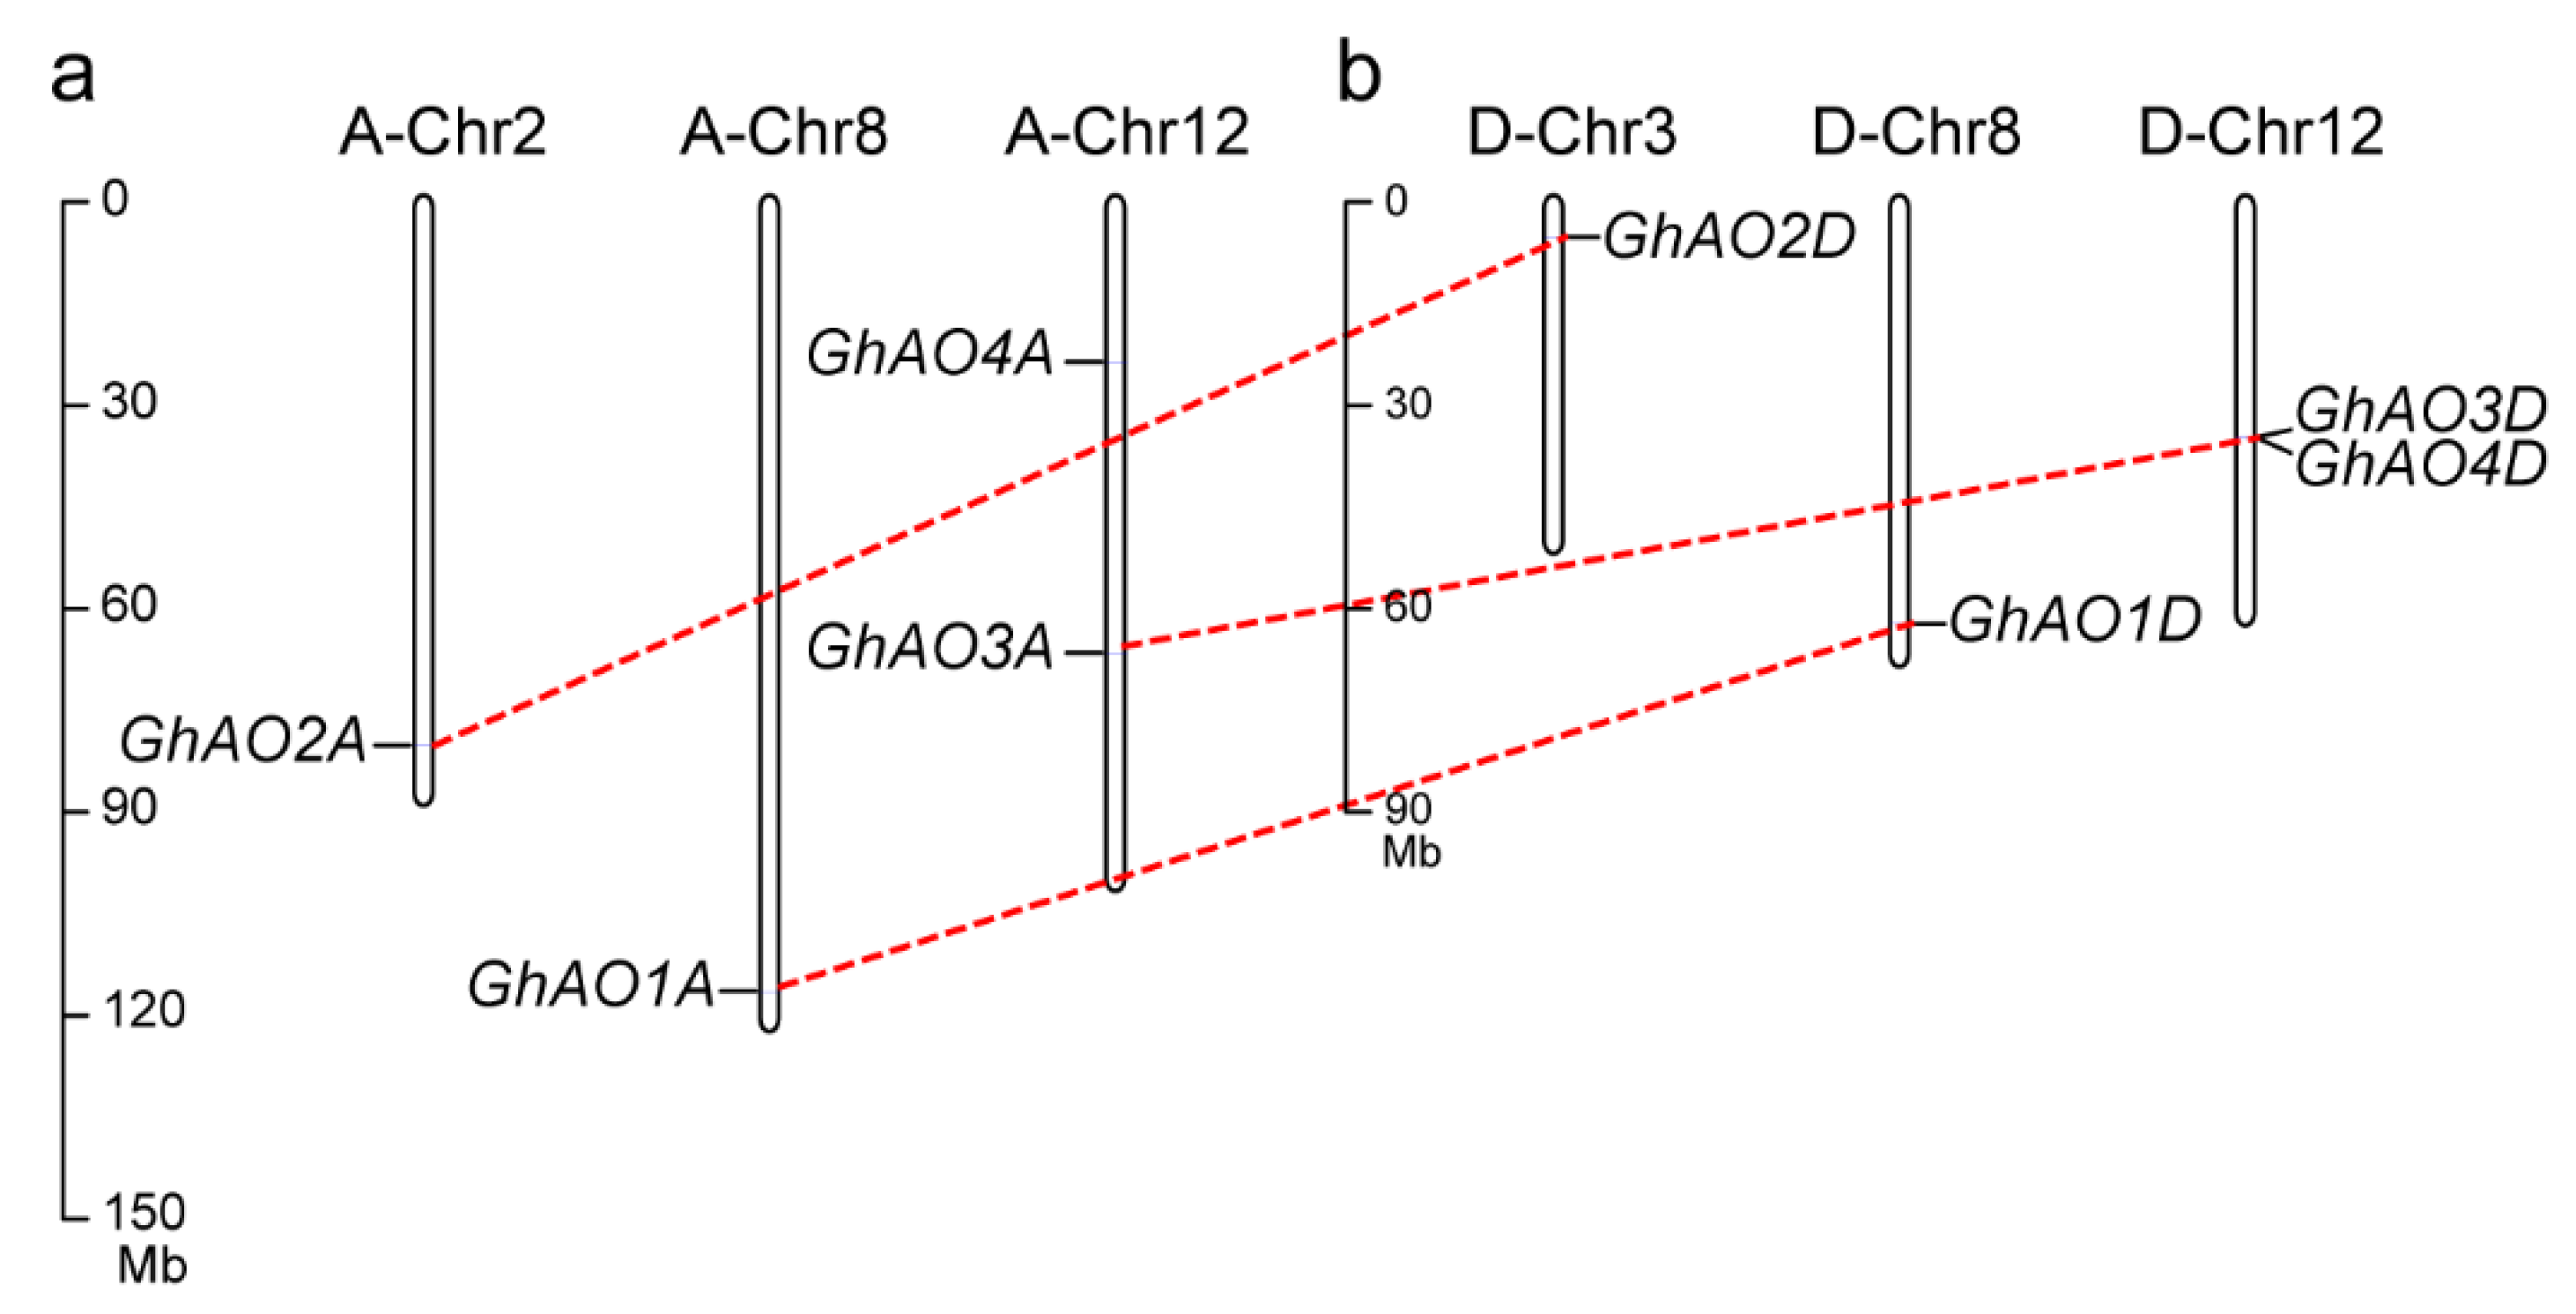
2.1. Identification and Characterization of AO Gene Family Members in G. hirsutum

To identify the AO gene family members in G. hirsutum, the reported AO protein sequences from A. thaliana, O. sativa, G. max, Z. mays, and S. bicolor (accession numbers listed in Supplementary Table S1) were used as direct queries to perform a blastp search against the G. hirsutum protein databases, which identified a total of eight AO genes. The open reading frame (ORF) length of these GhAOs ranged from 1263 to 1758 base pairs (bp), encoding putative proteins with 420 to 585 amino acids (aa), molecular weights (MW) ranging from 46.61 to 65.64 kDa, isoelectric point (pI) ranging from 5.65 to 8.63, and location in the extracellular apparatus (Table 1). The genomic location analysis showed that the eight GhAO genes were distributed across six chromosomes of the A or D sub-genome (Figure 1). Three putative paralogous gene pairs (GhAO1A-GhAO1D, GhAO2A-GhAO2D, and GhAO3A-GhAO3D) were found to be segmentally duplicated, sharing more than 98% sequence identity at the nucleotide level. GhAO3D and GhAO4D showed a possible incidence of tandem duplication due to their presence in proximal positions on the same chromosome.

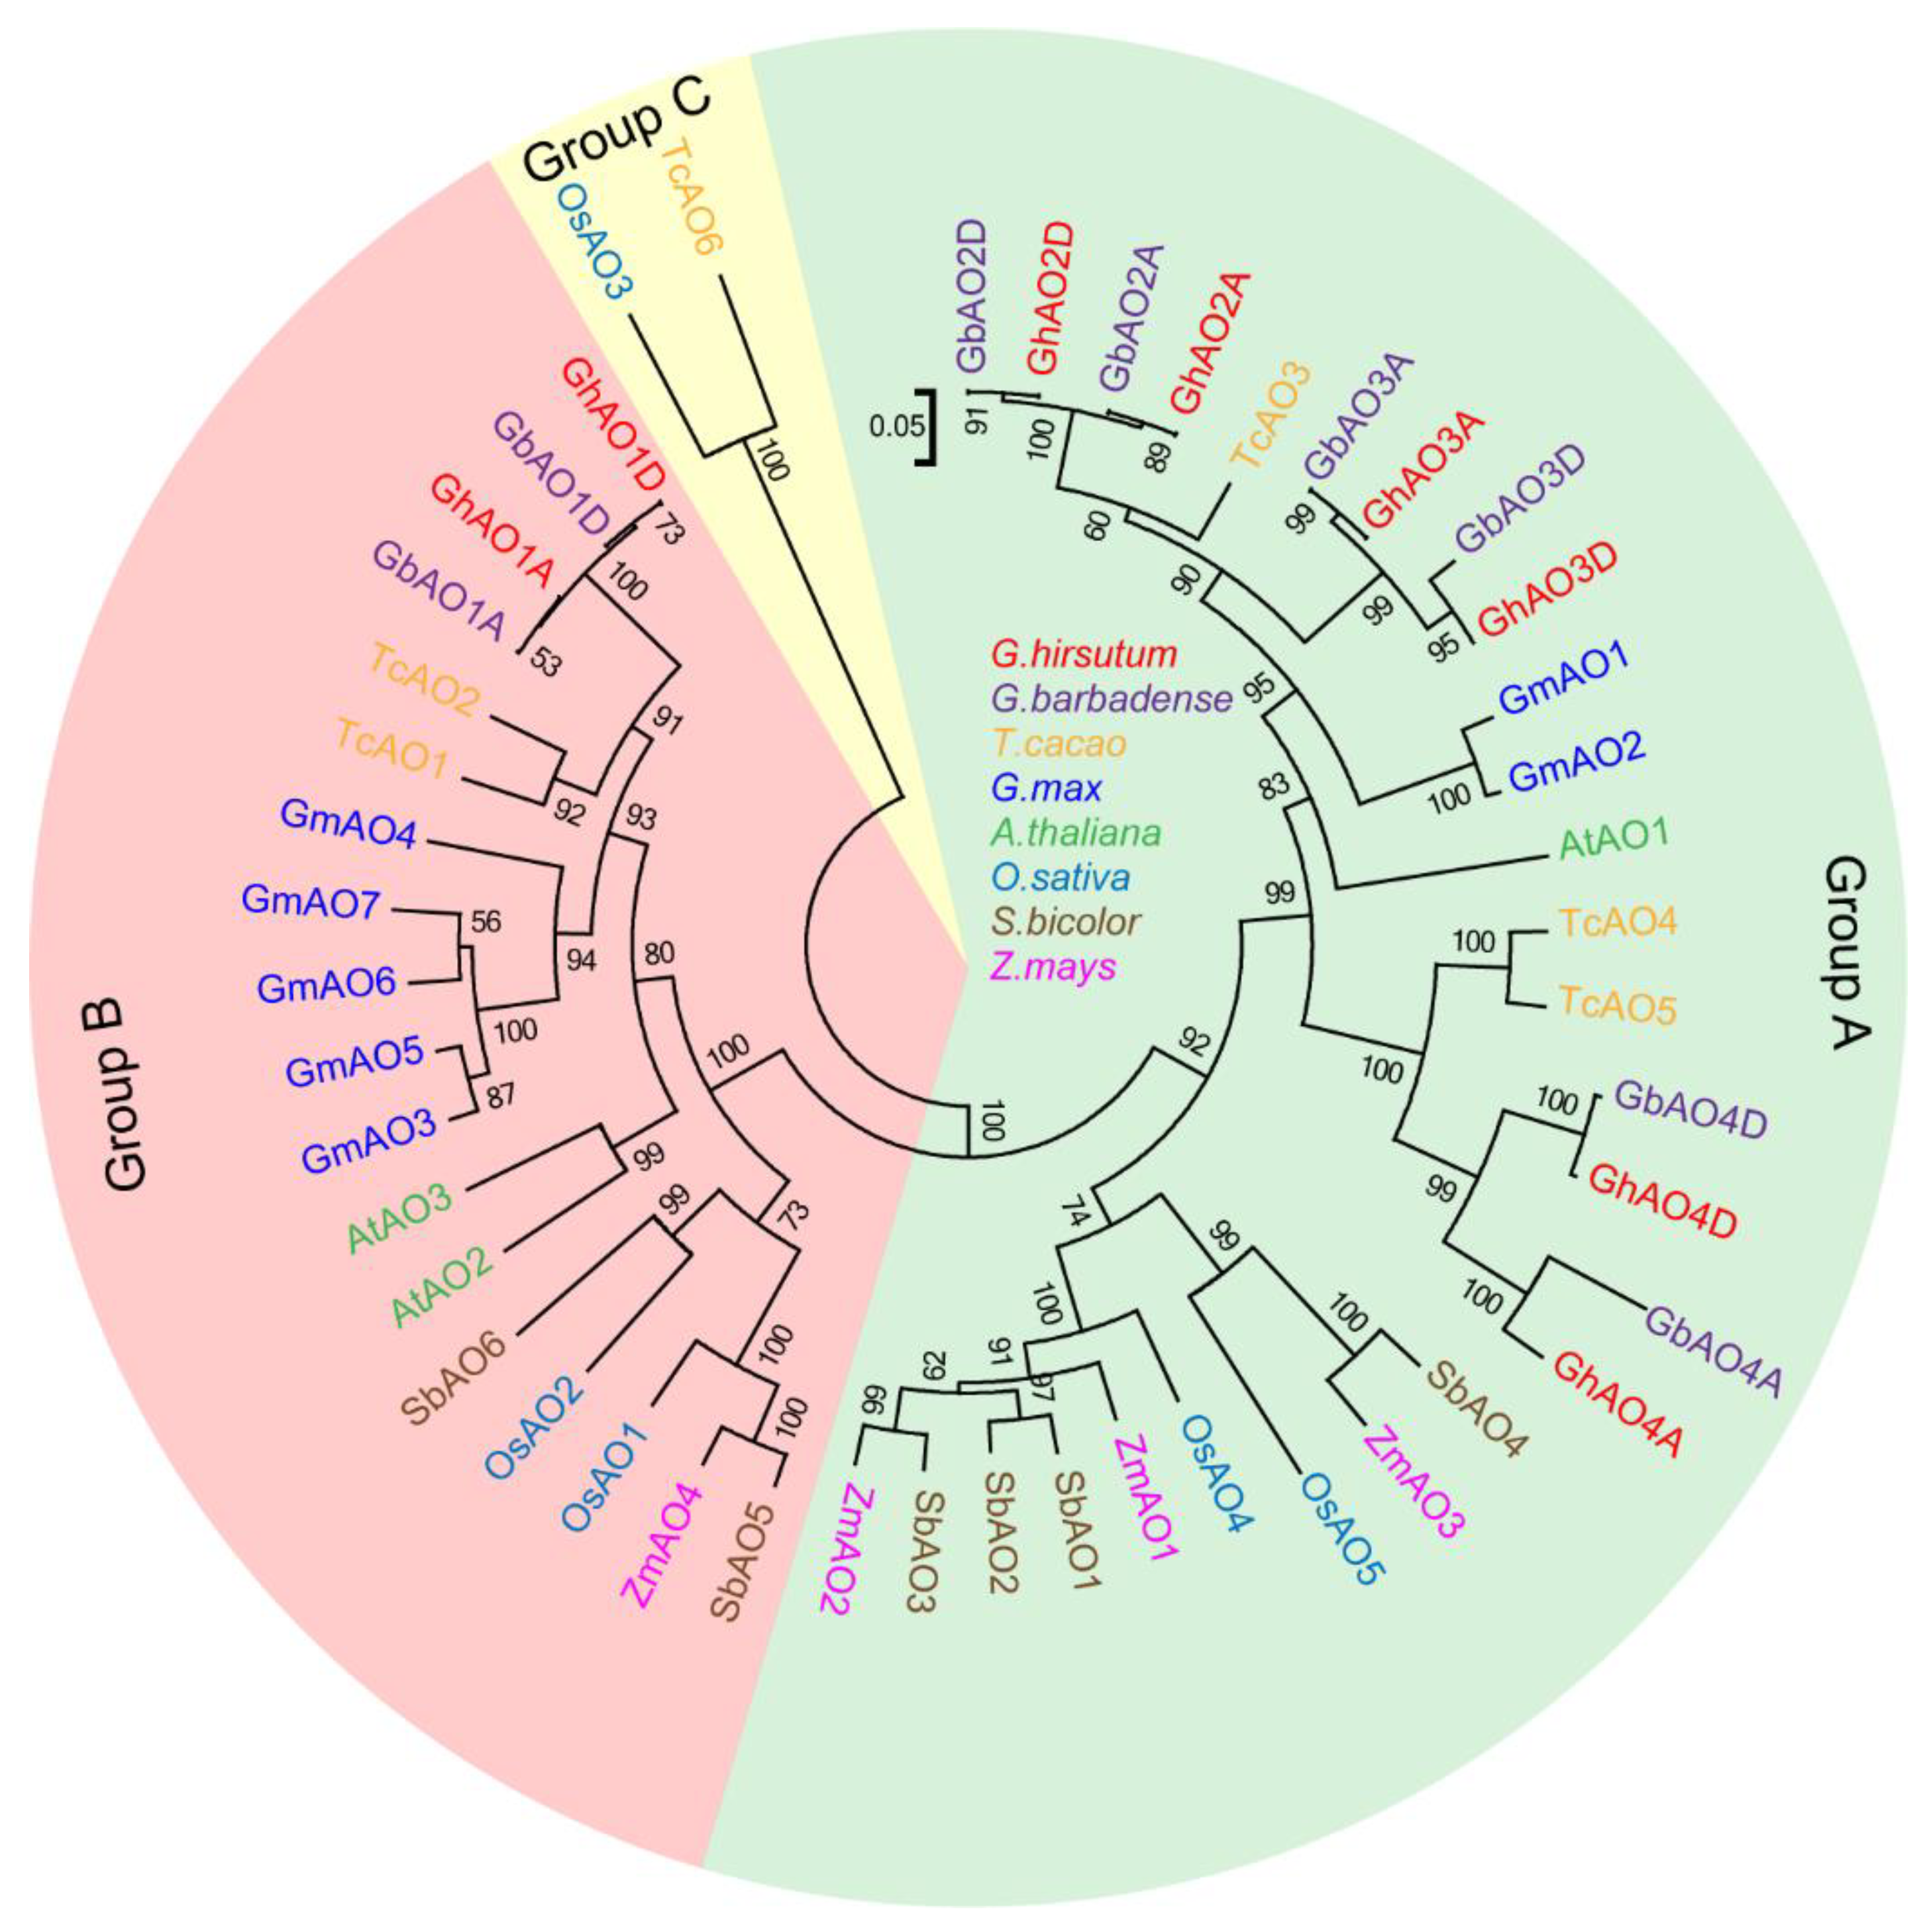
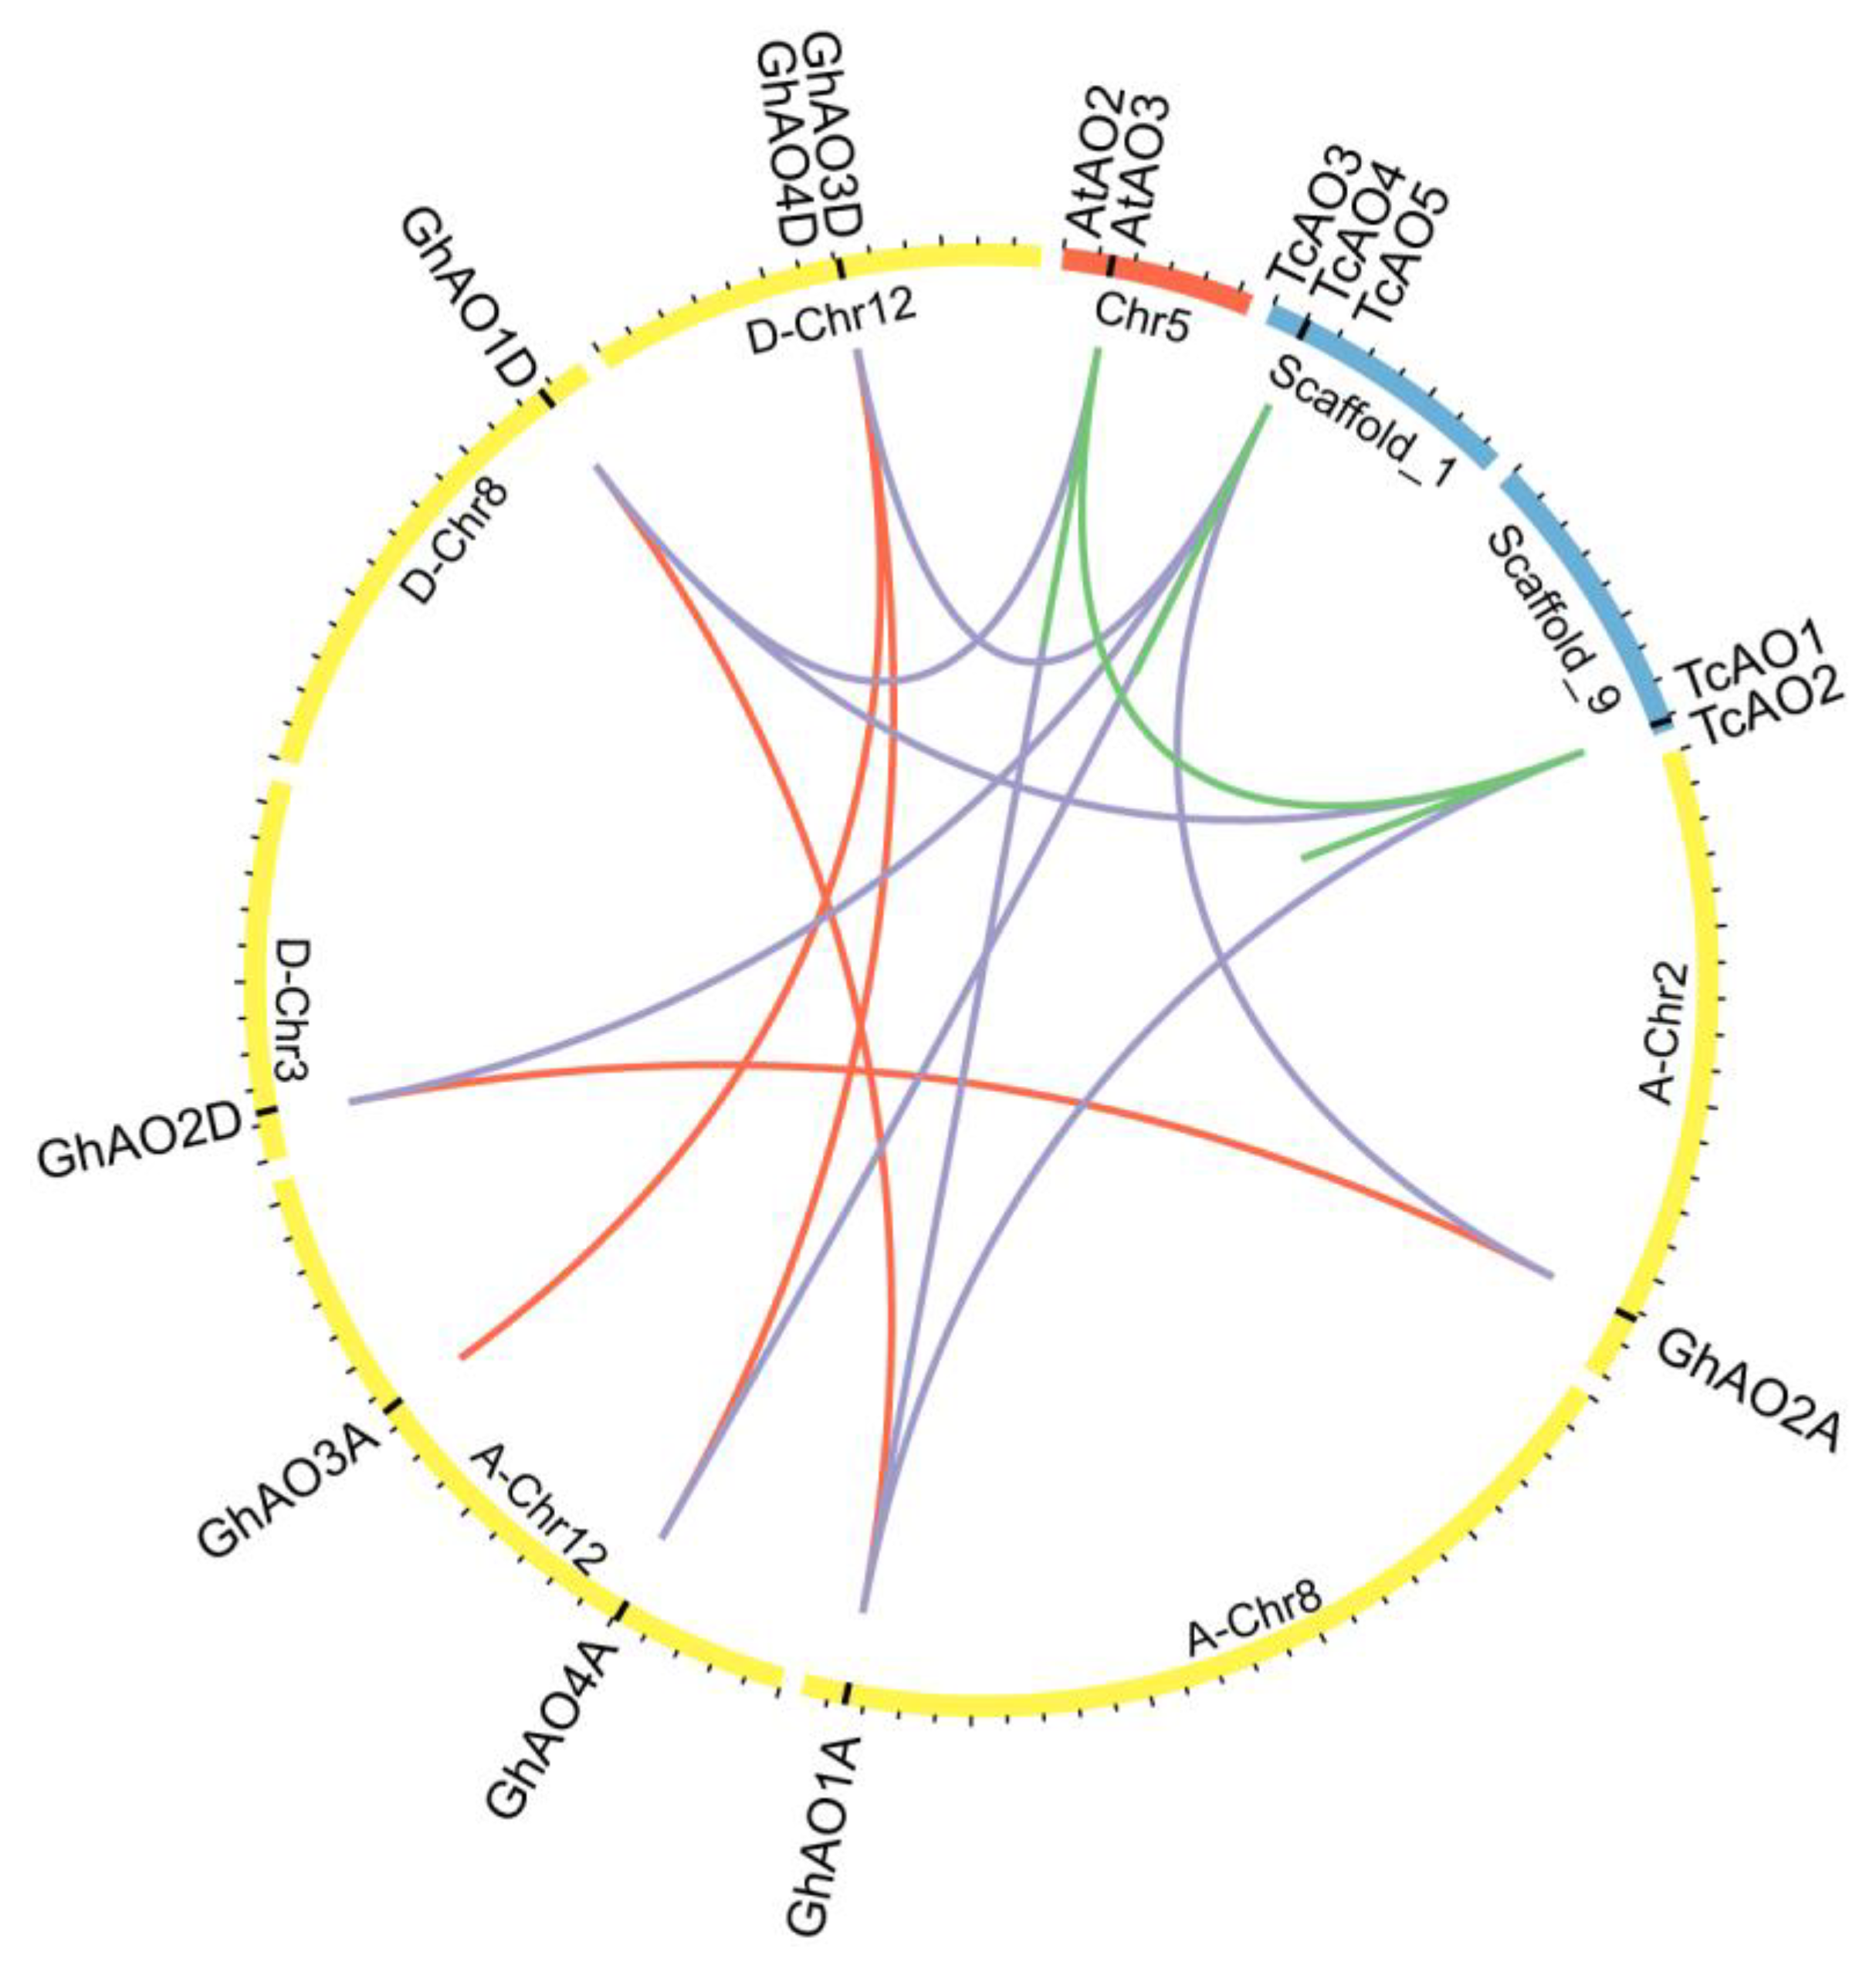
2.2. Phylogenetic and Evolutionary Analyses of GhAO Gene Family

The AO protein sequences from Gossypium hirsutum (GhAOs), Gossypium barbadense (GbAOs), Theobroma cacao (TcAOs), Arabidopsis thaliana (AtAOs), Oryza sativa (OsAOs), Glycine max (GmAOs), Zea mays (ZmAOs), and Sorghum bicolor (SbAOs) were used to construct a neighbor-joining (NJ) phylogenetic tree. These AOs were divided into three groups (Figure 2), and in terms of the AOs in Malvaceae (cotton and cacao), except for GhAO1A/1D, GbAO1A/1D, TcAO1, and TcAO2 in group B, most of the other AOs were mainly distributed in group A. In addition, based on the distinct differences in protein sequences compared to the other AOs, group C included only two members (OsAO3 and TcAO6).
The synteny of genes across related plant species could provide insights to their evolutionary relationships. The syntenic analysis of AO genes from cotton, cacao, and Arabidopsis was performed and visualized using the Circos software. There were four syntenic blocks of AO genes containing eight collinear gene pairs between G. hirsutum and T. cacao, indicating the segmental duplications of AO family genes between G. hirsutum and T. cacao (Figure 3). The Tajima relative rate test was used to determine the evolutionary rate of G. hirsutum AO paralogs (Table 2). Notably, an accelerating evolutionary rate was observed in the GhAO4A/GhAO4D gene pair, suggesting a potential functional divergency of the two AO paralogs.
The ratio of nonsynonymous substitution rate/synonymous substitution rate (Ka/Ks) is an indicator of evolutionary selection, with purifying, neutral, and positive selection indicated by Ka/Ks < 1, =1, and >1, respectively. In this study, the Ka/Ks ratio of each pair of duplicated GhAO genes indicated that, except for GhAO4A/GhAO4D, the other three GhAO gene pairs were purifying selection, and two of the three duplicated GhAO gene pairs were < 1 (Supplementary Table S2), implying that these GhAO gene pairs underwent a relatively rapid evolution, thereby influencing the expansion of the GhAO gene.

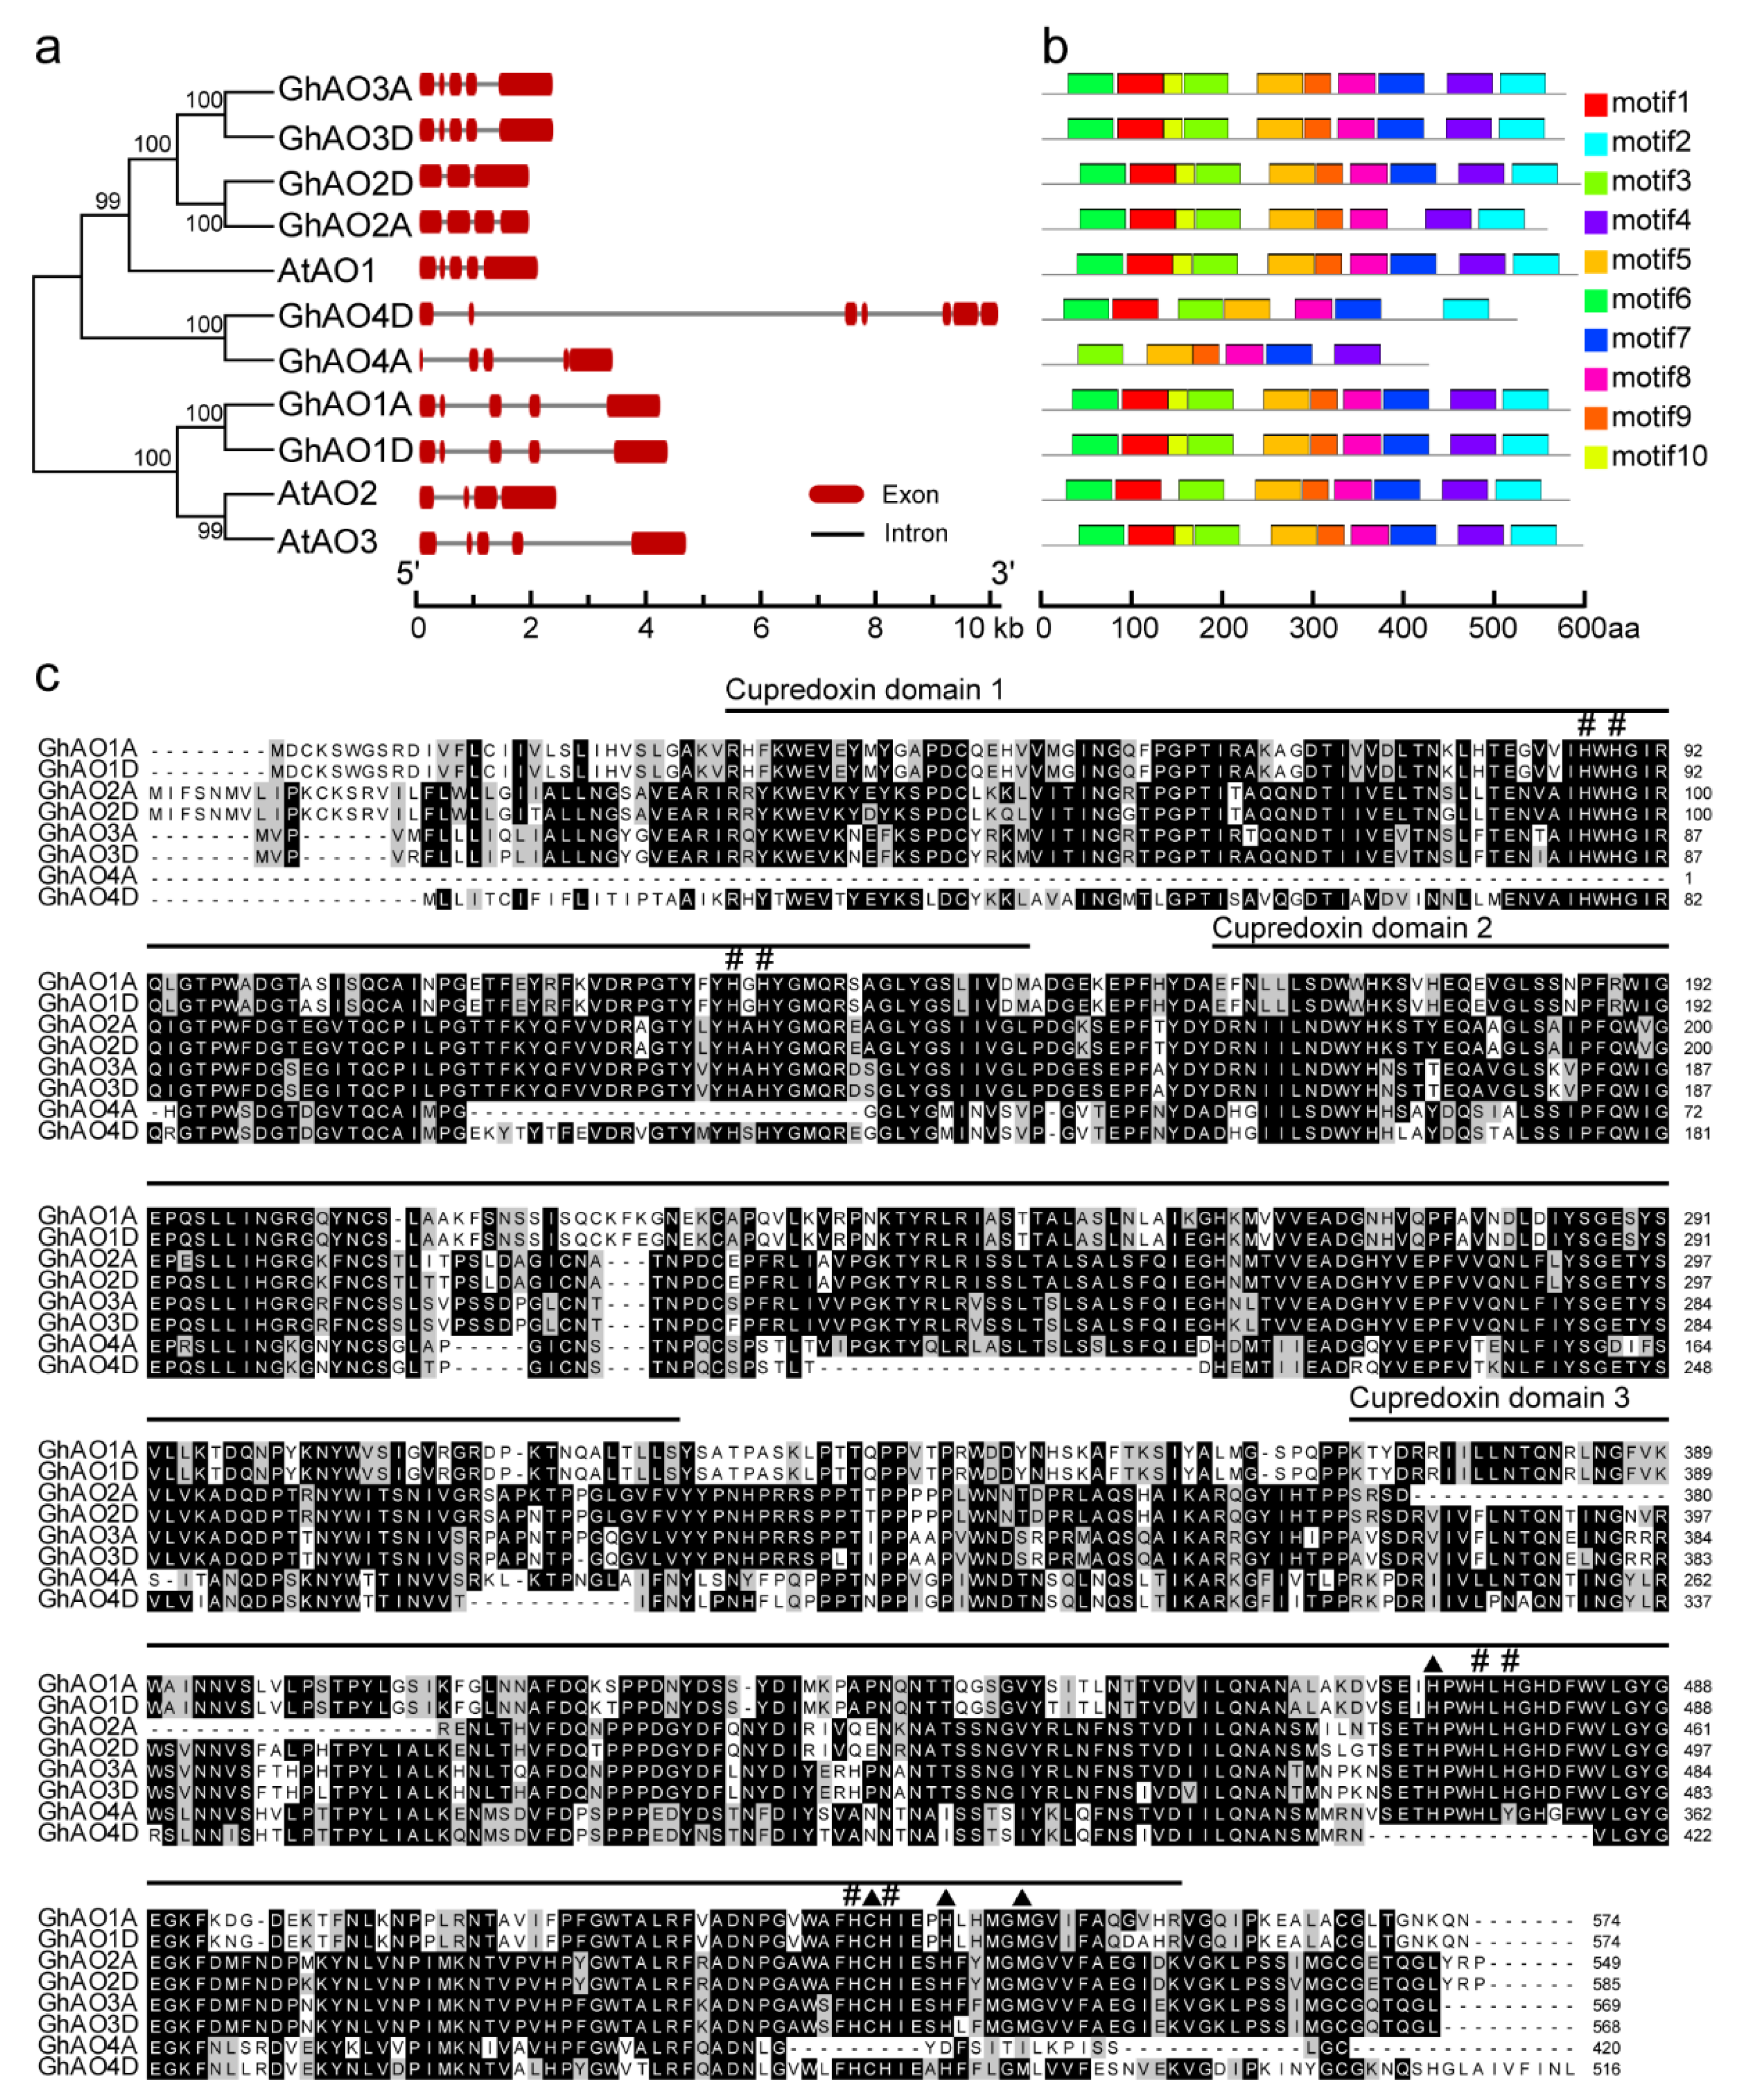
2.3. Gene Structure and Motif Analyses of GhAO Genes

Gene structure and conserved motif analyses were performed to obtain more insights into the diversity of motif composition and evolutionary relationship among the GhAOs. The arrangement of exons and introns were analyzed by the Gene Structure Display Serve (GSDS) program. Except for GhAO4A/4D, paralogous GhAO gene pairs displayed highly conserved gene structures (Figure 4a). The Multiple Em for Motif Elicitation (MEME) program was used to obtain the conserved motifs in GhAOs, demonstrating that 10 separate motifs were identified in GhAOs and each GhAO contained six or more conserved motifs (Figure 4b). Amino acid sequence alignment of the eight cotton GhAO proteins showed their conserved cupredoxin domains and the enzyme catalytic sites (Figure 4c). These results indicated that GhAOs are conservative proteins sharing similar motif distribution patterns of the same group.

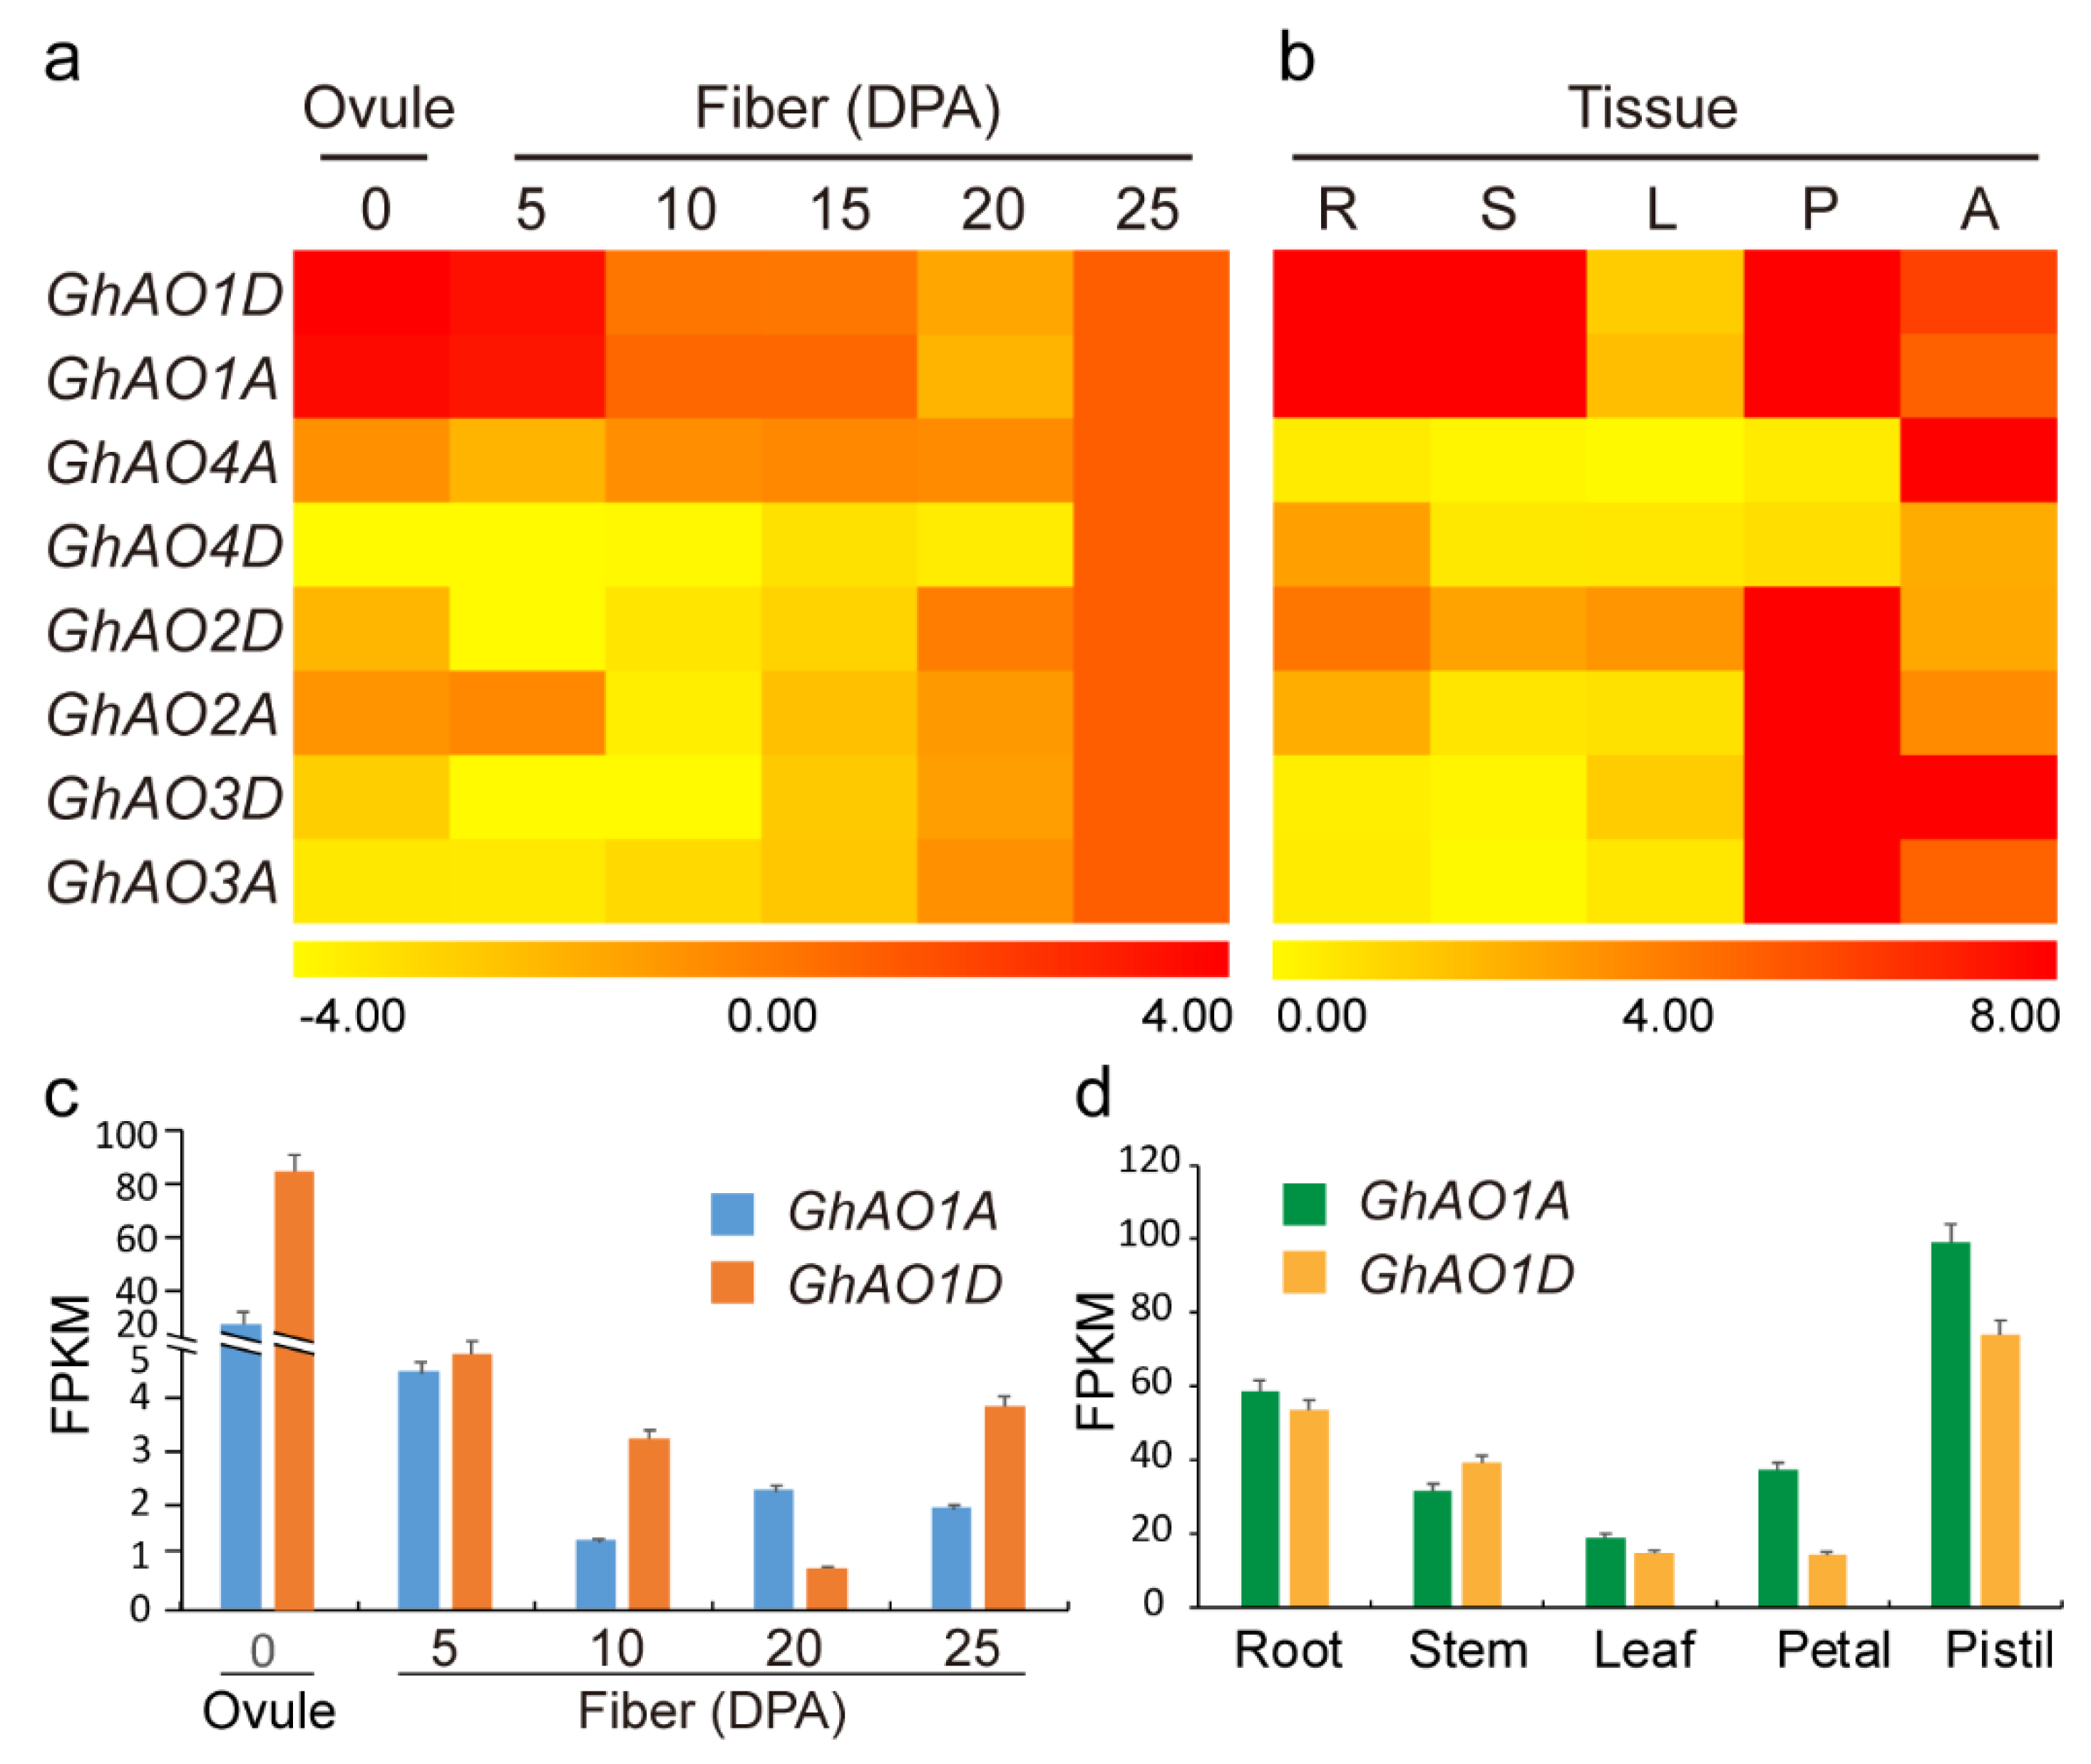
2.4. Expression Analysis of GhAO Genes in Fiber Development and Different Tissues

To investigate the GhAO expression patterns of tissue-specificity and responses to phytohormone and abiotic stresses, a quantitative real-time polymerase chain reaction (qRT-PCR)-based heatmap was used to analyze the expression levels of the GhAO genes. The GhAO genes exhibited diverse expressions in different tissues, including fibers, roots, stems, leaves, petals, and anthers. During the different fiber developmental stages, GhAO1A/1D showed high expression levels in 0–15 days post-anthesis (DPA) fibers (initiation and elongation stages), with significant accumulated expression in 0 DPA ovules and 5 DPA fibers. GhAO4A/4D displayed notable enrichment in 15–25 DPA fibers (secondary wall deposition stage), suggesting that these four GhAOs perform diverse important roles in different fiber growth stages. GhAO1A/1D was predominantly expressed in the roots, stems, petals, and anthers, indicating their potential function in tissue development (Figure 5a). Interestingly, except for GhAO4A/4D that showed increased expression in anthers, all of the other GhAOs demonstrated substantial increased expression in floral organs (Figure 5b). In consideration of the preferential expressions of GhAO1A/1D in fiber growth and tissue development, the corresponding publicly released RNA-seq data of GhAO1A/1D was obtained to identify and validate the expression level of GhAO1A/1D. The highly consistent expression features of GhAO1A/1D were observed between the qRT-PCR-based heatmap and the RNA-seq data (Figure 5c,d). These results implied that, by the significant accumulations, GhAO1A/1D may perform a possible vital role in controlling floral tissue development and flowering regulation.

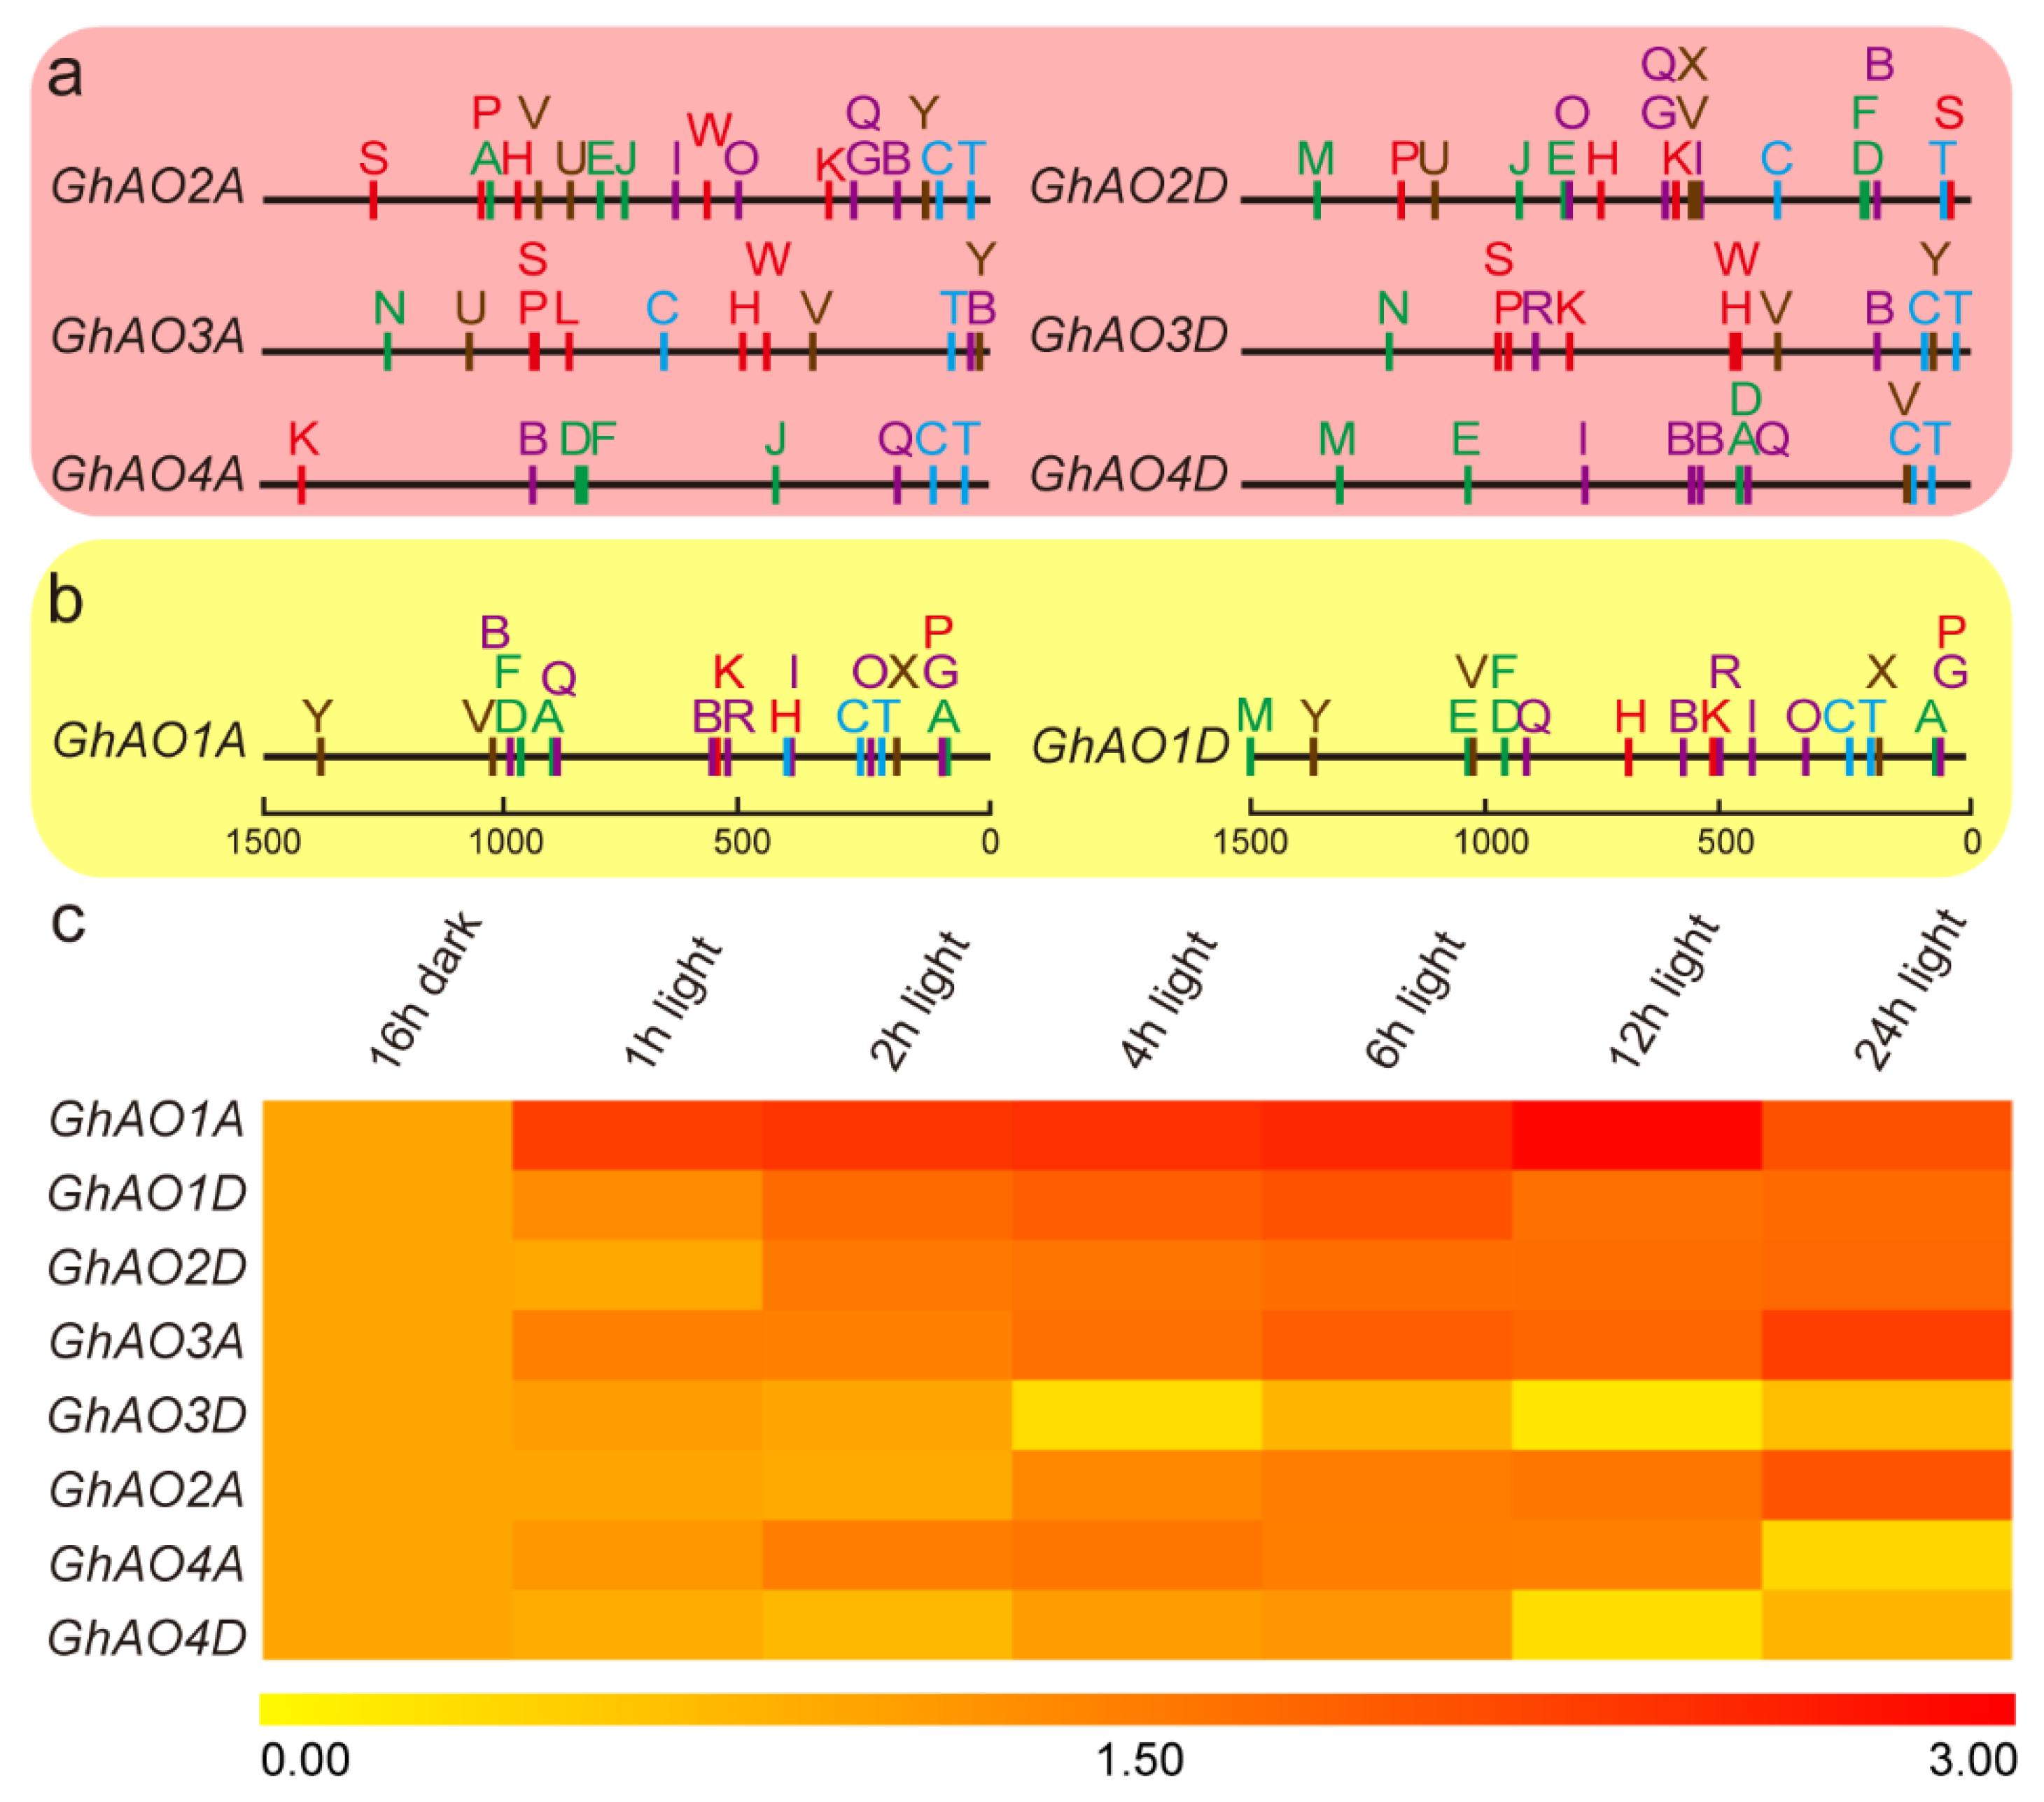
2.5. Cis-Regulatory Element Analysis of the GhAO Gene Promoter Region

To investigate the regulatory features of GhAOs, the isolated 1.5 kb sequence upstream of translational start site of the GhAOs was assessed for the presence of cis-acting elements. These regulatory elements were composed of various kinds of cis-acting elements, including core cis-elements and cis-elements for phytohormone response, stress response, and light response, and are indicated by capital letters of different colors (Figure 6a,b). The detailed classification, symbol, and sequence information of the cis-elements are listed in Supplementary Table S3. Interestingly, diverse light-responsive elements, including G-Box, Box 4, and Box I were found in the promoter regions of all of the GhAO genes, which suggested that GhAOs may exhibit distinct roles in light-regulated growth and development. In addition, the paralogous genes indicated the relatively conserved distribution of cis-elements, inferring the potential relationship of evolution and regulation model for GhAO gene pairs. Then, to gain insights on the regulatory mechanism of GhAO in response to light, the expression levels of the GhAOs were determined during the process of light recovery following continuous treatment in a 16 h dark period. The results showed that the expression of GhAO1A was increased significantly after 1 h of light recovery from the dark and then was stably maintained thereafter. Meanwhile, moderate promoted levels of expression of GhAO1D, GhAO2D, and GhAO3A were observed during light recovery (Figure 6c). These results suggested that GhAO genes, particularly GhAO1A, that showed the most significant and fastest induced expression during dark to light recovery, may perform pivotal functions in light adaptation and light-regulated growth and development of G. hirsutum.

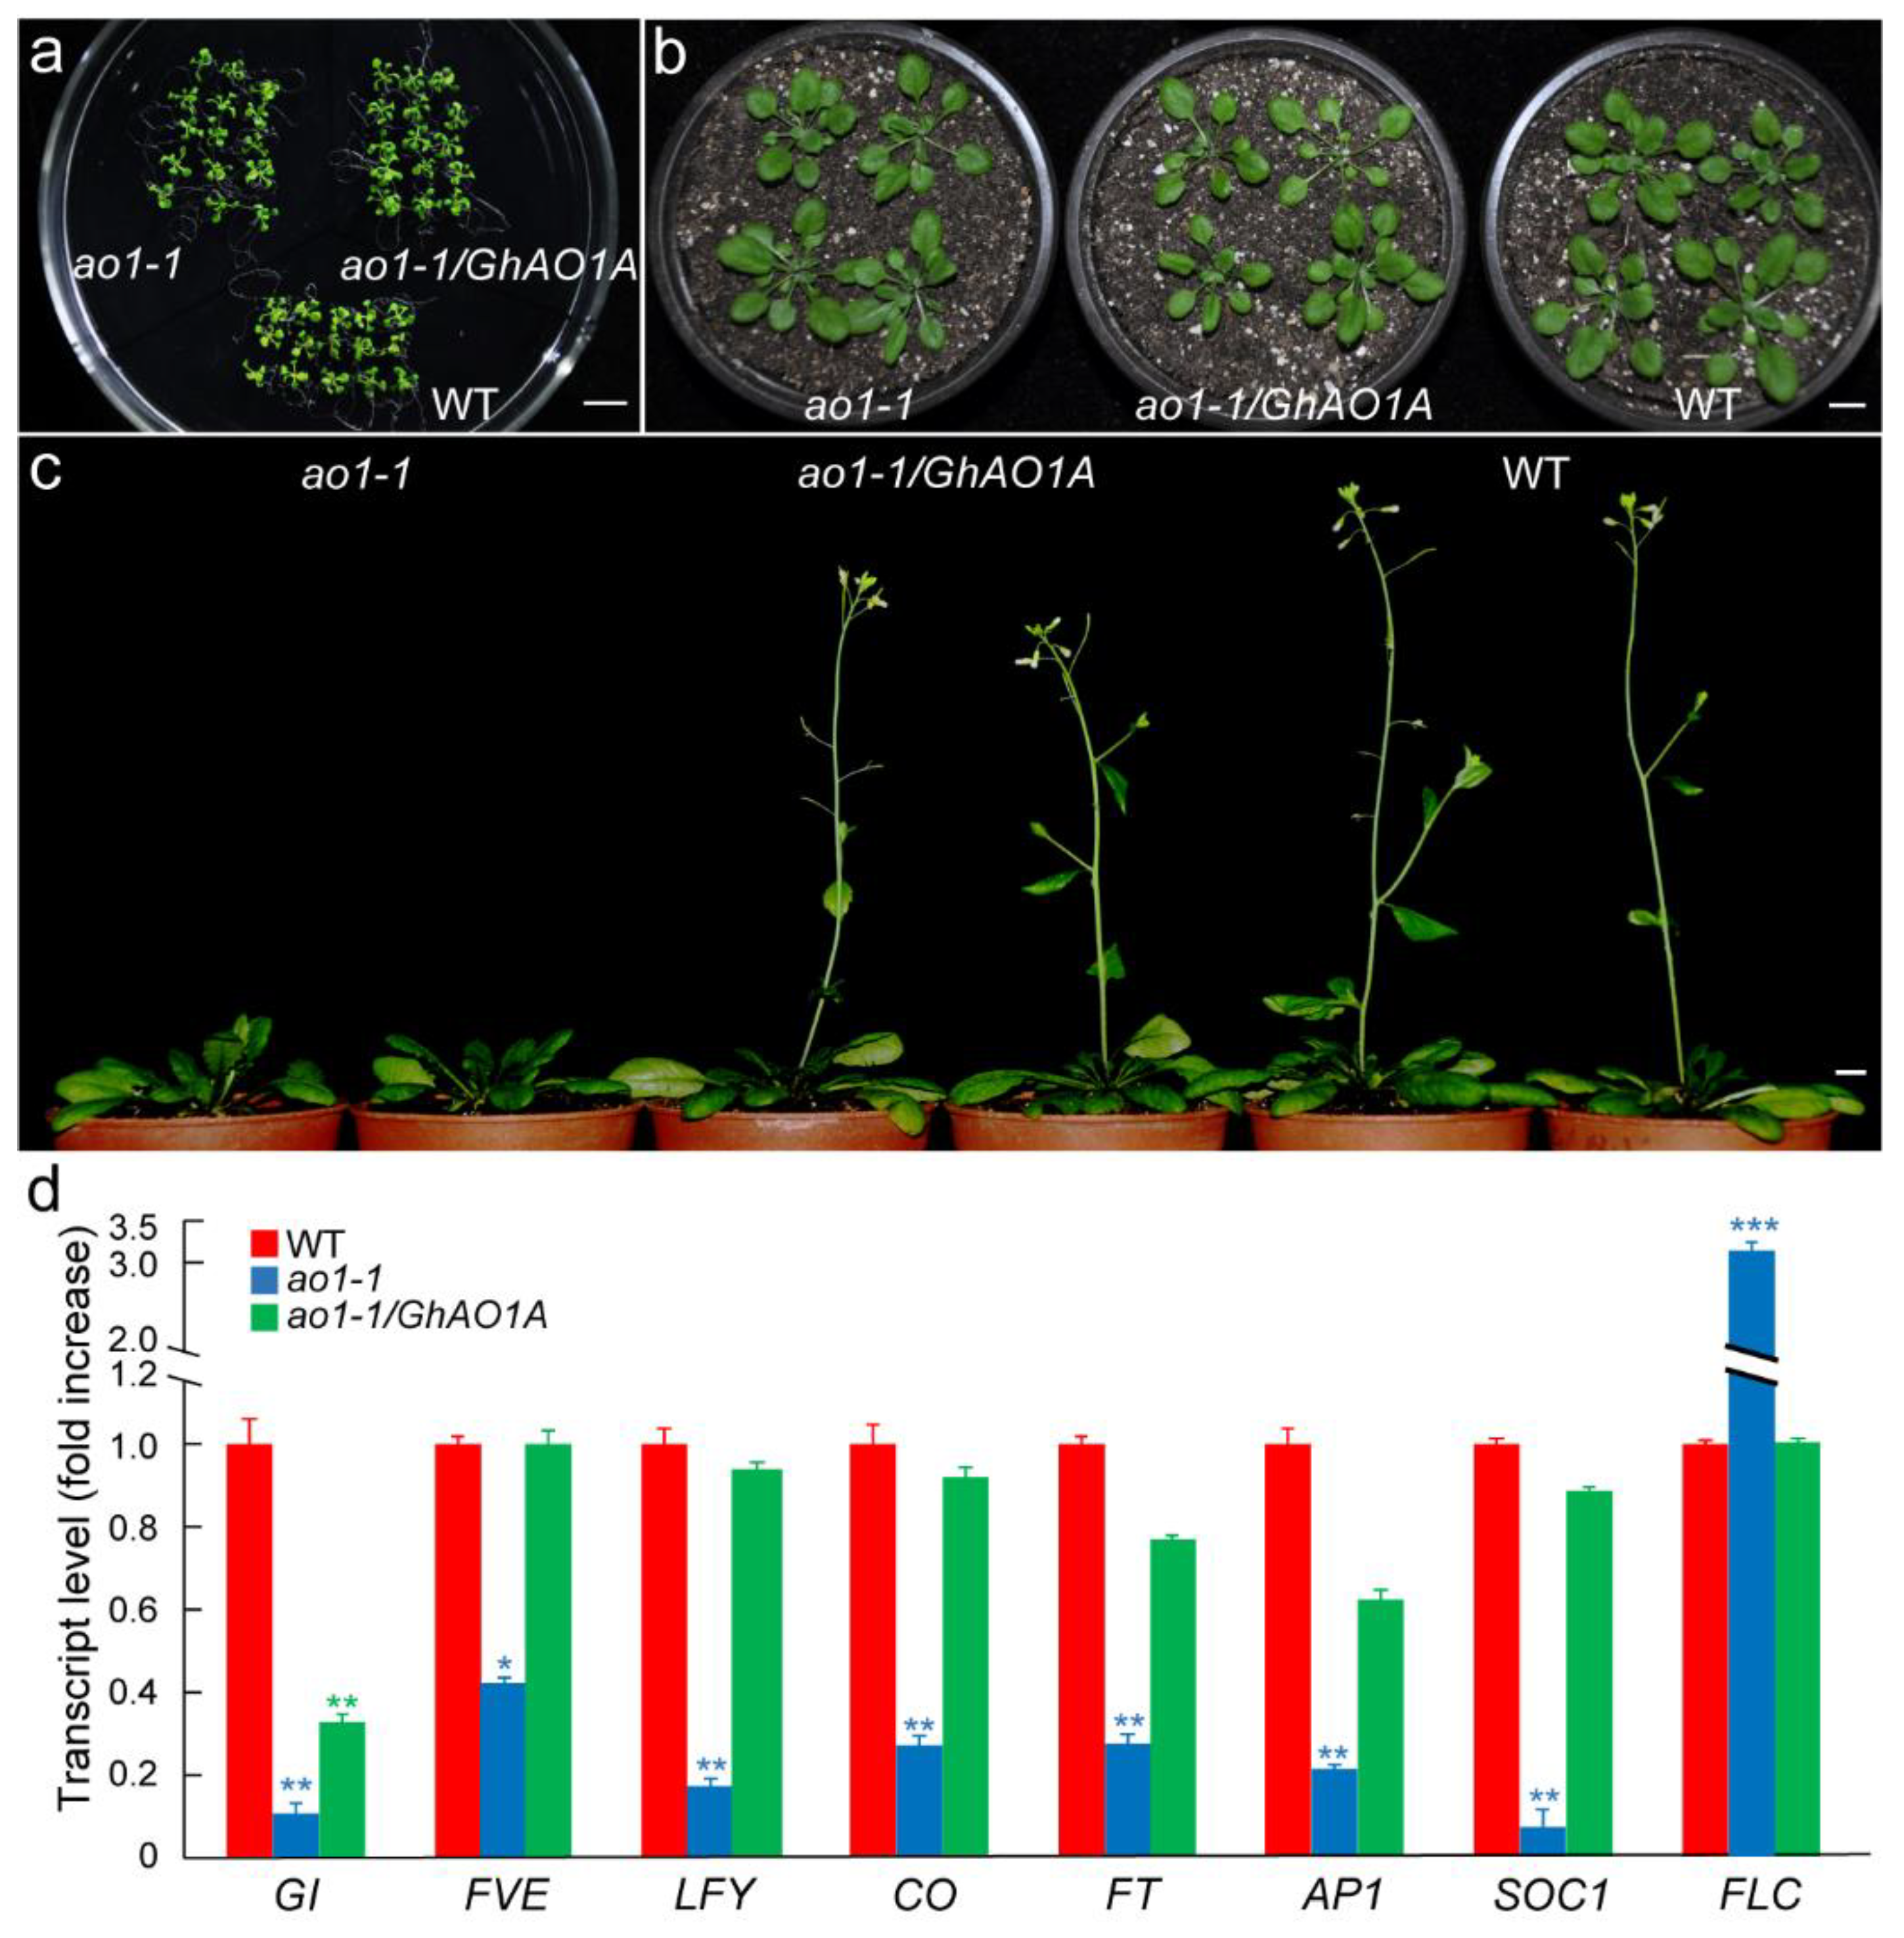
2.6. GhAO1A Rescues the Late-Flowering Phenotype of the Arabidopsis ao1-1 Mutant

Since it has been reported that suppression of AO genes alters the vegetative and reproductive growth of plants [12], Arabidopsis plants of wild-type (WT), ao1-1 T-DNA insertion mutants, and ao1-1/GhAO1A transgenic plants generated by overexpressing 35S::GhAO1A in the ao1-1 mutant through genetic transformation by floral dip method were utilized to investigate GhAO1A function in controlling plant growth and development in Arabidopsis. Under normal growth conditions, no significant phenotype differences in seedlings of the WT, ao1-1, and ao1-1/GhAO1A Arabidopsis plants were observed (Figure 7a,b). After continuous planting, compared to WT, the ao1-1 mutant exhibited late flowering (Figure 7c). Remarkably, the ao1-1/GhAO1A transgenic plants showed normal flowering times similar to that observed for the WT plants, indicating that GhAO1A is a functional homolog that rescues the defect of delayed flowering in ao1-1 mutants.
Considering the floral genes’ critical role in controlling flowering development [31,32], the expression of selected genes, namely, GIGANTEA (GI), FLOWERING LOCUS VE (FVE), LEAFY (LFY), CONSTANS (CO), FLOWERING LOCUS T (FT), APETALA 1 (AP1), SUPPRESSOR OF OVEREXPRESSION OF CONSTANS 1 (SOC1), and FLOWERING LOCUS C (FLC), were detected by qRT-PCR. As shown in Figure 7d, except for FLC that showed a relatively high expression level in the ao1-1 mutant, all of the other selected genes accumulated significantly in both transgenic ao1-1/GhAO1A and WT Arabidopsis plants. Most of these genes had similar expression levels in transgenic ao1-1/GhAO1A and WT Arabidopsis plants, with over 2.5-fold enrichment than that observed in the ao1-1 mutant. These results suggested that GhAO1A may affect the flowering development in Arabidopsis by altering the expressions of floral genes.

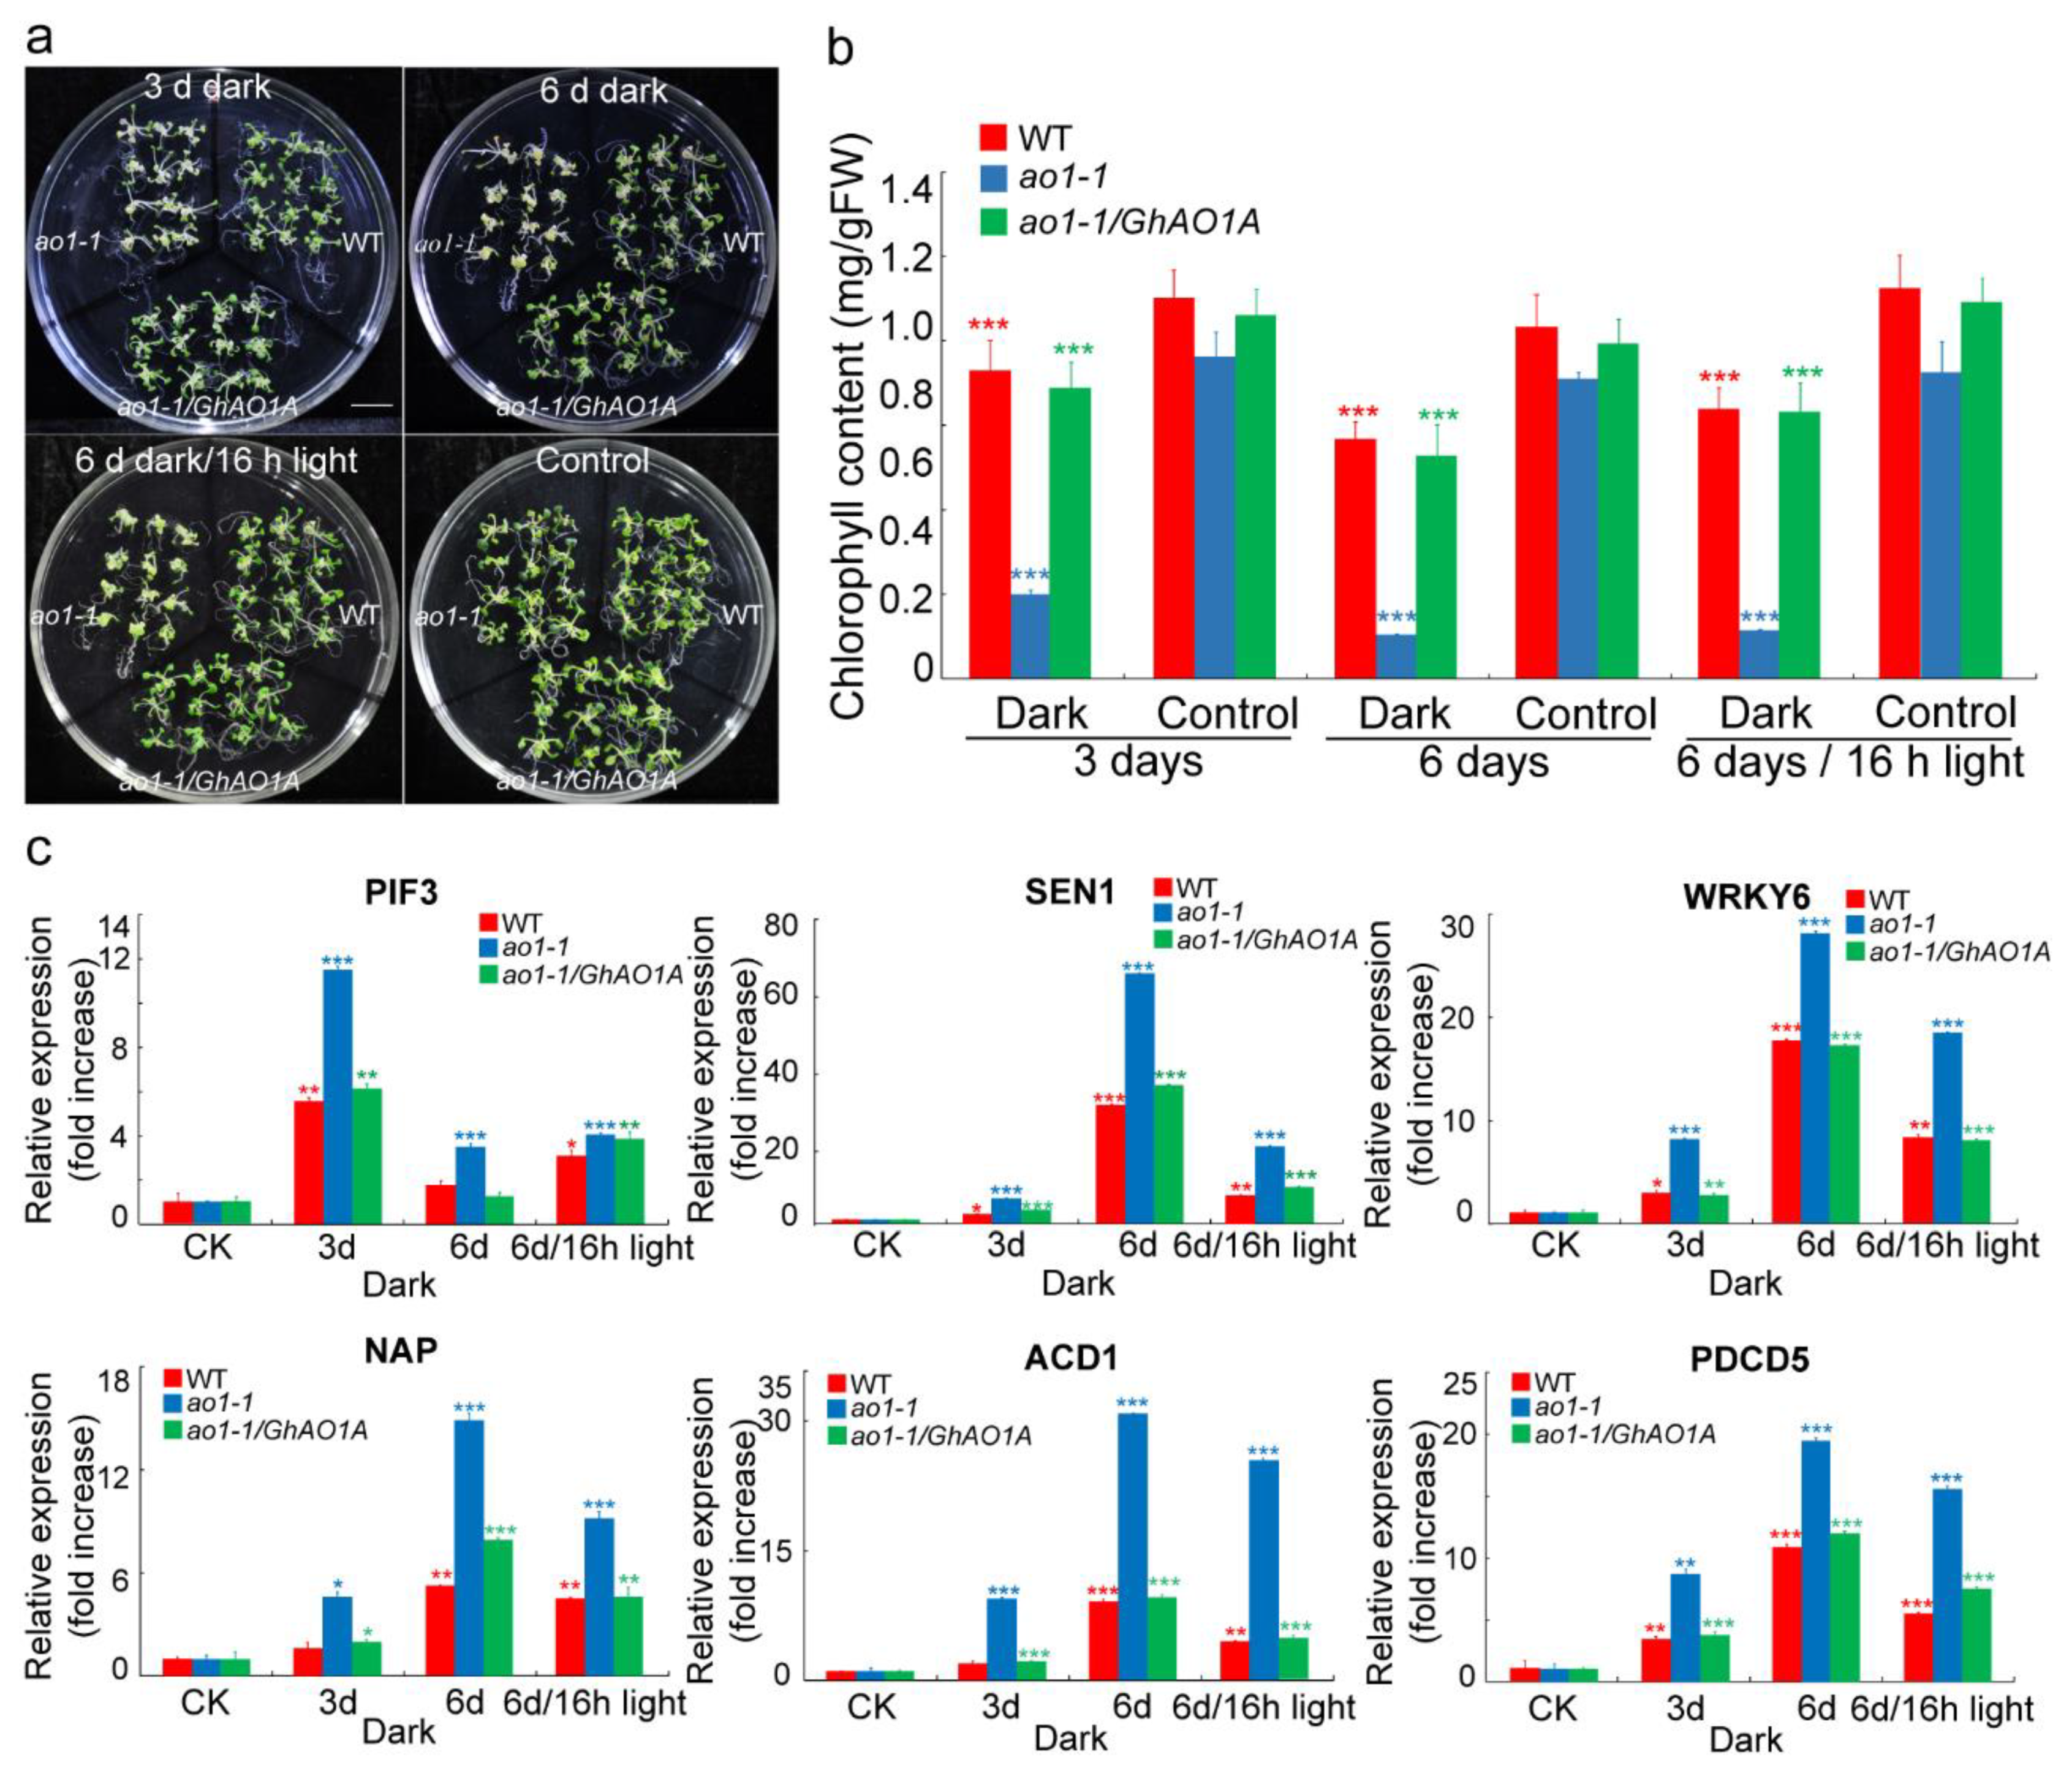
2.7. GhAO1A Delays Dark-Induced Leaf Senescence in Arabidopsis

Transgenic tobacco plants overexpressing AO demonstrated a delayed senescence after dark treatment [22]. In this study, two-week-old Arabidopsis seedlings (ao1-1, ao1-1/GhAO1A, and WT) were subjected to continuous dark treatment for 3 d and 6 d, and then to light recovery for 16 h to explore GhAO1A function in leaf senescence. Macroscopic observation showed the significant senescence phenotype of leaves with yellowing/bleaching or withering in the ao1-1 mutant, compared to the WT and ao1-1/GhAO1A transgenic Arabidopsis seedlings (Figure 8a). Nearly no significant phenotype difference was observed in the WT and ao1-1/GhAO1A transgenic seedlings, indicating that GhAO1A performs a positive role in delaying dark-induced senescence. In addition, under dark treatment, reduced leaf chlorophyll content was detected in all of the Arabidopsis plants, showing an obvious decrease in chlorophyll content with the increase in dark treatment time. Specifically, the leaf chlorophyll content was significantly lower in the ao1-1 mutant than that in the WT and ao1-1/GhAO1A Arabidopsis plants. Moreover, when light recovery was implemented, chlorophyll content prominently increased in all of the Arabidopsis plants, demonstrating more prompt enhancement in ao1-1/GhAO1A and WT than that in the ao1-1 mutant (Figure 8b).
Senescence-associated genes (SAGs) are key factors that induce senescence [33,34]. Altered AO expression results in leaf senescence and finally cell death [35]. The transcript levels of selected genes, namely, PHYTOCHROME INTERACTING FACTOR 3 (PIF3), SENESCENCE 1 (SEN1), WRKY DNA-BINDING PROTEIN 6 (WRKY6), NAC DOMAIN CONTAINING PROTEIN (NAP), ACCELERATED CELL DEATH 1 (ACD1), and PROGRAMMED CELL DEATH PROTEIN 5 (PDCD5), were analyzed by qRT-PCR. Figure 8c indicates that all of the detected genes exhibited higher accumulation in the ao1-1 mutant than in the WT and ao1-1/GhAO1A Arabidopsis plants under dark or light recovery conditions. In the ao1-1 mutant, except for PIF3, that showed peak expression level after 3 d of dark treatment, all of the other selected genes indicated the highest enrichment after 6 d of dark treatment. The expression levels of these SAGs in the ao1-1/GhAO1A transgenic plants were similar to that in the WT plants. In addition, we also performed an expression analysis for other reported SAGs that exhibited similar expression patterns as the genes evaluated above (Supplementary Figure S1). These results indicated that GhAO1A performs an important role in delaying dark-induced leaf senescence possibly induced by SAGs in Arabidopsis.

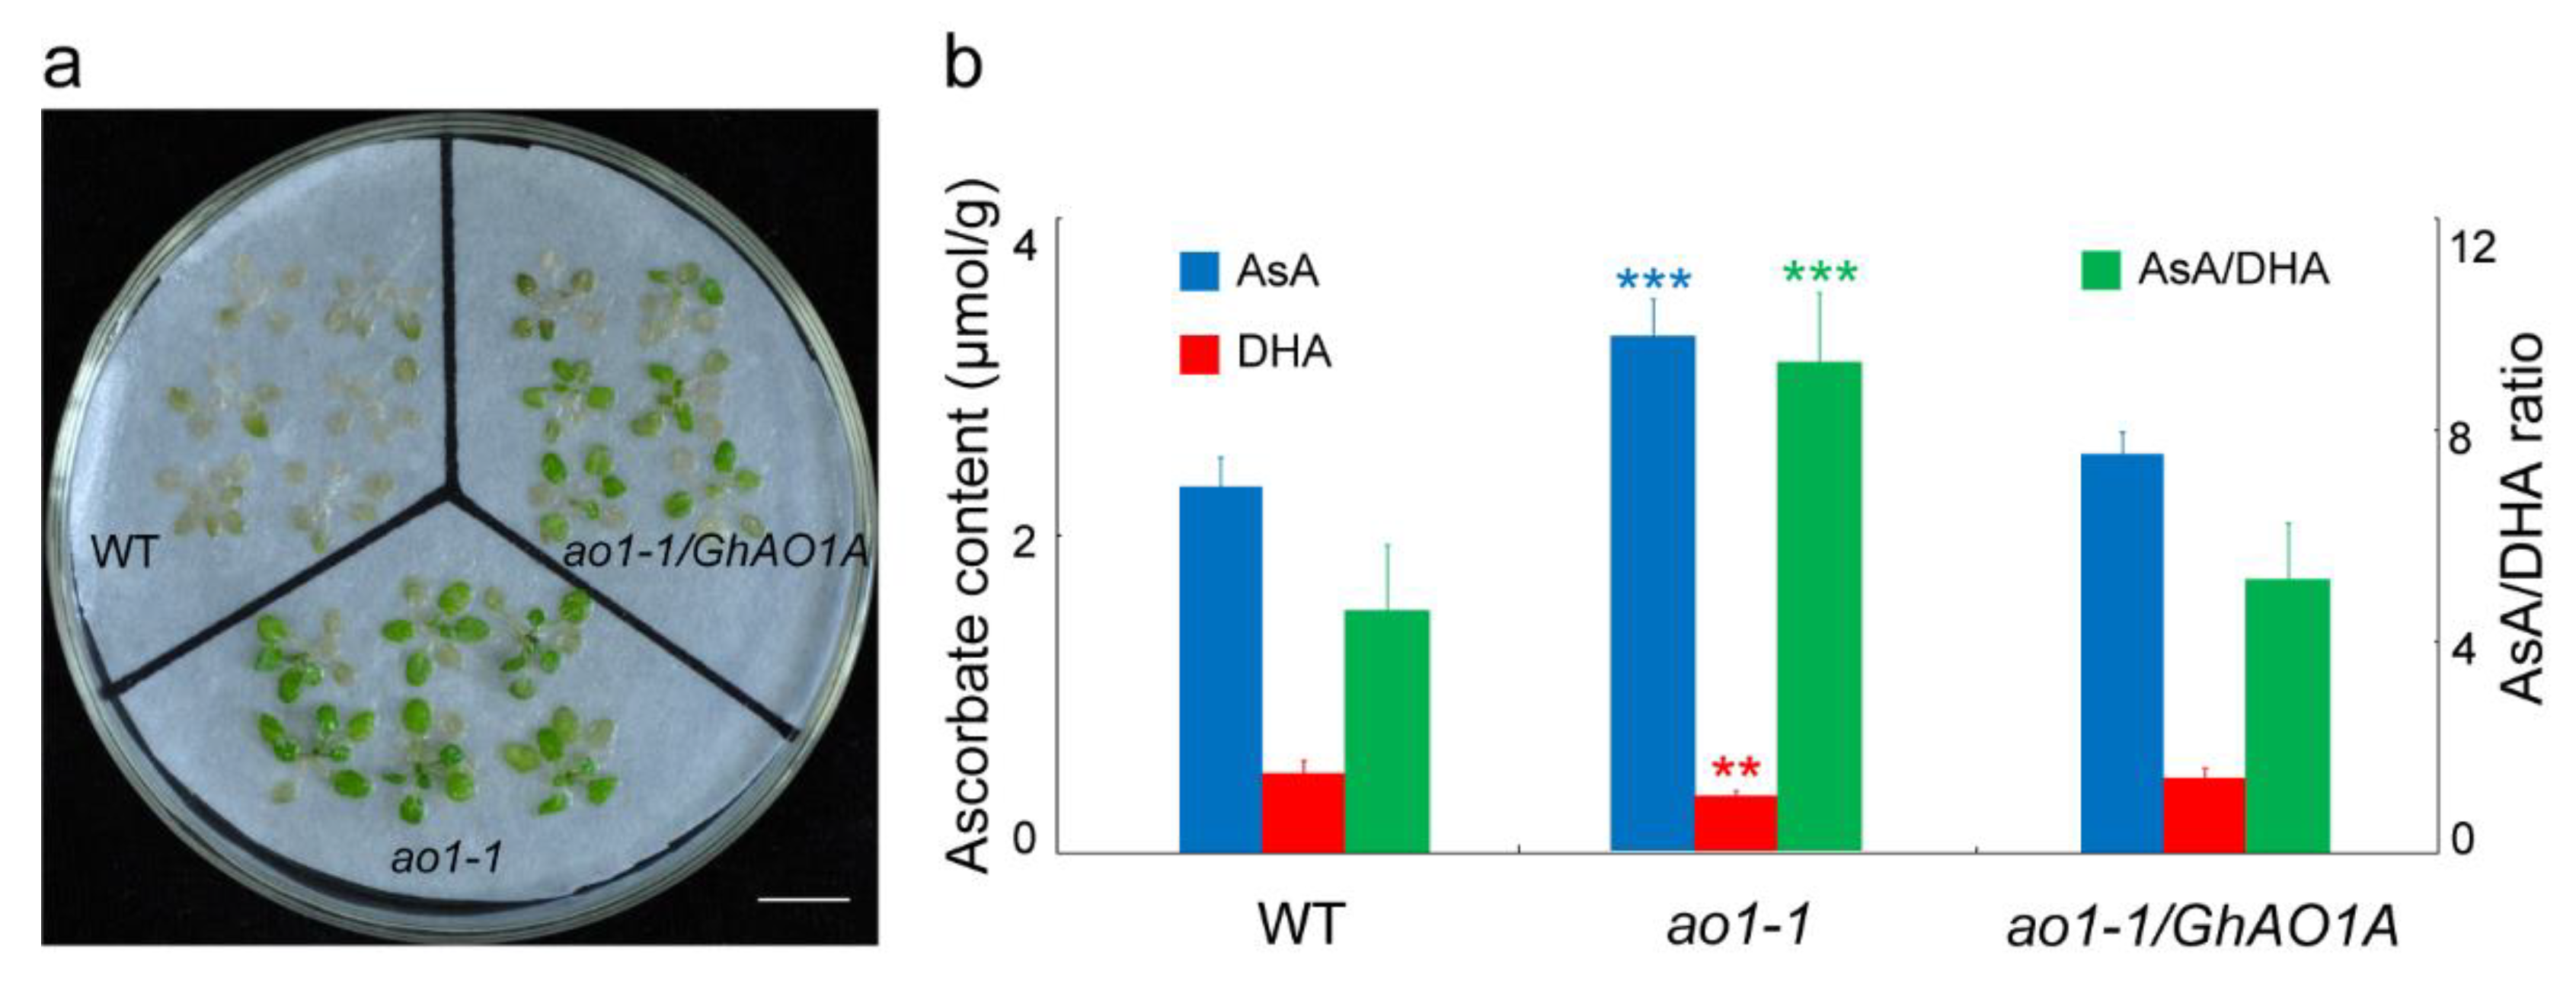
2.8. GhAO1A Increases the Sensitivity of Arabidopsis to H2O2

H2O2 is a key factor that causes leaf senescence [36], and based on our previous work reporting that AO promotes the oxidative state of tobacco cells through inducing H2O2 production [7], to further investigate GhAO1A function in response to oxidative stress, two-week-old Arabidopsis ao1-1 mutant, ao1-1/GhAO1A, and WT seedlings were incubated with 100 mM H2O2 for two days. The results showed that, after continuous H2O2 treatment, the ao1-1 mutants exhibited obvious insensitivity to H2O2 with less leaves exhibiting bleaching, whereas more green leaves in the ao1-1/GhAO1A and WT seedlings exhibited withering and bleaching (Figure 9a). Furthermore, in view of the function of AO in oxidizing ascorbate [6], the contents of AsA (reduced form) and DHA (oxidized form) were determined to explore the role of GhAO1A in controlling the redox state of cells. The results indicated that both the AsA content and the ratio of AsA/DHA significantly increased in the ao1-1 mutant (Figure 9b). These results showed that GhAO1A increases the sensitivity of Arabidopsis to H2O2, which may be caused by promoting oxidation reactions in cells.

3. Discussion

3.1. Identification and Characteristics of AO Gene Family in Gossypium hirsutum

AO is a member of the multicopper oxidase (MCO) family that catalyzes the redox reactions and plays multiple roles in many physiological processes, including cell elongation with abundant activity in rapid enlarging tissues, retarded flowering development [1,12], and response to environmental stress, through regulation of cellular redox homeostasis by oxidizing the substrate AsA to MDHA and reducing the molecular oxygen to water [3]. AO gene family members have been systematically investigated in some plants, including five members in O. sativa, three in A. thaliana, seven in G. max, four in Z. mays, and six in S. bicolor [3]. In this study, we performed a genome-wide identification of AO gene family in G. hirsutum, and a total of eight GhAOs was identified (Table 1) that were distributed across different chromosomes (Figure 1). Variations in gene family size are a common phenomenon that may be due to gene duplication, deletion, pseudogenization, and/or functional diversification [15]. AO genes in cotton and soybean display more duplication events and comprise more family members than other reported crops (Supplementary Table S1, Figure 2). Based on the incomplete assembly of the cotton genome, compared to other GhAOs, GhAO4A/D has an incomplete structure both at the DNA and mRNA levels, as demonstrated by shorter sequence lengths (Table 1, Figure 4).
Plant AOs share typical MCO domains, which endow the enzymatic activity to catalyze redox reactions. The paralogous GhAOs located on the A and D chromosomes display similar exon-intron structure and motif distribution, respectively, which are characteristics of the three pre-defined domains (MCO types 1, 2, and 3) that have been identified in plants, suggesting the possible function of AO to trigger the enzymatic reaction using motif 4 as the site for binding copper (Figure 4). Except for the known copper oxidase domains, GhAOs also exhibit some unidentified motifs (motifs 7–10), which are similar to the reported AOs in some plants [3]. A total of 41 AOs from seven plant species were extracted to construct a phylogenetic tree that consisted of three different clades [3]. The phylogenetic tree analysis indicated that GhAO1A/D and other GhAOs were clustered into groups A and B, respectively (Figure 2), indicating their potential diverse functions.

3.2. Expression Patterns of AOs Imply Their Diverse Roles in Plant Growth and Development

AO genes were reported to display regulated expressions of tissue-specific development (germination, seeding, rosette, bolting, flower, and silique) in many plants. Arabidopsis AtAO1 and AtAO2 were upregulated in all of the developmental stages with different expression patterns. G. max GmAO4 and GmAO5 indicated high accumulation during shoot growth. O. sativa AOs displayed seedling- and flowering-specific higher expression levels [3]. In the current study, the expression patterns of GhAOs in different cotton tissues varied, with significant accumulations of GhAO1A/1D in fibers, roots, stems, petals, and anthers (Figure 5), suggesting that GhAOs may exhibit important function in plant growth, especially in flowering development.
Yamamoto et al. demonstrated that the antisense expression of AO in tobacco and T-DNA-inserted Arabidopsis AO mutant resulted in the late-flowering phenotype [12]. Interestingly, the late-flowering phenotype reverted to normal after transforming cotton GhAO1A into the Arabidopsis ao1-1 mutant (Figure 7), indicating that cotton GhAO1A is a functional homolog and plays a crucial role in maintaining regular flowering development. These results showed that GhAO1A provides a regulatory mechanism for the increased expression of floral-associated genes and decreased expression of the floral-suppressed gene FLC in WT and transgenic ao1-1/GhAO1A Arabidopsis plants (Figure 7), with the similar result of suppressed expression of the FLC gene promoting flowering [37].

3.3. Functional Role of AO Genes in Response to Light Regulation

AO expression is regulated by light, with significant upregulation of AO mRNA by light in tobacco and Cucurbita pepo [10,38]. There were six kinds of light-responsive elements in the promoter regions of all of the GhAOs (Supplementary Table S3), whereas only the GhAO1A/1D promoters included all these six kinds of light-responsive elements and the other GhAOs contained fewer and incomplete light-responsive elements (Figure 6a,b), coupled with the most fastest accumulation of GhAO1A/1D transcripts under light recovery from dark (Figure 6c), suggesting the close link between the number of light-responsive elements and the GhAO expression levels regulated by light. Additionally, it has been reported that AO performs an important function in suppressing leaf senescence induced by dark [22]. The result presented here shows that, in transgenic ao1-1 mutant plants overexpressing GhAO1A, the dark-induced leaf senescence generated by the deletion of AtAO1 in the ao1-1 Arabidopsis mutant was significantly delayed. Meanwhile, inhibited chlorophyll breakdown and suppressed expression of SAGs were also observed in ao1-1/GhAO1A transgenic Arabidopsis lines (Figure 8). This is consistent with the result that altered AO expression leads to chlorophyll degradation and cell death [35]. During the leaf senescence process, chlorophyll degradation, chloroplast decomposition (including decrease in starch granules and loosening of thylakoid membrane), and downregulation of photosynthesis-related genes were investigated [39]. Our previous study showed that AO expression was regulated by auxin [7,40]. Plant hormones, such as auxin and ethylene that function as a retardant and a reinforcer, respectively, and their crosstalk are the key factors that influence leaf senescence [34,41,42,43]. Thus, it is necessary to perform further investigations on the function of AO in leaf senescence in the presence of hormones.
Numerous genes have been reported to be differentially expressed during the leaf senescence process [44], and many SAGs have been verified to be involved in leaf senescence [33,34,45,46,47,48,49]. The detected SAGs of PIFs (PIF3, PIF34, and PIF35), SENs (SEN1 and SEN4), transcription factors (TFs; WRKY6, NAC2, and NAP), and cell death-related genes (PDCD5 and ACD1), showed significant abundant accumulation in the Arabidopsis ao1-1 mutant (Figure 8, Supplementary Figure S1), indicating that the function of AO is closely associated with the expression of these genes. In addition, the TFs of NAC and WRKY play important functions in chlorophyll degradation and leaf senescence by binding to cis-elements to regulate target gene expression [50]. Many TF-binding sites exist in the promoter region of GhAOs (Figure 6, Supplementary Table S3), providing potential regulation sites for the interaction between GhAO and TFs in the process of leaf senescence. Moreover, it has been proven that besides NAC and WRKY, other TFs, including MYB and AP2-EREBP are important factors that regulate leaf senescence by participating in hormone signaling pathways [15,49,51,52,53].

3.4. Suppressed Expression of AO Increases Arabidopsis Tolerance to H2O2

Ascorbate metabolism performs an important role in the detoxification of excessive ROS in cells, thus controlling the cellular redox balance, which regulates plant growth and development and cellular response to environmental stresses [54,55]. Light-induced ROS production alters the redox balance of cells in photosynthetic tissues and thus affects plant growth and development [56]. Our previous studies have shown that the ascorbate metabolism enzyme APX plays a significant role in fiber cell elongation by regulating ROS homeostasis, and cotton AO promotes tobacco cell growth through inducing apoplast oxidation [7,25]. As the enzyme oxidizing AsA to generate DHA, AO is a negative factor in ascorbate metabolism to eliminate ROS that is commonly produced under environmental stress [6]. In the study, the ao1-1 mutant exhibited a more resistant phenotype to H2O2 and indicated a more reduced state in cells that was caused by a higher AsA/DHA ratio due to AO deletion, compared to WT Arabidopsis and the ao1-1/GhAO1A transgenic lines overexpressing cotton GhAO1A in the ao1-1 mutant (Figure 9). This is consistent with the report that overexpression or suppression of AO leads to increased sensitivity or resistance to oxidative stress in tobacco and Arabidopsis [11,12]. There is a close correlation between suppressed AO activity and decreased H2O2 level [12], suggesting the possibility of interaction between AO function and ROS. Elucidating the regulatory mechanism of AO, including the crosstalk with ROS and TFs, is warranted.

4. Materials and Methods

4.1. Plant Materials

A. thaliana (Columbia ecotype) and ao1-1 mutant (SALK_108854, obtained from the Arabidopsis Biological Resource Center, Columbus, Ohio, USA) [57] were used in this study and cultured using normal conditions of temperature of 20 ± 2 °C and a photoperiod of 16 h light/8 h dark.
Cotton (G. hirsutum L. cv. Xuzhou 142) plants were cultivated in the experimental field of Shihezi University in Shihezi City, China. Different tissues, including roots, stems, leaves, petals, and anthers, were harvested from approximately two-month-old cotton plants. By marking the flowering bolls (artificially defined as 0 DPA), different developmental fiber tissues were collected and stripped from the ovules at 0, 5, 10, 15, 20, 25, and 30 DPA. All of the materials were flash-frozen in liquid nitrogen and stored at −80 °C until use.
Cotton seedlings were grown in a growth chamber under greenhouse conditions of 28 °C under a 16 h light/8 h dark cycle. Six-week-old cotton seedlings were subjected to different light conditions and abiotic stresses, including exposure to 16 h of dark treatment and then to light recovery. All of the treated materials of cotton seedlings and leaves were collected at various time points as previously mentioned, flash-frozen in liquid nitrogen, and stored at −80 °C until analysis.

4.2. Identification of AO Gene Family in G. hirsutum

The genomic data of G. hirsutum were downloaded from Joint Genome Institute (JGI) (https://phytozome.jgi.doe.gov). To identify the AO genes in G. hirsutum, previously reported AOs from A. thaliana, O. sativa, G. max, Z. mays, and S. bicolor were used as queries to perform a local BLAST (blastp, e-value: 1×10⁻³⁰, identify: 50%, score: 400) search against the G. hirsutum protein database [3]. Candidate GhAO sequences were analyzed to confirm the presence of the three domains of the cupredoxin family using InterProScan (http://www.ebi.ac.uk/interpro/search/sequence-search) [58]. The AO sequences of T. cacao were obtained from JGI (http://phytozome.jgi.doe.gov). The molecular weight (MW) and isoelectric point (pI) were calculated by online tools at the ExPASy website (http://web.expasy.org/compute_pi). Subcellular localization was analyzed using the Softberry server (http://linux1.softberry.com). Functional motifs and conserved sites of GhAOs were obtained using the InterProScan software.

4.3. Chromosomal Distribution and Duplication Analyses of the GhAO Genes

The MapInspect software was used to visualize the distribution of GhAOs on the G. hirsutum chromosomes [59]. Duplication events of AO genes were determined by multiple sequence alignment. Paralogous GhAO gene pairs were identified only when their nucleotide identities were >90%. The Ka (nonsynonymous substitution rate) and Ks (synonymous substitution rate) values of paralogous genes were estimated by the DnaSP 5.0 software [60], with the Ka/Ks analysis method described elsewhere [61]. The Tajima relative rate test was used to estimate the evolutionary rate. The Circos software was used for collinear analysis [62].

4.4. Analyses of Phylogenetic Relationship, Gene Structure, and Motif Distribution

The full-length AO protein sequences of G. hirsutum, G. barbadense, T. cacao, A. thaliana, O. sativa, G. max, Z. mays, and S. bicolor were used to analyze their phylogenetic relationship. These amino acid sequences were aligned using ClustalW [63], followed by phylogenetic tree construction using MEGA5.0 [64] through the NJ method with 1000 bootstrap replicates. The exon-intron structure of the GhAO genes was generated using the gene structure display server (GSDS) program [65] by aligning the coding sequences (CDS) with the corresponding genomic sequences. The Multiple Em for Motif Elicitation (MEME) [66] program was used for identification of conserved motifs in AO proteins of G. hirsutum.

4.5. RNA Extraction, Expression Detection, and Promoter Analysis of the GhAO Genes

Total RNA was extracted from different tissues (fibers at different development stages, roots, stems, leaves, petals, and anthers) using the RNAprep Pure Plant Kit (Tiangen, Beijing, China). First-strand cDNA was synthesized from 1 μg of total RNA using the TIANScript RT Kit (Tiangen, Beijing, China), and then used as a template for qRT-PCR analysis using gene-specific primers (Supplementary Table S4), with the Gossypium hirsutum ubiquitin 7 (GhUBQ7) gene as the internal control [7,67].
qRT-PCR was conducted using SYBR Premix Ex Taq (Tli RNaseH Plus) (Takara, Kusatsu, Japan) with three replicates on the LightCycler 480 II System (Roche, Rotkreuz, Switzerland). The heatmap was generated with the software MultiExperiment Viewer (MeV) as described elsewhere [68] based on the qRT-PCR data. A 1.5 kb region located upstream of the translational start site of each GhAO gene was submitted to the online PlantCARE software [69] to predict putative cis-elements. The RNA-seq data were obtained from the public released data of the BioProject (PRJNA248163) database of NCBI at the website of https://www.ncbi.nlm.nih.gov/bioproject/. The Fragments Per Kilobase of exon model per Million mapped reads (FPKM) value was calculated by Cufflinks (version 2.1.1, University of Washington, Seattle, WA, USA) [70].

4.6. Vector Construction and Arabidopsis Transformation

The amplified full-length CDS of GhAO1A containing double enzyme sites of BamH I and Sal I was inserted into the vector pCAMBIA2300 to generate the overexpression vector 35S::GhAO1A that was then transformed into ao1-1 mutant Arabidopsis with Agrobacterium-mediated (strain GV3101) floral dip method [71], thereby producing the transgenic Arabidopsis lines of ao1-1/GhAO1A. The obtained homozygous T3 generation transgenic Arabidopsis lines generated by screening and selfing were used in the subsequent analyses.

4.7. Functional Analysis of GhAO1A in Arabidopsis

Two-week-old Arabidopsis seedlings (ao1-1, ao1-1/GhAO1A, and WT) were incubated with 100 mM H2O2 for two days under normal growth conditions (ddH2O as mock control) [12]. AsA and DHA levels were determined as previously described [7]. A dark-induced senescence assay was performed where two-week-old Arabidopsis seedlings were subjected to continuous dark treatment for 3 d and 6 d and then light recovery for 16 h. Chlorophyll content determination in Arabidopsis seedlings were conducted as described elsewhere [31,72]. The expression levels of flowering-related genes such as GI, FVE, LFY, CO, FT, AP1, SOC1, and FLC; and SAGs, including PIFs (PIF3, PIF4, and PIF5), SENs (SEN1 and SEN4), SAG20, TFs (WRKY6, NAP, and NAC2), cell-programmed death genes (ACD1 and PDCD5), and PHENOPHYTIN PHEOPHORBIDE HYDROLASE (PPH), were determined by qRT-PCR using Arabidopsis thaliana 18S ribosomal RNA (At18SrRNA) and Arabidopsis thaliana Actin 2 (AtACTIN2) genes as reference genes to normalize the qRT-PCR data, with the gene-specific primers listed in Supplementary Table S4. The analysis of statistical difference test was performed according to one-way ANOVA.

5. Conclusions

We identified eight AO gene family members in G. hirsutum through a genome-wide investigation and characterized their phylogenetic relationship, evolution and synteny, exon-intron structure, and conserved motif distribution. Expression analyses of GhAO genes suggested their potential diverse functions in plant growth and development, especially in flower development and light responsiveness. GhAO1A was significantly accumulated after 1 h of light recovery from continuous dark treatment, and recovered the late flowering phenotype of Arabidopsis ao1-1 mutant to the normal phenotype of WT. Compared to the ao1-1 mutant, the ao1-1/GhAO1A transgenic Arabidopsis lines generated by ectopic overexpression of GhAO1A in the Arabidopsis ao1-1 mutant exhibited delayed dark-induced leaf senescence and increased sensitivity to H2O2 under normal conditions, with cells showing higher levels of oxidation, which might be caused by a decrease in both AsA content and AsA/DHA ratio. Our results provide a comprehensive analysis of the AO gene family in G. hirsutum and suggest a potential regulatory mechanism in which GhAO1A delays dark-induced leaf senescence by controlling the ROS-mediated cellular redox balance.

Supplementary Materials

Supplementary materials can be found at https://www.mdpi.com/1422-0067/20/24/6167/s1, Figure S1: Analysis of expression level of selected senescence-associated genes in Arabidopsis. qRT-PCR analysis was performed to detect the expression level of the senescence-associated genes in leaves of two-week-old Arabidopsis plants of ao1-1 mutant, ao1-1/GhAO1A, and WT. Results were normalized using AtACTIN2 gene as the internal control. qRT-PCR data of control check (CK) were artificially set to 1 and used as references for statistical difference analysis, Asterisks indicate the significant differences according to one-way ANOVA, * p < 0.05; ** p < 0.01; *** p < 0.001, Table S1: List of AO information for database search and evolutionary analysis, Table S2: The Ka/Ks ratios for duplicate AO genes in G. hirsutum, Table S3: Putative cis-elements in the promoter regions of GhAO genes, Table S4: Primers used in this work.

Author Contributions

Conceptualization, H.L. and X.J.; methodology, Z.P., L.C., and F.W.; software, Z.P., L.C., and W.S.; validation, Z.P., L.C., and W.S.; formal analysis, A.C. and S.X.; investigation, Z.P., L.C., and F.W.; resources, H.L.; data curation, Z.P., L.C., and X.C.; writing—original draft preparation, Z.P.; writing—review and editing, H.L. and X.J.; visualization, Z.P., L.C., and W.S.; supervision, H.L.; project administration, H.L.; funding acquisition, H.L.

Funding

This research was funded by the National Natural Science Foundation of China, grant numbers 31660408 and 31960413; and the Science and Technology Project of Bingtuan, grant numbers 2016AC017 and 2018AB012.

Conflicts of Interest

The authors declare no conflict of interest.

Abbreviations

aaAmino acid
ACD1Accelerated cell death 1
AOAscorbate oxidase
AP1APETALA 1
AP2-EREBPAPETALA 2/ethylene-responsive element binding protein
APXAscorbate peroxidase
AsAAscorbic acid
bpBase pair
CDSCoding sequence
CKControl check
COCONSTANS
DHADehydroascorbate
DPADays post anthesis
FLCFLOWERING LOCUS C
FPKMFragments Per Kilobase of exon model per Million mapped reads
FTFLOWERING LOCUS T
FVEFLOWERING LOCUS VE
GIGIGANTEA
GSDSGene Structure Display Server
KaNonsynonymous substitution rate
KsSynonymous substitution rate
LFYLEAFY
MCOMulticopper oxidase
MDHAMonodehydroascorbate
MEMEMultiple Em for Motif Elicitation
MeVMultiExperiment Viewer
MWMolecular weight
NAC2NAC DOMAIN CONTAINING PROTEIN 2
NAPNAC DOMAIN CONTAINING PROTEIN
NJNeighbor-joining
ORFOpen reading frame
PCDProgrammed cell death
PDCD5PROGRAMMED CELL DEATH PROTEIN 5
PPHPHENOPHYTIN PHEOPHORBIDE HYDROLASE
pIIsoelectric point
PIFPHYTOCHROME INTERACTING FACTOR
qRT-PCRQuantitative real-time polymerase chain reaction
rRNARibosomal RNA
redoxReduction/oxidation
RT-PCRReverse transcription polymerase chain reaction
ROSReactive oxygen species
SAGSenescence-associated gene
SENSENESCENCE
SOC1SUPPRESSOR OF OVEREXPRESSION OF CONSTANS 1
TFTranscription factor
WRKY6WRKY DNA-BINDING PROTEIN 6
WTWild-type

References

  1. Hoegger, P.J.; Kilaru, S.; James, T.Y.; Thacker, J.R.; Kües, U. Phylogenetic comparison and classification of laccase and related multicopper oxidase protein sequences. FEBS J. 2006, 273, 2308–2326. [Google Scholar] [CrossRef] [PubMed]
  2. De Tullio, M.C.; Guether, M.; Balestrini, R. Ascorbate oxidase is the potential conductor of a symphony of signaling pathways. Plant Signal Behav. 2013, 8, e23213. [Google Scholar] [CrossRef] [PubMed] [Green Version]
  3. Batth, R.; Singh, K.; Kumari, S.; Mustafiz, A. Transcript profiling reveals the presence of abiotic stress and developmental stage specific ascorbate oxidase genes in plants. Front. Plant Sci. 2017, 8, 98. [Google Scholar] [CrossRef] [PubMed]
  4. Messerschmidt, A.; Rossi, A.; Ladenstein, R.; Huber, R.; Bolognesi, M.; Gatti, G.; Marchesini, A.; Petruzzelli, R.; Finazzi-Agró, A. X-ray crystal structure of the blue oxidase ascorbate oxidase from zucchini: Analysis of the polypeptide fold and a model of the copper sites and ligands. J. Mol. Biol. 1989, 206, 515–527. [Google Scholar] [CrossRef]
  5. Takahama, U.; Oniki, T. The association of ascorbate and ascorbate oxidase in the appoplast with IAA-enhanced elongation of epicotyls from Vigna angularis. Plant Cell Physiol. 1994, 35, 257–266. [Google Scholar]
  6. Smirnoff, N. Ascorbic acid: Metabolism and functions of a multi-facetted molecule. Curr. Opin. Plant Biol. 2000, 3, 229–235. [Google Scholar] [CrossRef]
  7. Li, R.; Xin, S.; Tao, C.C.; Jin, X.; Li, H.B. Cotton ascorbate oxidase promotes cell growth in cultured tobacco bright yellow-2 cells through generation of apoplast oxidation. Int. J. Mol. Sci. 2017, 18, 1346. [Google Scholar] [CrossRef] [Green Version]
  8. Farver, O.; Wherland, S.; Pecht, I. Intramolecular electron transfer in ascorbate oxidase is enhanced in the presence of oxygen. J. Biol. Chem. 1994, 269, 22933–22936. [Google Scholar]
  9. Esaka, M.; Fujisawa, K.; Goto, M.; Kisu, Y. Regulation of ascorbate oxidase expression in pumpkin by auxin and copper. Plant Physiol. 1992, 100, 231–237. [Google Scholar] [CrossRef] [Green Version]
  10. Pignocchi, C.; Fletcher, J.M.; Wilkinson, J.E.; Barnes, J.D.; Foyer, C.H. The function of ascorbate oxidase in Tobacco. Plant Physiol. 2003, 132, 1631–1641. [Google Scholar] [CrossRef] [Green Version]
  11. Sanmartin, M.; Drogoudi, P.A.; Lyons, T.; Pateraki, I.; Barnes, J.; Kanellis, A.K. Over-expression of ascorbate oxidase in the apoplast of transgenic tobacco results in altered ascorbate and glutathione redox states and increased sensitivity to ozone. Planta 2003, 216, 918–928. [Google Scholar] [PubMed]
  12. Yamamoto, A.; Bhuiyan, M.N.; Waditee, R.; Tanaka, Y.; Esaka, M.; Oba, K.; Jagendorf, A.T.; Takabe, T. Suppressed expression of the apoplastic ascorbate oxidase gene increases salt tolerance in tobacco and Arabidopsis plants. J. Exp. Bot. 2005, 56, 1785–1796. [Google Scholar] [CrossRef] [PubMed] [Green Version]
  13. Sanmartin, M.; Pateraki, I.; Chatzopoulou, F.; Kanellis, A.K. Differential expression of the ascorbate oxidase multigene family during fruit development and in response to stress. Planta 2007, 225, 873–885. [Google Scholar] [CrossRef] [PubMed]
  14. Kato, N.; Esaka, M. cDNA cloning and gene expression of ascorbate oxidase in tobacco. Plant Mol. Biol. 1996, 30, 833–837. [Google Scholar] [CrossRef]
  15. Zhang, Y.Y.; Li, H.X.; Shu, W.B.; Zhang, C.J.; Zhang, W.; Ye, Z.B. Suppressed expression of ascorbate oxidase gene promotes ascorbic acid accumulation in tomato fruit. Plant Mol. Biol. Rep. 2011, 29, 638–645. [Google Scholar] [CrossRef]
  16. Garchery, C.; Gest, N.; Do, P.T.; Alhagdow, M.; Baldet, P.; Menard, G.; Rothan, C.; Massot, C.; Gautier, H.; Aarrouf, J.; et al. A diminution in ascorbate oxidase activity affects carbon allocation and improves yield in tomato under water deficit. Plant Cell Environ. 2013, 36, 159–175. [Google Scholar] [CrossRef]
  17. De Pinto, M.C.; Francis, D.; De Gara, L. The redox state of the ascorbate-dehydroascorbate pair as a specifc sensor of cell division in tobacco BY-2 cells. Protoplasma 1999, 209, 90–97. [Google Scholar] [CrossRef]
  18. Potters, G.; Horemans, N.; Caubergs, R.J.; Asard, H. Ascorbate and dehydroascorbate influence cell cycle progression in a tobacco cell suspension. Plant Physiol. 2000, 124, 17–20. [Google Scholar] [CrossRef] [Green Version]
  19. Potters, G.; Horemans, N.; Bellone, S.; Caubergs, R.J.; Trost, P.; Guisez, Y.; Asard, H. Dehydroascorbate influences the plant cell cycle through a glutathione independent reduction mechanism. Plant Physiol. 2004, 134, 1479–1487. [Google Scholar] [CrossRef] [Green Version]
  20. Balestrini, R.; Ott, T.; Güther, M.; Bonfante, P.; Udvardi, M.K.; De Tullio, M.C. Ascorbate oxidase: The unexpected involvement of a ‘wasteful enzyme’ in the symbioses with nitrogen-fixing bacteria and arbuscular mycorrhizal fungi. Plant Physiol. Biochem. 2012, 59, 71–79. [Google Scholar] [CrossRef]
  21. Shalata, A.; Neumann, P.M. Exogenous ascorbic acid (vitamin C) increases resistance to salt stress and reduces lipid peroxidation. J. Exp. Bot. 2001, 52, 2207–2211. [Google Scholar] [CrossRef] [PubMed]
  22. Fotopoulos, V.; Kanellis, A.K. Altered apoplastic ascorbate redox state in tobacco plants via ascorbate oxidase overexpression results in delayed dark-induced senescence in detached leaves. Plant Physiol. Biochem. 2013, 73, 154–160. [Google Scholar] [CrossRef] [PubMed]
  23. Apel, K.; Hirt, H. Reactive oxygen species: Metabolism, oxidative stress, and signal transduction. Annu. Rev. Plant Biol. 2004, 55, 373–399. [Google Scholar] [CrossRef] [PubMed] [Green Version]
  24. Mittler, R.; Vanderauwera, S.; Gollery, M.; Van Breusegem, F. Reactive oxygen gene network of plants. Trends Plant Sci. 2004, 9, 490–498. [Google Scholar] [CrossRef]
  25. Li, H.B.; Qin, Y.M.; Pang, Y.; Song, W.Q.; Mei, W.Q.; Zhu, Y.X. A cotton ascorbate peroxidase is involved in hydrogen peroxide homeostasis during fibre cell development. New Phytol. 2007, 175, 462–471. [Google Scholar] [CrossRef]
  26. Raven, E.L. Peroxidase-catalyzed oxidation of ascorbate. Structural, spectroscopic and mechanistic correlations in ascorbate peroxidase. Subcell. Biochem. 2000, 35, 317–349. [Google Scholar]
  27. Mosery, O.; Kanellis, A.K. Ascorbate oxidase of Cucumis melo L. var. reticulatus: Purification, characterization and antibody production. J. Exp. Bot. 1994, 45, 717–724. [Google Scholar] [CrossRef] [Green Version]
  28. Ohkawa, J.; Ohya, T.; Ito, T.; NoJzawa, H.; Nishi, Y.; Okada, N.; Yoshida, K.; Takano, M.; Shinmyo, A. Structure of the genomic DNA encoding cucumber ascorbate oxidase and its expression in transgenic plants. Plant Cell Rep. 1994, 13, 481–488. [Google Scholar] [CrossRef]
  29. Kato, N.; Esaka, M. Changes in ascorbate oxidase gene expression and ascorbate levels in cell division and cell elongation in tobacco cells. Plant Physiol. 2010, 105, 321–329. [Google Scholar] [CrossRef]
  30. Kato, N.; Esaka, M. Expansion of transgenic tobacco protoplasts expressing pumpkin ascorbate oxidase is more rapid than that of wild-type protoplasts. Planta 2000, 210, 1018–1022. [Google Scholar] [CrossRef]
  31. Jeon, J.; Kim, J. FVE, an Arabidopsis homologue of the retinoblastoma-associated protein that regulates flowering time and cold response, binds to chromatin as a large multiprotein complex. Mol. Cells 2011, 32, 227–234. [Google Scholar] [CrossRef] [Green Version]
  32. Cho, L.H.; Yoon, J.; An, G. The control of flowering time by environmental factors. Plant J. 2017, 90, 708–719. [Google Scholar] [CrossRef]
  33. Song, Y.; Yang, C.W.; Gao, S.; Zhang, W.; Li, L.; Kuai, B.K. Age-triggered and dark-induced leaf Senescence require the bHLH transcription factors PIF3, 4, and 5. Mol. Plant 2014, 7, 1776–1787. [Google Scholar] [CrossRef] [Green Version]
  34. Niu, Y.H.; Guo, F.Q. Nitric oxide regulates dark-induced leaf senescence through EIN2 in Arabidopsis. J. Integr. Plant Biol. 2012, 54, 516–525. [Google Scholar] [CrossRef]
  35. Guo, Y. Towards systems biological understanding of leaf senescence. Plant Mol. Biol. 2013, 82, 519–528. [Google Scholar] [CrossRef]
  36. Guo, P.; Li, Z.; Huang, P.; Li, B.; Fang, S.; Chu, J.; Guo, H. A tripartite amplification loop involving the transcription factor WRKY75, salicylic acid, and reactive oxygen species accelerates leaf senescence. Plant Cell 2017, 29, 2854–2870. [Google Scholar] [CrossRef]
  37. Michaels, S.D.; Amasino, R.M. FLOWERING LOCUS C encodes a novel MADS domain protein that acts as a repressor of flowering. Plant Cell. 1999, 11, 949–956. [Google Scholar] [CrossRef] [Green Version]
  38. De Tullio, M.C.; Ciraci, S.; Liso, S.; Arrigoni, O. Ascorbic acid oxidase is dynamically regulated by light and oxygen. A tool for oxygen management in plants. J. Plant Physiol. 2007, 164, 39–46. [Google Scholar] [CrossRef]
  39. Teng, K.; Chang, Z.; Li, X.; Sun, X.; Liang, X.; Xu, L.; Chao, Y.; Han, L. Functional and RNA-Sequencing Analysis Revealed Expression of a Novel Stay-Green Gene from Zoysia japonica (ZjSGR) Caused Chlorophyll Degradation and Accelerated Senescence in Arabidopsis. Front. Plant Sci. 2016, 7, 1894. [Google Scholar] [CrossRef] [Green Version]
  40. Xin, S.; Tao, C.C.; Li, H.B. Cloning and Functional Analysis of the Promoter of an Ascorbate Oxidase Gene from Gossypium hirsutum. PLoS ONE 2016, 11, e0161695. [Google Scholar] [CrossRef] [Green Version]
  41. Jibran, R.; Hunter, D.A.; Dijkwel, P.P. Hormonal regulation of leaf senescence through integration of developmental and stress signals. Plant Mol. Biol. 2013, 82, 547–561. [Google Scholar] [CrossRef]
  42. Kim, J.I.; Murphy, A.S.; Baek, D.; Lee, S.W.; Yun, D.J.; Bressan, R.A.; Narasimhan, M.L. YUCCA6 over-expression demonstrates auxin function in delaying leaf senescence in Arabidopsis thaliana. J. Exp. Bot. 2011, 62, 3981–3992. [Google Scholar] [CrossRef]
  43. Mueller-Roeber, B.; Balazadeh, S. Auxin and its role in plant senescence. J. Plant Growth Regul. 2014, 33, 21–33. [Google Scholar] [CrossRef]
  44. Schippers, J.H.; Schmidt, R.; Wagstaff, C.; Jing, H. Living to Die and Dying to Live: The Survival Strategy behind Leaf Senescence. Plant Physiol. 2015, 169, 914–930. [Google Scholar] [CrossRef] [PubMed] [Green Version]
  45. Zhang, X.; Ju, H.W.; Chung, M.S.; Huang, P.; Ahn, S.J.; Kim, C.S. The R-R-type MYB-like transcription factor, AtMYBL, is involved in promoting leaf senescence and modulates an abiotic stress response in Arabidopsis. Plant Cell Physiol. 2011, 52, 138–148. [Google Scholar] [CrossRef] [Green Version]
  46. Sakuraba, Y.; Jeong, J.; Kang, M.Y.; Kim, J.; Paek, N.C.; Choi, G. Phytochrome-interacting transcription factors PIF4 and PIF5 induce leaf senescence in Arabidopsis. Nat. Commun. 2014, 5, 4636. [Google Scholar] [CrossRef] [Green Version]
  47. Zhang, Y.; Liu, Z.; Chen, Y.; He, J.X.; Bi, Y. Phytochrome-interacting factor 5 (PIF5) positively regulates dark-induced senescence and chlorophyll degradation in Arabidopsis. Plant Sci. 2015, 237, 57–68. [Google Scholar] [CrossRef]
  48. Falcone Ferreyra, M.L.; Casati, P. AtPDCD5 plays a role during dark-senescence in Arabidopsis. Plant Signal. Behav. 2016, 11, e1176820. [Google Scholar] [CrossRef]
  49. Li, L.H.; Xing, Y.F.; Chang, D.; Fang, S.S.; Cui, B.Y.; Li, Q.; Wang, X.J.; Guo, S.; Yang, X.; Men, S.Z.; et al. CaM/BAG5/Hsc70 signaling complex dynamically regulates leaf senescence. Sci. Rep. 2016, 6, 31889. [Google Scholar] [CrossRef]
  50. Balazadeh, S.; Riaño-Pachón, D.M.; Mueller-Roeber, B. Transcription factors regulating leaf senescence in Arabidopsis thaliana. Plant Biol. 2008, 1, 63–75. [Google Scholar] [CrossRef]
  51. Mizoi, J.; Shinozaki, K.; Yamaguchi-Shinozaki, K. AP2/ERF family transcription factors in plant abiotic stress responses. Biochim. Biophys. Acta 2012, 1819, 86–96. [Google Scholar] [CrossRef] [PubMed]
  52. Koyama, T. The roles of ethylene and transcription factors in the regulation of onset of leaf senescence. Front. Plant Sci. 2014, 5, 650. [Google Scholar] [CrossRef] [PubMed]
  53. Takasaki, H.; Maruyama, K.; Takahashi, F.; Fujita, M.; Yoshida, T.; Nakashima, K.; Myouga, F.; Toyooka, K.; Yamaguchi-Shinozaki, K.; Shinozaki, K. SNAC-As, stress-responsive NAC transcription factors, mediate ABA-inducible leaf senescence. Plant J. 2015, 84, 1114–1123. [Google Scholar] [CrossRef] [PubMed] [Green Version]
  54. Khanna-Chopra, R. Leaf senescence and abiotic stresses share reactive oxygen species-mediated chloroplast degradation. Protoplasma 2012, 249, 469–481. [Google Scholar] [CrossRef]
  55. Lai, A.G.; Doherty, C.J.; Mueller-Roeber, B.; Kay, S.A.; Schippers, J.H.; Dijkwel, P.P. Circadian clock-associated 1 regulates ROS homeostasis and oxidative stress responses. Proc. Natl. Acad. Sci. USA 2012, 109, 17129–17134. [Google Scholar] [CrossRef] [Green Version]
  56. Foyer, C.H.; Shigeoka, S. Understanding oxidative stress and antioxidant functions to enhance photosynthesis. Plant Physiol. 2011, 155, 93–100. [Google Scholar] [CrossRef] [Green Version]
  57. Alonso, J.M.; Stepanova, A.N.; Leisse, T.J.; Kim, C.J.; Chen, H.; Shinn, P.; Stevenson, D.K.; Zimmerman, J.; Barajas, P.; Cheuk, R.; et al. Genome-wide insertional mutagenesis of Arabidopsis thaliana. Science 2003, 301, 653–657. [Google Scholar] [CrossRef] [Green Version]
  58. Jones, P.; Binns, D.; Chang, H.Y.; Fraser, M.; Li, W.; McAnulla, C.; McWilliam, H.; Maslen, J.; Mitchell, A.; Nuka, G.; et al. InterProScan 5: Genome-scale protein function classification. Bioinformatics 2014, 30, 1236–1240. [Google Scholar] [CrossRef] [Green Version]
  59. Jin, X.; Zhu, L.P.; Yao, Q.; Meng, X.R.; Ding, G.H.; Wang, D.; Xie, Q.L.; Tong, Z.; Tao, C.C.; Yu, L.; et al. Expression profiling of mitogen-activated protein kinase genes reveals their evolutionary and functional diversity in different rubber tree (Hevea brasiliensis) cultivars. Genes 2017, 8, 261. [Google Scholar] [CrossRef] [Green Version]
  60. Librado, P.; Rozas, J. DnaSP v5: A software for comprehensive analysis of DNA polymorphism data. Bioinformatics 2009, 25, 1451–1452. [Google Scholar] [CrossRef] [Green Version]
  61. Ma, W.; Zhao, T.; Li, J.; Liu, B.L.; Fang, L.; Hu, Y.; Zhang, T.Z. Identification and characterization of the GhHsp20 gene family in Gossypium hirsutum. Sci. Rep. 2016, 6, 32517. [Google Scholar] [CrossRef] [PubMed] [Green Version]
  62. Krzywinski, M.; Schein, J.; Birol, I.; Connors, J.; Gascoyne, R.; Horsman, D.; Jones, S.J.; Marra, M.A. Circos: An information aesthetic for comparative genomics. Genome Res. 2009, 19, 1639–1645. [Google Scholar] [CrossRef] [PubMed] [Green Version]
  63. Larkin, M.A.; Blackshields, G.; Brown, N.P.; Chenna, R.; McGettigan, P.A.; McWilliam, H.; Valentin, F.; Wallace, I.M.; Wilm, A.; Lopez, R.; et al. Clustal W and Clustal X version 2.0. Bioinformatics 2007, 23, 2947–2948. [Google Scholar] [CrossRef] [PubMed] [Green Version]
  64. Tamura, K.; Peterson, D.; Peterson, N.; Stecher, G.; Nei, M.; Kumar, S. MEGA5: Molecular evolutional genetics analysis using maximum likelihood, evolutional distance, and maximum parsimony methods. Mol. Biol. Evol. 2011, 28, 2731–2739. [Google Scholar] [CrossRef] [Green Version]
  65. Hu, B.; Jin, J.P.; Guo, A.Y.; Zhang, H.; Luo, J.C.; Gao, G. GSDS 2.0: An upgraded gene feature visualization server. Bioinformatics 2015, 31, 1296–1297. [Google Scholar] [CrossRef] [Green Version]
  66. Bailey, T.L.; Williams, N.; Misleh, C.; Li, W.W. MEME: Discovering and analyzing DNA and protein sequence motifs. Nucleic Acids Res. 2006, 34, 369–373. [Google Scholar] [CrossRef]
  67. Jin, X.; Wang, L.M.; He, L.P.; Feng, W.Q.; Wang, X.C. Two-dimensional gel electrophoresis-based analysis provides global insights into the cotton ovule and fiber proteomes. Sci. China Life Sci. 2016, 59, 154–163. [Google Scholar] [CrossRef] [Green Version]
  68. Howe, E.; Holton, K.; Nair, S.; Schlauch, D.; Sinha, R.; Quackenbush, J. MeV: MultiExperiment Viewer. In Biomedical Informatics for Cancer Research; Springer: Boston, MA, USA, 2010; pp. 267–277. [Google Scholar]
  69. Lescot, M.; Déhais, P.; Thijs, G.; Marchal, K.; Moreau, Y.; Van de Peer, Y.; Rouzé, P.; Rombauts, S. PlantCARE, a database of plant cis-acting regulatory elements and a portal to tools for in silico analysis of promoter sequences. Nucleic Acids Res. 2002, 30, 325–327. [Google Scholar] [CrossRef]
  70. Zhang, T.; Hu, Y.; Jiang, W.; Fang, L.; Guan, X.; Chen, J.; Zhang, J.; Saski, C.A.; Scheffler, B.E.; Stelly, D.M.; et al. Sequencing of allotetraploid cotton (Gossypium hirsutum L. acc. TM-1) provides a resource for fiber improvement. Nat. Biotechnol. 2015, 33, 531–537. [Google Scholar] [CrossRef] [Green Version]
  71. Clough, S.J.; Bent, A.F. Floral dip: A simplified method for Agrobacterium-mediated transformation of Arabidopsis thaliana. Plant J. 1998, 16, 735–743. [Google Scholar] [CrossRef] [Green Version]
  72. Li, L.; Kubiszewski-Jakubiak, S.; Radomiljac, J.; Wang, Y.; Law, S.R.; Keech, O.; Narsai, R.; Berkowitz, O.; Duncan, O.; Murcha, M.W.; et al. Characterization of a novel β-barrel protein (AtOM47) from the mitochondrial outer membrane of Arabidopsis thaliana. J. Exp. Bot. 2016, 21, 6061–6075. [Google Scholar] [CrossRef] [PubMed] [Green Version]
Figure 1. Chromosome distribution of GhAO gene family members. The eight GhAO genes mapped to the chromosomes of the (a) A and (b) D sub-genome are shown. Genes were renamed as GhAO1A-4A and GhAO1D-4D, with previously reported GhAO1 designated as GhAO1D. Different scales were used for chromosomes. Pairs of segmentally duplicated genes are indicated by red dotted lines.
Ijms 20 06167 g001
Figure 2. Phylogenetic analysis of AO family genes. The AO protein sequences from Gossypium hirsutum (GhAOs), G. barbadense (GbAOs), Arabidopsis thaliana (AtAOs), Oryza sativa (OsAOs), Zea mays (ZmAOs), Sorghum bicolor (SbAOs), Glycine max (GmAOs), and Theobroma cacao (TcAOs) were used to construct a neighbor-joining (NJ) phylogenetic tree, with a bootstrap of 1000 replicates and illustration of different colors in distinct species.
Ijms 20 06167 g002
Figure 3. Tandem and segmental duplication of GhAOs and syntenic analysis of G. hirsutum, T. cacao, and A. thaliana. Chromosomes and scaffolds from cotton, cacao, and Arabidopsis are shown in yellow, blue, and red circular columns, respectively. The positions of the AO genes are marked by black lines. Duplicated GhAOs are linked by red lines, and syntenic relationships are indicated by purple lines between cotton and cacao or Arabidopsis and green lines between cacao and Arabidopsis.
Ijms 20 06167 g003
Figure 4. Gene structure and conserved motif analysis of the AO gene family in G. hirsutum and A. thaliana. (a) Exons and introns were represented by black lines and red boxes, respectively, with genomic lengths indicated at the bottom. (b) Ten conserved motifs distributed in AOs are indicated with different colors, showing the amino acid length at the bottom. (c) Amino acid sequence alignment of eight G. hirsutum ascorbate oxidase (GhAO) proteins. Black shading indicates strictly conserved residues and gray shading represents regions of less-strict conservation. Three cupredoxin domains are shown. Pounds (#) indicate trinuclear copper binding sites and solid triangles. (▲) represent type 1 (T1) copper binding sites.
Ijms 20 06167 g004
Figure 5. Expression analysis of GhAOs in fiber development and different tissues. qRT-PCR-based heatmap was performed to analyze the expression level of GhAO genes in (a) fiber developmental stages and (b) different cotton tissues. R, roots; S, stems; L, leaves; P, petals; A, anthers. Gossypium hirsutum ubiquitin 7 (GhUBQ7) gene expression was used as the internal control. The qRT-PCR data of 25 days post anthesis (DPA) fibers were utilized for normalization and artificially set to 1 in (a). Gene expression abundances are shown with different color scales, with yellow, orange, and red to represent low, moderate, and high expression levels, respectively. RNA-seq data of GhAO1A and GhAO1D in (c) fiber developmental stages and (d) different cotton tissues. The RNA-seq data was obtained from the public released data of the BioProject (PRJNA248163) database of National Center for Biotechnology Information (NCBI). The Fragments Per Kilobase of exon model per Million mapped reads (FPKM) value was calculated by Cufflinks.
Ijms 20 06167 g005
Figure 6. Distribution of cis-elements in the GhAO promoter regions and expression analysis of GhAOs under light recovery from the dark. (a,b) represent two clades of the phylogenetic tree. The black lines indicate the length of the promoter sequences, with scale bars on the bottom. The colored capital letters represent different cis-elements, with blue for core element, green for phytohormone response, red for stress response, purple for light response, and brown for others. Detailed information on each cis-element is provided in Supplementary Table S3. (c) qRT-PCR-based heat map was performed to analyze the expression pattern of GhAOs after light recovery from the dark for 1 h, 2 h, 4 h, 6 h, 12 h, and 24 h. GhUBQ7 was used as the internal reference gene. The qRT-PCR data of the 16 h dark period was utilized for normalization and artificially set to 1. Results were normalized using GhUBQ7 as the internal reference. Gene expression abundances are shown with different color scales, with yellow, orange, and red to represent low, moderate, and high expression levels, respectively.
Ijms 20 06167 g006
Figure 7. Functional complementary analysis of GhAO1A in Arabidopsis ao1-1 mutant. The phenotypes of ao1-1 mutant, ao1-1/GhAO1A transgenic plants, and wild-type (WT) Arabidopsis at different growth stages of (a) two-week-old seedlings, (b) four-week-old seedlings, and (c) eight-week-old plants under normal growth conditions (16 h light/8 h dark). Bar = 1 cm. (d) qRT-PCR analysis of expression levels of the selected floral genes in eight-week-old ao1-1 mutant, transgenic ao1-1/GhAO1A, and WT Arabidopsis plants. The results were normalized using Arabidopsis thaliana 18S ribosomal RNA (At18SrRNA) as the internal reference gene. The gene expression level of WT was artificially set to 1, and was used as the reference for statistical difference analysis. Asterisks indicate significant differences according to one-way ANOVA, * p < 0.05; ** p < 0.01; *** p < 0.001.
Ijms 20 06167 g007
Figure 8. Functional analysis of GhAO1A in delaying dark-induced leaf senescence in Arabidopsis. (a) Representative phenotype of two-week-old Arabidopsis ao1-1 mutant, transgenic ao1-1/GhAO1A, and WT plants under normal growth conditions (16 h light/8 h dark), dark treatment, and light recovery (16 h light out of 6 d dark). Bar = 1 cm. (b) Chlorophyll content of leaves of two-week-old Arabidopsis ao1-1 mutant, ao1-1/GhAO1A, and WT plants. Data are the average of three independent experiments. (c) qRT-PCR analysis of senescence-associated genes (SAGs) in the leaves of two-week-old Arabidopsis ao1-1 mutant, ao1-1/GhAO1A, and WT plants. The results were normalized using Arabidopsis thaliana Actin 2 (AtACTIN2) as the internal control. Data of untreated Arabidopsis plants that were designed as control check (CK) were utilized as references for statistical difference analysis. Asterisks indicate the significant differences according to one-way ANOVA, * p < 0.05; ** p < 0.01; *** p < 0.001.
Ijms 20 06167 g008
Figure 9. Effect of exogenous hydrogen peroxide (H2O2) on Arabidopsis seedlings. (a) Two-week-old Arabidopsis ao1-1 mutant, transgenic ao1-1/GhAO1A, and WT plants were incubated with or without 100 mM H2O2 for two days under normal growth conditions (16 h light/8 h dark). Bar = 1 cm. (b) Determination of ascorbic acid (AsA) and dehydroascorbate (DHA) content in Arabidopsis ao1-1 mutant, transgenic ao1-1/GhAO1A, and WT plants. The AsA/DHA ratio is also shown. Data are the average of three independent experiments. Results of WT were used as references for analysis of statistical difference test. Asterisks indicate significant differences according to one-way ANOVA, ** p < 0.01; *** p < 0.001.
Ijms 20 06167 g009
Table 1. The Gossypium hirsutum ascorbate oxidase (GhAO) genes and properties of the deduced proteins.
Gene NameGene IDChromosomal LocationORF (bp)Protein a
Size (aa)MW (kD)pISubcellular Localization b
GhAO1AGh_A08G1967A-Chr8172557464.068.63E
GhAO1DGh_D08G2139D-Chr8172557464.127.99E
GhAO2AGh_A02G1327A-Chr2165054961.877.05E
GhAO2DGh_D03G0441D-Chr3175858565.647.33E
GhAO3AGh_A12G0933A-Chr12171056864.187.08E
GhAO3DGh_D12G0952D-Chr12170756964.128.07E
GhAO4AGh_A12G0719A-Chr12126342046.615.65E
GhAO4DGh_D12G0953D-Chr12155151658.075.95E
a The molecular weight (MW) and isoelectric point (pI) were calculated by ExPASy (http://cn.expasy.org/tools). b Subcellular localization was analyzed using Softberry server. E, extracellular (secreted).
Table 2. Tajima relative rate tests of AO gene pairs in G. hirsutum.
Testing GroupMt aM1 bM2 cX2Pd
GhAO1A/GhAO1D with TcAO1438120.330.5637
GhAO2A/GhAO2D with TcAO3467470.820.3657
GhAO3A/GhAO3D with TcAO3473371.60.2059
GhAO4A/GhAO4D with TcAO526829136.10.0136
a Mt indicates the sum of the identical sites in all three sequences tested, b M1 represents the number of unique differences in the first paralog, c M2 shows the number of unique differences in the second paralog, and d p < 0.05 infers that one of the two duplicates has an accelerated evolutionary rate.

