RankerGUI: A Computational Framework to Compare Differential Gene Expression Profiles Using Rank Based Statistics


Abstract
1. Introduction
2. Results and Discussion
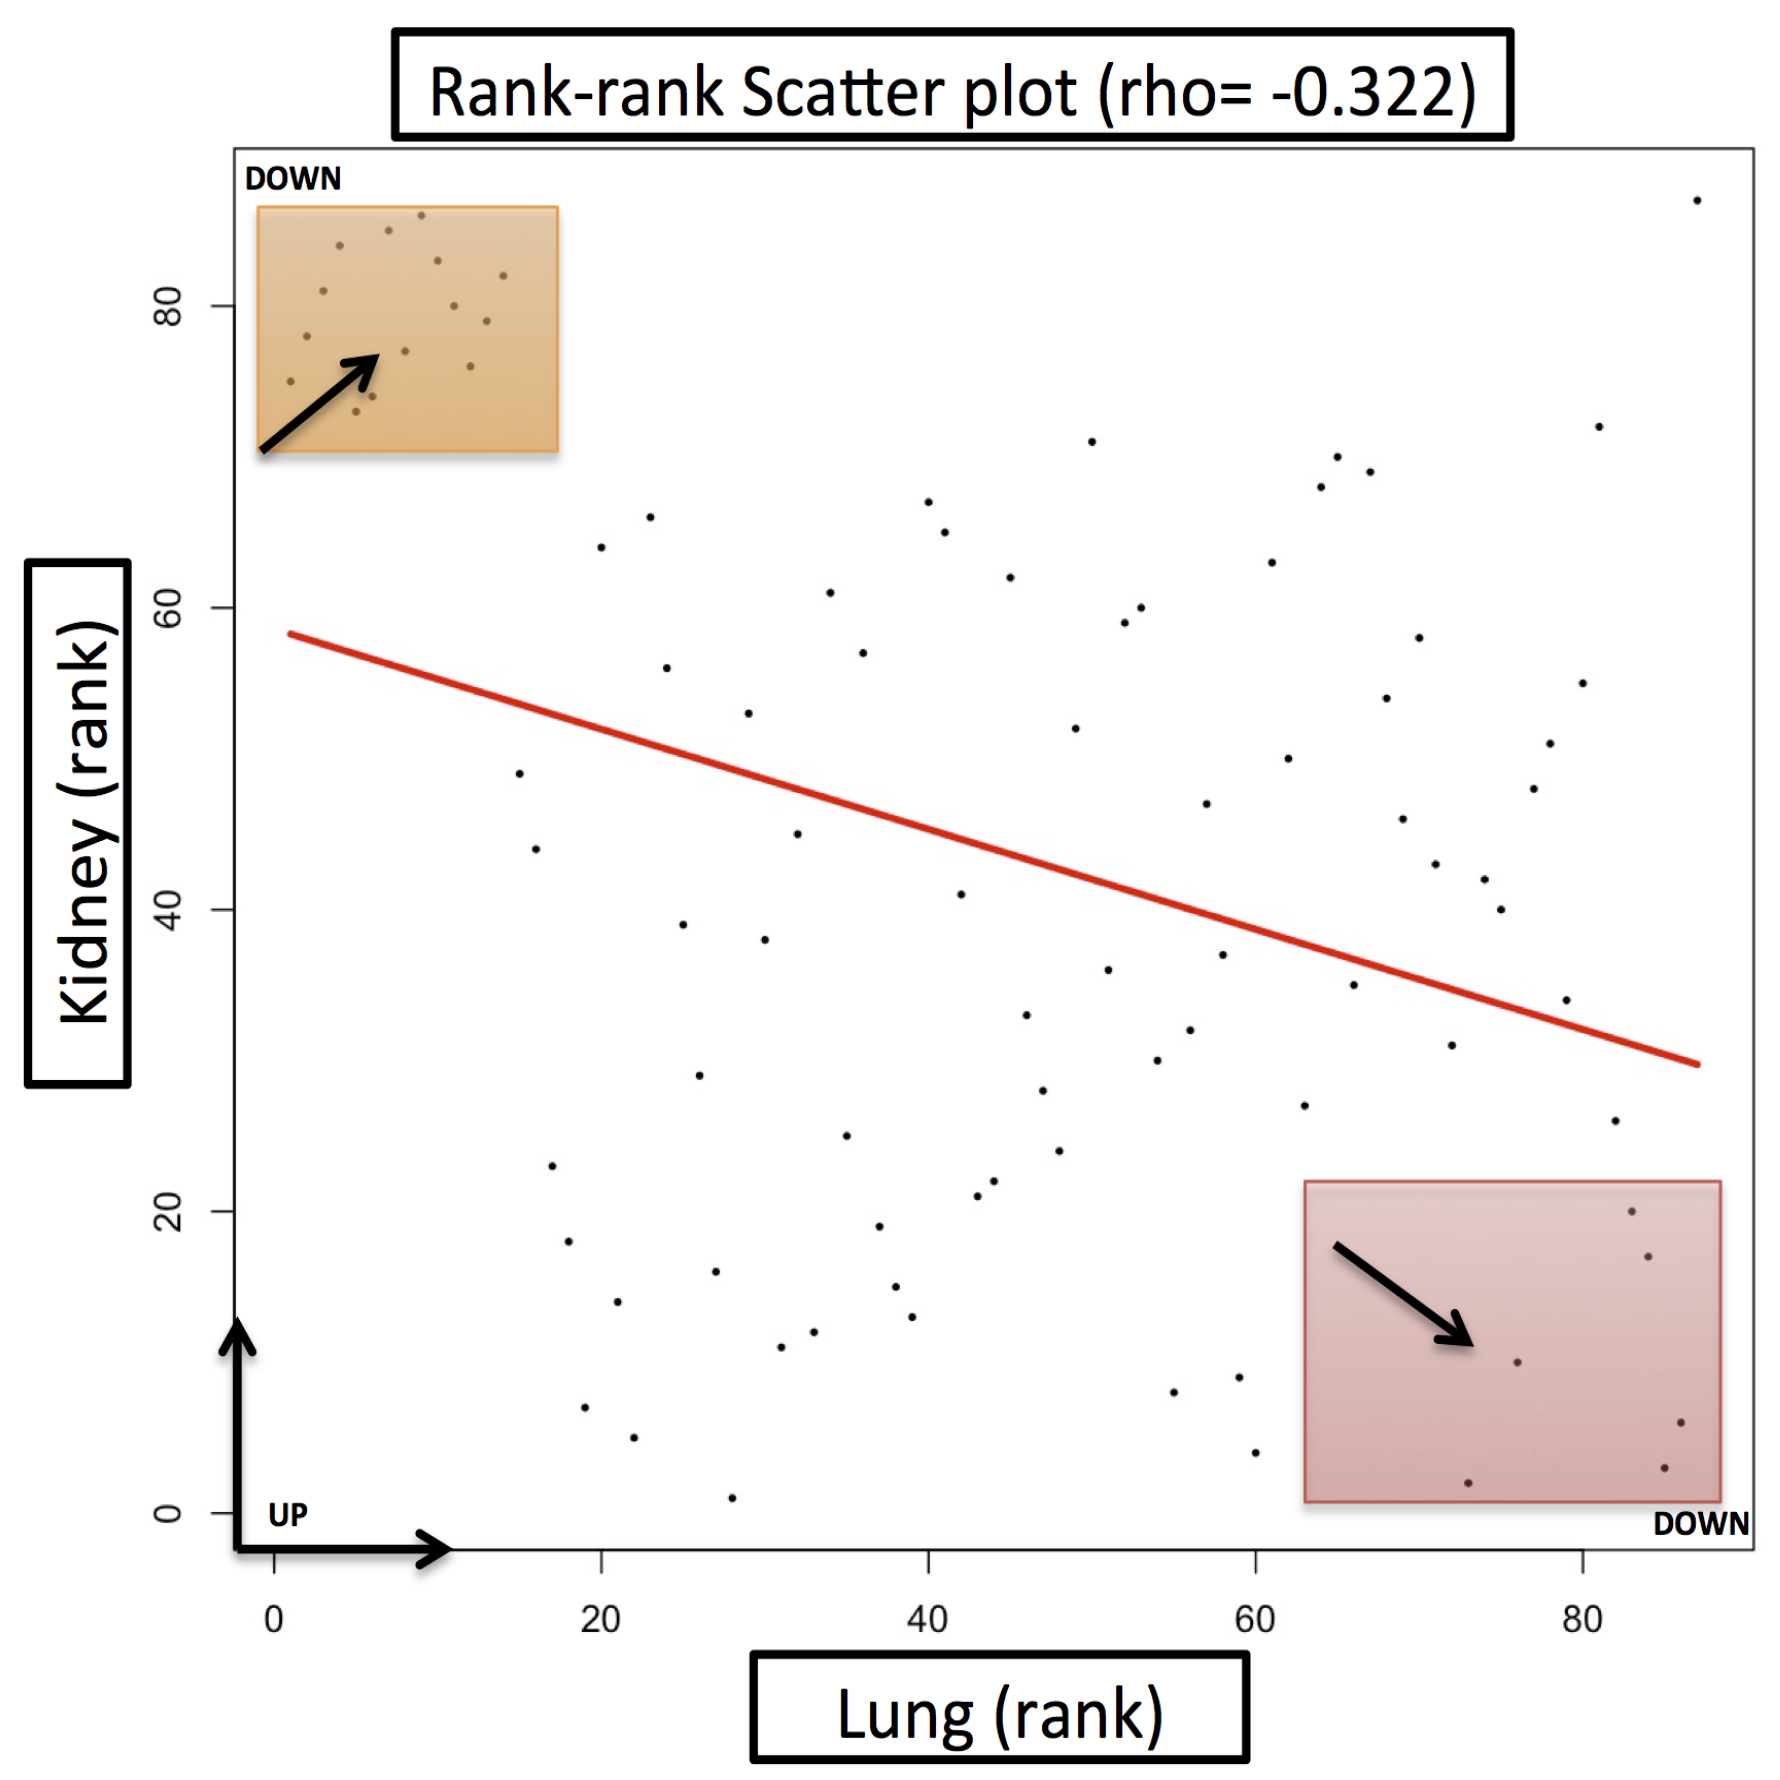
Case Study
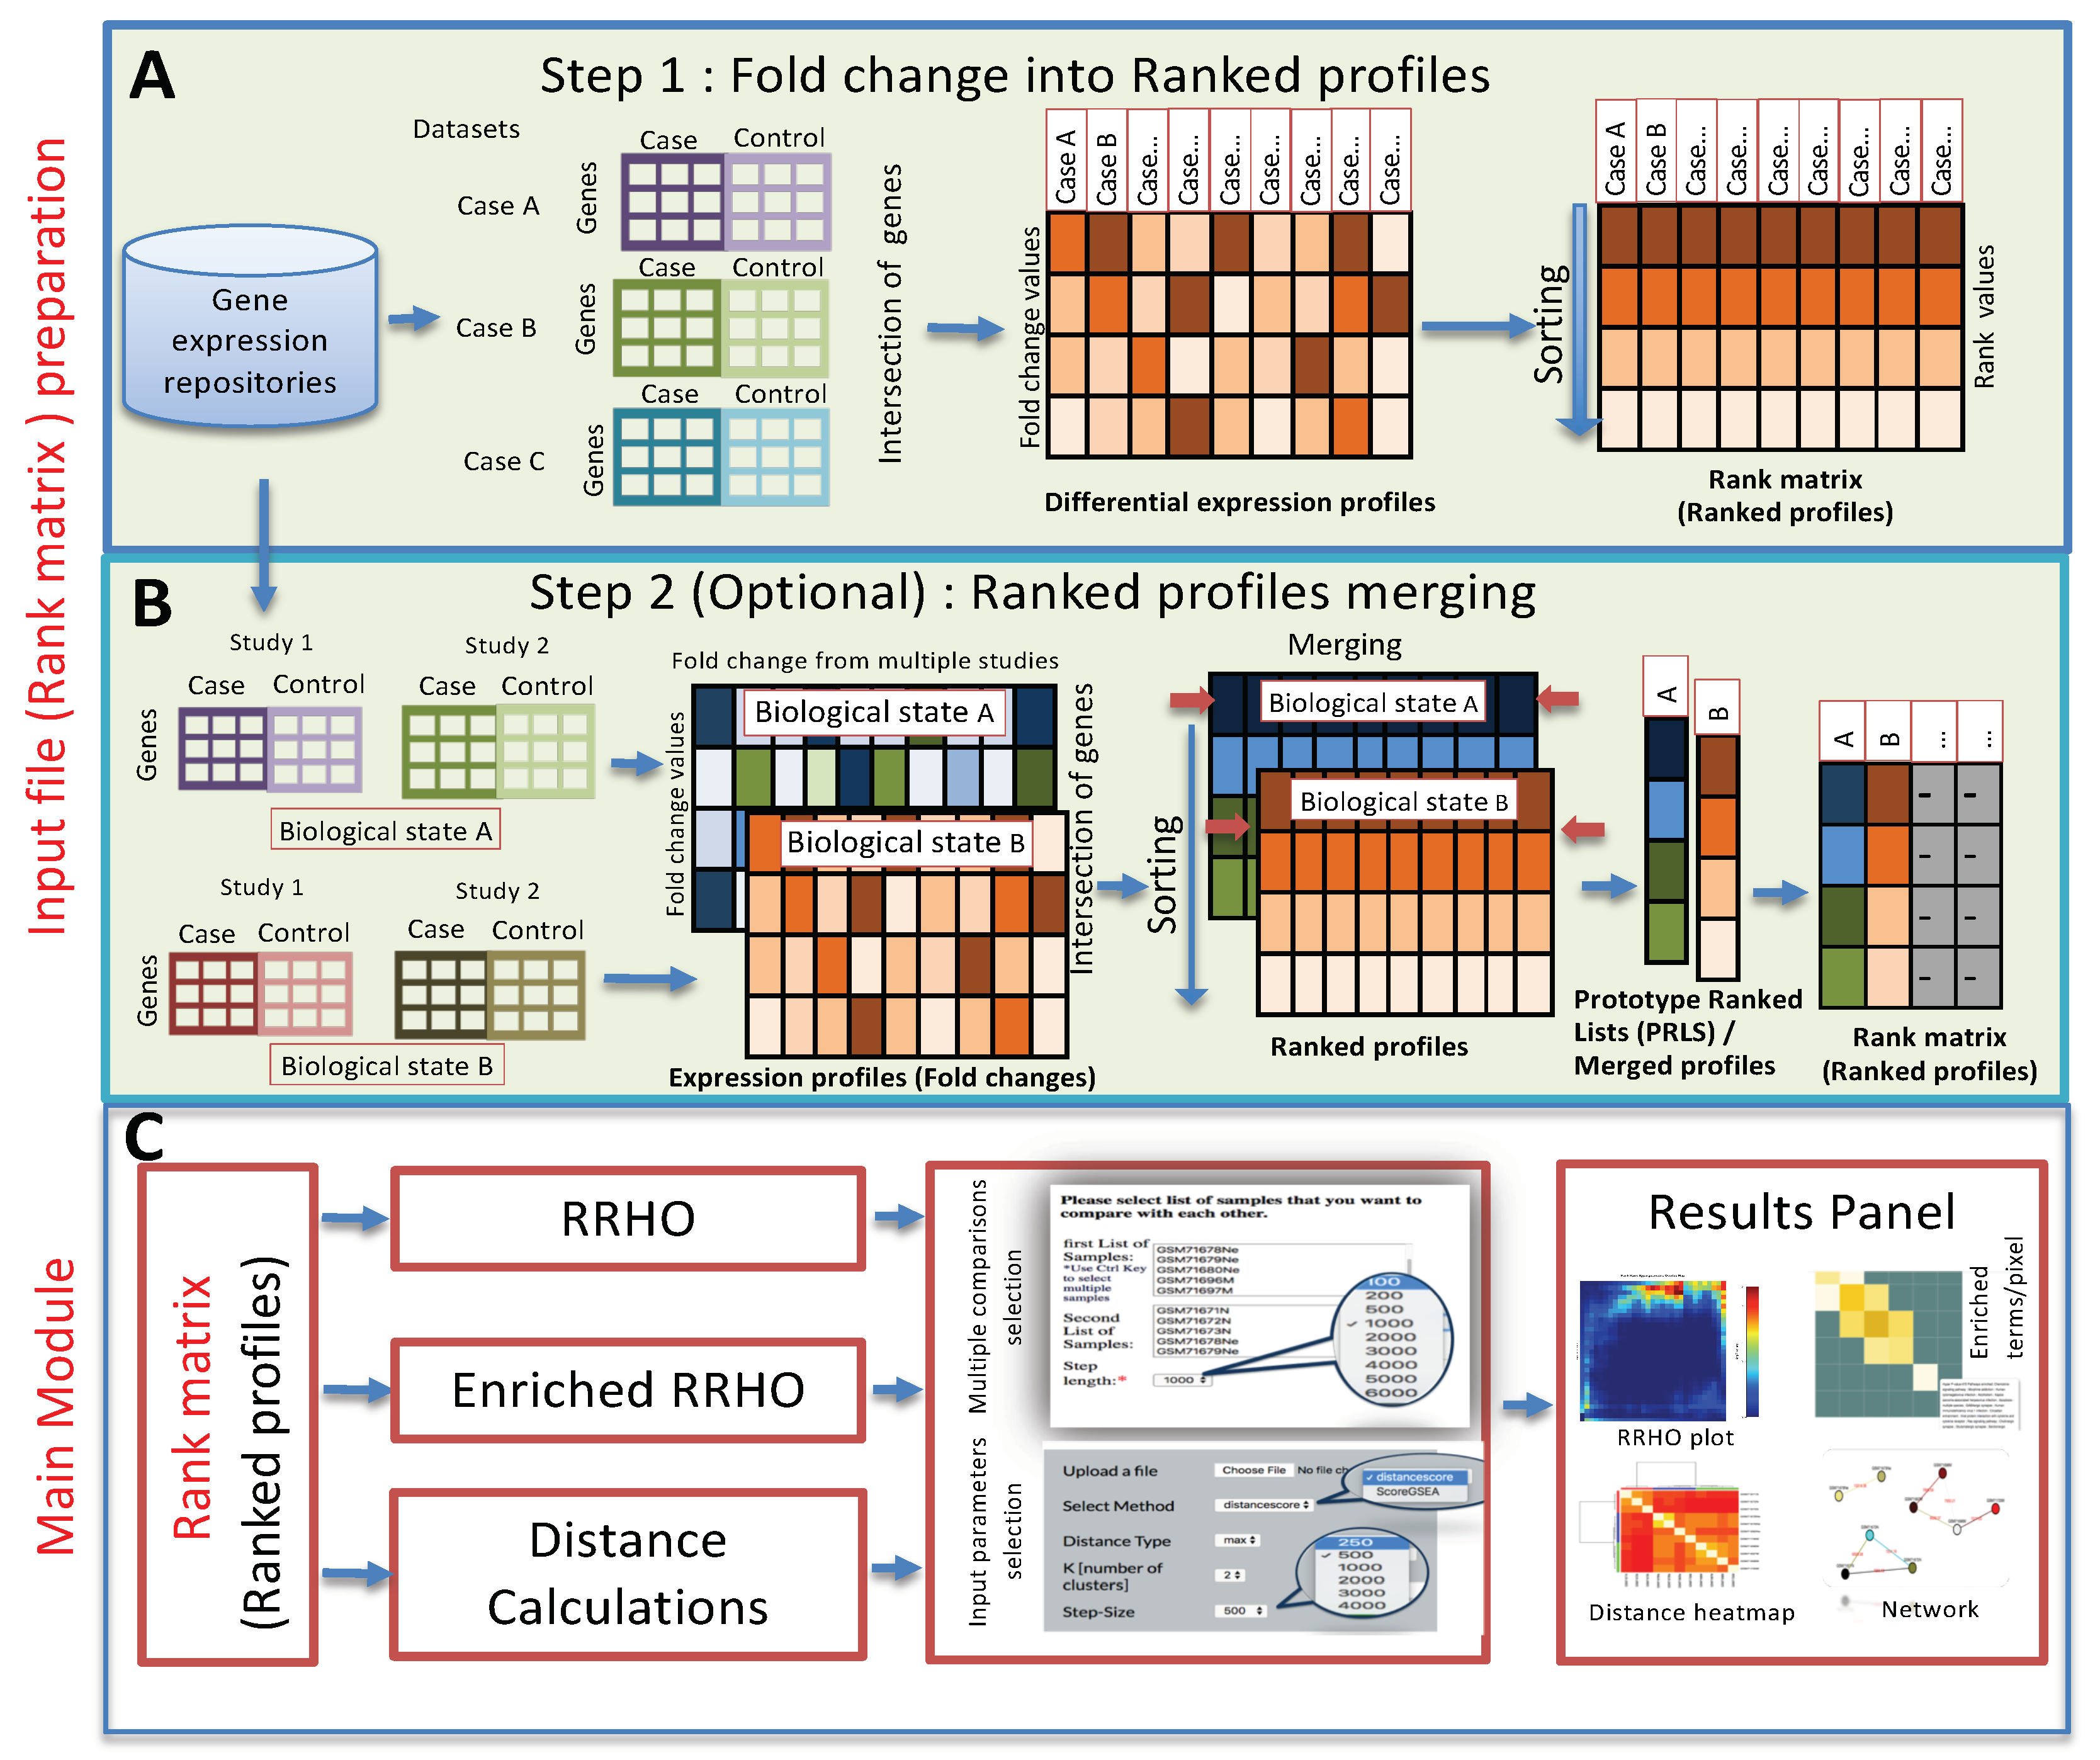
3. Method and Implementation
3.1. Method
3.2. Web Server
4. Conclusions
Author Contributions
Funding
Acknowledgments
Conflicts of Interest
Abbreviations
| GSEA | Gene set enrichment analysis |
| KIRC | Kidney renal clear cell carcinoma |
| LUAD | Lung adenocarcinoma |
| LUSC | Lung squamous cell carcinoma |
| PRL | Prototype ranked list |
| RRHO | Rank–rank hyper-geometric overlaps |
References
- Hu, G.; Agarwal, P. Human disease-drug network based on genomic expression profiles. PLoS ONE 2009, 4, e6536. [Google Scholar] [CrossRef] [PubMed]
- Iorio, F.; Bosotti, R.; Scacheri, E.; Belcastro, V.; Mithbaokar, P.; Ferriero, R.; Murino, L.; Tagliaferri, R.; Brunetti-Pierri, N.; Isacchi, A.; et al. Discovery of drug mode of action and drug repositioning from transcriptional responses. Proc. Natl. Acad. Sci. USA 2010, 107, 14621–14626. [Google Scholar] [CrossRef] [PubMed]
- Subramanian, A.; Tamayo, P.; Mootha, V.K.; Mukherjee, S.; Ebert, B.L.; Gillette, M.A.; Paulovich, A.; Pomeroy, S.L.; Golub, T.R.; Lander, E.S.; et al. Gene set enrichment analysis: A knowledge based approach for interpreting genome-wide expression profiles. Proc. Natl. Acad. Sci. USA 2005, 102, 15545–15550. [Google Scholar] [CrossRef] [PubMed]
- Tripathi, K.P.; Chavan, S.G.; Parashuraman, S.; Piccirillo, M.; Magliocca, S.; Guarracino, M.R. Comparison of gene expression signature using rank based statistical inference. In Proceedings of the International Meeting on Computational Intelligence Methods for Bioinformatics and Biostatistics, Naples, Italy, 10–12 September 2015; pp. 28–41. [Google Scholar]
- Chavan, S.G.; Tripathi, K.P.; Piccirilo, M.; Roy, P.D.; Guarracino, M.; Luini, A.; Parashuraman, S. Dissecting the Functions of the Secretory Pathway by Transcriptional Profiling. In Dynamics of Mathematical Models in Biology; Springer: Berlin, Germany, 2016; pp. 79–87. [Google Scholar]
- Yang, X.; Bentink, S.; Scheid, S.; Spang, R. Similarities of ordered gene lists. J. Bioinform. Comput. Biol. 2006, 4, 693–708. [Google Scholar] [CrossRef] [PubMed]
- Khan, H.A. ArraySolver: An algorithm for color-coded graphical display and Wilcoxon signed-rank statistics for comparing microarray gene expression data. Comp. Funct. Genom. 2004, 5, 39–47. [Google Scholar] [CrossRef] [PubMed]
- Eden, E.; Navon, R.; Steinfeld, I.; Lipson, D.; Yakhini, Z. GOrilla: A tool for discovery and visualization of enriched GO terms in ranked gene lists. BMC Bioinform. 2009, 10, 48. [Google Scholar] [CrossRef] [PubMed]
- Plaisier, S.B.; Taschereau, R.; Wong, J.A.; Graeber, T.G. Rank–rank hypergeometric overlap: identification of statistically significant overlap between gene-expression signatures. Nucleic Acids Res. 2010, 38, e169. [Google Scholar] [CrossRef]
- Carrella, D.; Napolitano, F.; Rispoli, R.; Miglietta, M.; Carissimo, A.; Cutillo, L.; Sirci, F.; Gregoretti, F.; Di Bernardo, D. Mantra 2.0: An online collaborative resource for drug mode of action and repurposing by network analysis. Bioinformatics 2014, 30, 1787–1788. [Google Scholar] [CrossRef]
- Furge, K.; Dykema, K. PGSEA: Parametric Gene Set Enrichment Analysis, R package version 1.2; Rpackage: Auckland, New Zealand, 2006. [Google Scholar]
- Li, F.; Cao, Y.; Han, L.; Cui, X.; Xie, D.; Wang, S.; Bo, X. GeneExpressionSignature: An R package for discovering functional connections using gene expression signatures. Omics J. Integr. Biol. 2013, 17, 116–118. [Google Scholar] [CrossRef]
- Slonim, D.K.; Yanai, I. Getting started in gene expression microarray analysis. PLoS Comput. Biol. 2009, 5, e1000543. [Google Scholar] [CrossRef]
- Costa-Silva, J.; Domingues, D.; Lopes, F.M. RNA-Seq differential expression analysis: An extended review and a software tool. PLoS ONE 2017, 12, e0190152. [Google Scholar] [CrossRef] [PubMed]
- Eijssen, L.M.; Jaillard, M.; Adriaens, M.E.; Gaj, S.; de Groot, P.J.; Müller, M.; Evelo, C.T. User-friendly solutions for microarray quality control and pre-processing on ArrayAnalysis. org. Nucleic Acids Res. 2013, 41, W71–W76. [Google Scholar] [CrossRef] [PubMed]
- Kanehisa, M.; Goto, S. KEGG: kyoto encyclopedia of genes and genomes. Nucleic Acids Res. 2000, 28, 27–30. [Google Scholar] [CrossRef] [PubMed]
- Jones, M.H.; Virtanen, C.; Honjoh, D.; Miyoshi, T.; Satoh, Y.; Okumura, S.; Nakagawa, K.; Nomura, H.; Ishikawa, Y. Two prognostically significant subtypes of high-grade lung neuroendocrine tumors independent of small-cell and large-cell neuroendocrine carcinomas identified by gene expression profiles. Lancet 2004, 363, 775–781. [Google Scholar] [CrossRef]
- Fujiwara, T.; Hiramatsu, M.; Isagawa, T.; Ninomiya, H.; Inamura, K.; Ishikawa, S.; Ushijima, M.; Matsuura, M.; Jones, M.H.; Shimane, M.; et al. ASCL1-coexpression profiling but not single gene expression profiling defines lung adenocarcinomas of neuroendocrine nature with poor prognosis. Lung Cancer 2012, 75, 119–125. [Google Scholar] [CrossRef]
- Lenburg, M.E.; Liou, L.S.; Gerry, N.P.; Frampton, G.M.; Cohen, H.T.; Christman, M.F. Previously unidentified changes in renal cell carcinoma gene expression identified by parametric analysis of microarray data. BMC Cancer 2003, 3, 31. [Google Scholar] [CrossRef]
- Wachi, S.; Yoneda, K.; Wu, R. Interactome-transcriptome analysis reveals the high centrality of genes differentially expressed in lung cancer tissues. Bioinformatics 2005, 21, 4205–4208. [Google Scholar] [CrossRef]
- Smyth, G.K. Linear models and empirical bayes methods for assessing differential expression in microarray experiments. Stat. Appl. Genet. Mol. Biol. 2004, 3, 1–25. [Google Scholar] [CrossRef]
- Davis, S.; Meltzer, P.S. GEOquery: A bridge between the Gene Expression Omnibus (GEO) and BioConductor. Bioinformatics 2007, 23, 1846–1847. [Google Scholar] [CrossRef]
- Bindea, G.; Mlecnik, B.; Hackl, H.; Charoentong, P.; Tosolini, M.; Kirilovsky, A.; Fridman, W.H.; Pagès, F.; Trajanoski, Z.; Galon, J. ClueGO: A Cytoscape plug-in to decipher functionally grouped gene ontology and pathway annotation networks. Bioinformatics 2009, 25, 1091–1093. [Google Scholar] [CrossRef]
- Tang, Z.; Li, C.; Kang, B.; Gao, G.; Li, C.; Zhang, Z. GEPIA: A web server for cancer and normal gene expression profiling and interactive analyses. Nucleic Acids Res. 2017, 45, W98–W102. [Google Scholar] [CrossRef] [PubMed]
- Kruskal, J.B. On the shortest spanning subtree of a graph and the traveling salesman problem. Proc. Am. Math. Soc. 1956, 7, 48–50. [Google Scholar] [CrossRef]
- Diaconis, P.; Graham, R.L. Spearman’s footrule as a measure of disarray. J. R. Stat. Soc. Ser. B (Methodol.) 1977, 39, 262–268. [Google Scholar] [CrossRef]
- Chamberlin, J.R.; Courant, P.N. Representative deliberations and representative decisions: Proportional representation and the Borda rule. Am. Political Sci. Rev. 1983, 77, 718–733. [Google Scholar] [CrossRef]
- Yu, G.; Wang, L.G.; Han, Y.; He, Q.Y. clusterProfiler: An R package for comparing biological themes among gene clusters. Omics J. Integr. Biol. 2012, 16, 284–287. [Google Scholar] [CrossRef]
- Frey, B.J.; Dueck, D. Clustering by passing messages between data points. Science 2007, 315, 972–976. [Google Scholar] [CrossRef]
- Bodenhofer, U.; Kothmeier, A.; Hochreiter, S. APCluster: An R package for affinity propagation clustering. Bioinformatics 2011, 27, 2463–2464. [Google Scholar] [CrossRef]
- Franz, M.; Lopes, C.T.; Huck, G.; Dong, Y.; Sumer, O.; Bader, G.D. Cytoscape. js: A graph theory library for visualization and analysis. Bioinformatics 2015, 32, 309–311. [Google Scholar]


| Gene Name | Fold Change (FC) (Lung Cancer) | Fold Change (FC) (Kidney Cancer) | Description |
|---|---|---|---|
| ALDOB | 1.13 | −7.01 | aldolase, fructose-bisphosphate B |
| TFAP2B | 1.17 | −4.16 | transcription factor AP-2 beta |
| AZGP1 | 1.23 | −3.95 | alpha-2-glycoprotein 1, zinc-binding |
| PC | 1.05 | −2.39 | pyruvate carboxylase |
| PPM1H | 1.01 | −2.37 | protein phosphatase, Mg2+/Mn2+ dependent 1H |
| GGH | 1.24 | −2.35 | gamma-glutamyl hydrolase |
| FOXI1 | 1.05 | −2.26 | forkhead box I1 |
| MYCN | 1.02 | −2.10 | v-myc avian myelocytomatosis viral oncogene neuroblastoma derived homolog |
| UCHL1 | 1.47 | −1.70 | ubiquitin C-terminal hydrolase L1 |
| TUBB2A | 1.15 | −1.52 | tubulin beta 2A class IIa |
| PPIF | 1.03 | −1.32 | peptidylprolyl isomerase F |
| SPP1 | 2.29 | −1.15 | secreted phosphoprotein 1 |
| PFN2 | 1.2 | −1.06 | profilin 2 |
| PDHA1 | 1.21 | −1.02 | pyruvate dehydrogenase (lipoamide) alpha 1 |
| CALCRL | −2.04 | 1.00 | calcitonin receptor like receptor |
| CDH5 | −2.08 | 1.71 | cadherin 5 |
| CAV2 | −2.1 | 1.86 | caveolin 2 |
| PMP22 | −2.11 | 1.97 | peripheral myelin protein 22 |
| FHL1 | −2.52 | 3.09 | four and a half LIM domains 1 |
| CAV1 | −3.39 | 2.92 | caveolin 1 |
© 2019 by the authors. Licensee MDPI, Basel, Switzerland. This article is an open access article distributed under the terms and conditions of the Creative Commons Attribution (CC BY) license (http://creativecommons.org/licenses/by/4.0/).
Share and Cite
Thind, A.S.; Tripathi, K.P.; Guarracino, M.R. RankerGUI: A Computational Framework to Compare Differential Gene Expression Profiles Using Rank Based Statistics. Int. J. Mol. Sci. 2019, 20, 6098. https://doi.org/10.3390/ijms20236098
Thind AS, Tripathi KP, Guarracino MR. RankerGUI: A Computational Framework to Compare Differential Gene Expression Profiles Using Rank Based Statistics. International Journal of Molecular Sciences. 2019; 20(23):6098. https://doi.org/10.3390/ijms20236098
Chicago/Turabian StyleThind, Amarinder Singh, Kumar Parijat Tripathi, and Mario Rosario Guarracino. 2019. "RankerGUI: A Computational Framework to Compare Differential Gene Expression Profiles Using Rank Based Statistics" International Journal of Molecular Sciences 20, no. 23: 6098. https://doi.org/10.3390/ijms20236098
APA StyleThind, A. S., Tripathi, K. P., & Guarracino, M. R. (2019). RankerGUI: A Computational Framework to Compare Differential Gene Expression Profiles Using Rank Based Statistics. International Journal of Molecular Sciences, 20(23), 6098. https://doi.org/10.3390/ijms20236098