Article

A Benzothiazole-Based Fluorescent Probe for Ratiometric Detection of Al3+ and Its Application in Water Samples and Cell Imaging

Department of Applied Chemistry, College of Arts and Sciences, Northeast Agricultural University, Harbin 150030, China
*
Author to whom correspondence should be addressed.
Int. J. Mol. Sci. 2019, 20(23), 5993; https://doi.org/10.3390/ijms20235993
Submission received: 29 October 2019 / Revised: 25 November 2019 / Accepted: 26 November 2019 / Published: 28 November 2019
(This article belongs to the Section Physical Chemistry and Chemical Physics)

Abstract

:
An easily prepared benzothiazole-based probe (BHM) was prepared and characterized by general spectra, including 1H NMR, 13C NMR, HRMS, and single-crystal X-ray diffraction. Based on the synergistic mechanism of the inhabitation of intramolecular charge transfer (ICT), the BHM displayed high selectivity and sensitivity for Al3+ in DMF/H2O (v/v, 1/1) through an obvious blue-shift in the fluorescent spectrum and significant color change detected by the naked eye, respectively. The binding ratio of BHM with Al3+ was 1:1, as determined by the Job plot, and the binding details were investigated using FT-IR, 1H NMR titration, and ESI-MS analysis. Furthermore, the BHM was successfully applied in the detection of Al3+ in the Songhua River and on a test stripe. Fluorescence imaging experiments confirmed that the BHM could be used to monitor Al3+ in human stromal cells (HSC).

Graphical Abstract

1. Introduction

Aluminum, as one of the most abundant metals in the earth, is widely used in daily life, including in kitchen utensils, pharmaceutical packaging, and food additives [1,2,3,4]. These activities will inevitably induce the accumulation of Al3+, which is the most ionic style of aluminum in existence in environmental water and the human body. However, as a non-necessary element for humans, excess accumulation of Al3+ in the human body might be associated with diseases, including Alzheimer’s disease, Parkinson’s disease, amyotrophic sclerosis, and encephalopathy [5,6,7,8,9,10]. According to the regulations of the World Health Organization (WHO), the maximum concentration of Al3+ is 7.4 μM in drinking water. Hence, it is necessary to construct a simple and effective method with the function of qualitative and quantitative analysis in Al3+ detection.
The development of fluorescent probes for detection and special analysis has attracted many researchers, and numerous excellent probes for Al3+ have been reported [11,12,13,14,15,16,17,18,19,20,21,22,23,24,25,26,27]. Among them, the ratiometric probe is one of the most popular types of sensors due to the inherent advantage that it can eliminate the interference of the external environment through self-calibration of its response signals either in emission or absorbance intensities at two different wavelengths. Some ratiometric Al3+ probes were developed using different fluorophores, including rhodamine–naphthalene [17], rhodamine-benzothiazole [18], 4′-methyl-3-hydroxyflavone [19], coumarin-quinoline [20], rhodamine-chromone [21], carbazole-rhodamine [22], imidazoquinazoline [23], benzothiazole [24], benzimidazole [25], naphthalimide [26], and quinoline–coumarin [27]. However, only a few of these were benzothiazole-based fluorescent probes for the ratiometric detection of Al3+ [24]. Moreover, benzothiazole, an excellent fluorophore due to its distinguished merits, such as excellent photo stability and easy structural modification, had been used in the construction of chemosensors for the detection of various ions [28,29,30,31,32,33,34]. Moreover, this type of structure, in which the hydroxyl group acts as an electron donating unit in the para-position of the benzothiazolyl group used as the electron withdrawing group, was facile for the ICT-based mechanism by increasing the push-pull electron effect [35]. Given the above statements, a novel easily prepared probe BHM (5-(benzo[d]thiazol-2-yl)-2-hydroxy-3-methoxybenzaldehyde) was synthesized, and its stereo structure was confirmed by single crystal X-ray diffraction (Scheme 1). The BHM showed an obvious selectivity and sensitivity to Al3+ with a significant blue-shift both in the emission spectrum and absorbance spectrum. Its application in real water samples was investigated. Moreover, the BHM was successful in imaging the human stromal cell line (HSC).

2. Results and Discussion

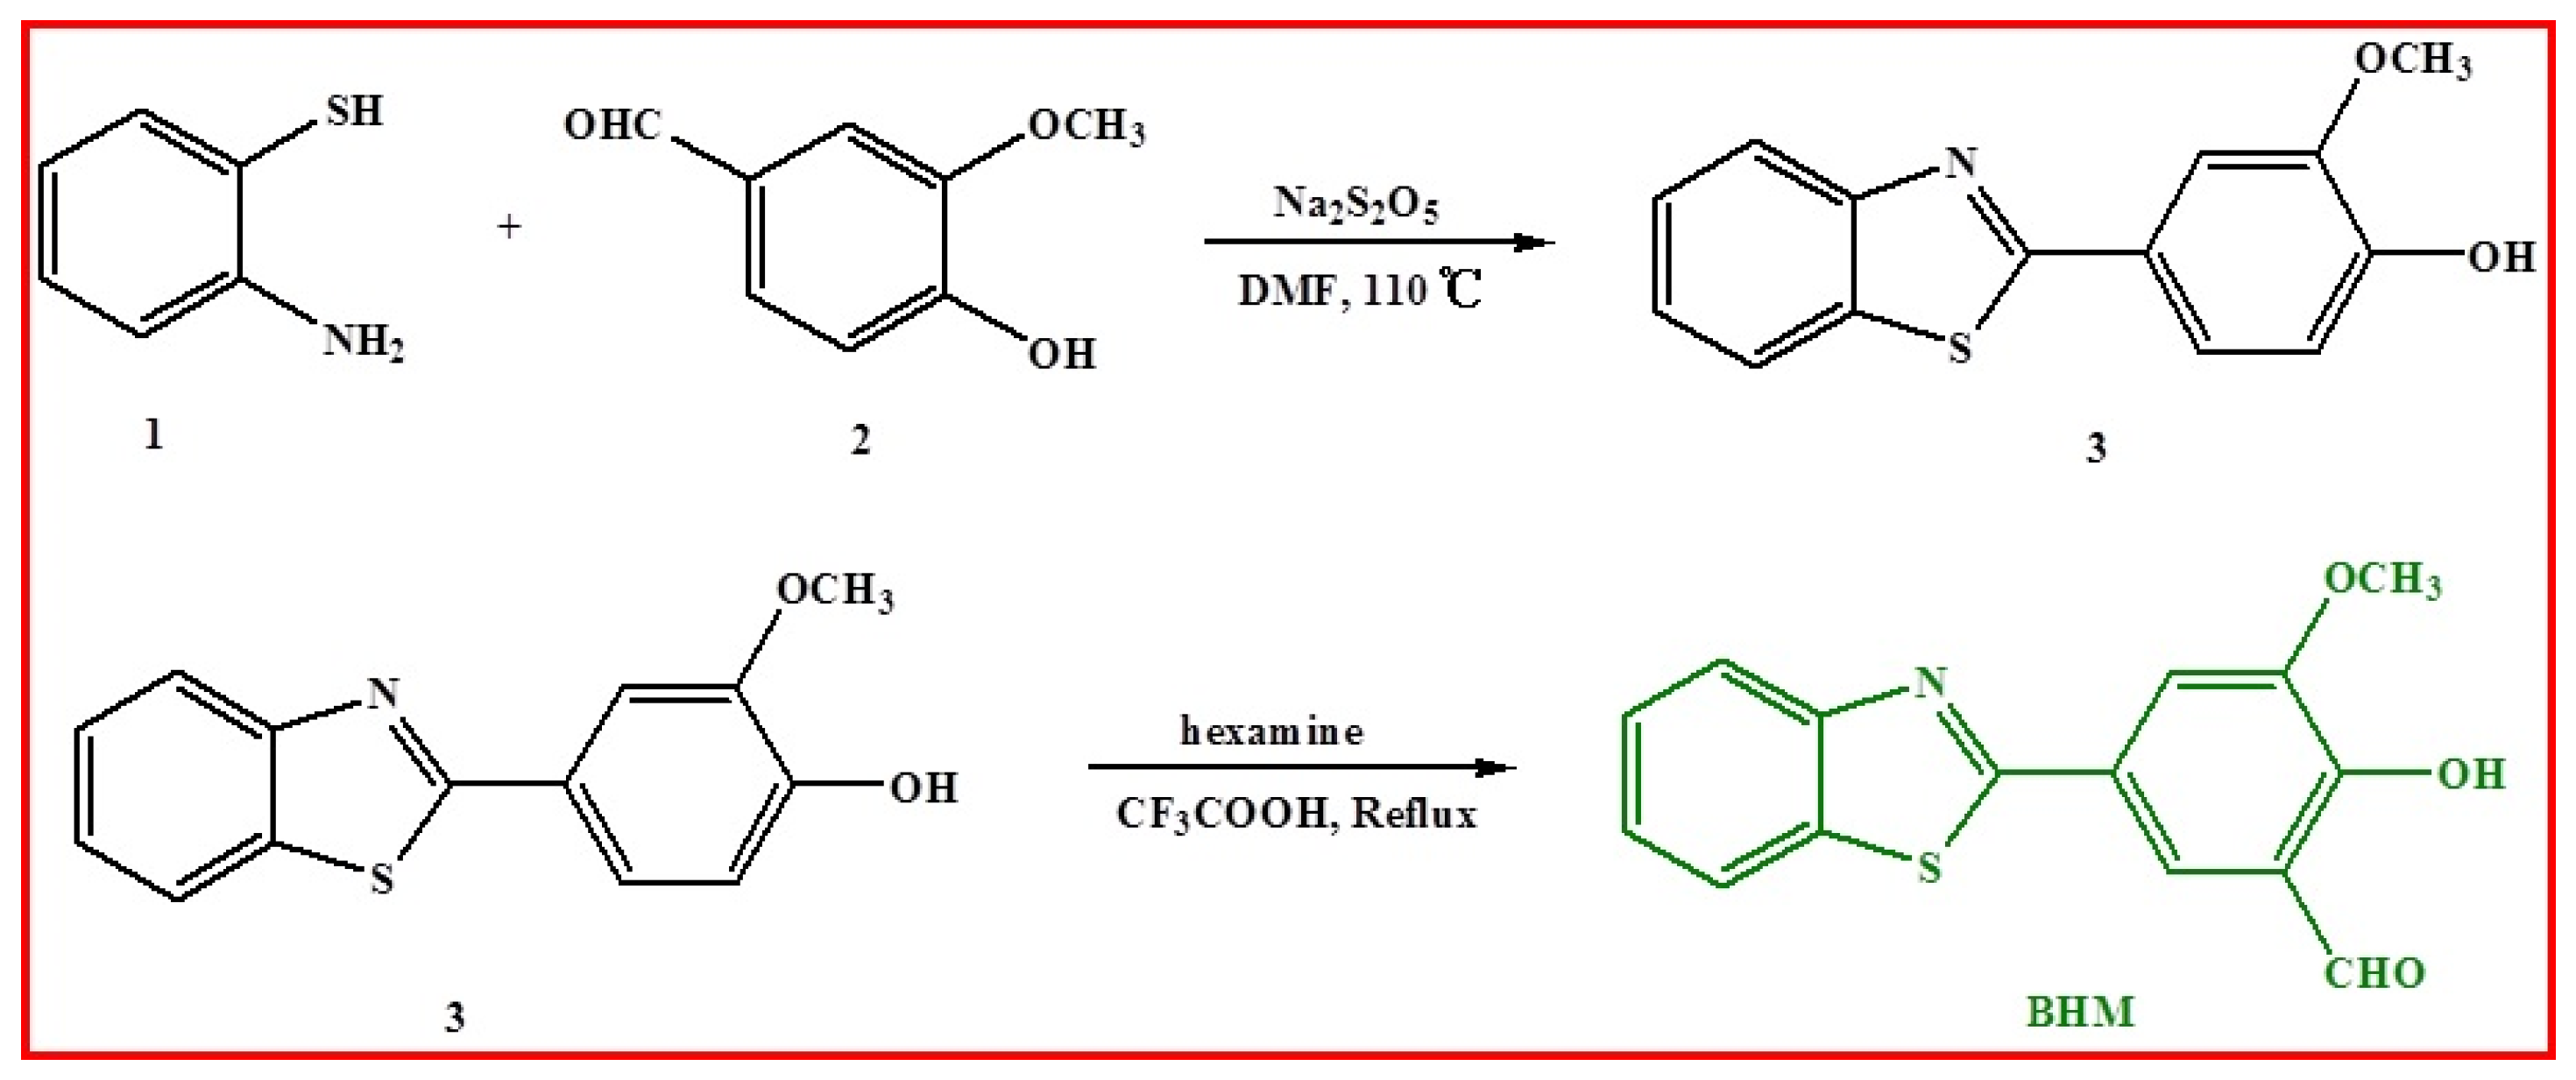
2.1. Synthesis of BHM

The BHM was facile synthesized through a Duff reaction using the starting material of 4-(benzo[d]thiazol-2-yl)-2-methoxyphenol (3), which was synthesized via a condensation reaction between 2-aminobenzenethiol and 4-hydroxy-3-methoxybenzaldehyde [36]. The single crystal of BHM was obtained, and its molecular structure is depicted in Figure 1. The selective crystal data are displayed in Tables S1 and S2.

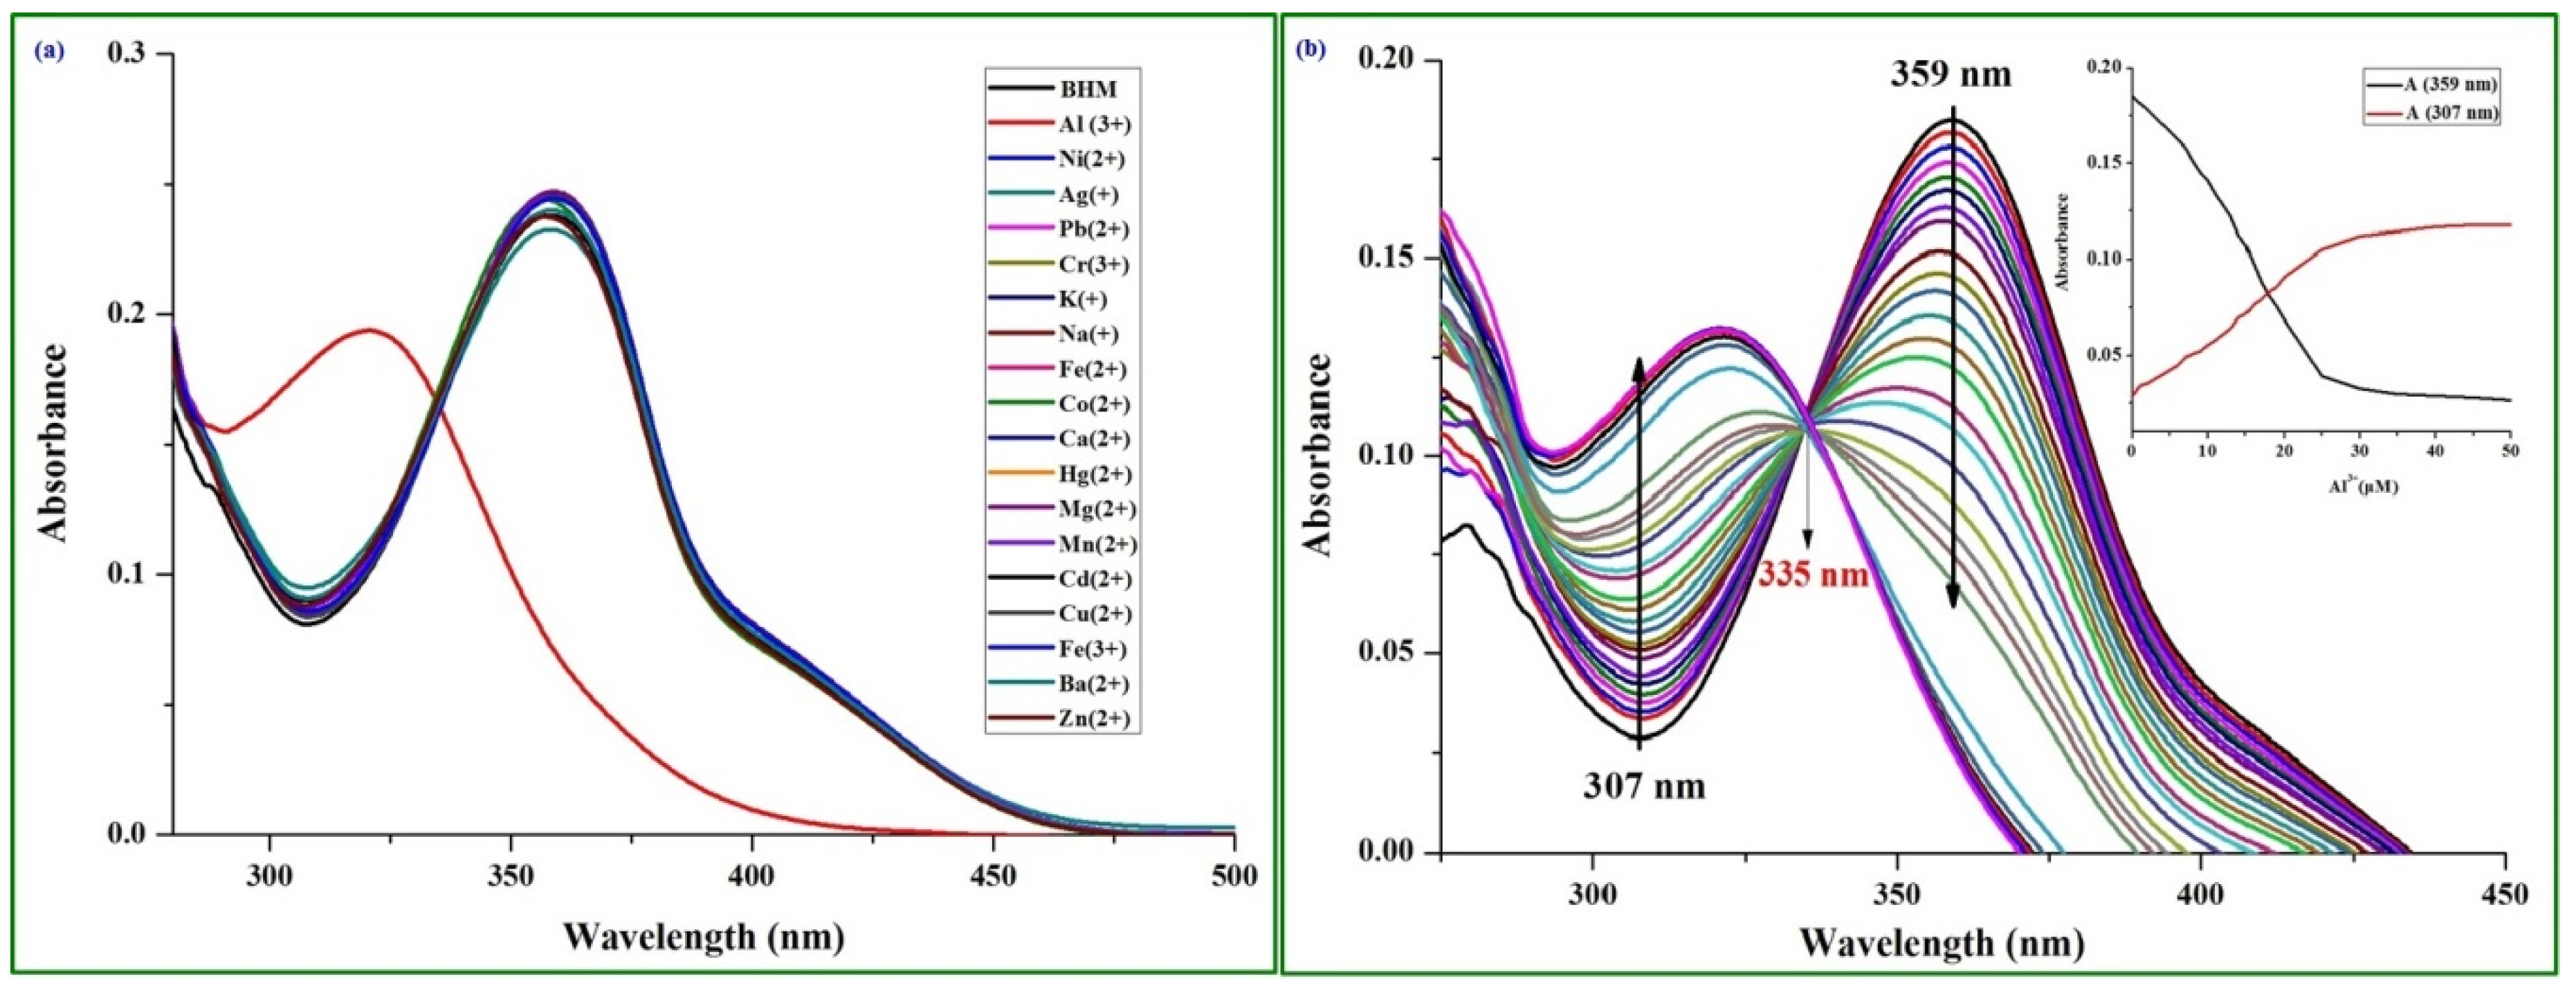
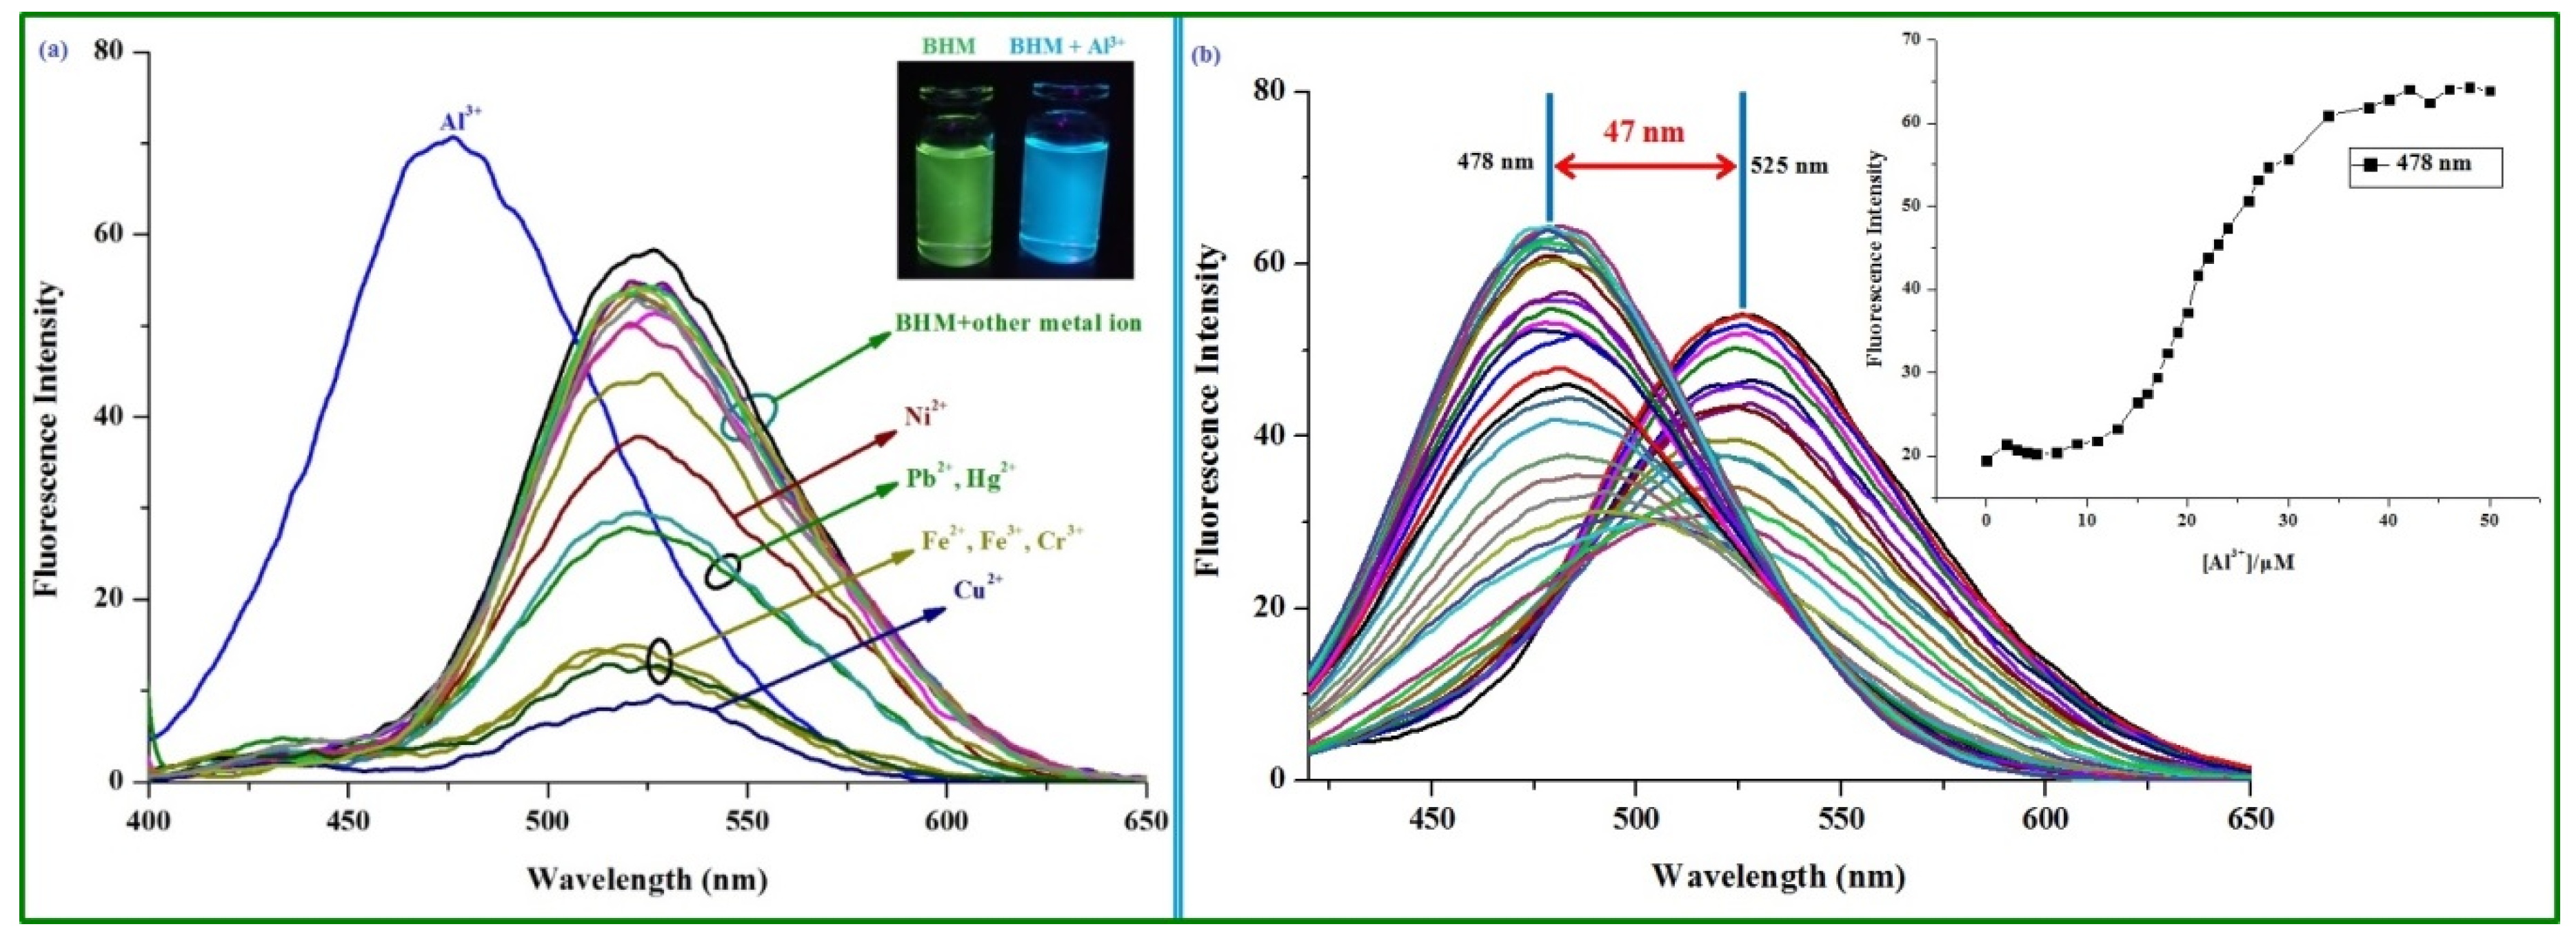
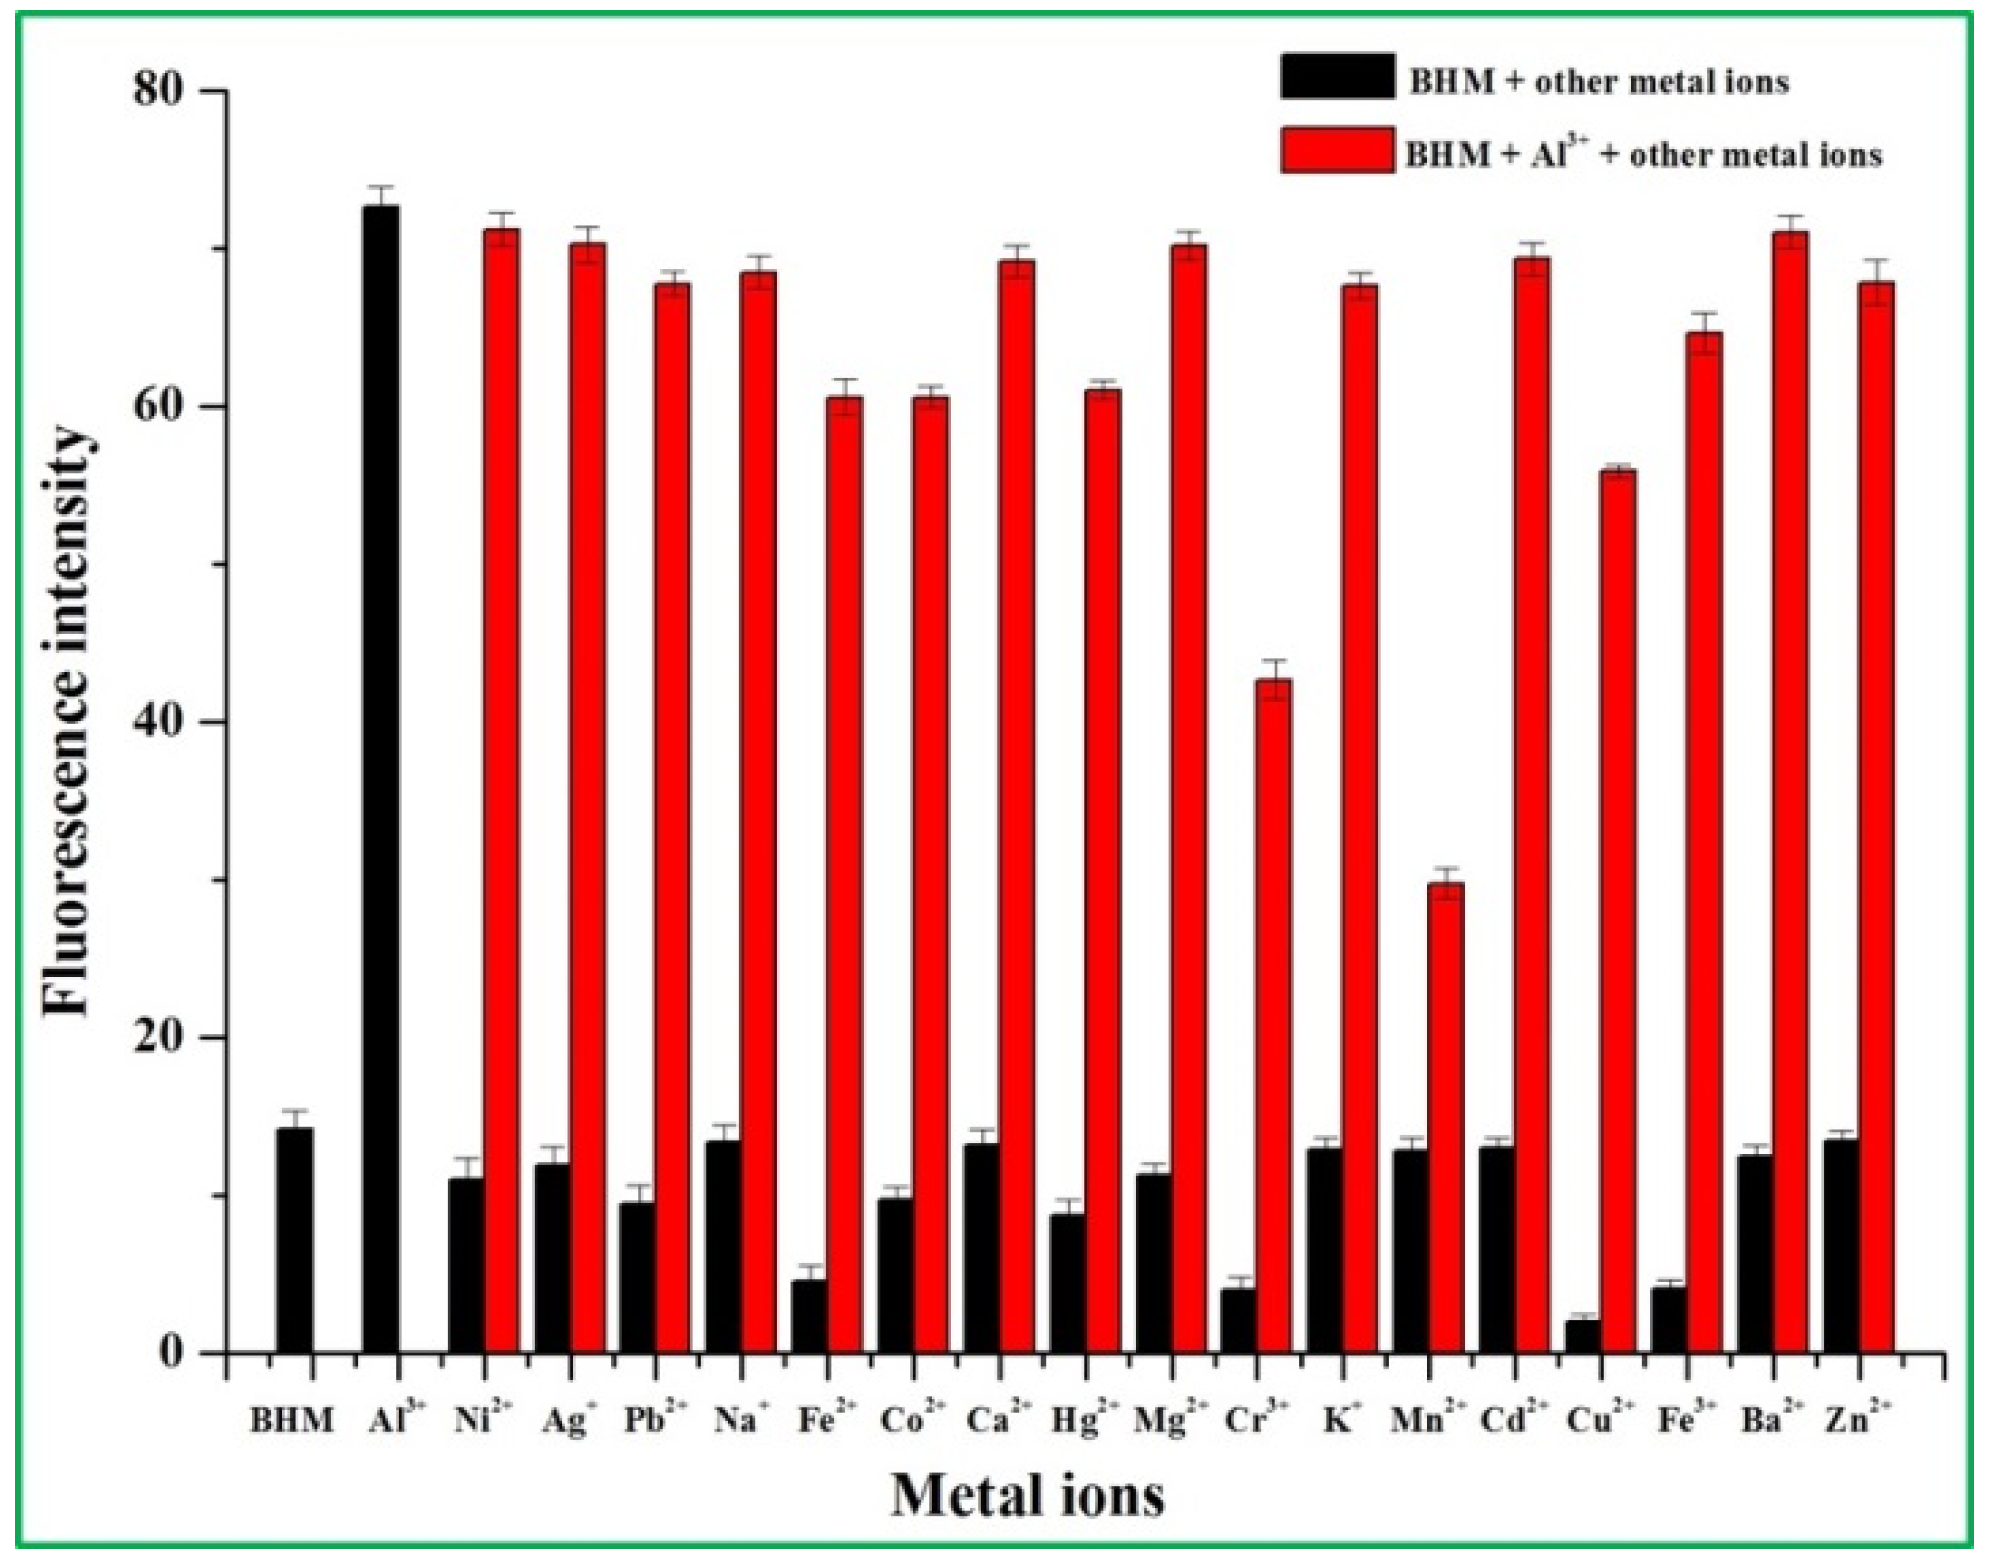
2.2. Spectra Performance Investigation of the BHM to Metal Ions

The selectivity of BHM (10 μM) to different metal ions (Na+, K+, Mg2+, Ca2+, Ag+, F e2+, Co2+, Ba2+, Mn2+, Cu2+, Zn2+, Cd2+, Hg2+, Ni2+, Pb2+, Cr3+, Fe3+, and Al3+) was firstly determined using UV-Vis spectrum in a solution of DMF:H2O (1:1, v/v) (Figure 2). The UV-Vis absorbance of BHM showed almost no change after the addition of the tested metal ions, except for Al3+ in DMF:H2O (1:1, v/v) (Figure 2a). As shown in Figure 2a, upon the addition of Al3+, an obvious blue-shift from an absorbance peak at 359 to 321 nm was observed compared to that of the BHM itself, which indicated the existence of a strong interaction between the BHM and Al3+. Furthermore, the absorbance titration result (Figure 2b) showed the absorbance centered at 359 nm was gradually decreased while the peak at 321 nm was gradually merged with the isosbestic point at 335 nm, indicating the formation of a BHM-Al3+ complex. A good relationship was detected between the absorbance ratios (A307:A359) (Figure S4) and the Al3+ concentration (0–12 μM) with a limit of detection (LOD) as low as 99 nM, explaining ratiometric detection by BHM of Al3+.
Moreover, the selectivity of BHM (10 μM) to the different metal ions mentioned above was also determined by the fluorescence spectrum in the solution of DMF:H2O (1:1, v/v) (Figure 3). The result showed that some ions, including Ni2+, Pb2+, Hg2+, Fe2+, Fe3+, Cr3+, and Cu2+, decreased the fluorescence intensity of BHM to different extents. However, the addition of Al3+ caused a significant blue-shift from 527 to 478 nm, accompanied by a color change from green to deep sky-blue (Figure 3a). This result indicated that the BHM had high selectivity to Al3+. Fluorescent titration (Figure 3b) through the gradual addition of Al3+ into the BHM solution DMF:H2O (1:1, v/v) showed that a significant blue-shift of 47 nm was observed, which might be attributed to the depression of the ICT process after coordination with the Al3+ [37]. Moreover, the good relationship between the fluorescent intensity (Em = 478 nm) of BHM (10 μM) and the Al3+ concentration (12–28 μM) (Figure S5) achieved a LOD (limit of detection was calculated using 3σ/k, where σ is the standard deviation of the blank measurements, and k is the slope of the intensity ratio versus the sample concentration plot) as low as 4.39 μM calculated according to previous methods [35,38].
A competition experiment was conducted to verify the ability of BHM under conditions of disturbance coming from other co-existing metal ions. As illustrated in Figure 4, only metal ions (including Cr3+ and Mn2+) disturbed the detection of Al3+.

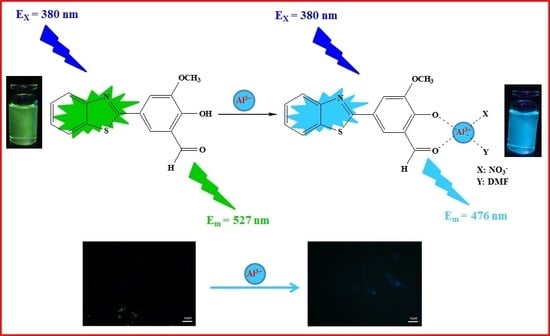
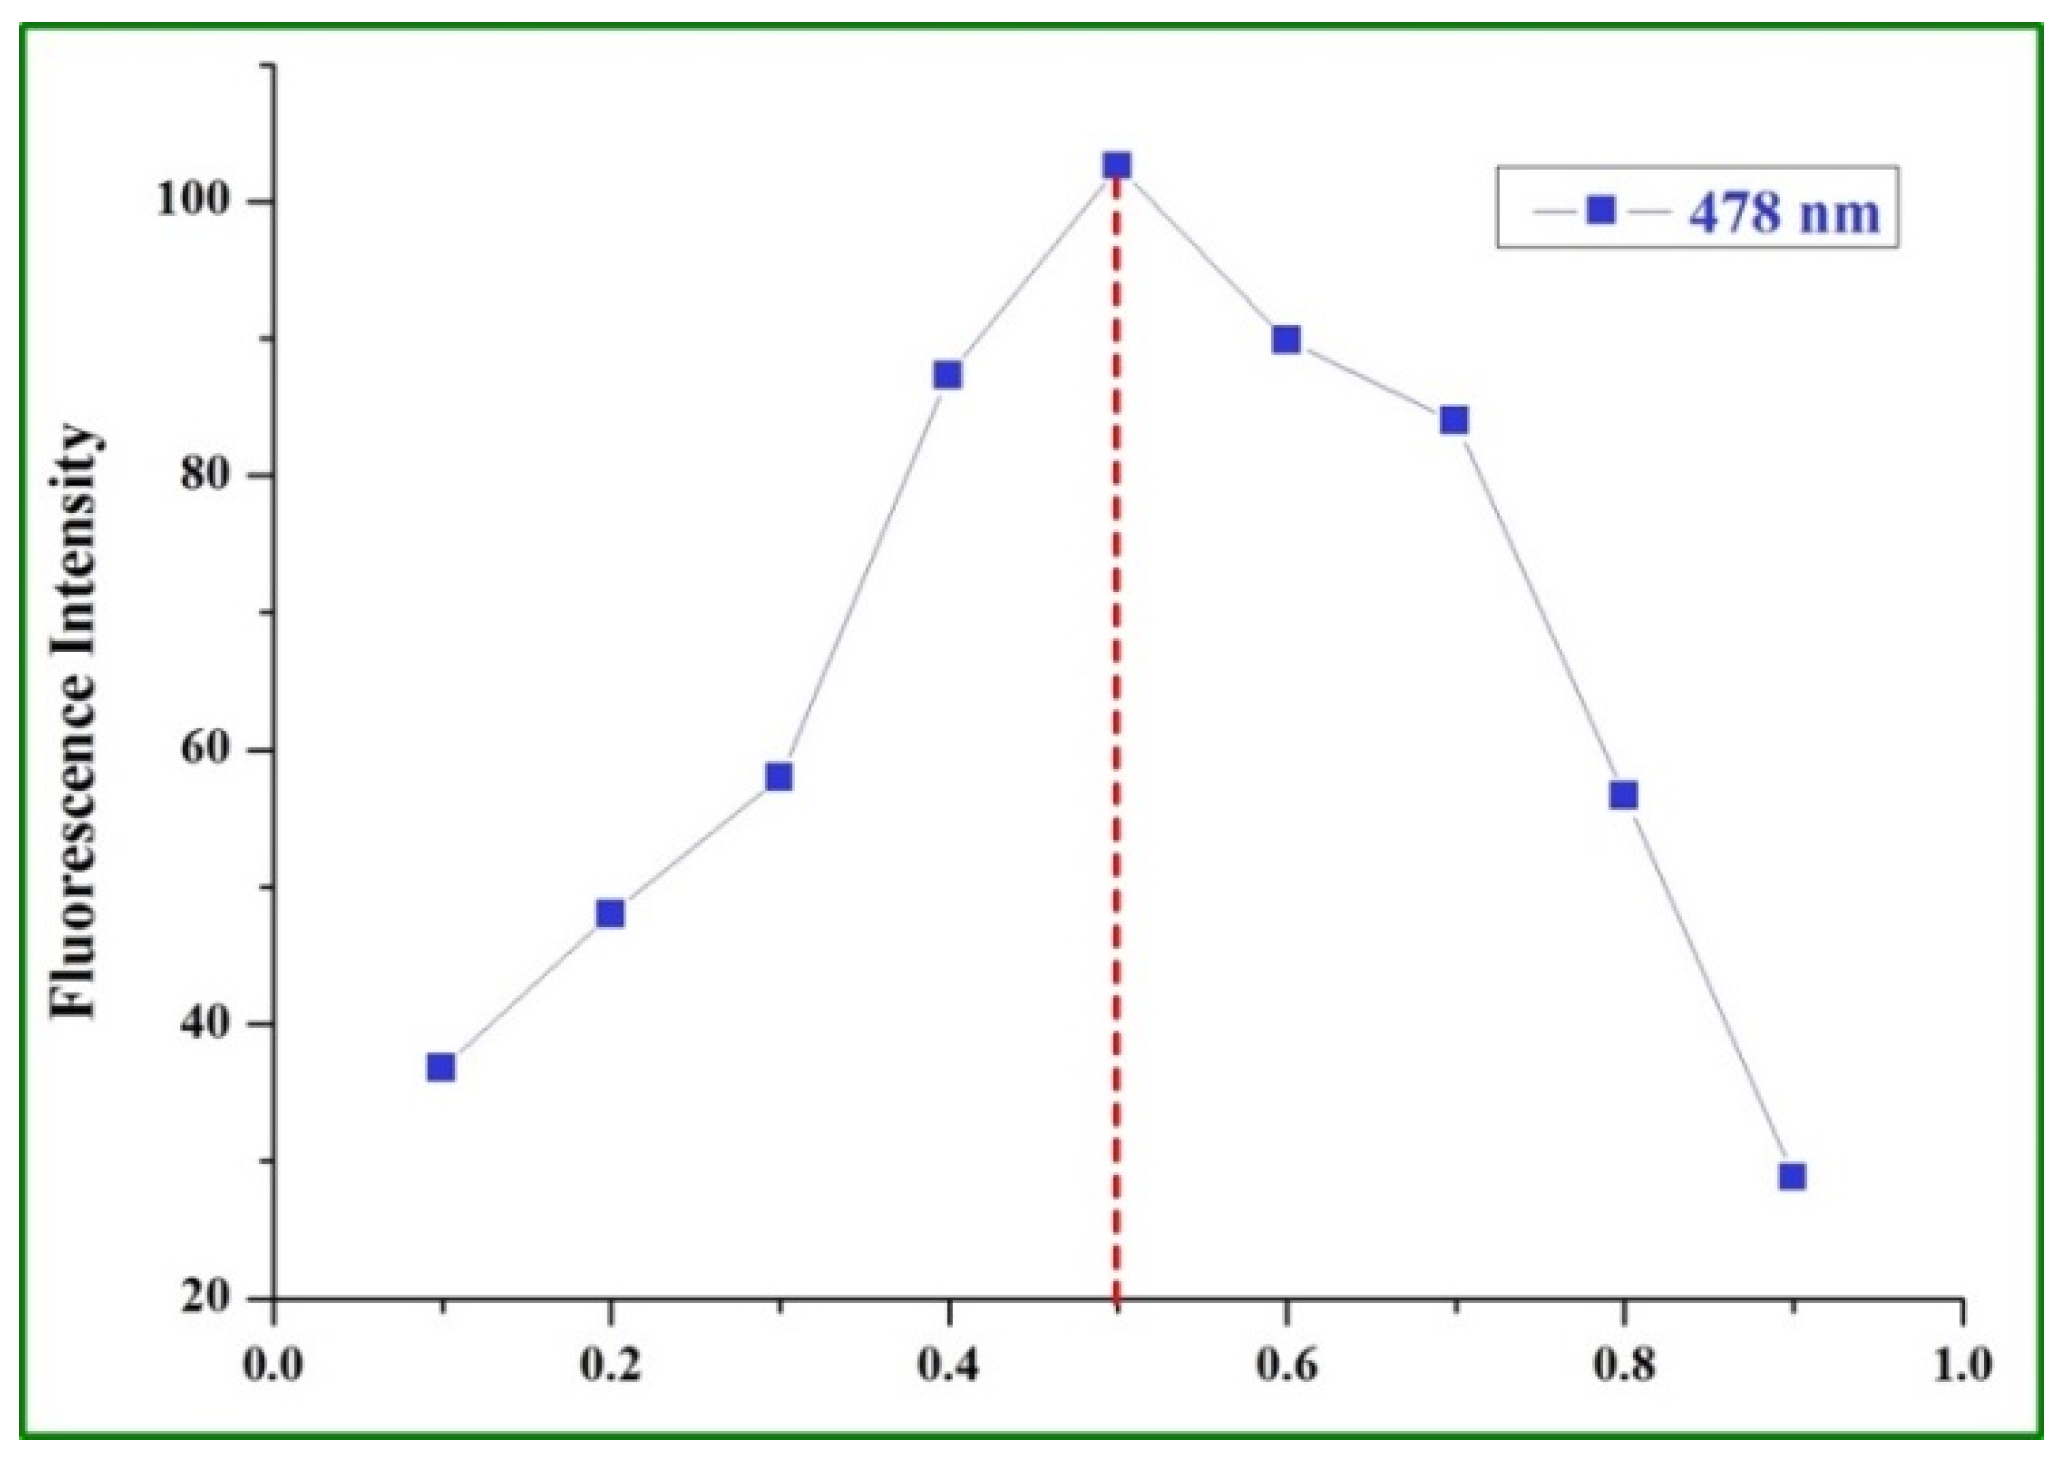
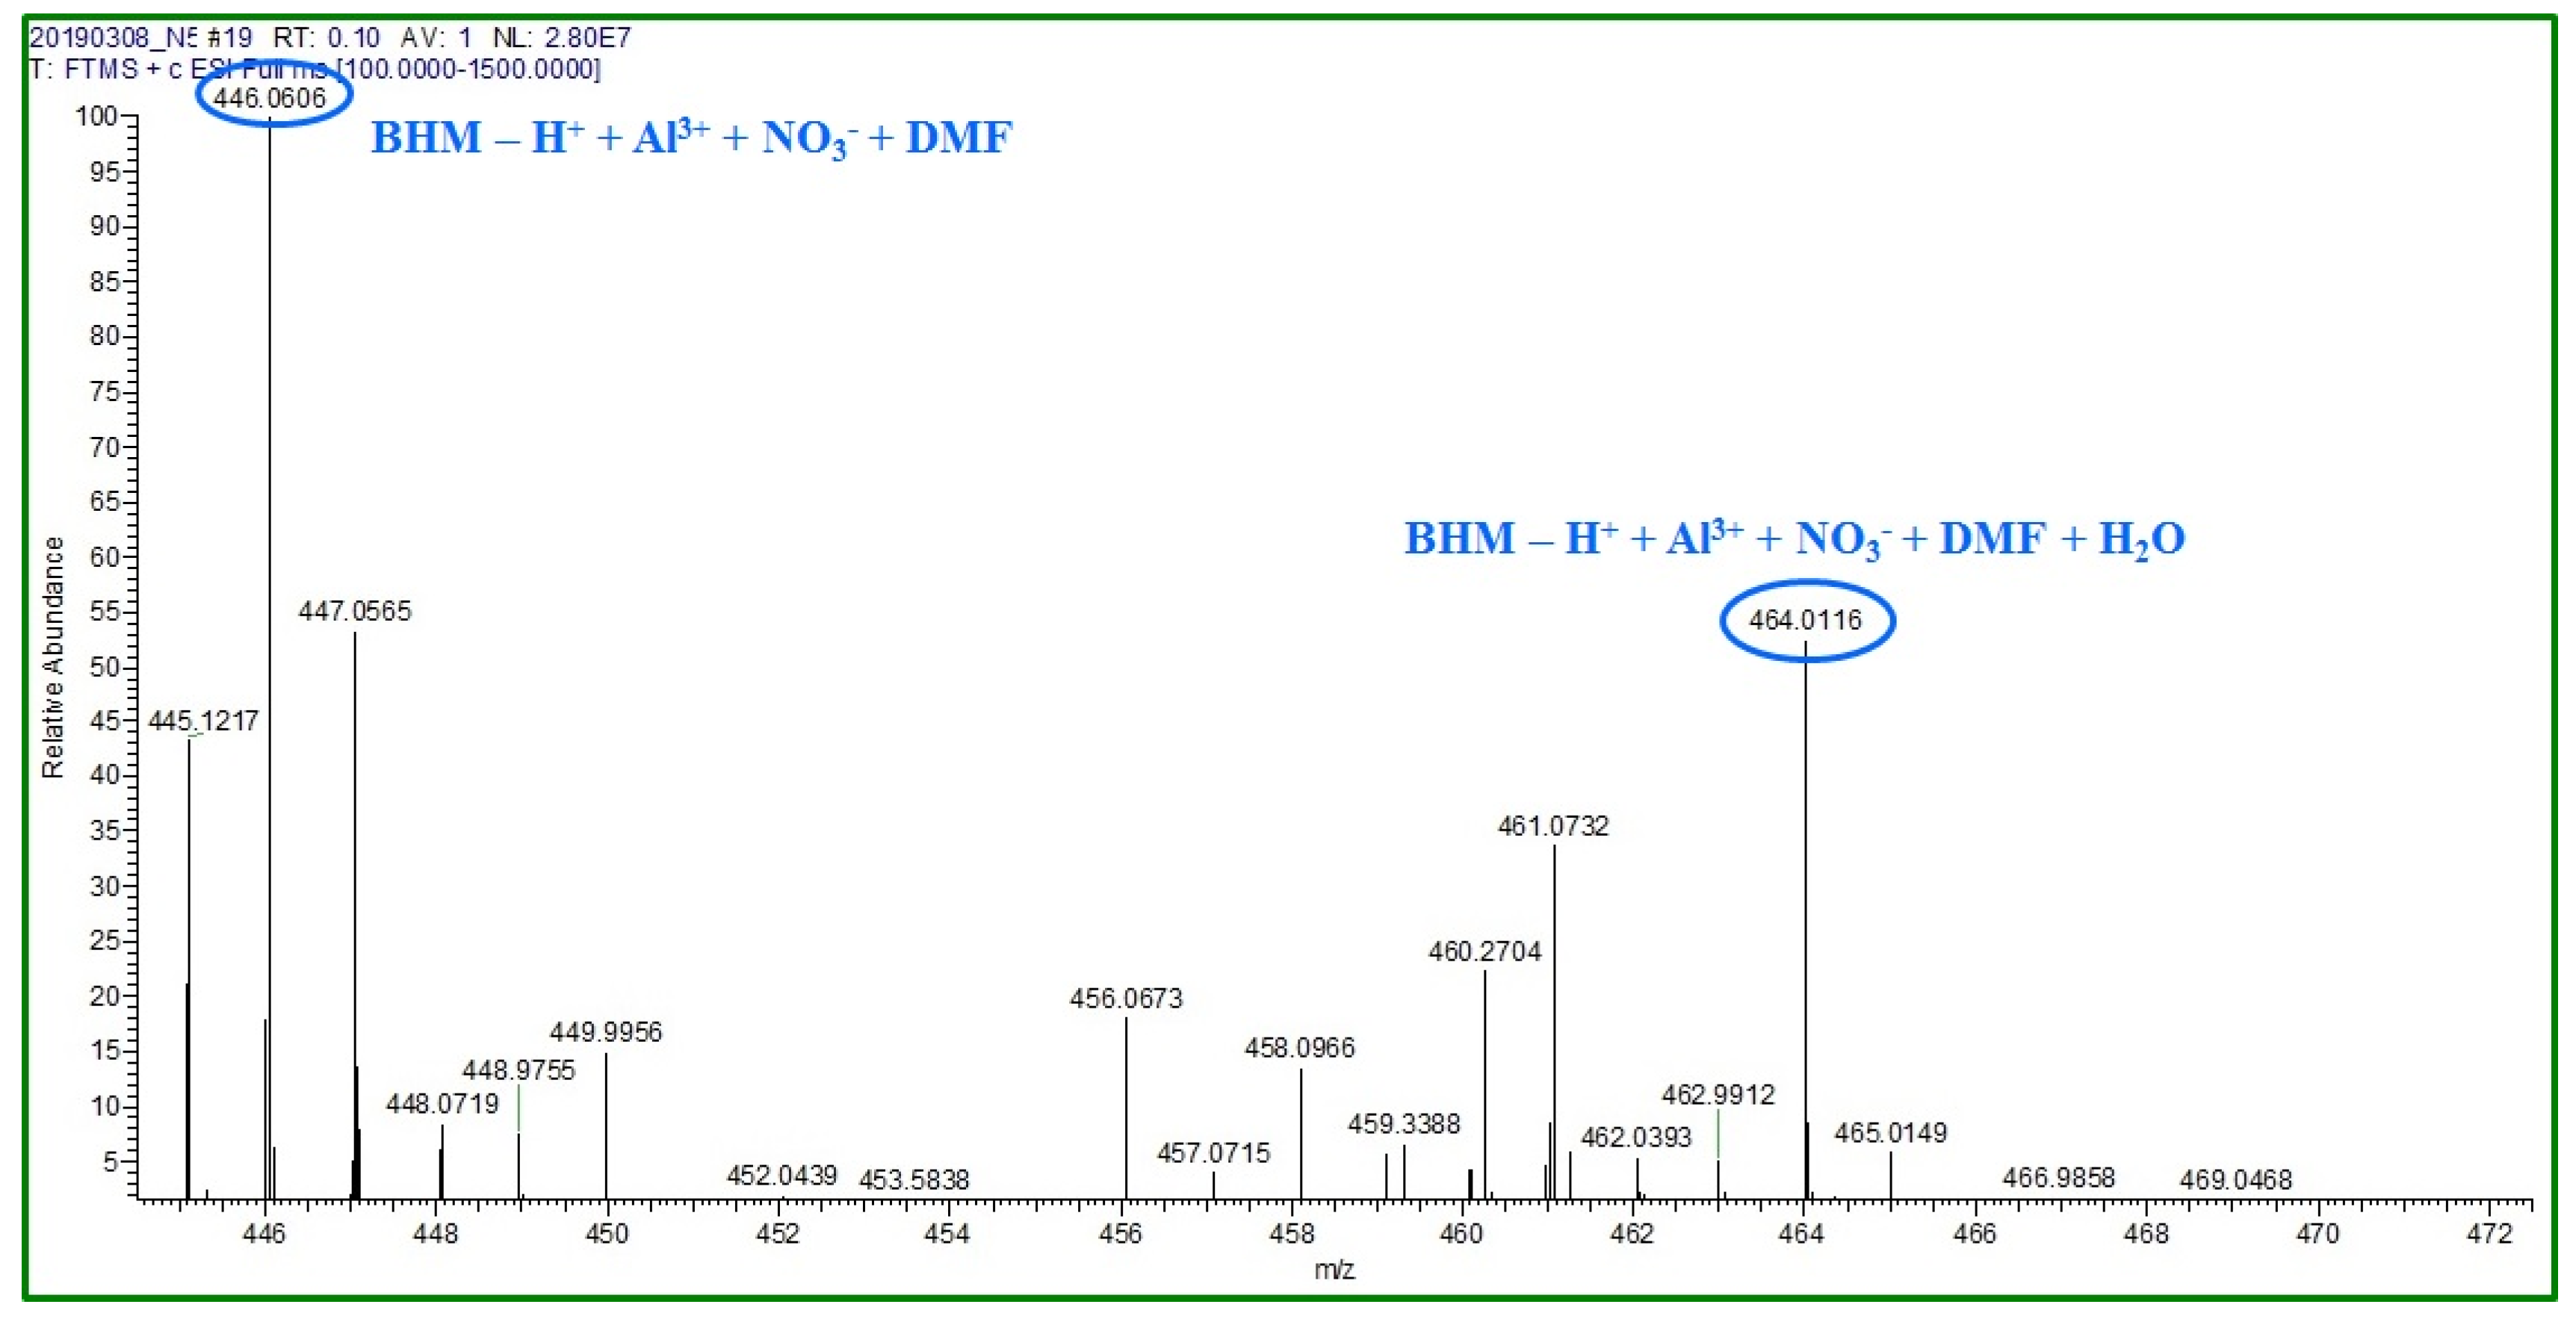
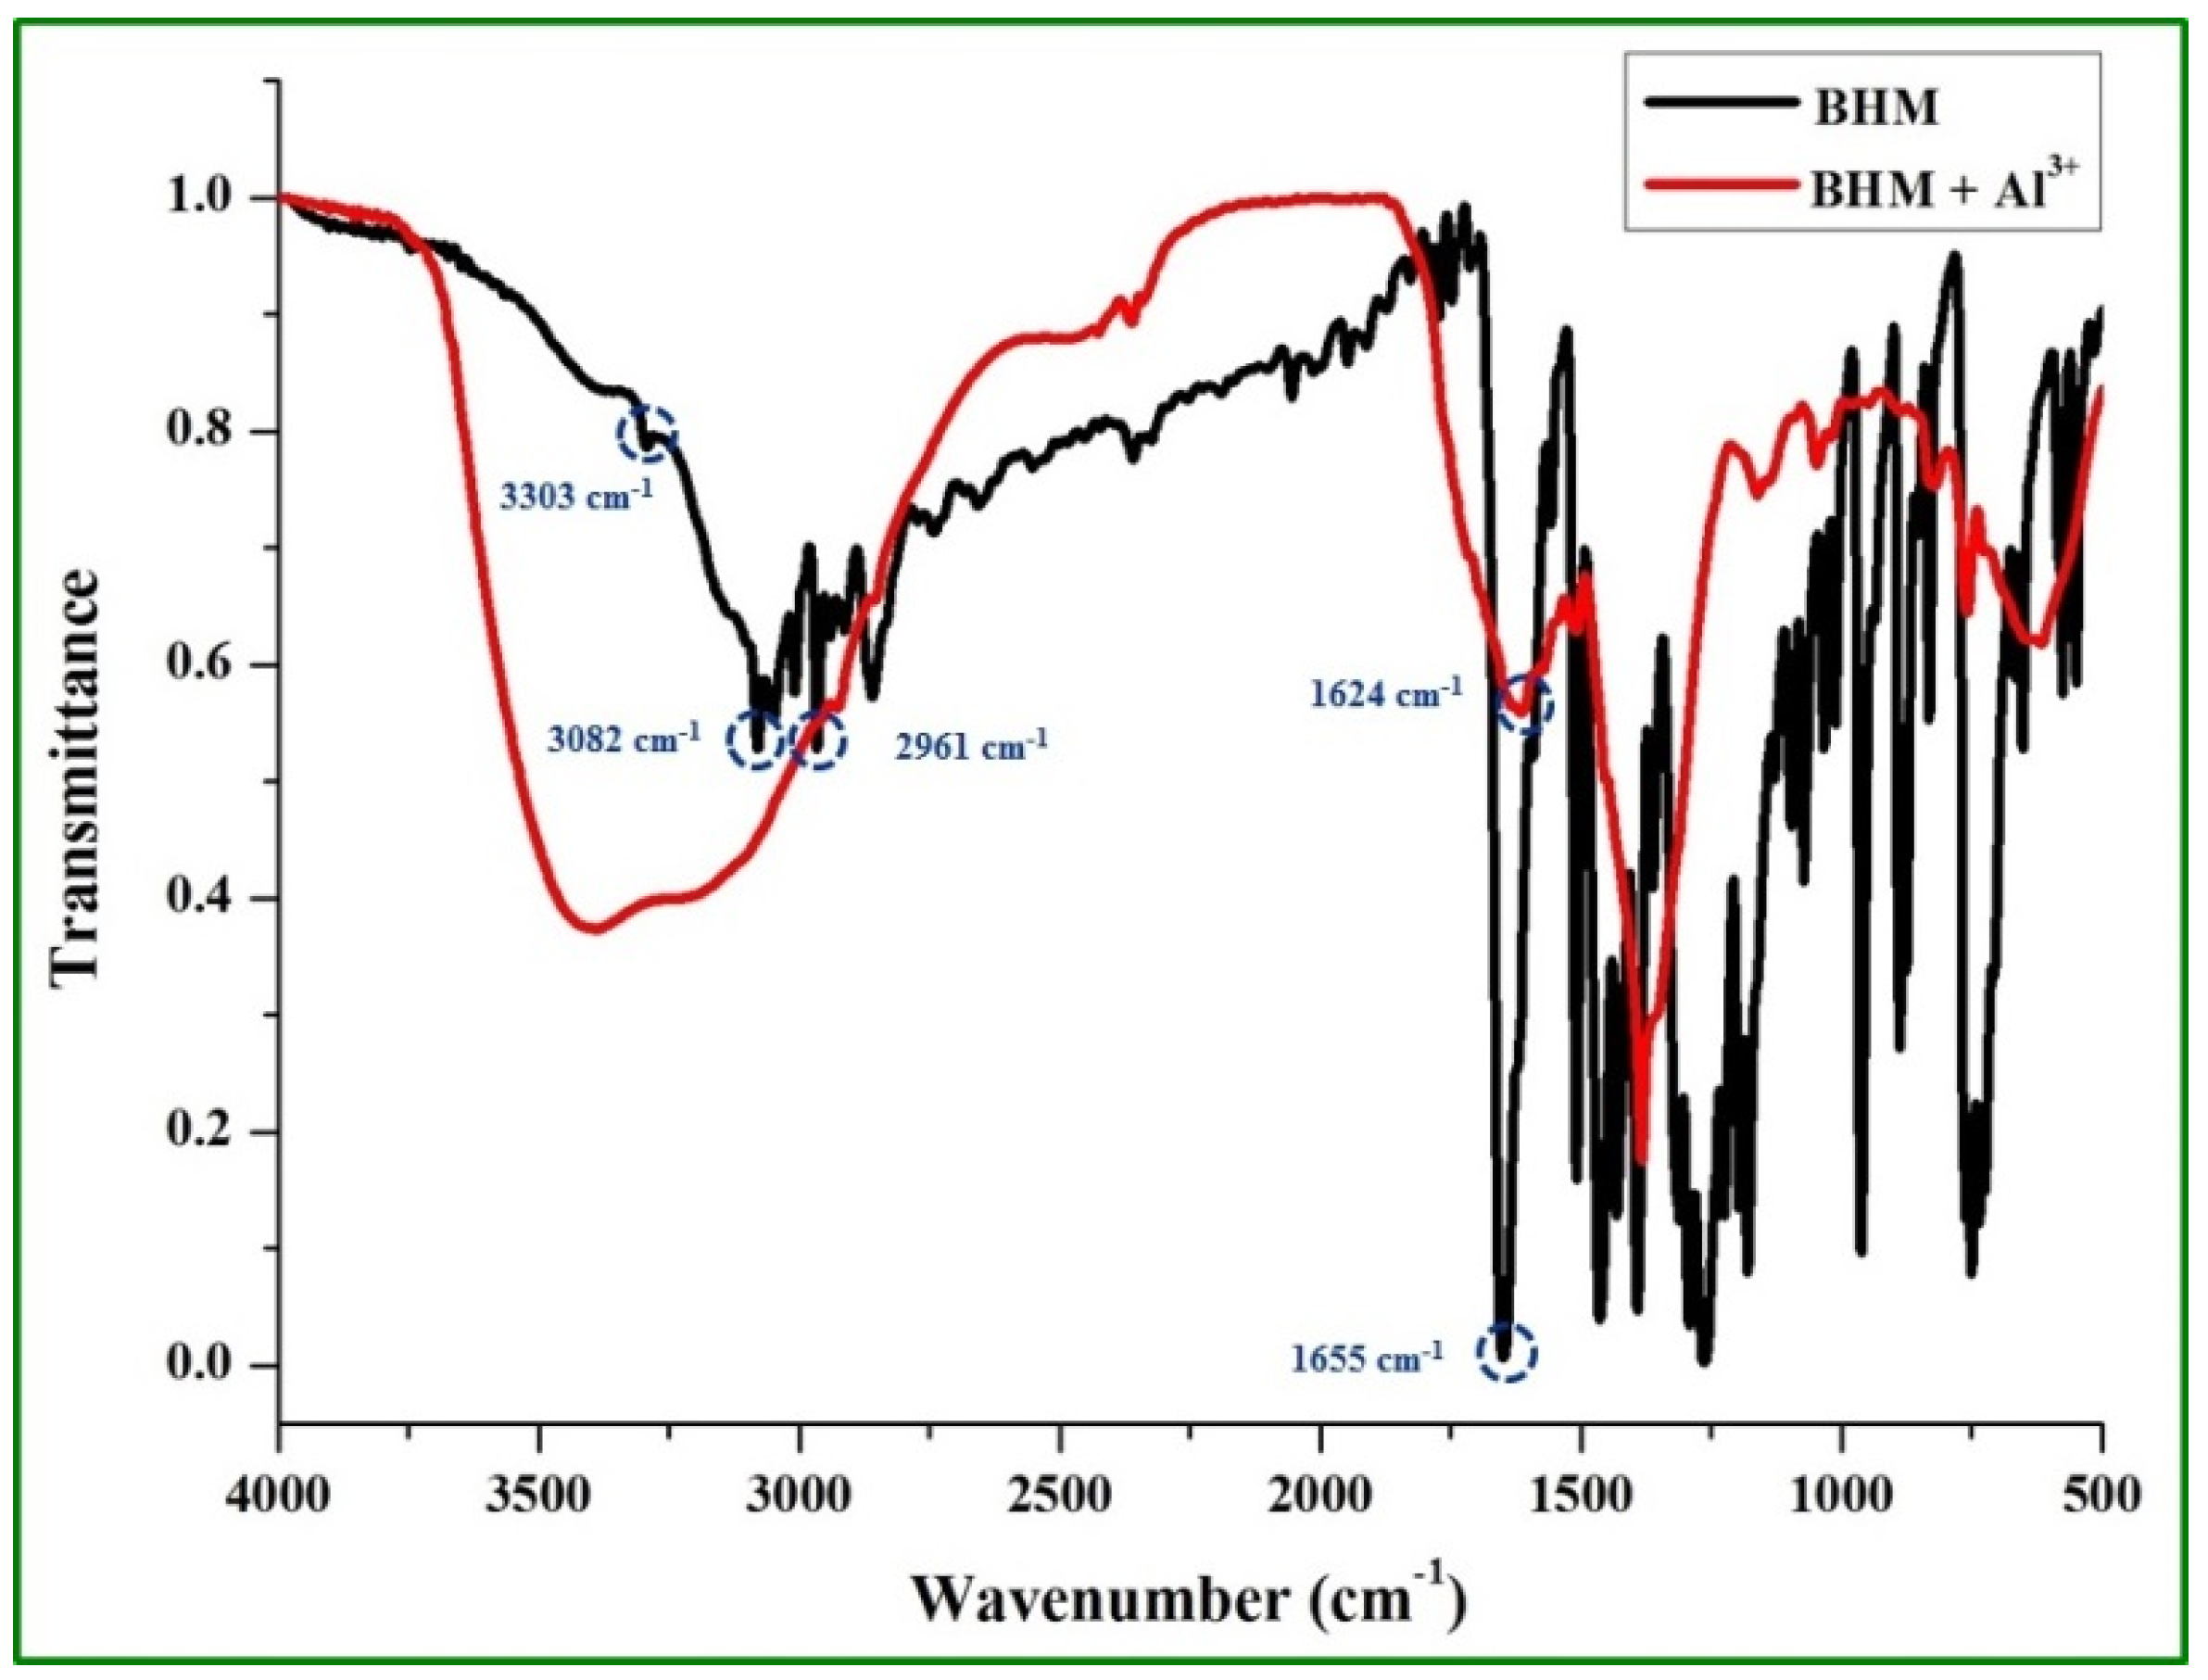
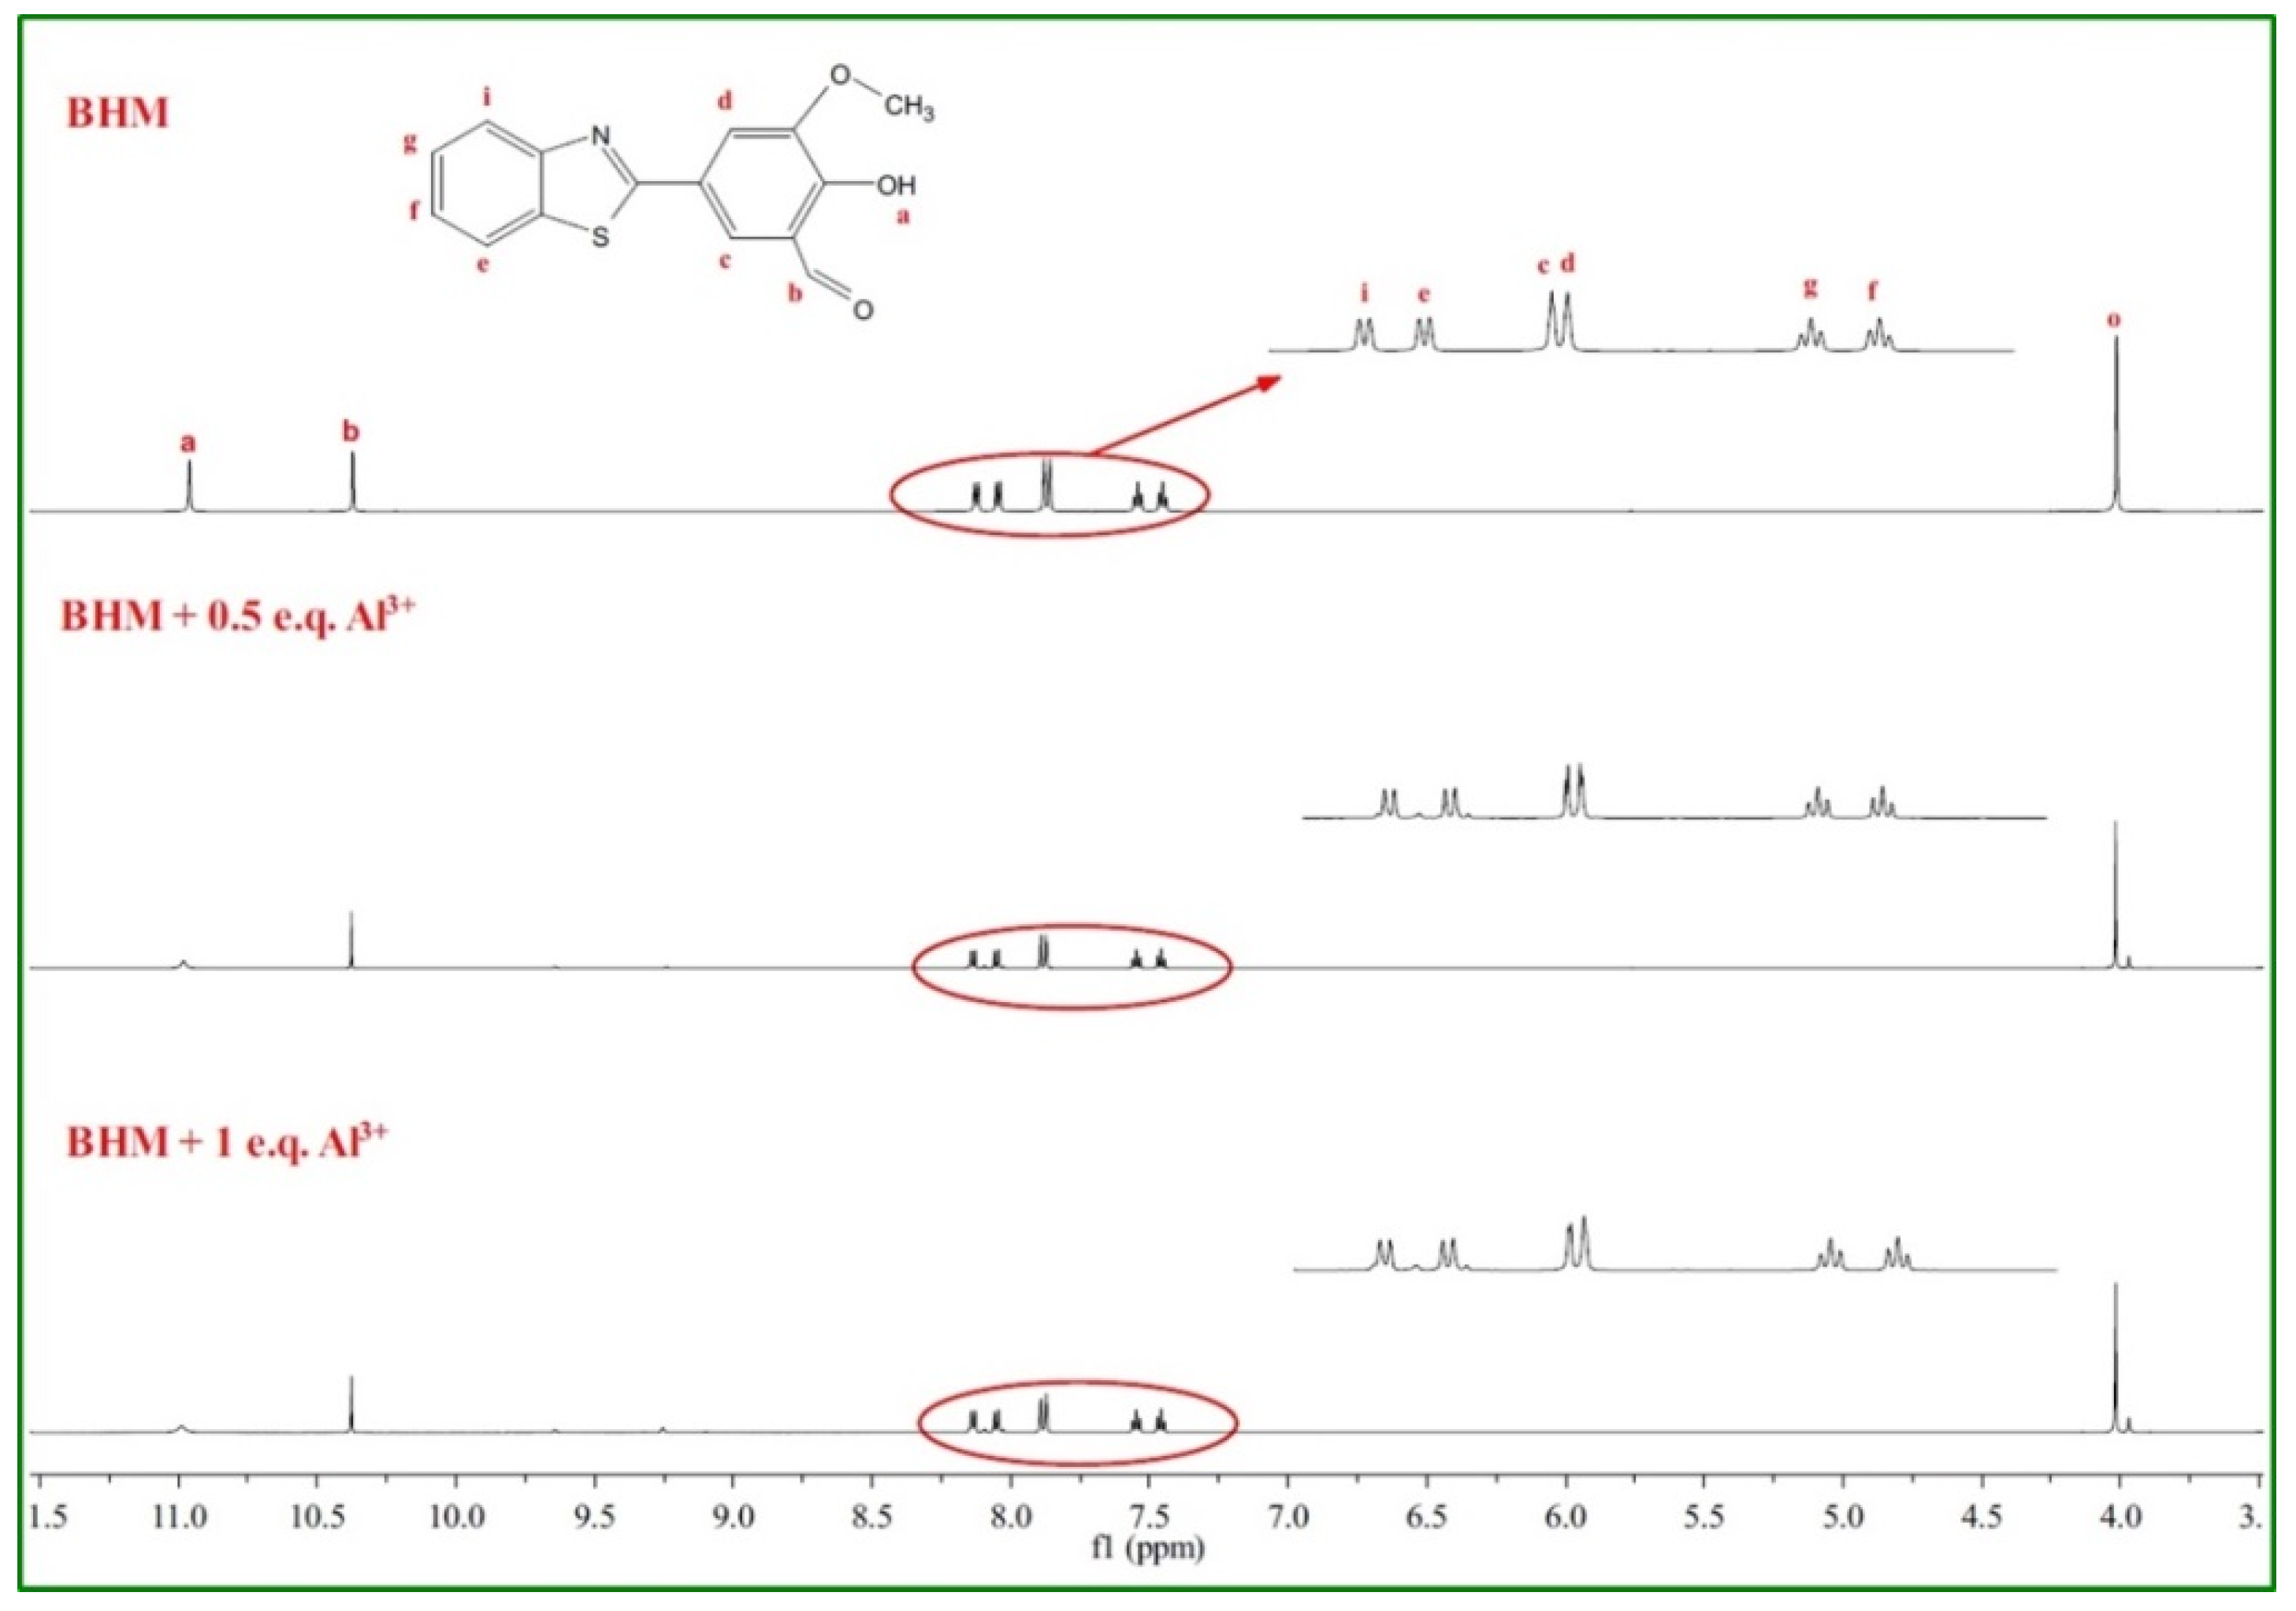
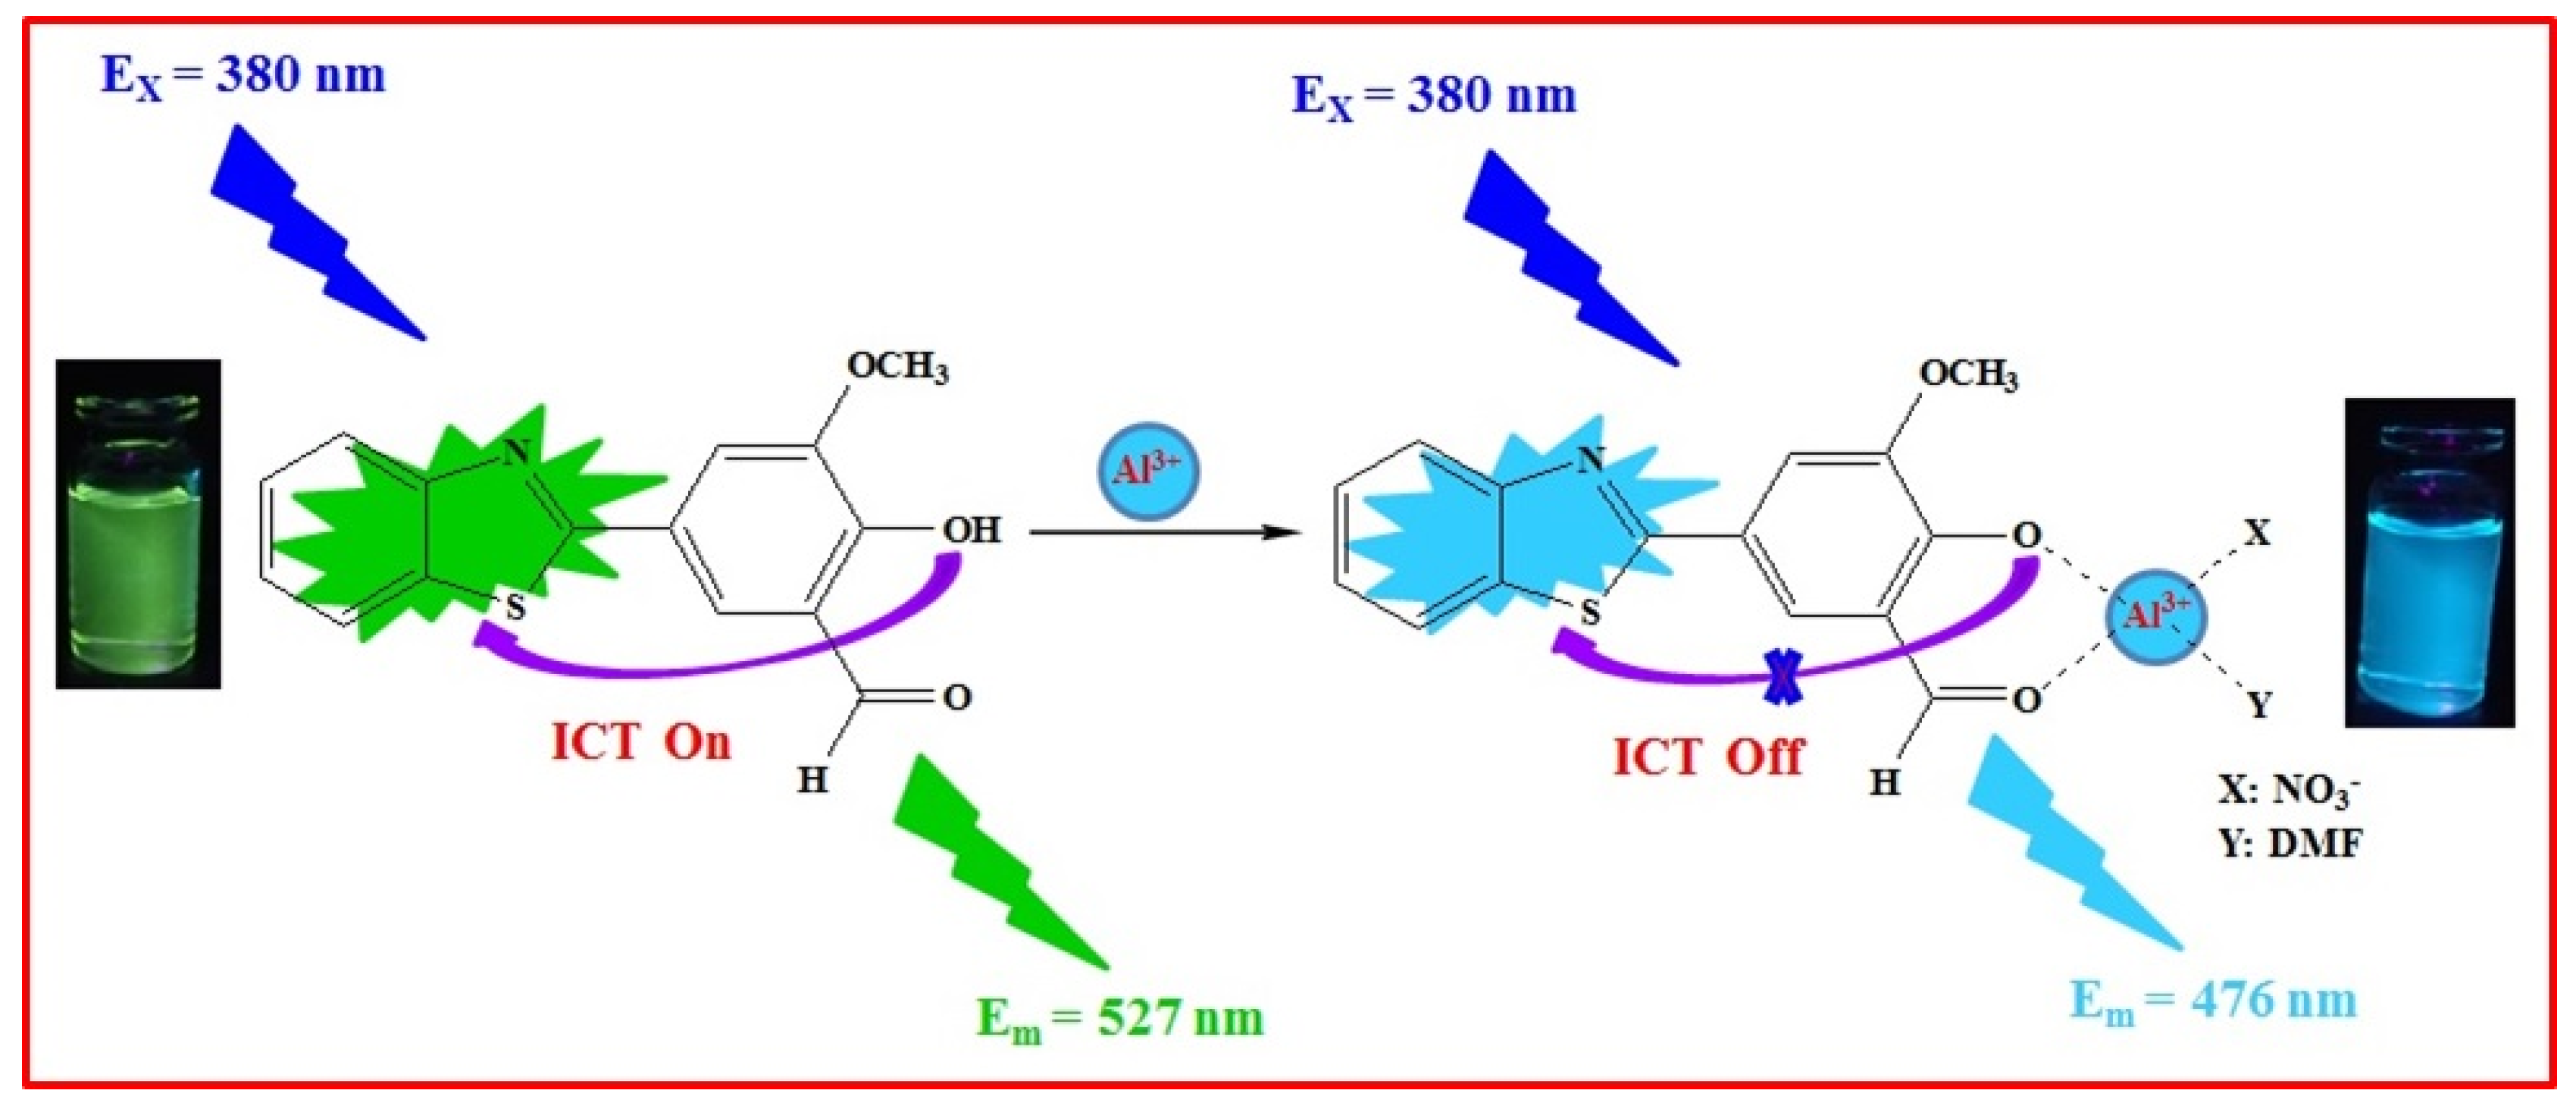
2.3. Sensing Mechanism of the BHM to Al3+

A Job plot was firstly carried out to determine the binding ratio between BHM and Al3+ (Figure 5). The result showed that the fluorescence intensity (recorded at 478 nm) of BHM reached a maximum when the proportion of BHM in the total concentration of BHM and Al3+ was 0.5, indicating that the binding ratio was 1:1 between BHM and Al3+. This result was further supported by the HRMS analysis displayed in Figure 6. Peaks at m/z 446.0606 and m/z 464.0116 were attributed to [BHM- H+ + Al3+ + NO3 + DMF]+ (Calcd: m/z 446.0603) and [BHM- H+ + Al3+ + NO3 + DMF + H2O]+ (Calcd: m/z 464.0708), respectively. Moreover, the binding constants of BHM and Al3+ were 1.88 × 10⁴ M−1 (Figure S6) and 7.49 × 10³ M−1 (Figure S7) based on the Benesi–Hilderbrand plot [39,40] recorded by the fluorescence and absorbance signals, respectively.
For explicit binding sites of BHM with Al3+, we measured the FT-IR spectrum of free BHM and complex BHM–Al3+ (Figure 7), respectively. The typical stretching vibration peaks of the BHM itself located at 3303 cm−1 and 1655 cm−1 were designated to the hydroxyl group (-OH) and carbonyl group (-C=O), respectively. For the FT-IR spectrum of the BHM–Al3+, the stretching bands of -OH turned into a broad peak, and the stretching band of C=O decreased significantly and shifted from 1655 cm−1 to 1624 cm−1. These results indicated that the coordination of Al3+ with oxygen atoms came from the hydroxyl group and carbonyl group, respectively.
1HNMR titration experiments were measured in DMSO-d6 to determine the binding sites of BHM with Al3+ further. The proton signals of the BHM itself were analyzed and are shown in Figure 8. After the addition of Al3+, the proton signal of hydroxyl (Ha) located at 10.96 ppm gradually disappeared, suggesting the deprotonation on hydroxyl during the combination of BHM with Al3+, in accordance with the result obtained by the FT-IR analysis.
Hence, according to the experiment results (including the Job plot, 1HNMR titration, and HRMS) mentioned above, the probable sensing mechanism is illustrated in Scheme 2.

3. Materials and Methods

3.1. Materials and Apparatus

All analytical reagent grade chemicals and solvents employed for the synthesis and characterization were procured from commercial sources and used as received without any treatment. Nuclear magnetic resonance (NMR) spectra were recorded on a Bruker 600 MHz (Beijing, China) system, and the chemical shifts were reported in ppm with Me4Si as the internal standard. High-resolution mass spectroscopy (HRMS) was carried out with negative ion modes on a Waters Xevo UPLC/G2-SQ Tof MS spectrometer (Shanghai, China). The FT-IR spectra were recorded on a Bruker ALPHA-T (Beijing, China) by dispersing samples in KBr disks, in the range of 4000–400 cm−1. The UV–Vis absorption and fluorescence spectra of the samples were measured on a Pgeneral TU-2550 UV-Vis Spectrophotometer (Suzhou, Jiangsu, China) and Perkin Elmer LS55 fluorescence spectrometer (Shanghai, China), respectively.

3.2. General Information

Stock solutions of the metal ions (Al3+, Fe3+, Cr3+, Ca2+, Pb2+, Cd2+, Cu2+, Co2+, Zn2+, Fe2+, Mn2+, Mg2+, Ni2+, Hg2+, Na+, K+, Ag+) from the nitrate, chloride, or perchlorate salts were prepared with ultrapure water. BHM (0.1 mM) was dissolved in DMF, which was then diluted by adding ultrapure water to 10 μM. The diluted solution DMF:H2O (1:1, v/v) was used for the spectra measurement in UV-Vis and fluorescence. The excitation wavelength (Ex = 380 nm) was used for the fluorescence experiments, and the slits, including excitation and the emission, were all set to 10 nm.

3.3. Synthesis

Compounds 3 and BHM were synthesized according to the methods described in References [34,36].

3.3.1. Synthesis of Probe BHM (5-(benzo[d]thiazol-2-yl)-2-hydroxy-3-methoxybenzaldehyde)

The mixture of compound 3 (500 mg, 1.94 mmol) and hexamethylenetetramine (1.37 g, 9.75 mmol) in trifluoroacetic acid (15 mL) was refluxed for 8 h. After the completion of the reaction, distilled water (30 mL) was added and then stirred for 1 h. The precipitate was filtered off and further purified by silica gel column chromatography using CH2Cl2:CH3OH (20:1, v/v) as eluent to obtain the compound BHM (359 mg, 1.26 mmol). Yield: 65%. m.p.: 219.8–220.5 °C.
1H NMR (600 MHz, DMSO-d6) (Figure S1) δ (ppm) 10.96 (s, 1H), 10.37 (s, 1H), 8.13 (d, J = 7.8 Hz, 1H), 8.04 (d, J = 8.4 Hz, 1H), 7.88 (s, 1H), 7.86 (s, 1H), 7.54 (t, J = 7.2 Hz, 1H), 7.52 (t, J = 7.8 Hz, 1H), 4.02 (s, 3H). 13C NMR (151 MHz, DMSO-d6) (Figure S2) δ (ppm) 191.08, 166.95, 153.96, 153.90, 149.69, 134.79, 127.12, 125.83, 124.67, 123.11, 123.08, 122.75, 119.56, 114.47, 56.86. HRMS (m/z) (TOF MS ES-, Negative Ion Modes) (Figure S3): calcd for C15H10NO3S-: 284.0381 [M-H+]-, found: 284.0385.

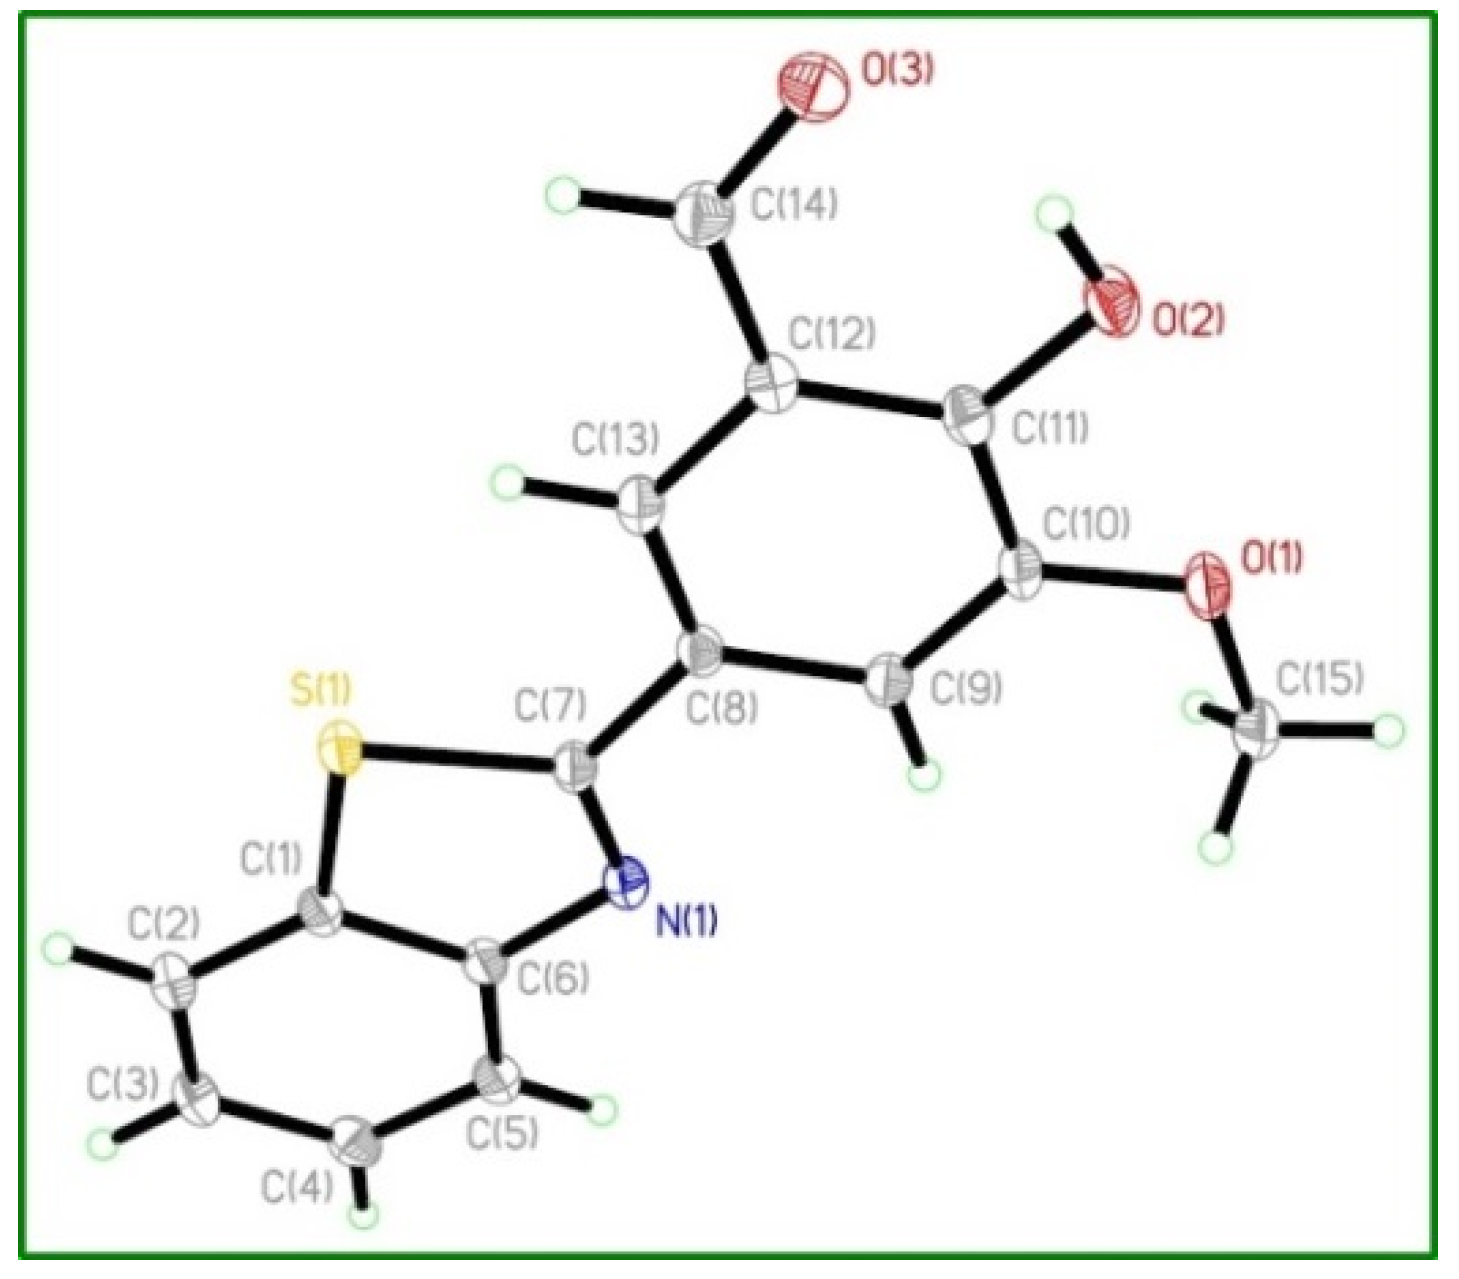
3.3.2. Preparation of the Crystal BHM

BHM (285 mg, 0.1 mmoL) was dissolved in ethanol (10 mL), and the mixture was refluxed for 1 h. After cooling to room temperature, the solution was filtered, and the filtrate was kept at room temperature for 3 days to obtain single crystals of BHM that were suitable for X-ray analysis.

3.4. Cell Culture and Staining

The fibroblast cell line, human stromal cell line (HSC), was purchased from ATCC (CRL-4003). For maintained HSC, the cells were routinely cultured in mixture medium (DMEM: F-12 = 1:1) that was supplemented with 10% heat-inactivated FBS, 100 U/mL penicillin, 100 μg/mL streptomycin, and 1 mM sodiumpyruvate at 37 °C, 5% CO2. The HSC was placed in 6-well plates with sterile cover glass at a concentration of 105 cells/well; and after 48 h, the media was changed to being without FBS or antibiotics for chemical treatment. These cells were incubated for 2 h using different amounts of Al3+ (10 and 100 μM). Then, fibroblast cells were washed with D-Hank’s salt solution 3 times. Before staining with BHM, the cells were fixed using a standard paraformaldehyde fixation protocol and then rinsed with 5:5 mixture solutions of DMF and water. Then, the cells were stained by incubating for 2 h with BHM (1 × 10⁻⁵ M). Lastly, the cover glass was mounted over slide glass with an anti-fluorescence quenching agent and imaged using fluorescence microscopy.

3.5. X-Ray Diffraction Studies

The data collections of the single crystal X-ray diffraction of BHM (0.24 × 0.23 × 0.2 mm) were carried out on a Rigaku AFC-10/Saturn 724 + CCD diffractometer with graphite-monochromated Mo Kα radiation (λ = 0.71073 Å), using the multi-scan technique. The structures were determined by direct methods using SHELXS-2014 and refined by full-matrix least-squares procedures on F2 with SHELXL-2014. A total of 9673 integrated reflections were collected, and 2896 were unique in the range with Rint = 0.0434 and Rsigma = 0.0409. The maximum/minimum residual electron density = 0.396/−0.428 eÅ−3. Structural information was deposited with the Cambridge Crystallographic Data Center (CCDC 1902058).

4. Applications

4.1. Application in Water Samples

BHM for the determination of Al3+ was carried out in a real water sample to verify its practical application. The water samples were collected from the campus of our university and the Songhua River in Heilongjiang Province. Then, Al3+ at different levels (15–20 μM) was mixed with the water samples. The fluorescence responses of the BHM were recorded for sensing Al3+ at 478 nm (Figure 8). The results showed that with the increase in the concentration of Al3+ in the tested samples (including ultrapure water, tap water, and Songhua water), the fluorescence intensity increased gradually, and good linearity was found between the fluorescence intensity and Al3+ over the concentration range of 15–20 μM (Figures S9–S11). The desirable recovery and relative standard deviation (RSD) values (Table 1) indicated that BHM could be applied in the quantitative analysis of real water samples for the detection of Al3+.

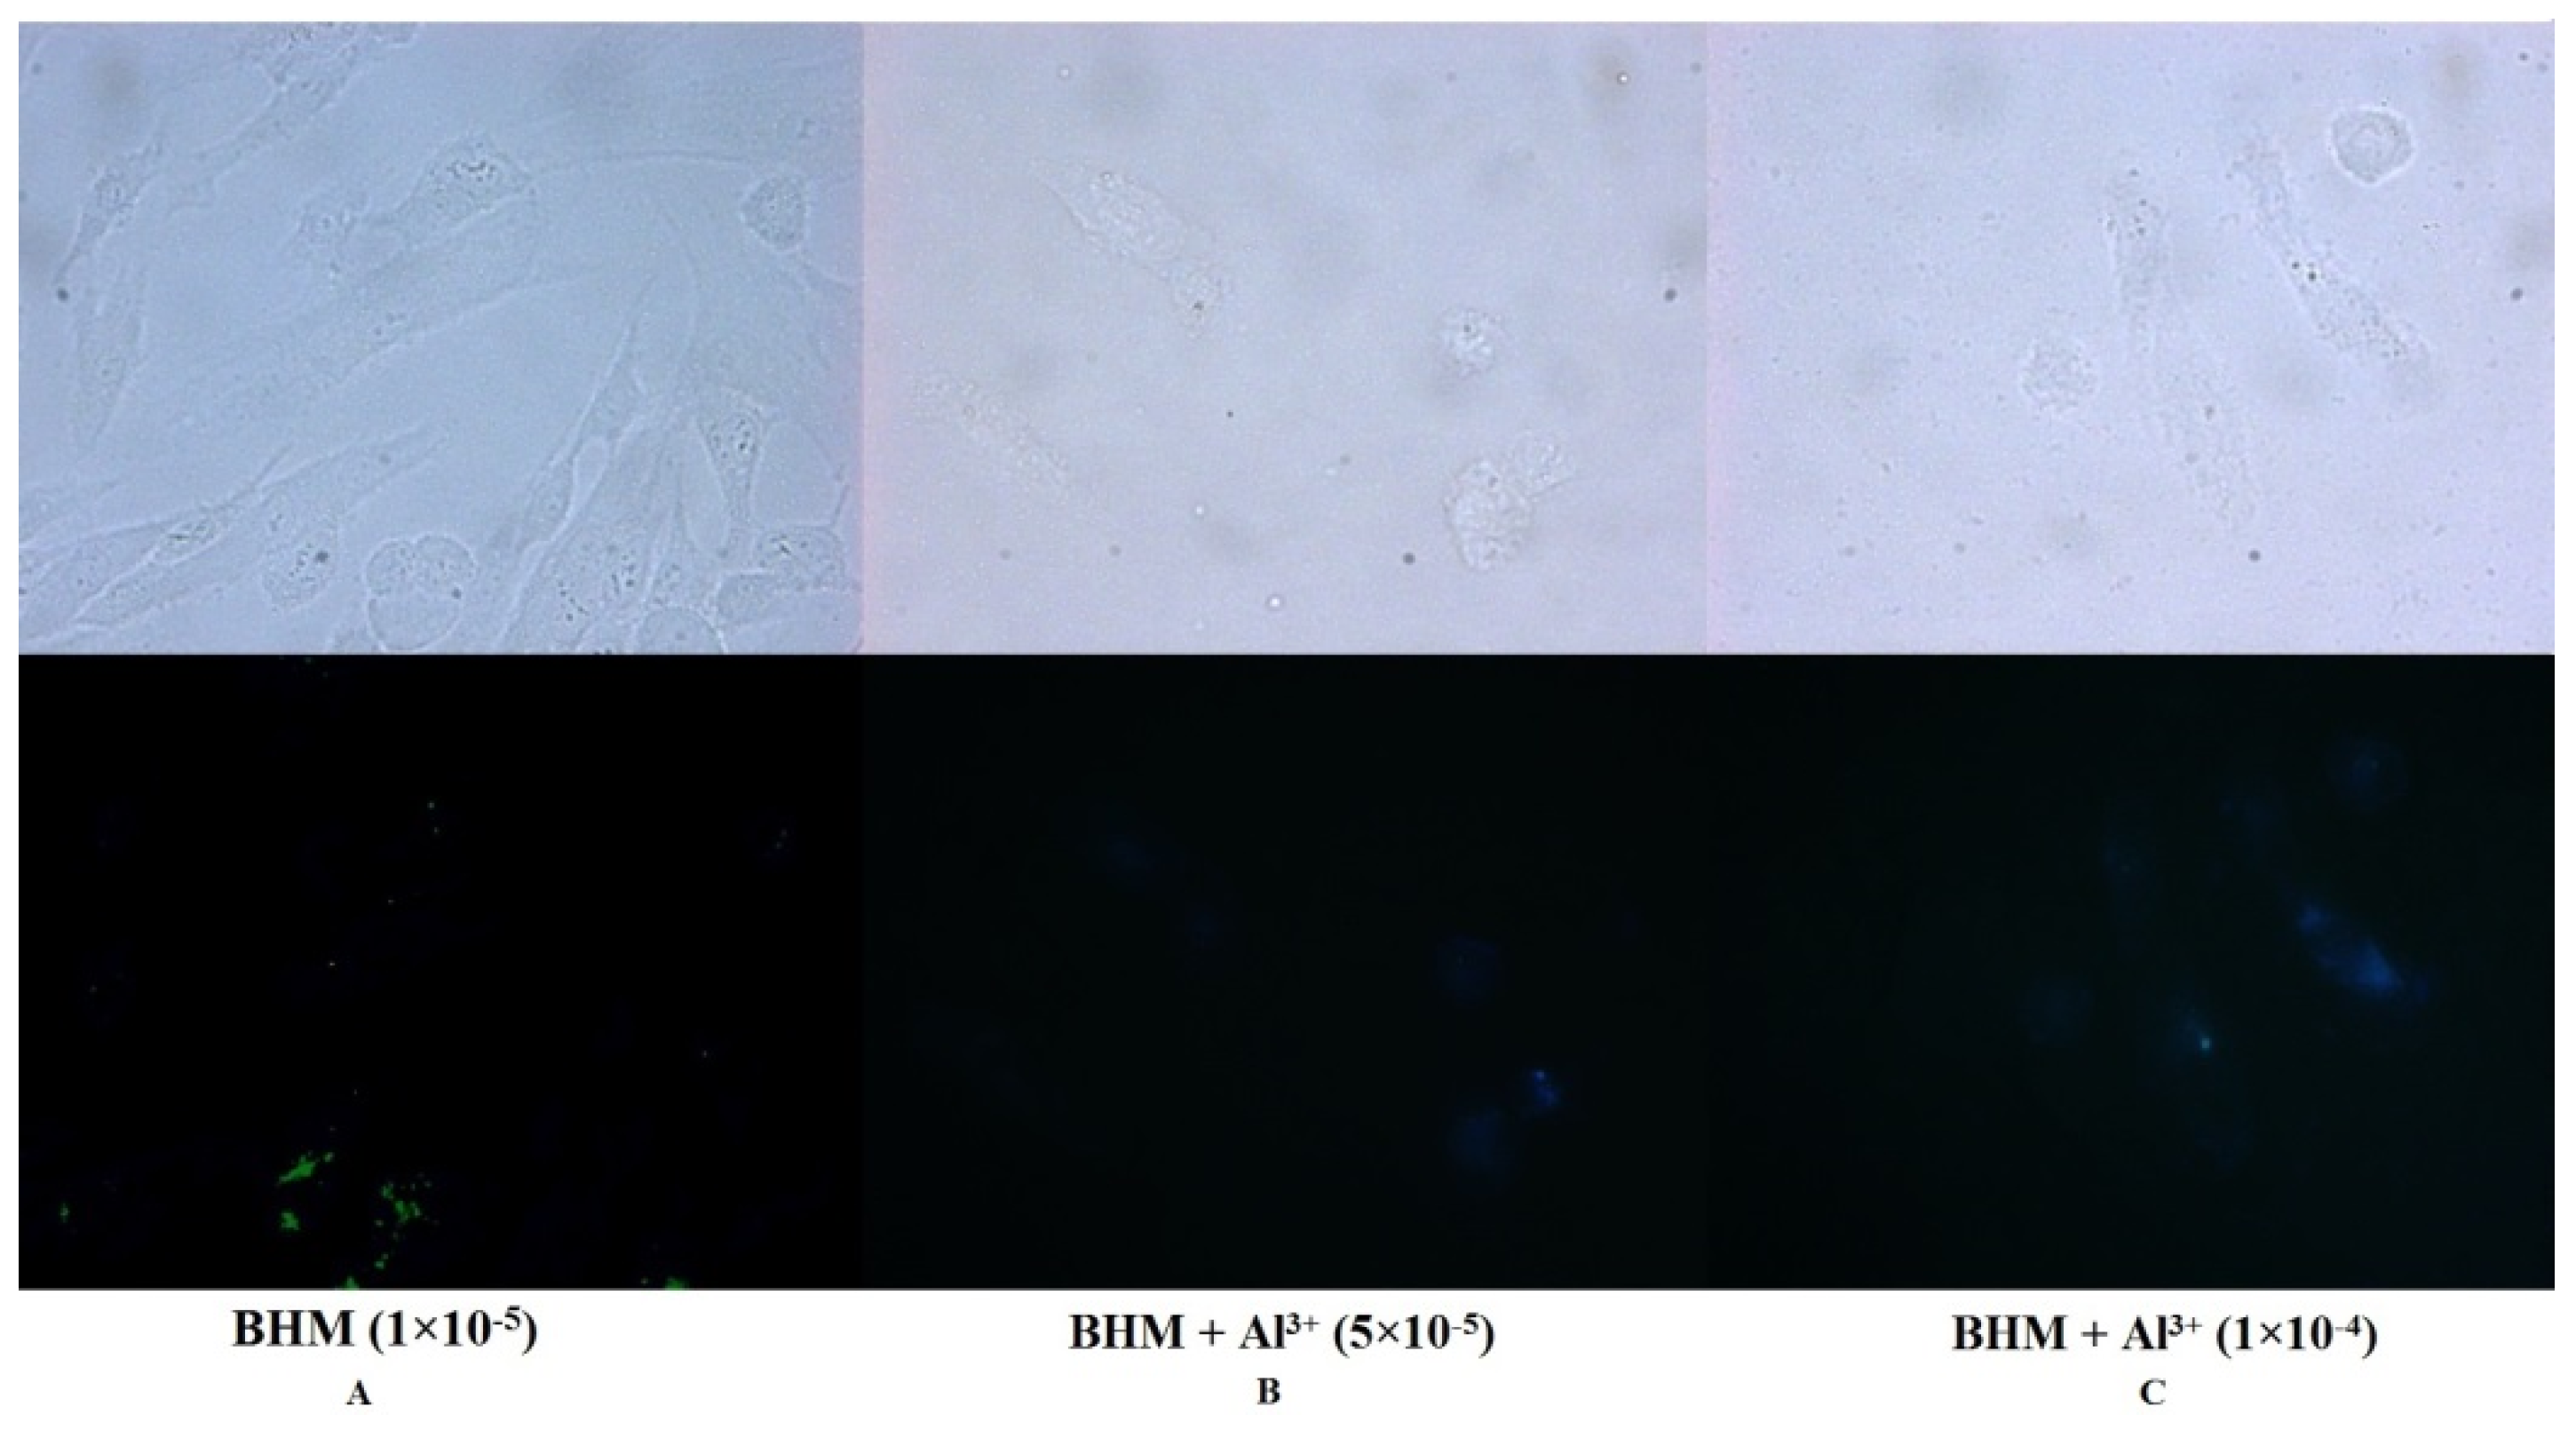
4.2. Application in Cell Imaging

Monitoring metal ions in biological systems is an important aspect in the evaluation of a probe’s application ability. Therefore, human stromal cells (HSC) were employed for incubation using different amounts of Al3+ and BHM (10 μM) for a certain time and then imaged using fluorescence microscopy. As shown in Figure 9A, the cells displayed green fluorescence after incubation with BHM (10 μM) for 2 h. However, after incubation with Al3+ (50 μM) and BHM (10 μM), weak blue fluorescence was detected (Figure 9B). The blue fluorescence intensity increased when the cells were treated with a higher concentration of Al3+ (100 μM) in the presence of the same concentration of BHM (10 μM) (Figure 9C). These results indicated that BHM could be used as an Al3+ monitor in biological systems.

5. Conclusions

In summary, an easily prepared benzothiazole-based probe BHM was prepared and characterized. The BHM displayed high selectivity and sensitivity for Al3+ in DMF:H2O (1:1, v/v) through an obvious blue-shift in the fluorescent spectrum and significant color change detected by the naked eye, respectively. The binding ratio of BHM with Al3+ was 1:1, as determined by the Job plot, where the binding details were investigated by FT-IR, 1H NMR titration, and ESI-MS analysis. Furthermore, BHM was successfully applied in the detection of Al3+ in the Songhua River, on a test stripe, and in human stromal cells (HSC).

Supplementary Materials

The following are available online at https://www.mdpi.com/1422-0067/20/23/5993/s1.

Author Contributions

Conceptualization, Z.-Y.X.; methodology, Z.-Y.X.; X.-J.S.; and T.-T.L.; formal analysis, Z.-N.T. and D.-Q.W.; writing—original draft preparation, Z.-N.T. and X.-J.S.; writing—review and editing, Z.-Y.X. and T.-T.L.

Acknowledgments

This work was supported by the Students’ Innovation and Entrepreneurship Training Program of the Northeast Agricultural University (No. 201910224325) and the Postdoctoral Scientific Research Developmental Fund of Heilongjiang Province (No. LBH-Q14023).

Conflicts of Interest

The authors declare no conflict of interest.

References

  1. Azadbakht, R.; Talebi, M.; Karimi, J.; Golbedaghi, R. Synthesis and characterization of a new organic nanoparticle as fluorescent chemosensor for aluminum ions. Inorg. Chim. Acta 2016, 453, 728–734. [Google Scholar] [CrossRef]
  2. Yokel, R.A.; Hicks, C.L.; Florence, R.L. Aluminum bioavailability from basic sodium aluminum phosphate, an approved food additive emulsifying agent, incorporated in cheese. Food Chem. Toxicol. 2008, 46, 2261–2266. [Google Scholar] [CrossRef] [PubMed]
  3. Wang, C.X.; Wu, B.; Zhou, W.; Wang, Q.; Yu, H.; Deng, K.; Li, J.M.; Zhuo, R.X.; Huang, S.W. Turn-on fluorescent probe-encapsulated micelle as colloidally stable nano-chemosensor for highly selective detection of Al3+ in aqueous solution and living cell imaging. Sens. Actuators B Chem. 2018, 271, 225–238. [Google Scholar] [CrossRef]
  4. Sont, M.G.; White, S.M.; Flamm, W.G.; Burdock, G.A. Safety evaluation of dietary aluminum. Regul. Toxicol. Pharmacol. 2001, 33, 66–79. [Google Scholar]
  5. Filippini, T.; Tancredi, S.; Malagoli, C.; Cilloni, S.; Malavolti, M.; Violi, F.; Vescovi, L.A.; Bargellini, M. Vinceti, Aluminum and tin: Food contamination and dietary intake in an Italian Population. J. Trace Elem. Med. Biol. 2019, 52, 293–301. [Google Scholar] [CrossRef]
  6. Levesque, L.; Mizzen, C.A.; McLachlan, D.R.; Fraser, P.E. Ligand specific effects on aluminum incorporation and toxicity in neurons and astrocytes. Brain Res. 2000, 877, 191–202. [Google Scholar] [CrossRef]
  7. Colomina, M.T.; Peris-Sampedro, F. Aluminum and Alzheimer’s disease. Adv. Neurobiol. 2017, 18, 183–197. [Google Scholar]
  8. Cavaleri, F. Review of Amyotrophic Lateral Sclerosis, Parkinson’s and Alzheimer’s diseases helps further define pathology of the novel paradigm for Alzheimer’s with heavy metals as primary disease cause. Med. Hypotheses 2015, 85, 779–790. [Google Scholar] [CrossRef]
  9. Mold, M.; Umar, D.; King, A.; Exley, C. Aluminium in brain tissue in autism. J. Trace Elem. Med. Biol. 2018, 46, 76–82. [Google Scholar] [CrossRef]
  10. Yang, M.H.; Chen, S.C.; Lin, Y.F.; Lee, Y.C.; Huang, M.Y.; Chen, K.C.; Wu, H.Y.; Lin, P.C.; Gozes, I.; Tyan, Y.C. Reduction of aluminum ion neurotoxicity through a small peptide application-NAP treatment of Alzheimer’s disease. J. Food Drug Anal. 2019, 27, 551–564. [Google Scholar] [CrossRef]
  11. Gupta, A.; Kumar, N. A review of mechanisms for fluorescent ‘‘turn-on’’ probes to detect Al3+ ions. RSC Adv. 2016, 6, 106413–106434. [Google Scholar] [CrossRef]
  12. Das, S.; Dutta, M.; Das, D. Fluorescent probes for selective determination of trace level Al3+: Recent developments and future prospects. Anal. Methods 2013, 5, 6262–6285. [Google Scholar] [CrossRef]
  13. Wang, Q.; Sun, H.; Jin, L.; Wang, W.; Chen, Y. A novel turn on and reversible sensor for Al3+ and its applications in bioimaging. J. Lumin. 2018, 203, 113–120. [Google Scholar] [CrossRef]
  14. Zhou, F.; Wang, H.; Liu, P.; Hu, Q.; Hu, J. A highly selective and sensitive turn-on probe for aluminum(III) based on quinoline Schiff’s base and its cell imaging Spectrochim. Acta A Mol. Biomol. Spectrosc. 2018, 190, 104–110. [Google Scholar] [CrossRef]
  15. Shree, G.J.; Sivaraman, G.; Siva, A.; Chellappa, D. Anthracene- and pyrene-bearing imidazoles as turn-on fluorescent chemosensor for aluminum ion in living cells. Dyes Pigments 2019, 163, 204–212. [Google Scholar] [CrossRef]
  16. Liu, Y.; Bi, A.; Gao, T.; Cao, X.; Zeng, W. A novel self-assembled nanoprobe for the detection of aluminum ions in real water samples and living cells. Talanta 2019, 194, 38–45. [Google Scholar] [CrossRef]
  17. Qin, J.C.; Yan, J.; Wang, B.D.; Yang, Z.Y. Rhodamine–naphthalene conjugate as a novel ratiometric fluorescent probe for recognition of Al3+. Tetrahedron Lett. 2016, 57, 1935–1939. [Google Scholar] [CrossRef]
  18. Yang, Y.; Feng, Y.; Wang, Y.Z.; Qiu, F.Z.; Tang, X.L.; Zhang, G.L.; Liu, W.S. A novel ratiometric fluorescent probe for selective detection of Hg2+, Cr3+ and Al3+ and its bioimaging application in living cells. Sens. Actuators B Chem. 2017, 253, 1055–1062. [Google Scholar] [CrossRef]
  19. Wang, D.; Fan, X.; Sun, S.; Du, S.; Li, H.; Zhu, J.; Tang, Y.; Chang, M.; Xu, Y. Substituent effect: A new strategy to construct a ratiometricfluorescent probe for detection of Al3+ and imaging in vivo. Sens. Actuators B Chem. 2018, 264, 304–311. [Google Scholar] [CrossRef]
  20. Zhu, Q.; Li, L.; Mu, L.; Zeng, X.; Redshaw, C.; Wei, G. A ratiometric Al3+ ion probe based on the coumarin-quinoline FRET system. J. Photochem. Photobiol. A Chem. 2016, 328, 217–224. [Google Scholar] [CrossRef]
  21. Pang, B.J.; Li, C.R.; Yang, Z.Y. A novel chromone and rhodamine derivative as fluorescent probe for the detection of Zn(II) and Al(III) based on two different mechanisms. Spectrochim. Acta A Mol. Biomol. Spectrosc. 2018, 204, 641–647. [Google Scholar] [CrossRef] [PubMed]
  22. Manna, A.; Sain, D.; Guchhait, N.; Goswami, S. FRET based selective and ratiometric detection of Al(III) with live-cell imaging. New J. Chem. 2017, 41, 14266–14271. [Google Scholar] [CrossRef]
  23. Kumar, A.; Pandey, R.; Kumar, A.; Pandey, D.S. Pyridylphenyl appended imidazoquinazoline based ratiometric fluorescence “turn on” chemosensor for Hg2+ and Al3+ in aqueous media. RSC Adv. 2014, 4, 55967–55970. [Google Scholar] [CrossRef]
  24. Das, S.; Goswami, S.; Aich, K.; Ghoshal, K.; Quah, C.K.; Bhattacharyya, M.; Fun, H.K. ESIPT and CHEF based highly sensitive and selective ratiometric sensor for Al3+ with imaging in human blood cells. New J. Chem. 2015, 39, 8582–8587. [Google Scholar] [CrossRef]
  25. Jeyanthi, D.; Iniya, M.; Krishnaveni, K.; Chellappa, D. A ratiometric fluorescent sensor for selective recognition of Al3+ ions based on a simple benzimidazole platform. RSC Adv. 2013, 3, 20984–20989. [Google Scholar] [CrossRef]
  26. Gupta, N.; Kaur, T.; Bhalla, V.; Parihar, R.D.; Ohri, P.; Kaur, G.; Kumar, M. A naphthalimide-based solid state luminescent probe for ratiometric detection of aluminum ions: In vitro and in vivo applications. Chem. Commun. 2017, 53, 12646–12649. [Google Scholar] [CrossRef]
  27. Maity, D.; Govindaraju, T. A differentially selective sensor with fluorescence turn-on response to Zn2+ and dual-mode ratiometric response to Al3+ in aqueous media. Chem. Commun. 2012, 48, 1039–1041. [Google Scholar] [CrossRef]
  28. Na, S.Y.; Park, S.; Kim, S.Y.; Kim, H.J. A benzothiazole-based water soluble and pH-independent probe for nitroreductase with a dramatic change of chromogenic and fluorogenic properties. Dyes Pigments 2019, 161, 247–251. [Google Scholar] [CrossRef]
  29. Yu, Y.; Xu, H.; Zhang, W.; Wang, B.; Jiang, Y. A novel benzothiazole-based fluorescent probe for cysteine detection and its application on test paper and in living cells. Talanta 2018, 176, 151–155. [Google Scholar] [CrossRef]
  30. Li, J.; Yang, X.; Zhang, D.; Liu, Y.; Tang, J.; Li, Y.; Zhao, Y.; Ye, Y. A fluorescein-based “turn-on” fluorescence probe for hypochlorous acid detection and its application in cell imaging. Sens. Actuators B Chem. 2018, 265, 84–90. [Google Scholar] [CrossRef]
  31. Shen, Y.; Zhang, X.; Zhang, Y.; Li, H.; Dai, L.; Peng, X.; Peng, Z.; Xie, Y. A fluorescent sensor for fast detection of peroxynitrite by removing of C=N in a benzothiazole derivative. Anal. Chim. Acta 2018, 1014, 71–76. [Google Scholar] [CrossRef] [PubMed]
  32. Chen, S.; Wang, W.; Yan, M.; Tu, Q.; Chen, S.W.; Li, T.; Yuan, M.S.; Wang, J. 2-Hydroxy benzothiazole modified rhodol: Aggregation-induced emission and dual-channel fluorescence sensing of Hg2+ and Ag+ ions. Sens. Actuators B Chem. 2018, 255, 2086–2094. [Google Scholar] [CrossRef]
  33. Hong, K.I.; Choi, W.H.; Jang, W.D. Hydroxythiophene-bearing benzothiazole: Selective and sensitive detection of periodate and its application as security ink. Dyes Pigments 2019, 162, 984–989. [Google Scholar] [CrossRef]
  34. Zeng, S.; Li, S.J.; Sun, X.J.; Li, M.Q.; Xing, Z.Y.; Li, J.L. A benzothiazole-based chemosensor for significant fluorescent turn-on and ratiometric detection of Al3+ and its application in cell imaging. Inorg. Chim. Acta 2019, 486, 654–662. [Google Scholar] [CrossRef]
  35. Li, N.N.; Ma, Y.Q.; Sun, X.J.; Li, M.Q.; Zeng, S.; Xing, Z.Y.; Li, J.L. A dual-function probe based on naphthalene for fluorescent turn-on recognition of Cu2+ and colorimetric detection of Fe3+ in neat H2O. Spectrochim. Acta A Mol. Biomol. Spectrosc. 2019, 210, 266–274. [Google Scholar] [CrossRef] [PubMed]
  36. Zeng, S.; Li, S.J.; Sun, X.J.; Liu, T.T.; Xing, Z.Y. A dual-functional chemosensor for fluorescent on-off and ratiometric detection of Cu2+ and Hg2+ and its application in cell imaging. Dyes Pigments 2019, 170, 107642. [Google Scholar] [CrossRef]
  37. Kang, L.; Xing, Z.Y.; Ma, X.Y.; Liu, Y.T.; Zhang, Y. A highly selective colorimetric and fluorescent turn-on chemosensor for Al3+ based on naphthalimide derivative. Spectrochim. Acta A Mol. Biomol. Spectrosc. 2016, 167, 59–65. [Google Scholar] [CrossRef]
  38. Zeng, S.; Li, S.J.; Sun, X.J.; Li, M.Q.; Ma, Y.Q.; Xing, Z.Y.; Li, J.L. A naphthalene-quinoline based chemosensor for fluorescent “turn-on” and absorbance-ratiometric detection of Al3+ and its application in cells imaging. Spectrochim. Acta A Mol. Biomol. Spectrosc. 2018, 205, 276–286. [Google Scholar] [CrossRef]
  39. Ye, F.; Liang, X.M.; Xu, K.X.; Pang, X.X.; Chai, Q.; Fu, Y. A novel dithiourea-appended naphthalimide “on-off” fluorescent probe for detecting Hg2+ and Ag+ and its application in cell imaging. Talanta 2019, 200, 494–502. [Google Scholar] [CrossRef]
  40. Fu, Y.; Pang, X.X.; Wang, Z.Q.; Chai, Q.; Ye, F. A highly sensitive and selective fluorescent probe for determination of Cu (II) and application in live cell imaging. Spectrochim. Acta A Mol. Biomol. Spectrosc. 2019, 208, 198–205. [Google Scholar] [CrossRef]
Scheme 1. Synthetic route of the benzothiazole-based probe (BHM).
Ijms 20 05993 sch001
Figure 1. X-ray crystal structure of BHM (heteroatoms N, O and S were labeled in different color).
Ijms 20 05993 g001
Figure 2. (a) UV-Vis absorbance spectra of BHM (10 μM) in the absence and presence of tested metal ions (5 equiv.) in DMF/H2O (1/1, v/v); (b) Absorbance titration of BHM to Al3+. Inset: the absorbance of BHM as a function of Al3+ concentration.
Ijms 20 05993 g002
Figure 3. (a) Fluorescence emission spectra of BHM (10 μM) in the presence of 5 equiv. of various metal ions in DMF/H2O (1/1, v/v). Inset: the color changes of BHM (10 μM) in the presence of Al3+ ions (5 equiv.) in DMF/H2O (1/1, v/v) under UV light of 365 nm; (b) Fluorescence titration of BHM to Al3+. Inset: the fluorescence intensity (Em = 478 nm) of BHM as a function of Al3+ concentration.
Ijms 20 05993 g003
Figure 4. Competition selectivity of BHM (5 μM) toward Al3+ (5 equiv.) in the presence of other metal ions (5 equiv.) (Em = 478 nm). Error bar is represented as the mean ± standard deviation, n = 3.
Ijms 20 05993 g004
Figure 5. Job’s plot of BHM (Em = 478 nm) with Al3+ (the crossover point between red line and x-axis is 0.5).
Ijms 20 05993 g005
Figure 6. The ESI-MS spectrum of the BHM-Al3+ complex in DMF.
Ijms 20 05993 g006
Figure 7. The FT-IR spectrum for the probe BHM and Al3+complex.
Ijms 20 05993 g007
Figure 8. 1H NMR titration spectra of BHM in the presence of Al3+ in DMSO-d6.
Ijms 20 05993 g008
Scheme 2. Proposed mechanism of BHM for Al3+ (the symbol in blue means Excitation, the symbol in green and deep sky-blue all mean Emission).
Ijms 20 05993 sch002
Figure 9. The incubation of cells with BHM (10 μM) for 2 h (A); incubation of the cells with Al3+ (50 μM) and BHM (10 μM) (B); incubation of the cells with Al3+ (100 μM) and BHM (10 μM) (C). Scale bar for the images is 10 μm.
Ijms 20 05993 g009
Table 1. Determination of Al3+ in water samples.
Water SamplesAmount of Standard Al3+ Added (μmol/L)Total Al3+ Found (n = 3) (μmol/L)Recovery of Al3+ (n = 3) Added (%)RSD (%)Relative Error (%)
Ultrapure water1515.08100.541.540.69
1616.18101.122.331.41
1716.9599.722.39−0.34
1817.6698.101.20−2.31
1919.03100.192.250.23
2020.16100.811.670.97
Tap water (Department of Chemistry)1515.30102.002.332.55
1615.6397.670.20−2.91
1716.9899.931.42−0.07
1817.9099.471.90−0.64
1918.8199.012.84−1.19
2019.8399.182.83−0.96
Songhua River water1514.8298.820.22−1.15
1615.9499.602.67−0.39
1717.33101.992.141.95
1817.9199.472.84−0.51
1918.9999.971.51−0.02
2019.8699.321.36−0.66

