In Human and Mouse Spino-Cerebellar Tissue, Ataxin-2 Expansion Affects Ceramide-Sphingomyelin Metabolism


 , and
, and 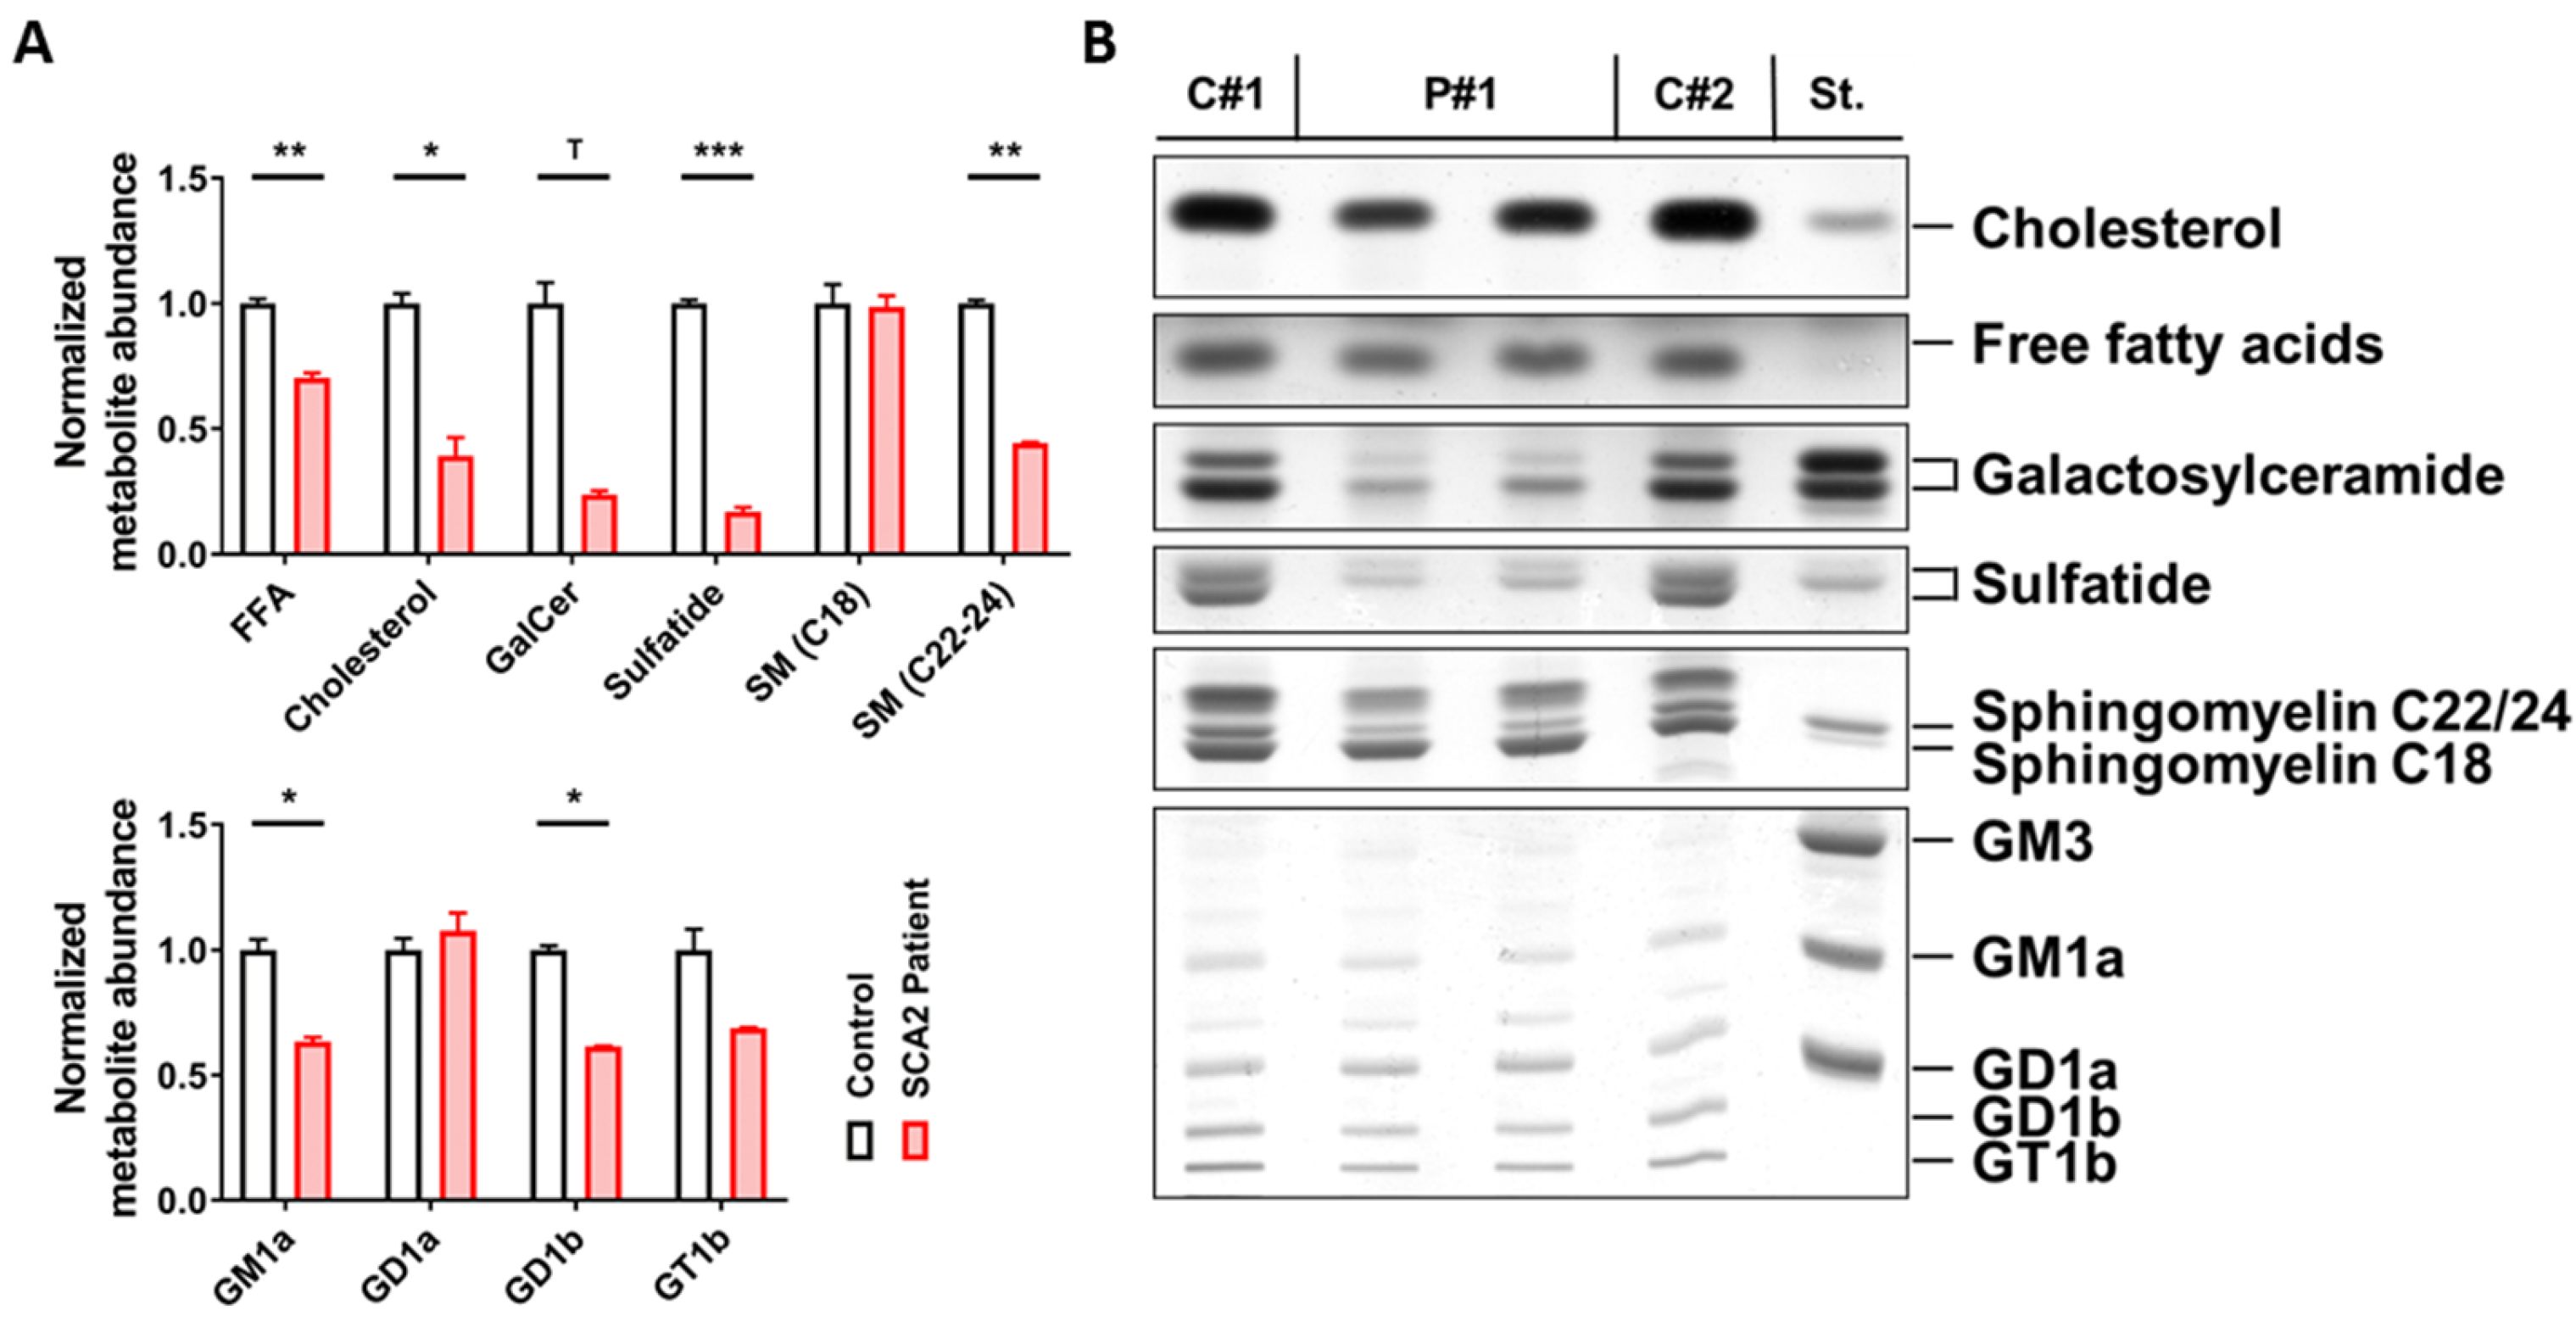
Abstract
:1. Introduction
2. Results
2.1. SCA2 Cerebellum: Lipid Profile
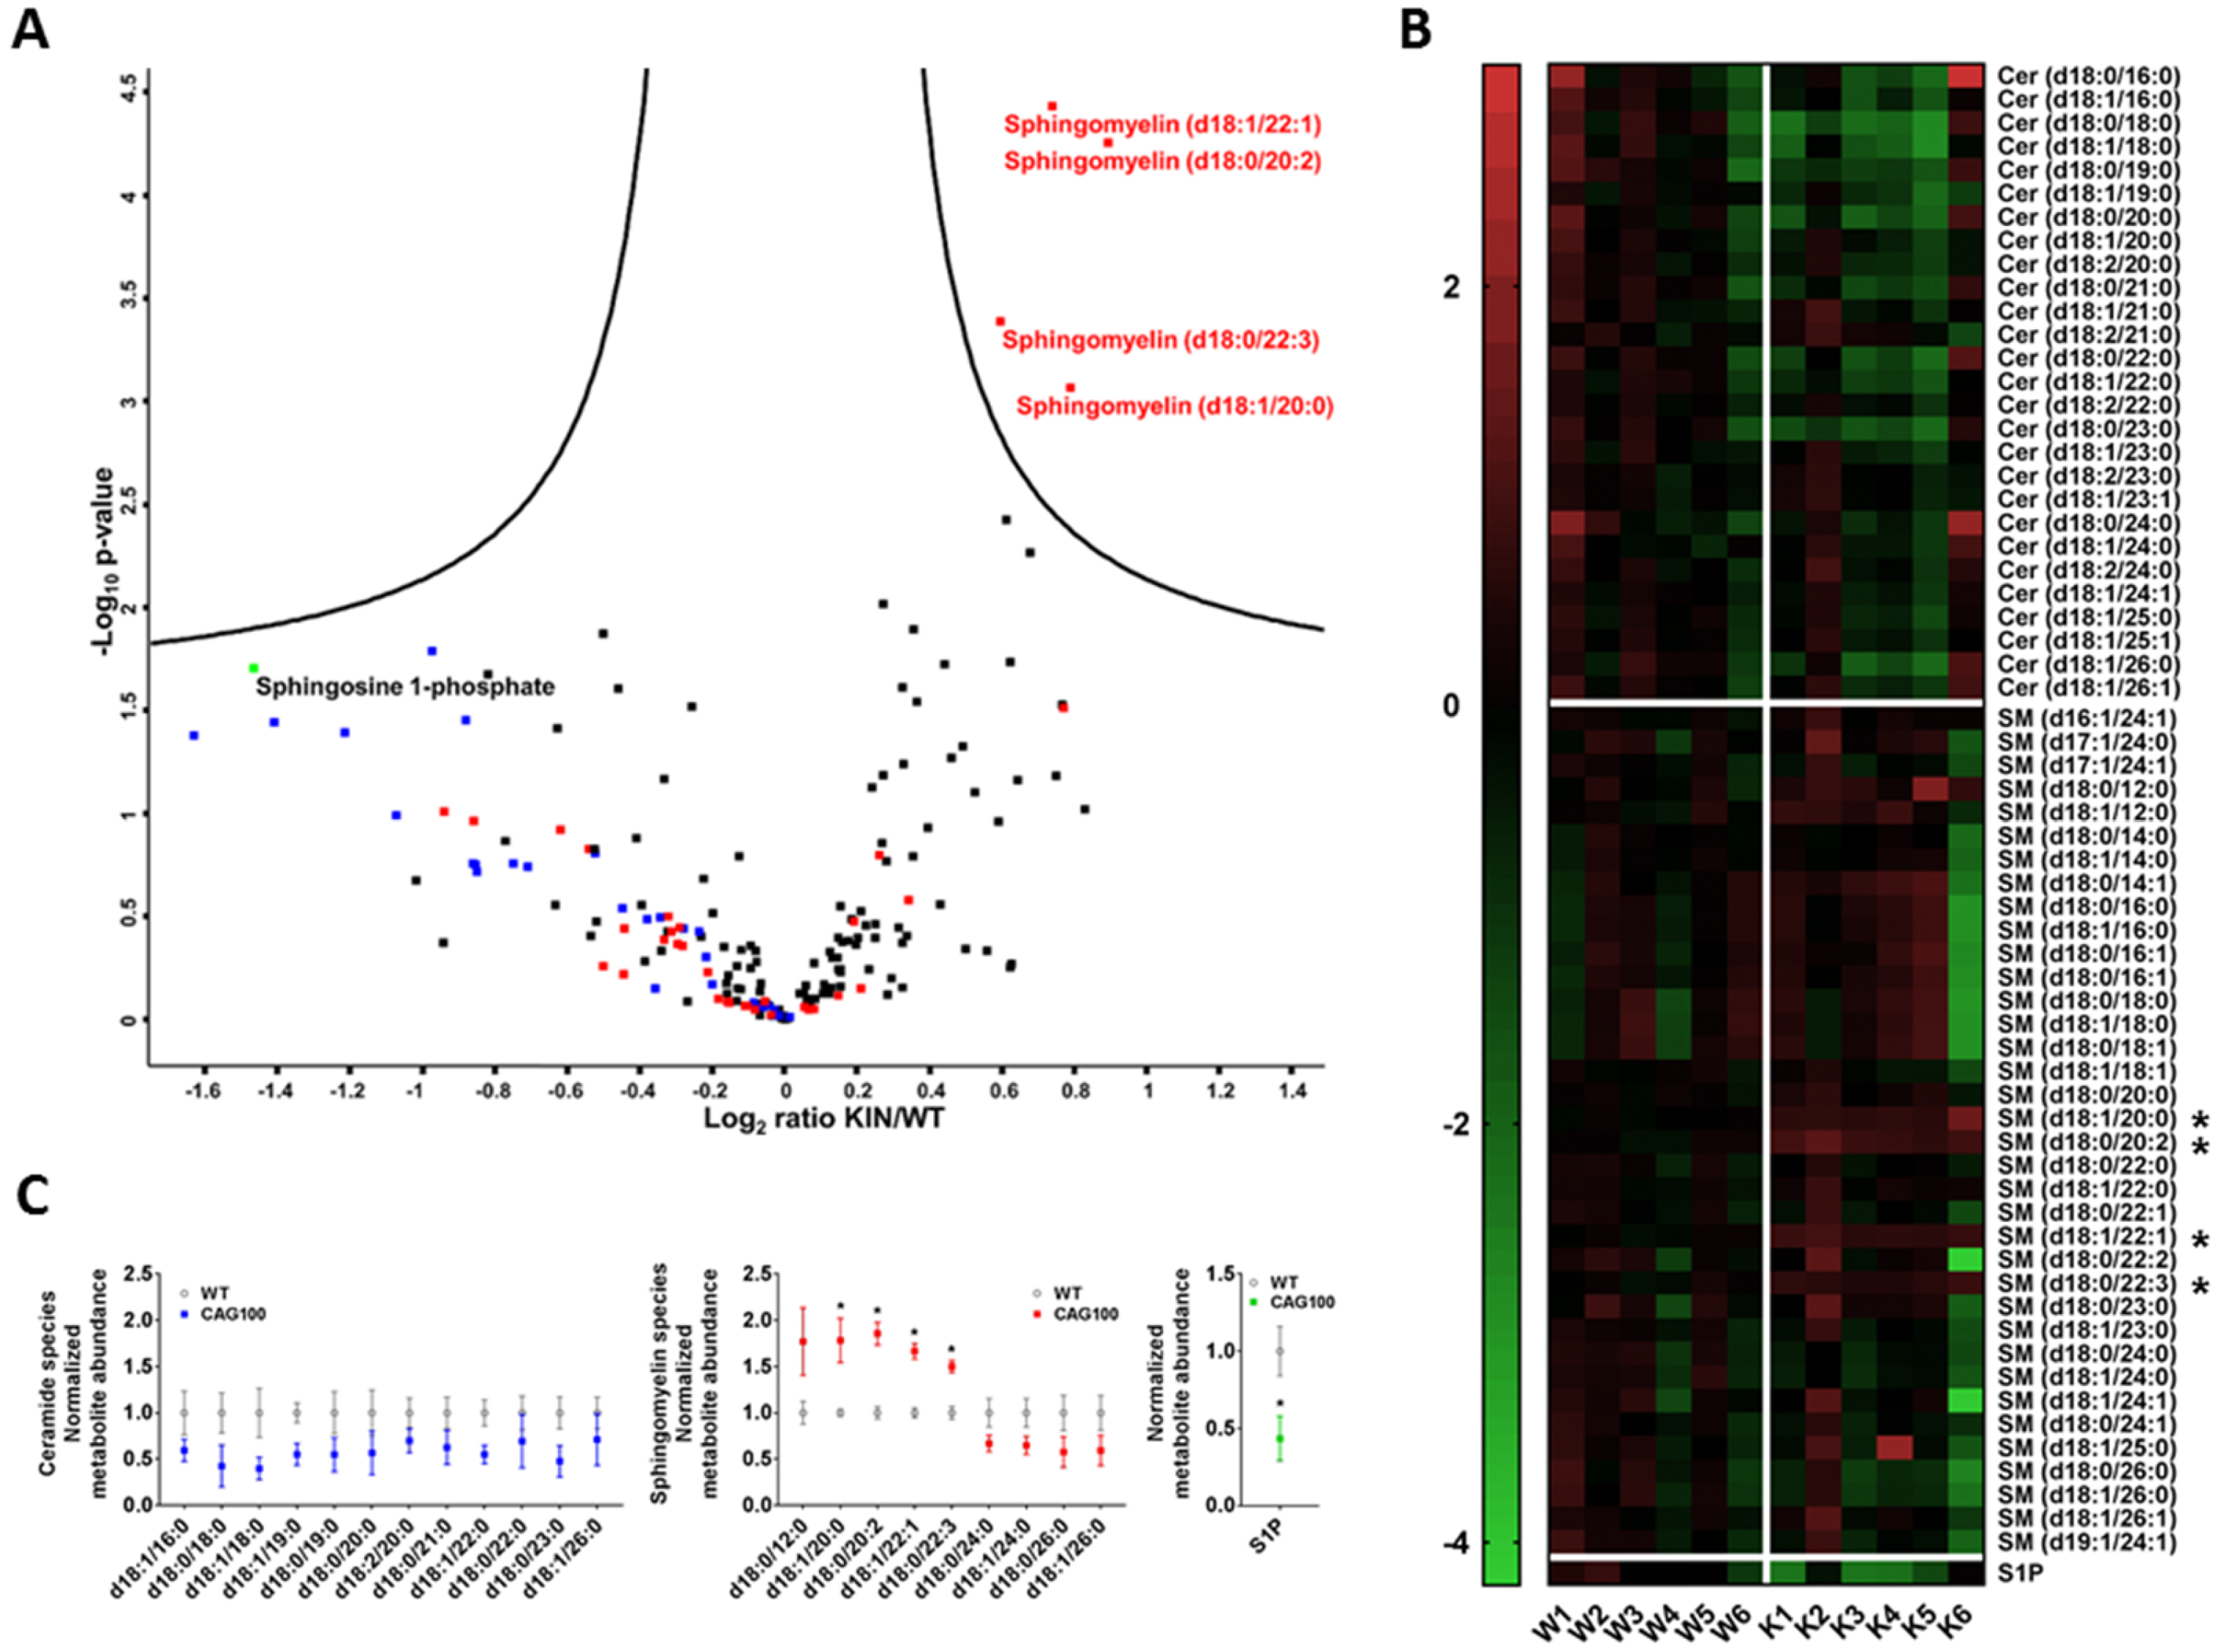
2.2. Atxn2-CAG100-Knockin Mouse Tissues: Global Metabolome Profiles
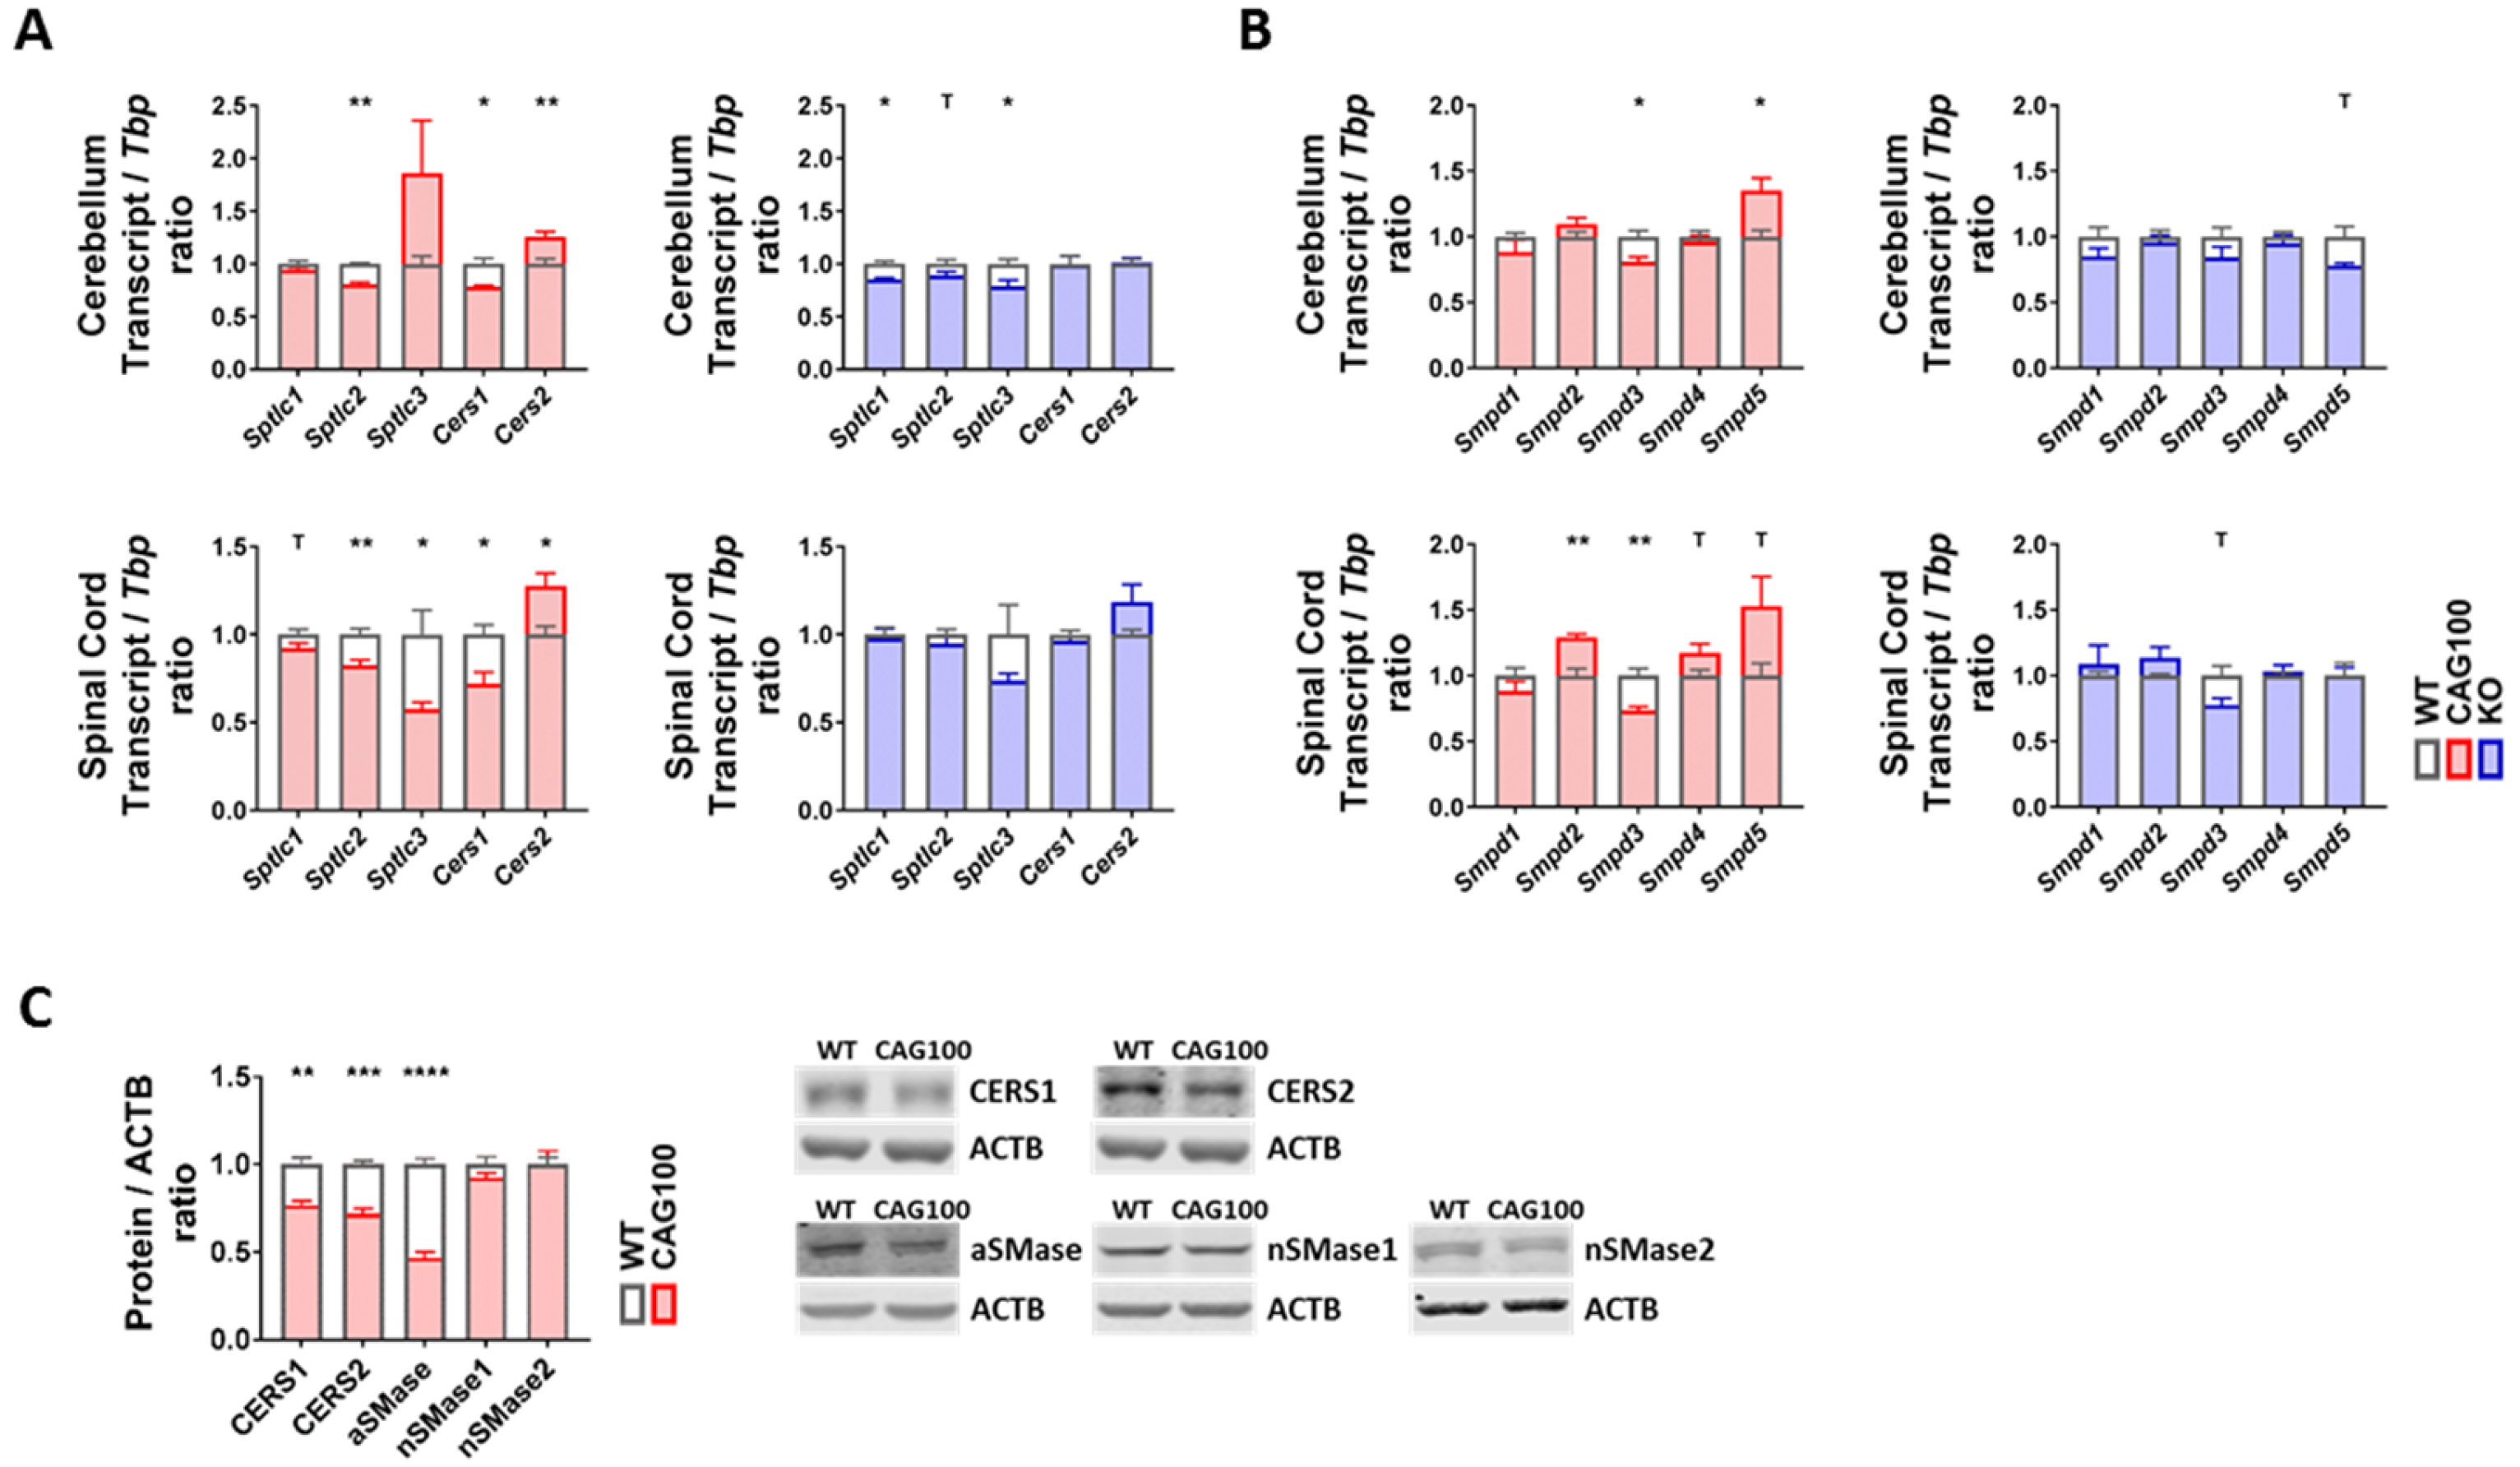
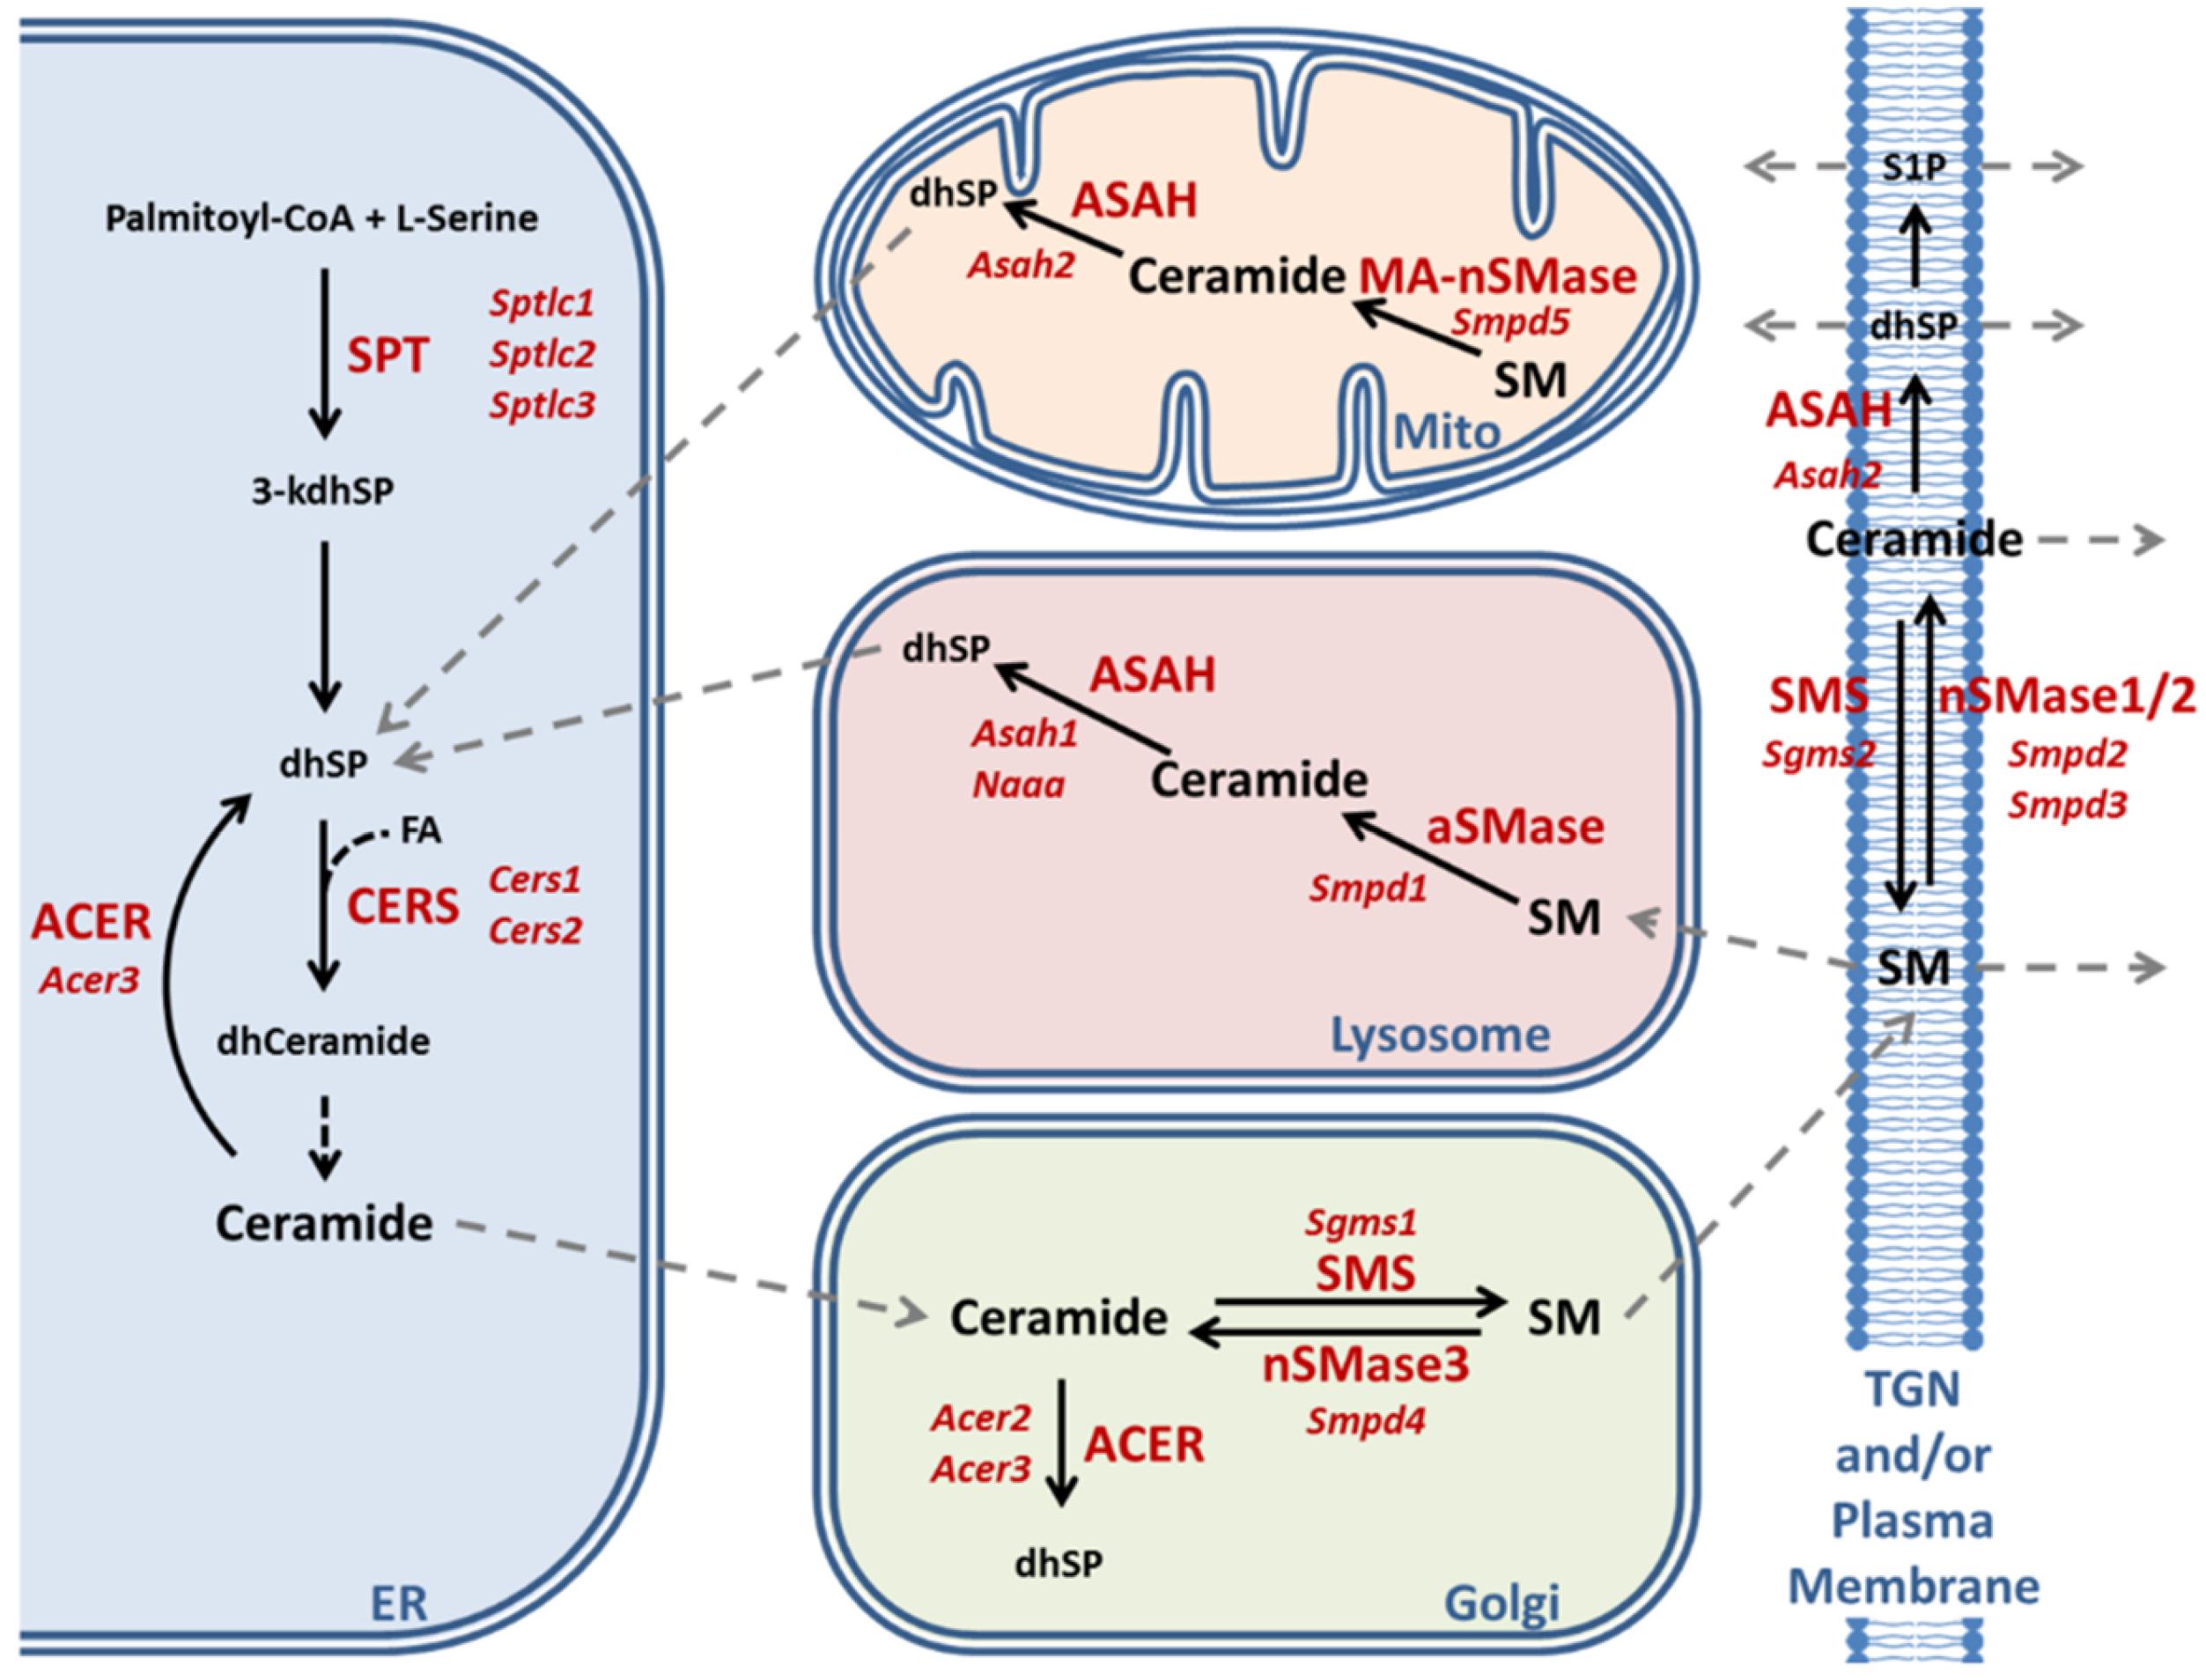
2.3. Enzymatic Production of Ceramide in Atxn2-CAG100-KIN Mouse Nervous System
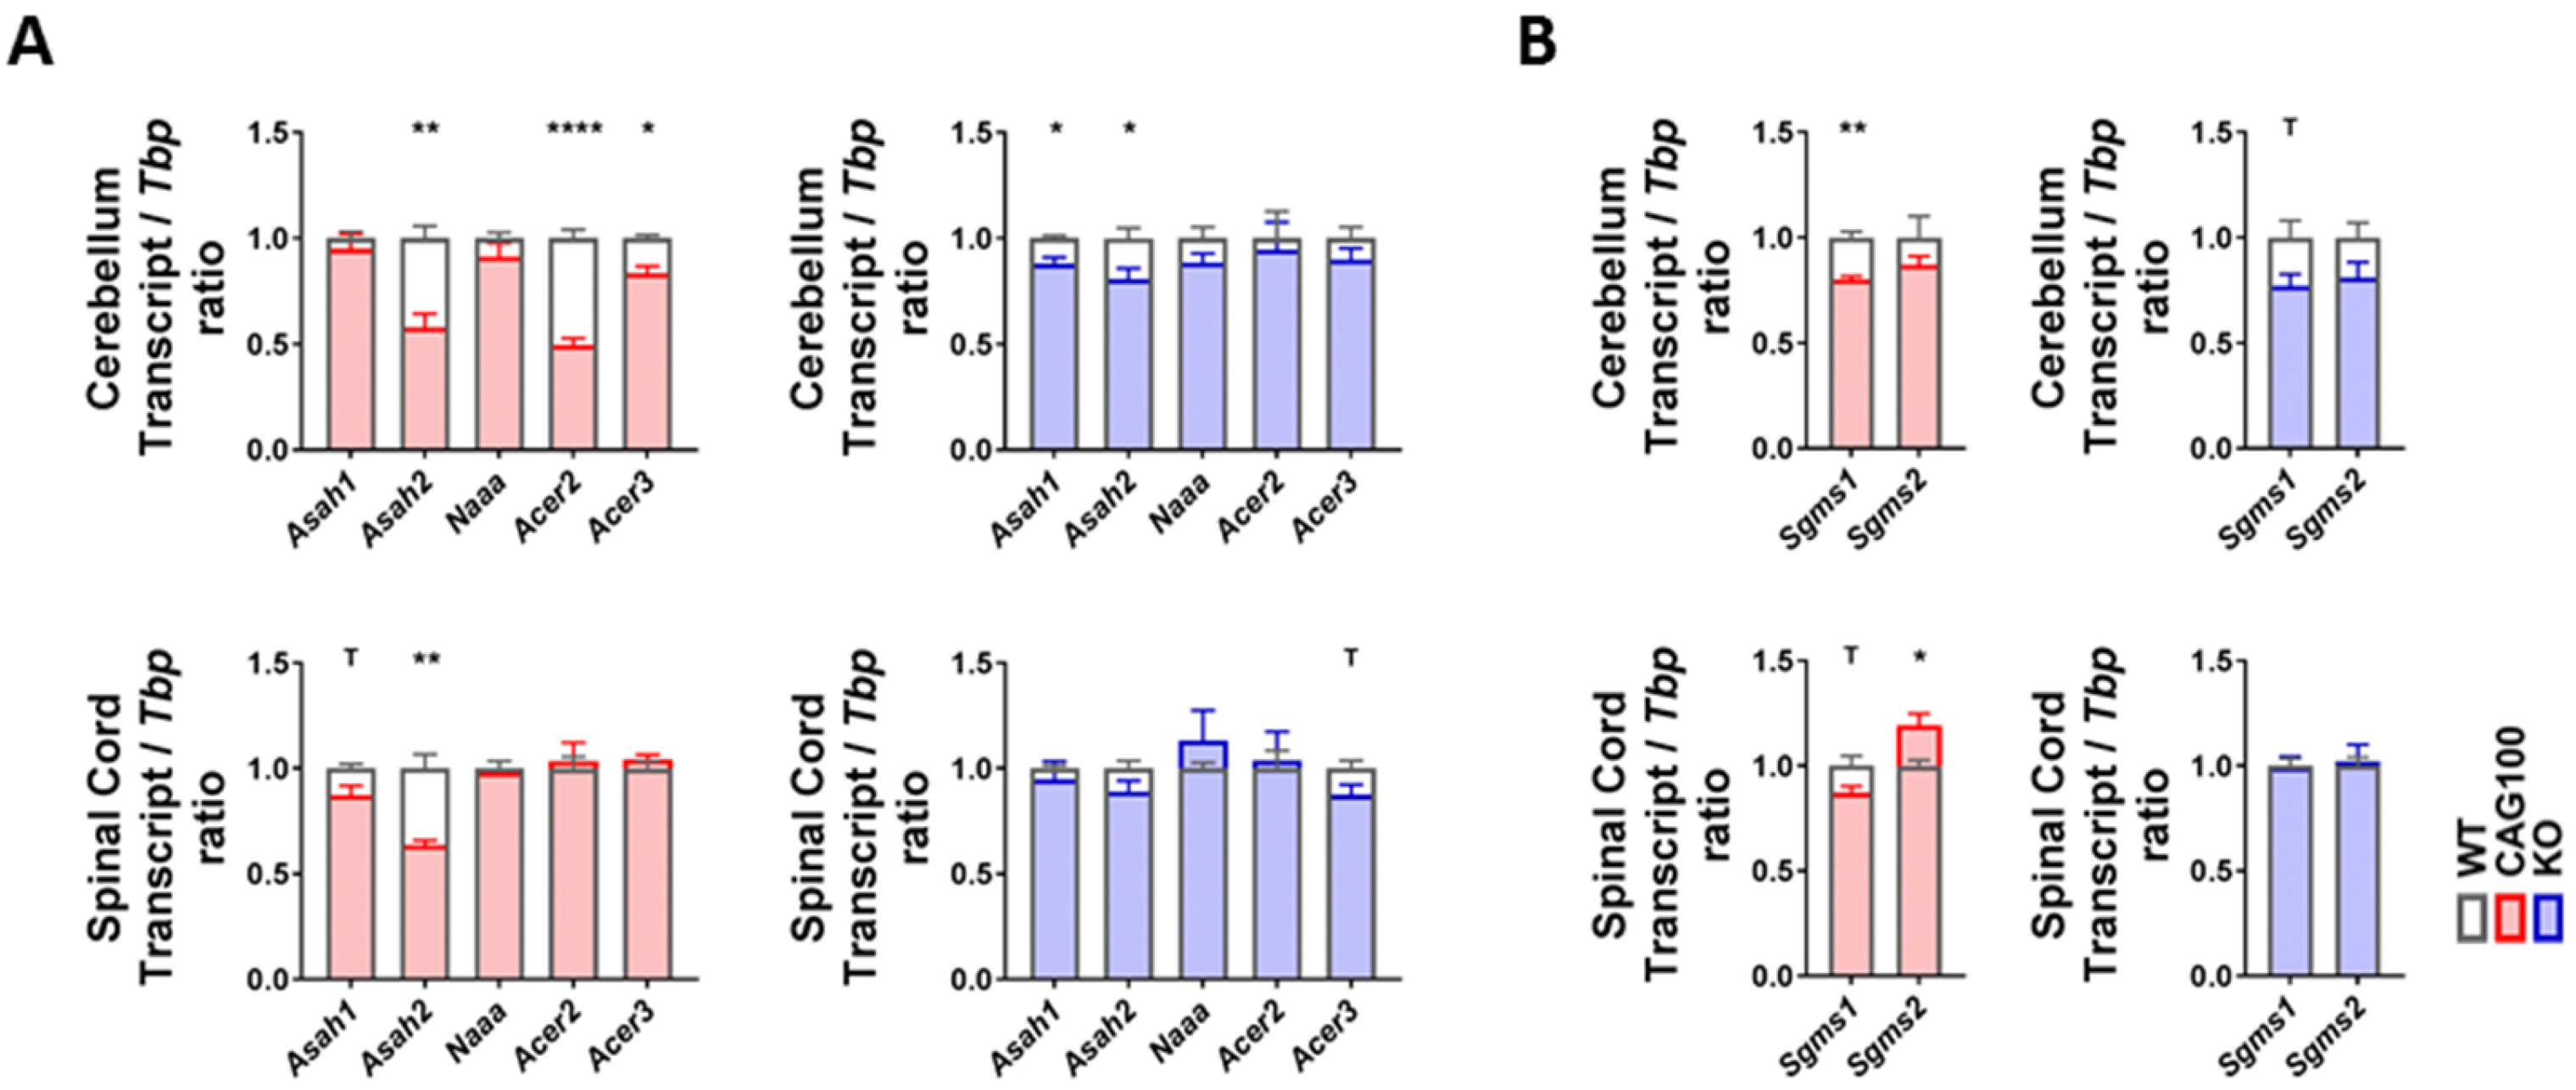
2.4. Utilization of Ceramide in Atxn2-CAG100-KIN Mouse Tissues
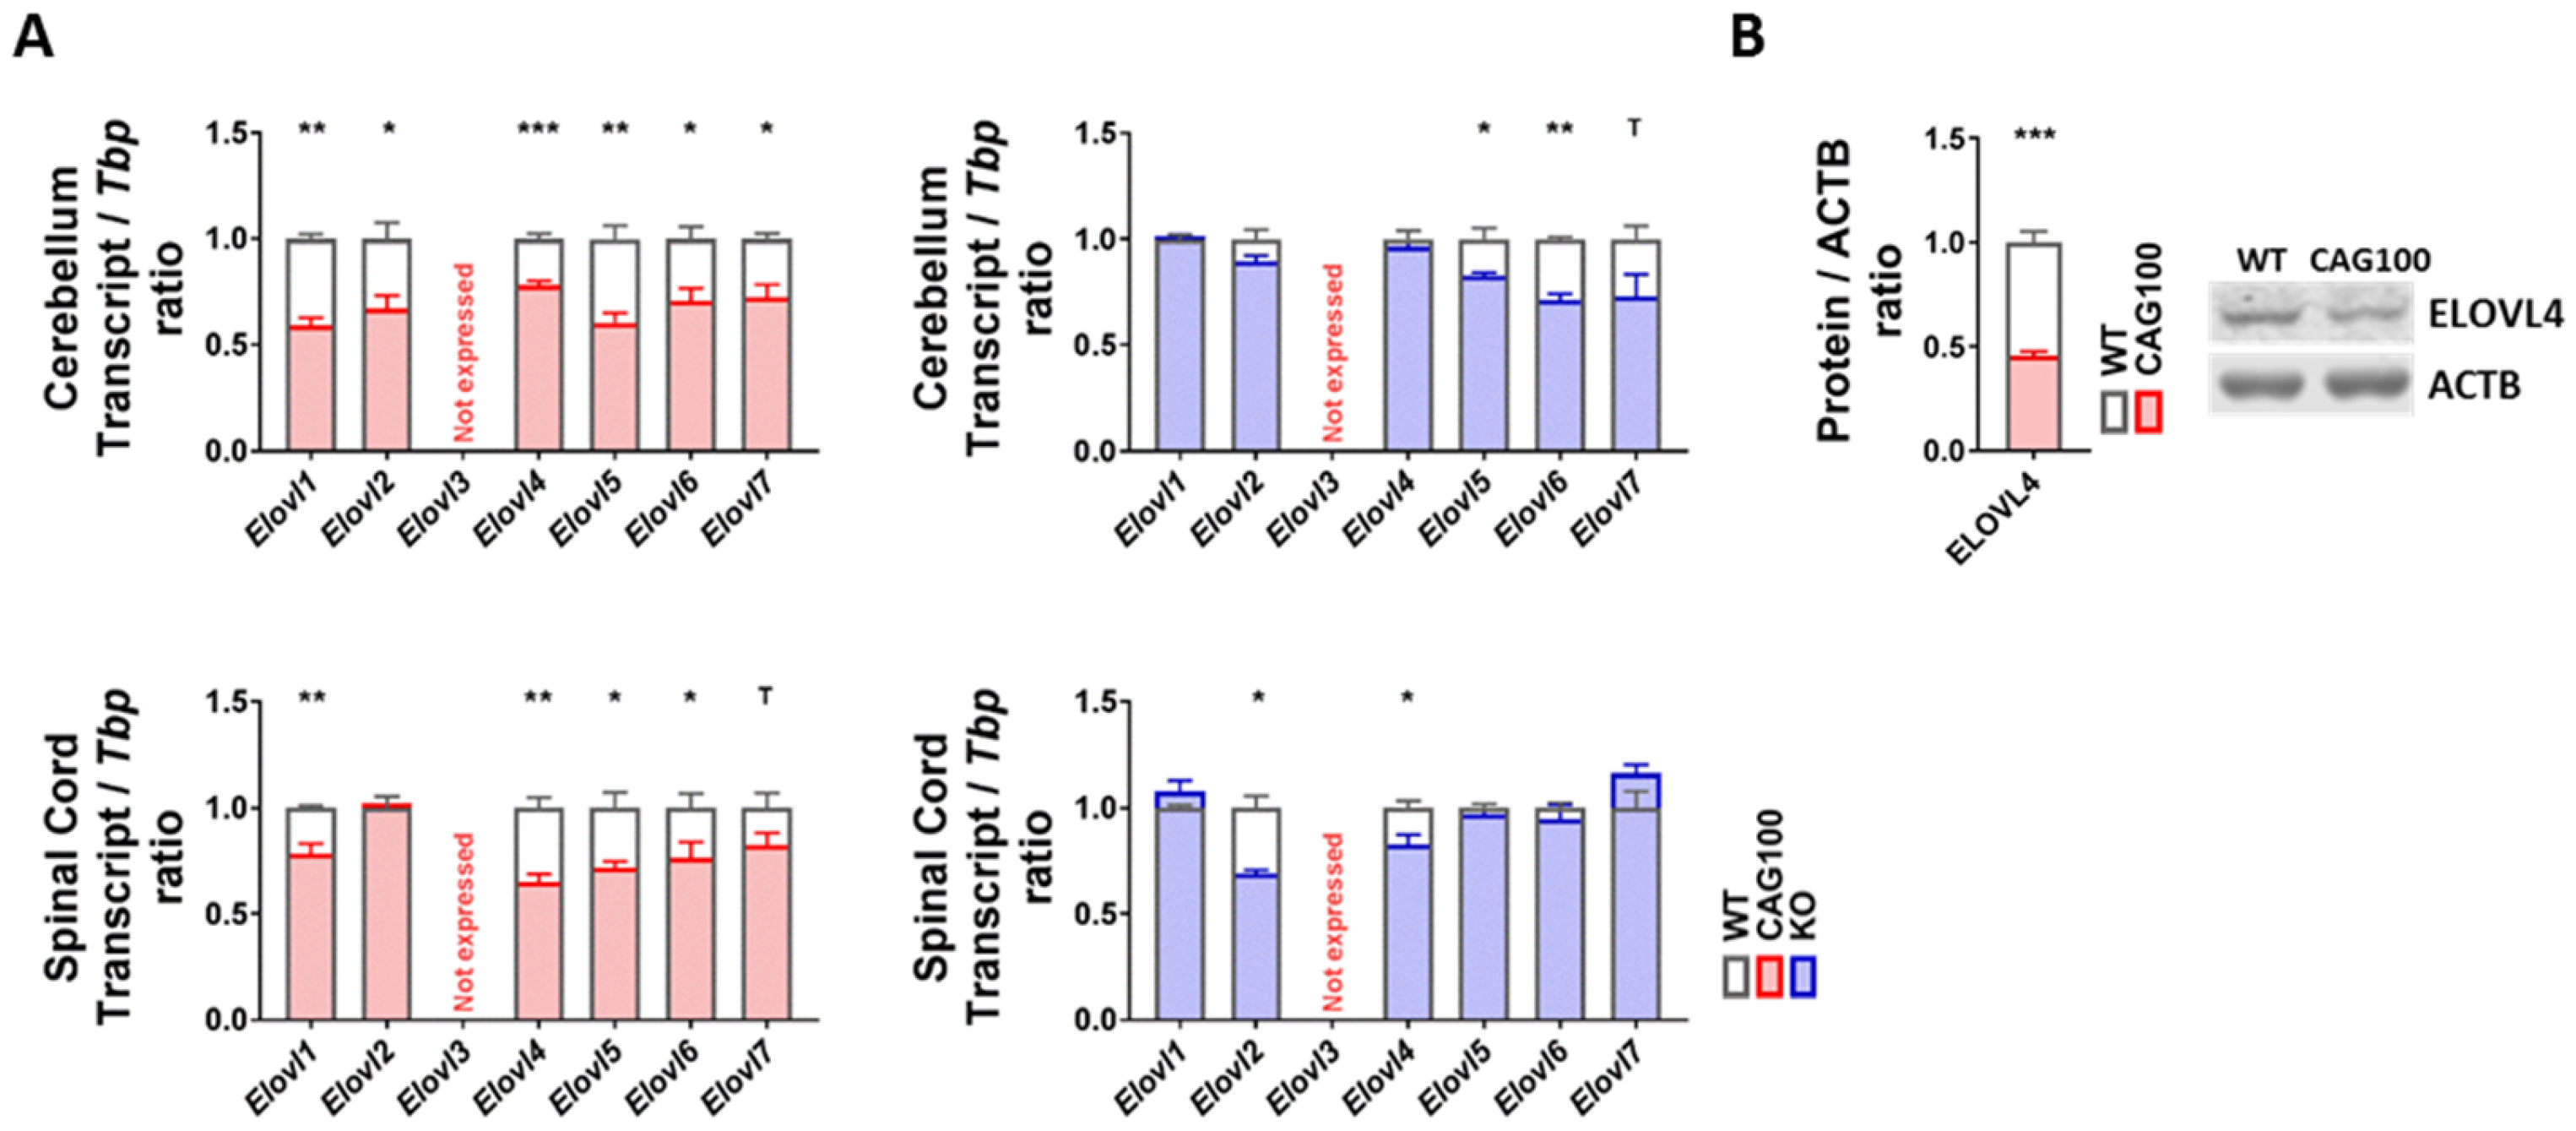
2.5. Production of Very Long-Chain Fatty Acids by Elongases in Atxn2-CAG100-KIN Nervous Tissues
3. Discussion
4. Materials and Methods
4.1. Lipid Extraction from Human Post-Mortem Tissue and Thin Layer Chromatography
4.2. Animals and Genotyping
4.3. Targeted Metabolome Analysis with Mass Spectrometry
4.4. Mouse RNA Isolation and Expression Analyses
4.5. Protein Extraction and Quantitative Immunoblots
4.6. Statistical Analyses
5. Conclusions
Supplementary Materials
Author Contributions
Funding
Acknowledgments
Conflicts of Interest
Abbreviations
| °C | degree Celsius |
| ΔΔCt | Delta-Delta-Count-Threshold |
| 3-kdhSP | 3-Keto-dihydro-sphingosine |
| aCDase | acid Ceramidase, encoded by Asah1 |
| ACER | alkaline Ceramidase |
| Acer2 | alkaline Ceramidase 2 (Golgi Ceramidase) |
| Acer3 | alkaline Ceramidase 3 (ER and Golgi Ceramidase) |
| ACTB | Actin-B |
| ALS | Amyotrophic Lateral Sclerosis, spinal motor neuron atrophy at adult age, tauopathy |
| ASAH | N-Acylsphingosine Amidohydrolase (acid or neutral Ceramidase) |
| Asah1 | N-Acylsphingosine Amidohydrolase 1 (lysosomal acid Ceramidase) |
| Asah2 | N-Acylsphingosine Amidohydrolase 2 (plasma membrane/mitoch. neutral Ceramidase) |
| ASMase | acid Sphingomyelinase |
| ATXN2 | Ataxin-2 |
| BSA | Bovine serum albumin |
| C22 chain | Chain with a length comprising 22 carbons |
| CAG | Cytosine-adenine-guanine |
| cDNA | Complementary deoxyribo-nucleic acid |
| Cer | Ceramide |
| Cers1 | Ceramide Synthase 1 (primary in brain, C18 ceramide, ER of neurons, astrocytes and OPC) |
| Cers2 | Ceramide Synthase 2 (very long-chain ceramides, mainly in ER of mature oligodendroglia) |
| CoA | Coenzyme-A |
| CSF | Cerebrospinal fluid |
| d18:0 | Di-hydroxy sphingoid base, 18 carbon chain length, 0 double bonds |
| DEAE | Diethyl-aminoethyl |
| dhSP | Dihydro-sphingosine |
| EDTA | Ethylene-Diamine-Tetra-Acetic acid |
| Elovl1 | Elongation of very long-chain fatty acids protein 1 (oligodendrocyte, C22–26 SFA) |
| Elovl2 | Elongation of very long-chain fatty acids protein 2 (astrocyte, C20–22 PUFA) |
| Elovl3 | Elongation of very long-chain fatty acids protein 3 (eye, cholesterol/odd-chain elongase) |
| Elovl4 | Elongation of very long-chain fatty acids protein 4 (neurons, C24–26 SFA) |
| Elovl5 | Elongation of very long-chain fatty acids protein 5 (astrocyte, C18 PUFA) |
| Elovl6 | Elongation of very long-chain fatty acids protein 6 (ubiquitous, C12–16 PUFA) |
| Elovl7 | Elongation of very long-chain fatty acids protein 7 (oligodendrocyte, C16–20 SFA+PUFA) |
| ER | Endoplasmic reticulum |
| FA | Fatty acid |
| FDA | Federal Drug Administration |
| FTLD | Fronto-temporal lobar degeneration/dementia, cortical motor neuron atrophy, tauopathy |
| GalCer | Galactosyl-ceramide |
| GD1b | Ganglioside 1b with Di-NANA binding |
| GM1a | Ganglioside 1a with Mono-NANA binding |
| GT1b | Ganglioside 1b with Tri-NANA binding |
| h | Hour |
| HCl | Hydrochloric acid |
| HSAN1 | Hereditary sensory and autonomic neuropathy type 1 |
| ILVs | Intralysosomal luminal vesicles |
| K1 | KIN sample 1 |
| KIN | Knockin (of CAG100 mutation into Atxn2 gene, in this case) |
| KO | Knockout (of Atxn2 gene, in this case) |
| LC-MS | Liquid chromatography mass spectrometry |
| MA-nSMase | Mitochondria-associated neutral sphingomyelinase |
| MAPT | Microtubule-associated protein tau |
| µL | Microliter |
| µg | Microgram |
| mg | Milli-gram |
| min | Minute |
| Mito | Mitochondria |
| mRNA | Messenger RNA |
| MSA | Multi-system atrophy |
| MTBE | Methyl-tert-butyl ester |
| mTORC1 | Mechanistic target of rapamycin complex 1, a kinase responsible for cell growth signals |
| Naaa | N-Acylethanolamine acid amidase (acid ceramidase-like protein, mainly in macrophages) |
| NaCl | Sodiumchloride |
| NANA | N-acetyl-neuraminic acid |
| nCDase | Neutral Ceramidase, encoded by Asah2 |
| ng | Nanogram |
| NPA | Niemann–Pick type A, caused by mutations in the aSMase Smpd1, neurovisceral picture |
| NPB | Niemann–Pick type B, caused by mutations in the aSMase Smpd1, visceral picture |
| NPC | Niemann–Pick type C, caused by Npc1/Npc2 mutations, neuronopathic picture |
| NSMase | Neutral Sphingomyelinase |
| nSMase1 | Neutral Sphingomyelinase 1 (encoded by Smpd2) |
| OPC | Ooligodendrocyte precursor cell |
| OPCA | Olivo-ponto-cerebellar atrophy |
| PCR | Polymerase chain reaction |
| PKC | Protein kinase C |
| polyQ | polyGlutamine |
| PSP | Progressive supranuclear palsy (Parkinson plus), dopaminergic neuron atrophy, tauopathy |
| PUFA | Poly-unsaturated fatty acid |
| RHEB | Ras homolog enriched in brain, mTORC1-binding protein |
| RIPA | Radio-immuno precipitation assay |
| RNA | Ribonucleic acid |
| s | Second |
| S1P | Sphingosine-1-phosphate |
| SAPs | sphingolipid activator proteins |
| SCA2 | Spino-cerebellar ataxia type 2, caused by polyQ expansions in ataxin-2 |
| SCA34 | Spino-cerebellar ataxia type 34, caused by inactivity of ELOVL4 |
| SCA38 | Spino-cerebellar ataxia type 38, caused by inactivity of ELOVL5 |
| SDS | Sodium-dodecyl-sulfate |
| s.e.m. | Standard error of the mean |
| SFA | Saturated fatty acid |
| Sgms1 | Sphingomyelin synthase 1 (Golgi location) |
| Sgms2 | Sphingomyelin synthase 2 (plasma membrane location) |
| Smpd1 | Sphingomyelin phosphodiesterase 1 (acid lysosomal SMase) |
| Smpd2 | Sphingomyelin phosphodiesterase 2 (neutral plasma membrane SMase, immune cells) |
| Smpd3 | Sphingomyelin phosphodiesterase 3 (neutral Golgi+ plasma membrane SMase, brain stress) |
| Smpd4 | Sphingomyelin phosphodiesterase 4 (neutral ER/Golgi membrane SMase) |
| Smpd5 | Sphingomyelin phosphodiesterase 5 (ER and mitochondria-associated neutral SMase) |
| SM | Sphingomyelin |
| SMase | Sphingomyelinase |
| SMS | Sphingomyelin synthase |
| SPT | Serine palmitoyltransferase |
| Sptlc1 | Serine palmitoyltransferase long-chain base subunit 1 |
| Sptlc2 | Serine palmitoyltransferase long-chain base subunit 2 (for C18 substrates, in ER) |
| Sptlc3 | Serine palmitoyltransferase long-chain base subunit 3 (for C12-16 substrates) |
| Suppl. | Supplementary |
| Tbp | TATA-binding protein |
| TBS-T | Tris-buffered saline with Tween20 |
| TGN | Trans-Golgi network |
| TLC | Thin layer chromatography |
| TLR2 | Toll-like receptor 2 |
| W1 | WT sample 1 |
| WT | Wild-type |
References
- Hernandez, A.; Magarino, C.; Gispert, S.; Santos, N.; Lunkes, A.; Orozco, G.; Heredero, L.; Beckmann, J.; Auburger, G.G. Genetic mapping of the spinocerebellar ataxia 2 (SCA2) locus on chromosome 12q23-q24.1. Genomics 1995, 25, 433–435. [Google Scholar] [CrossRef]
- Belal, S.; Cancel, G.; Stevanin, G.; Hentati, F.; Khati, C.; Ben Hamida, C.; Auburger, G.; Agid, Y.; Ben Hamida, M.; Brice, A. Clinical and genetic analysis of a Tunisian family with autosomal dominant cerebellar ataxia type 1 linked to the SCA2 locus. Neurology 1994, 44, 1423–1426. [Google Scholar] [CrossRef] [PubMed]
- Auburger, G.; Diaz, G.O.; Capote, R.F.; Sanchez, S.G.; Perez, M.P.; del Cueto, M.E.; Meneses, M.G.; Farrall, M.; Williamson, R.; Chamberlain, S.; et al. Autosomal dominant ataxia: Genetic evidence for locus heterogeneity from a Cuban founder-effect population. Am. J. Hum. Genet. 1990, 46, 1163–1177. [Google Scholar] [PubMed]
- Orozco Diaz, G.; Nodarse Fleites, A.; Cordoves Sagaz, R.; Auburger, G. Autosomal dominant cerebellar ataxia: Clinical analysis of 263 patients from a homogeneous population in Holguin, Cuba. Neurology 1990, 40, 1369–1375. [Google Scholar] [CrossRef]
- Gispert, S.; Twells, R.; Orozco, G.; Brice, A.; Weber, J.; Heredero, L.; Scheufler, K.; Riley, B.; Allotey, R.; Nothers, C.; et al. Chromosomal assignment of the second locus for autosomal dominant cerebellar ataxia (SCA2) to chromosome 12q23-24.1. Nat. Genet. 1993, 4, 295–299. [Google Scholar] [CrossRef]
- Gispert, S.; Lunkes, A.; Santos, N.; Orozco, G.; Ha-Hao, D.; Ratzlaff, T.; Aguiar, J.; Torrens, I.; Heredero, L.; Brice, A.; et al. Localization of the candidate gene D-amino acid oxidase outside the refined I-cM region of spinocerebellar ataxia 2. Am. J. Hum. Genet. 1995, 57, 972–975. [Google Scholar]
- Rodriguez-Labrada, R.; Velazquez-Perez, L.; Auburger, G.; Ziemann, U.; Canales-Ochoa, N.; Medrano-Montero, J.; Vazquez-Mojena, Y.; Gonzalez-Zaldivar, Y. Spinocerebellar ataxia type 2: Measures of saccade changes improve power for clinical trials. Mov. Disord. 2016, 31, 570–578. [Google Scholar] [CrossRef]
- Rodriguez-Labrada, R.; Velazquez-Perez, L.; Seigfried, C.; Canales-Ochoa, N.; Auburger, G.; Medrano-Montero, J.; Sanchez-Cruz, G.; Aguilera-Rodriguez, R.; Laffita-Mesa, J.; Vazquez-Mojena, Y.; et al. Saccadic latency is prolonged in Spinocerebellar Ataxia type 2 and correlates with the frontal-executive dysfunctions. J. Neurol. Sci. 2011, 306, 103–107. [Google Scholar] [CrossRef]
- Velazquez-Perez, L.; Seifried, C.; Abele, M.; Wirjatijasa, F.; Rodriguez-Labrada, R.; Santos-Falcon, N.; Sanchez-Cruz, G.; Almaguer-Mederos, L.; Tejeda, R.; Canales-Ochoa, N.; et al. Saccade velocity is reduced in presymptomatic spinocerebellar ataxia type 2. Clin. Neurophysiol. 2009, 120, 632–635. [Google Scholar] [CrossRef]
- Velazquez-Perez, L.; Seifried, C.; Santos-Falcon, N.; Abele, M.; Ziemann, U.; Almaguer, L.E.; Martinez-Gongora, E.; Sanchez-Cruz, G.; Canales, N.; Perez-Gonzalez, R.; et al. Saccade velocity is controlled by polyglutamine size in spinocerebellar ataxia 2. Ann. Neurol. 2004, 56, 444–447. [Google Scholar] [CrossRef]
- Auburger, G.W. Spinocerebellar ataxia type 2. Handb. Clin. Neurol. 2012, 103, 423–436. [Google Scholar] [PubMed]
- Pulst, S.M.; Nechiporuk, A.; Nechiporuk, T.; Gispert, S.; Chen, X.N.; Lopes-Cendes, I.; Pearlman, S.; Starkman, S.; Orozco-Diaz, G.; Lunkes, A.; et al. Moderate expansion of a normally biallelic trinucleotide repeat in spinocerebellar ataxia type 2. Nat. Genet. 1996, 14, 269–276. [Google Scholar] [CrossRef] [PubMed]
- Sanpei, K.; Takano, H.; Igarashi, S.; Sato, T.; Oyake, M.; Sasaki, H.; Wakisaka, A.; Tashiro, K.; Ishida, Y.; Ikeuchi, T.; et al. Identification of the spinocerebellar ataxia type 2 gene using a direct identification of repeat expansion and cloning technique, DIRECT. Nat. Genet. 1996, 14, 277–284. [Google Scholar] [CrossRef] [PubMed]
- Imbert, G.; Saudou, F.; Yvert, G.; Devys, D.; Trottier, Y.; Garnier, J.M.; Weber, C.; Mandel, J.L.; Cancel, G.; Abbas, N.; et al. Cloning of the gene for spinocerebellar ataxia 2 reveals a locus with high sensitivity to expanded CAG/glutamine repeats. Nat. Genet. 1996, 14, 285–291. [Google Scholar] [CrossRef] [PubMed]
- Auburger, G.; Sen, N.E.; Meierhofer, D.; Basak, A.N.; Gitler, A.D. Efficient Prevention of Neurodegenerative Diseases by Depletion of Starvation Response Factor Ataxin-2. Trends Neurosci. 2017, 40, 507–516. [Google Scholar] [CrossRef]
- Almaguer-Mederos, L.E.; Mesa, J.M.L.; Gonzalez-Zaldivar, Y.; Almaguer-Gotay, D.; Cuello-Almarales, D.; Aguilera-Rodriguez, R.; Falcon, N.S.; Gispert, S.; Auburger, G.; Velazquez-Perez, L. Factors associated with ATXN2 CAG/CAA repeat intergenerational instability in Spinocerebellar ataxia type 2. Clin. Genet. 2018, 94, 346–350. [Google Scholar] [CrossRef]
- Hoche, F.; Baliko, L.; den Dunnen, W.; Steinecker, K.; Bartos, L.; Safrany, E.; Auburger, G.; Deller, T.; Korf, H.W.; Klockgether, T.; et al. Spinocerebellar ataxia type 2 (SCA2): Identification of early brain degeneration in one monozygous twin in the initial disease stage. Cerebellum 2011, 10, 245–253. [Google Scholar] [CrossRef]
- Estrada, R.; Galarraga, J.; Orozco, G.; Nodarse, A.; Auburger, G. Spinocerebellar ataxia 2 (SCA2): Morphometric analyses in 11 autopsies. Acta Neuropathol. 1999, 97, 306–310. [Google Scholar] [CrossRef]
- Schols, L.; Gispert, S.; Vorgerd, M.; Menezes Vieira-Saecker, A.M.; Blanke, P.; Auburger, G.; Amoiridis, G.; Meves, S.; Epplen, J.T.; Przuntek, H.; et al. Spinocerebellar ataxia type 2. Genotype and phenotype in German kindreds. Arch. Neurol. 1997, 54, 1073–1080. [Google Scholar] [CrossRef]
- Riess, O.; Laccone, F.A.; Gispert, S.; Schols, L.; Zuhlke, C.; Vieira-Saecker, A.M.; Herlt, S.; Wessel, K.; Epplen, J.T.; Weber, B.H.; et al. SCA2 trinucleotide expansion in German SCA patients. Neurogenetics 1997, 1, 59–64. [Google Scholar] [CrossRef]
- Lahut, S.; Omur, O.; Uyan, O.; Agim, Z.S.; Ozoguz, A.; Parman, Y.; Deymeer, F.; Oflazer, P.; Koc, F.; Ozcelik, H.; et al. ATXN2 and its neighbouring gene SH2B3 are associated with increased ALS risk in the Turkish population. PLoS ONE 2012, 7, e42956. [Google Scholar] [CrossRef] [PubMed]
- Gispert, S.; Kurz, A.; Waibel, S.; Bauer, P.; Liepelt, I.; Geisen, C.; Gitler, A.D.; Becker, T.; Weber, M.; Berg, D.; et al. The modulation of Amyotrophic Lateral Sclerosis risk by ataxin-2 intermediate polyglutamine expansions is a specific effect. Neurobiol. Dis. 2012, 45, 356–361. [Google Scholar] [CrossRef] [PubMed]
- Rubino, E.; Mancini, C.; Boschi, S.; Ferrero, P.; Ferrone, M.; Bianca, S.; Zucca, M.; Orsi, L.; Pinessi, L.; Govone, F.; et al. ATXN2 intermediate repeat expansions influence the clinical phenotype in frontotemporal dementia. Neurobiol. Aging 2019, 73, 231. [Google Scholar] [CrossRef] [PubMed]
- Schols, L.; Reimold, M.; Seidel, K.; Globas, C.; Brockmann, K.; Hauser, T.K.; Auburger, G.; Burk, K.; den Dunnen, W.; Reischl, G.; et al. No parkinsonism in SCA2 and SCA3 despite severe neurodegeneration of the dopaminergic substantia nigra. Brain 2015, 138, 3316–3326. [Google Scholar] [CrossRef]
- Wang, L.; Aasly, J.O.; Annesi, G.; Bardien, S.; Bozi, M.; Brice, A.; Carr, J.; Chung, S.J.; Clarke, C.; Crosiers, D.; et al. Large-scale assessment of polyglutamine repeat expansions in Parkinson disease. Neurology 2015, 85, 1283–1292. [Google Scholar] [CrossRef]
- Ross, O.A.; Rutherford, N.J.; Baker, M.; Soto-Ortolaza, A.I.; Carrasquillo, M.M.; DeJesus-Hernandez, M.; Adamson, J.; Li, M.; Volkening, K.; Finger, E.; et al. Ataxin-2 repeat-length variation and neurodegeneration. Hum. Mol. Genet. 2011, 20, 3207–3212. [Google Scholar] [CrossRef]
- Taylor, L.M.; McMillan, P.J.; Kraemer, B.C.; Liachko, N.F. Tau tubulin kinases in proteinopathy. Febs J. 2019, 286, 2434–2446. [Google Scholar] [CrossRef]
- Elden, A.C.; Kim, H.J.; Hart, M.P.; Chen-Plotkin, A.S.; Johnson, B.S.; Fang, X.; Armakola, M.; Geser, F.; Greene, R.; Lu, M.M.; et al. Ataxin-2 intermediate-length polyglutamine expansions are associated with increased risk for ALS. Nature 2010, 466, 1069–1075. [Google Scholar] [CrossRef]
- Shulman, J.M.; Feany, M.B. Genetic modifiers of tauopathy in Drosophila. Genetics 2003, 165, 1233–1242. [Google Scholar]
- Al-Ramahi, I.; Perez, A.M.; Lim, J.; Zhang, M.; Sorensen, R.; de Haro, M.; Branco, J.; Pulst, S.M.; Zoghbi, H.Y.; Botas, J. dAtaxin-2 mediates expanded Ataxin-1-induced neurodegeneration in a Drosophila model of SCA1. PLoS Genet. 2007, 3, e234. [Google Scholar] [CrossRef]
- Auburger, G.; Gispert, S.; Lahut, S.; Omur, O.; Damrath, E.; Heck, M.; Basak, N. 12q24 locus association with type 1 diabetes: SH2B3 or ATXN2? World J. Diabetes 2014, 5, 316–327. [Google Scholar] [CrossRef] [PubMed]
- Sebastiani, P.; Solovieff, N.; Puca, A.; Hartley, S.W.; Melista, E.; Andersen, S.; Dworkis, D.A.; Wilk, J.B.; Myers, R.H.; Steinberg, M.H.; et al. Genetic signatures of exceptional longevity in humans. Science 2010, 2010. [Google Scholar] [CrossRef]
- Becker, L.A.; Huang, B.; Bieri, G.; Ma, R.; Knowles, D.A.; Jafar-Nejad, P.; Messing, J.; Kim, H.J.; Soriano, A.; Auburger, G.; et al. Therapeutic reduction of ataxin-2 extends lifespan and reduces pathology in TDP-43 mice. Nature 2017, 544, 367–371. [Google Scholar] [CrossRef] [Green Version]
- Scoles, D.R.; Meera, P.; Schneider, M.D.; Paul, S.; Dansithong, W.; Figueroa, K.P.; Hung, G.; Rigo, F.; Bennett, C.F.; Otis, T.S.; et al. Antisense oligonucleotide therapy for spinocerebellar ataxia type 2. Nature 2017, 544, 362–366. [Google Scholar] [CrossRef]
- Aguiar, J.; Santurlidis, S.; Nowok, J.; Alexander, C.; Rudnicki, D.; Gispert, S.; Schulz, W.; Auburger, G. Identification of the physiological promoter for spinocerebellar ataxia 2 gene reveals a CpG island for promoter activity situated into the exon 1 of this gene and provides data about the origin of the nonmethylated state of these types of islands. Biochem. Biophys. Res. Commun. 1999, 254, 315–318. [Google Scholar] [CrossRef] [PubMed]
- Lastres-Becker, I.; Nonis, D.; Eich, F.; Klinkenberg, M.; Gorospe, M.; Kotter, P.; Klein, F.A.; Kedersha, N.; Auburger, G. Mammalian ataxin-2 modulates translation control at the pre-initiation complex via PI3K/mTOR and is induced by starvation. Biochim. Et Biophys. Acta 2016, 1862, 1558–1569. [Google Scholar] [CrossRef] [PubMed]
- Damrath, E.; Heck, M.V.; Gispert, S.; Azizov, M.; Nowock, J.; Seifried, C.; Rub, U.; Walter, M.; Auburger, G. ATXN2-CAG42 sequesters PABPC1 into insolubility and induces FBXW8 in cerebellum of old ataxic knock-in mice. PLoS Genet. 2012, 8, e1002920. [Google Scholar] [CrossRef]
- Yokoshi, M.; Li, Q.; Yamamoto, M.; Okada, H.; Suzuki, Y.; Kawahara, Y. Direct binding of Ataxin-2 to distinct elements in 3’ UTRs promotes mRNA stability and protein expression. Mol. Cell 2014, 55, 186–198. [Google Scholar] [CrossRef]
- Lastres-Becker, I.; Nonis, D.; Nowock, J.; Auburger, G. New alternative splicing variants of the ATXN2 transcript. Neurol. Res. Pract. 2019, 1, 22. [Google Scholar] [CrossRef] [Green Version]
- Drost, J.; Nonis, D.; Eich, F.; Leske, O.; Damrath, E.; Brunt, E.R.; Lastres-Becker, I.; Heumann, R.; Nowock, J.; Auburger, G. Ataxin-2 modulates the levels of Grb2 and SRC but not ras signaling. J. Mol. Neurosci. 2013, 51, 68–81. [Google Scholar] [CrossRef] [Green Version]
- Nonis, D.; Schmidt, M.H.H.; van de Loo, S.; Eich, F.; Dikic, I.; Nowock, J.; Auburger, G. Ataxin-2 associates with the endocytosis complex and affects EGF receptor trafficking. Cell. Signal. 2008, 20, 1725–1739. [Google Scholar] [CrossRef] [PubMed]
- Fittschen, M.; Lastres-Becker, I.; Halbach, M.V.; Damrath, E.; Gispert, S.; Azizov, M.; Walter, M.; Muller, S.; Auburger, G. Genetic ablation of ataxin-2 increases several global translation factors in their transcript abundance but decreases translation rate. Neurogenetics 2015, 16, 181–192. [Google Scholar] [CrossRef] [PubMed] [Green Version]
- van de Loo, S.; Eich, F.; Nonis, D.; Auburger, G.; Nowock, J. Ataxin-2 associates with rough endoplasmic reticulum. Exp. Neurol. 2009, 215, 110–118. [Google Scholar] [CrossRef] [PubMed]
- Nonhoff, U.; Ralser, M.; Welzel, F.; Piccini, I.; Balzereit, D.; Yaspo, M.L.; Lehrach, H.; Krobitsch, S. Ataxin-2 interacts with the DEAD/H-box RNA helicase DDX6 and interferes with P-bodies and stress granules. Mol. Biol. Cell 2007, 18, 1385–1396. [Google Scholar] [CrossRef] [PubMed]
- Anderson, P.; Kedersha, N. Stress granules: The Tao of RNA triage. Trends Biochem. Sci. 2008, 33, 141–150. [Google Scholar] [CrossRef] [PubMed]
- Jimenez-Lopez, D.; Guzman, P. Insights into the evolution and domain structure of Ataxin-2 proteins across eukaryotes. BMC Res. Notes 2014, 7, 453. [Google Scholar] [CrossRef] [Green Version]
- Mangus, D.A.; Amrani, N.; Jacobson, A. Pbp1p, a factor interacting with Saccharomyces cerevisiae poly(A)-binding protein, regulates polyadenylation. Mol. Cell. Biol. 1998, 18, 7383–7396. [Google Scholar] [CrossRef] [Green Version]
- Bar, D.Z.; Charar, C.; Dorfman, J.; Yadid, T.; Tafforeau, L.; Lafontaine, D.L.; Gruenbaum, Y. Cell size and fat content of dietary-restricted Caenorhabditis elegans are regulated by ATX-2, an mTOR repressor. Proc. Natl. Acad. Sci. USA 2016, 113, E4620–E4629. [Google Scholar] [CrossRef] [Green Version]
- Satterfield, T.F.; Jackson, S.M.; Pallanck, L.J. A Drosophila homolog of the polyglutamine disease gene SCA2 is a dosage-sensitive regulator of actin filament formation. Genetics 2002, 162, 1687–1702. [Google Scholar]
- Lastres-Becker, I.; Brodesser, S.; Lutjohann, D.; Azizov, M.; Buchmann, J.; Hintermann, E.; Sandhoff, K.; Schurmann, A.; Nowock, J.; Auburger, G. Insulin receptor and lipid metabolism pathology in ataxin-2 knock-out mice. Hum. Mol. Genet. 2008, 17, 1465–1481. [Google Scholar] [CrossRef] [Green Version]
- Sen, N.E.; Canet-Pons, J.; Halbach, M.V.; Arsovic, A.; Pilatus, U.; Chae, W.H.; Kaya, Z.E.; Seidel, K.; Rollmann, E.; Mittelbronn, M.; et al. Generation of an Atxn2-CAG100 knock-in mouse reveals N-acetylaspartate production deficit due to early Nat8l dysregulation. Neurobiol. Dis. 2019, 132, 104559. [Google Scholar] [CrossRef] [PubMed]
- Seidel, K.; Siswanto, S.; Fredrich, M.; Bouzrou, M.; den Dunnen, W.F.A.; Ozerden, I.; Korf, H.W.; Melegh, B.; de Vries, J.J.; Brunt, E.R.; et al. On the distribution of intranuclear and cytoplasmic aggregates in the brainstem of patients with spinocerebellar ataxia type 2 and 3. Brain Pathol. 2017, 27, 345–355. [Google Scholar] [CrossRef] [PubMed]
- Halbach, M.V.; Gispert, S.; Stehning, T.; Damrath, E.; Walter, M.; Auburger, G. Atxn2 Knockout and CAG42-Knock-in Cerebellum Shows Similarly Dysregulated Expression in Calcium Homeostasis Pathway. Cerebellum 2017, 16, 68–81. [Google Scholar] [CrossRef] [PubMed] [Green Version]
- Koch, P.; Breuer, P.; Peitz, M.; Jungverdorben, J.; Kesavan, J.; Poppe, D.; Doerr, J.; Ladewig, J.; Mertens, J.; Tuting, T.; et al. Excitation-induced ataxin-3 aggregation in neurons from patients with Machado-Joseph disease. Nature 2011, 480, 543–546. [Google Scholar] [CrossRef]
- Rub, U.; Schols, L.; Paulson, H.; Auburger, G.; Kermer, P.; Jen, J.C.; Seidel, K.; Korf, H.W.; Deller, T. Clinical features, neurogenetics and neuropathology of the polyglutamine spinocerebellar ataxias type 1, 2, 3, 6 and 7. Prog. Neurobiol. 2013, 104, 38–66. [Google Scholar] [CrossRef]
- Lastres-Becker, I.; Rub, U.; Auburger, G. Spinocerebellar ataxia 2 (SCA2). Cerebellum 2008, 7, 115–124. [Google Scholar] [CrossRef]
- Fernandez-Ruiz, J.; Velasquez-Perez, L.; Diaz, R.; Drucker-Colin, R.; Perez-Gonzalez, R.; Canales, N.; Sanchez-Cruz, G.; Martinez-Gongora, E.; Medrano, Y.; Almaguer-Mederos, L.; et al. Prism adaptation in spinocerebellar ataxia type 2. Neuropsychologia 2007, 45, 2692–2698. [Google Scholar] [CrossRef]
- Freund, H.J.; Barnikol, U.B.; Nolte, D.; Treuer, H.; Auburger, G.; Tass, P.A.; Samii, M.; Sturm, V. Subthalamic-thalamic DBS in a case with spinocerebellar ataxia type 2 and severe tremor-A unusual clinical benefit. Mov. Disord. 2007, 22, 732–735. [Google Scholar] [CrossRef]
- Velazquez-Perez, L.; Rodriguez-Labrada, R.; Torres-Vega, R.; Ortega-Sanchez, R.; Medrano-Montero, J.; Gonzalez-Pina, R.; Vazquez-Mojena, Y.; Auburger, G.; Ziemann, U. Progression of corticospinal tract dysfunction in pre-ataxic spinocerebellar ataxia type 2: A two-years follow-up TMS study. Clin. Neurophysiol. 2018, 129, 895–900. [Google Scholar] [CrossRef]
- Velazquez-Perez, L.; Tunnerhoff, J.; Rodriguez-Labrada, R.; Torres-Vega, R.; Ruiz-Gonzalez, Y.; Belardinelli, P.; Medrano-Montero, J.; Canales-Ochoa, N.; Gonzalez-Zaldivar, Y.; Vazquez-Mojena, Y.; et al. Early corticospinal tract damage in prodromal SCA2 revealed by EEG-EMG and EMG-EMG coherence. Clin. Neurophysiol. 2017, 128, 2493–2502. [Google Scholar] [CrossRef]
- Velazquez-Perez, L.; Tunnerhoff, J.; Rodriguez-Labrada, R.; Torres-Vega, R.; Belardinelli, P.; Medrano-Montero, J.; Pena-Acosta, A.; Canales-Ochoa, N.; Vazquez-Mojena, Y.; Gonzalez-Zaldivar, Y.; et al. Corticomuscular Coherence: A Novel Tool to Assess the Pyramidal Tract Dysfunction in Spinocerebellar Ataxia Type 2. Cerebellum 2017, 16, 602–606. [Google Scholar] [CrossRef] [PubMed]
- Velazquez-Perez, L.; Rodriguez-Labrada, R.; Torres-Vega, R.; Medrano Montero, J.; Vazquez-Mojena, Y.; Auburger, G.; Ziemann, U. Abnormal corticospinal tract function and motor cortex excitability in non-ataxic SCA2 mutation carriers: A TMS study. Clin. Neurophysiol. 2016, 127, 2713–2719. [Google Scholar] [CrossRef] [PubMed]
- Velazquez-Perez, L.; Rodriguez-Labrada, R.; Cruz-Rivas, E.M.; Fernandez-Ruiz, J.; Vaca-Palomares, I.; Lilia-Campins, J.; Cisneros, B.; Pena-Acosta, A.; Vazquez-Mojena, Y.; Diaz, R.; et al. Comprehensive study of early features in spinocerebellar ataxia 2: Delineating the prodromal stage of the disease. Cerebellum 2014, 13, 568–579. [Google Scholar] [CrossRef] [PubMed]
- Medrano Montero, J.; Velasquez-Perez, L.; Rodriguez-Diaz, J.; Canales Ochoa, N.; Pena-Acosta, A.; Almaguer, L.E.; Estupinan-Rodriguez, A.; Auburger, G. Early cranial nerve dysfunction is correlated to altered facial morphology in spinocerebellar ataxia type 2. Investig. En Discapac. 2018, 7, 53–66. [Google Scholar]
- Magana, J.J.; Velazquez-Perez, L.; Cisneros, B. Spinocerebellar ataxia type 2: Clinical presentation, molecular mechanisms, and therapeutic perspectives. Mol. Neurobiol. 2013, 47, 90–104. [Google Scholar] [CrossRef]
- Almaguer-Mederos, L.E.; Falcon, N.S.; Almira, Y.R.; Zaldivar, Y.G.; Almarales, D.C.; Gongora, E.M.; Herrera, M.P.; Batallan, K.E.; Arminan, R.R.; Manresa, M.V.; et al. Estimation of the age at onset in spinocerebellar ataxia type 2 Cuban patients by survival analysis. Clin. Genet. 2010, 78, 169–174. [Google Scholar] [CrossRef]
- Rodriguez-Labrada, R.; Galicia-Polo, L.; Canales-Ochoa, N.; Voss, U.; Tuin, I.; Pena-Acosta, A.; Estupinan-Rodriguez, A.; Medrano-Montero, J.; Vazquez-Mojena, Y.; Gonzalez-Zaldivar, Y.; et al. Sleep spindles and K-complex activities are decreased in spinocerebellar ataxia type 2: Relationship to memory and motor performances. Sleep Med. 2019, 60, 188–196. [Google Scholar] [CrossRef]
- Pfeffer, M.; Gispert, S.; Auburger, G.; Wicht, H.; Korf, H.W. Impact of Ataxin-2 knock out on circadian locomotor behavior and PER immunoreaction in the SCN of mice. Chronobiol. Int. 2017, 34, 129–137. [Google Scholar] [CrossRef]
- Velazquez-Perez, L.; Voss, U.; Rodriguez-Labrada, R.; Auburger, G.; Canales Ochoa, N.; Sanchez Cruz, G.; Galicia Polo, L.; Haro Valencia, R.; Aguilera Rodriguez, R.; Medrano Montero, J.; et al. Sleep disorders in spinocerebellar ataxia type 2 patients. Neuro-Degener. Dis. 2011, 8, 447–454. [Google Scholar] [CrossRef]
- Tuin, I.; Voss, U.; Kang, J.S.; Kessler, K.; Rub, U.; Nolte, D.; Lochmuller, H.; Tinschert, S.; Claus, D.; Krakow, K.; et al. Stages of sleep pathology in spinocerebellar ataxia type 2 (SCA2). Neurology 2006, 67, 1966–1972. [Google Scholar] [CrossRef]
- Reetz, K.; Rodriguez-Labrada, R.; Dogan, I.; Mirzazade, S.; Romanzetti, S.; Schulz, J.B.; Cruz-Rivas, E.M.; Alvarez-Cuesta, J.A.; Aguilera Rodriguez, R.; Gonzalez Zaldivar, Y.; et al. Brain atrophy measures in preclinical and manifest spinocerebellar ataxia type 2. Ann. Clin. Transl. Neurol. 2018, 5, 128–137. [Google Scholar] [CrossRef] [PubMed]
- Wang, P.S.; Chen, H.C.; Wu, H.M.; Lirng, J.F.; Wu, Y.T.; Soong, B.W. Association between proton magnetic resonance spectroscopy measurements and CAG repeat number in patients with spinocerebellar ataxias 2, 3, or 6. PLoS ONE 2012, 7, e47479. [Google Scholar] [CrossRef] [PubMed] [Green Version]
- Auburger, G.; Klinkenberg, M.; Drost, J.; Marcus, K.; Morales-Gordo, B.; Kunz, W.S.; Brandt, U.; Broccoli, V.; Reichmann, H.; Gispert, S.; et al. Primary skin fibroblasts as a model of Parkinson’s disease. Mol. Neurobiol. 2012, 46, 20–27. [Google Scholar] [CrossRef] [Green Version]
- Lahut, S.; Gispert, S.; Omur, O.; Depboylu, C.; Seidel, K.; Dominguez-Bautista, J.A.; Brehm, N.; Tireli, H.; Hackmann, K.; Pirkevi, C.; et al. Blood RNA biomarkers in prodromal PARK4 and rapid eye movement sleep behavior disorder show role of complexin 1 loss for risk of Parkinson’s disease. Dis. Models Mech. 2017, 10, 619–631. [Google Scholar] [CrossRef] [PubMed] [Green Version]
- Sen, N.E.; Drost, J.; Gispert, S.; Torres-Odio, S.; Damrath, E.; Klinkenberg, M.; Hamzeiy, H.; Akdal, G.; Gulluoglu, H.; Basak, A.N.; et al. Search for SCA2 blood RNA biomarkers highlights Ataxin-2 as strong modifier of the mitochondrial factor PINK1 levels. Neurobiol. Dis. 2016, 96, 115–126. [Google Scholar] [CrossRef] [PubMed]
- Pujol-Lereis, L.M. Alteration of Sphingolipids in Biofluids: Implications for Neurodegenerative Diseases. Int. J. Mol. Sci. 2019, 20, 3564. [Google Scholar] [CrossRef] [PubMed] [Green Version]
- Deak, F.; Anderson, R.E.; Fessler, J.L.; Sherry, D.M. Novel Cellular Functions of Very Long Chain-Fatty Acids: Insight From ELOVL4 Mutations. Front. Cell. Neurosci. 2019, 13, 428. [Google Scholar] [CrossRef]
- Rub, U.; Del Turco, D.; Del Tredici, K.; de Vos, R.A.; Brunt, E.R.; Reifenberger, G.; Seifried, C.; Schultz, C.; Auburger, G.; Braak, H. Thalamic involvement in a spinocerebellar ataxia type 2 (SCA2) and a spinocerebellar ataxia type 3 (SCA3) patient, and its clinical relevance. Brain 2003, 126, 2257–2272. [Google Scholar] [CrossRef] [Green Version]
- Rub, U.; Schultz, C.; Del Tredici, K.; Gierga, K.; Reifenberger, G.; de Vos, R.A.; Seifried, C.; Braak, H.; Auburger, G. Anatomically based guidelines for systematic investigation of the central somatosensory system and their application to a spinocerebellar ataxia type 2 (SCA2) patient. Neuropathol. Appl. Neurobiol. 2003, 29, 418–433. [Google Scholar] [CrossRef]
- Rub, U.; Del Turco, D.; Burk, K.; Diaz, G.O.; Auburger, G.; Mittelbronn, M.; Gierga, K.; Ghebremedhin, E.; Schultz, C.; Schols, L.; et al. Extended pathoanatomical studies point to a consistent affection of the thalamus in spinocerebellar ataxia type 2. Neuropathol. Appl. Neurobiol. 2005, 31, 127–140. [Google Scholar] [CrossRef]
- Rub, U.; Gierga, K.; Brunt, E.R.; de Vos, R.A.; Bauer, M.; Schols, L.; Burk, K.; Auburger, G.; Bohl, J.; Schultz, C.; et al. Spinocerebellar ataxias types 2 and 3: Degeneration of the pre-cerebellar nuclei isolates the three phylogenetically defined regions of the cerebellum. J. Neural Transm. 2005, 112, 1523–1545. [Google Scholar] [CrossRef] [PubMed]
- Gierga, K.; Burk, K.; Bauer, M.; Orozco Diaz, G.; Auburger, G.; Schultz, C.; Vuksic, M.; Schols, L.; de Vos, R.A.; Braak, H.; et al. Involvement of the cranial nerves and their nuclei in spinocerebellar ataxia type 2 (SCA2). Acta Neuropathol. 2005, 109, 617–631. [Google Scholar] [CrossRef] [PubMed]
- Rub, U.; Seidel, K.; Ozerden, I.; Gierga, K.; Brunt, E.R.; Schols, L.; de Vos, R.A.; den Dunnen, W.; Schultz, C.; Auburger, G.; et al. Consistent affection of the central somatosensory system in spinocerebellar ataxia type 2 and type 3 and its significance for clinical symptoms and rehabilitative therapy. Brain Res. Rev. 2007, 53, 235–249. [Google Scholar] [CrossRef] [PubMed]
- Rub, U.; Brunt, E.R.; Petrasch-Parwez, E.; Schols, L.; Theegarten, D.; Auburger, G.; Seidel, K.; Schultz, C.; Gierga, K.; Paulson, H.; et al. Degeneration of ingestion-related brainstem nuclei in spinocerebellar ataxia type 2, 3, 6 and 7. Neuropathol. Appl. Neurobiol. 2006, 32, 635–649. [Google Scholar] [CrossRef] [PubMed]
- Hoche, F.; Seidel, K.; Brunt, E.R.; Auburger, G.; Schols, L.; Burk, K.; de Vos, R.A.; den Dunnen, W.; Bechmann, I.; Egensperger, R.; et al. Involvement of the auditory brainstem system in spinocerebellar ataxia type 2 (SCA2), type 3 (SCA3) and type 7 (SCA7). Neuropathol. Appl. Neurobiol. 2008, 34, 479–491. [Google Scholar] [CrossRef] [PubMed]
- Scherzed, W.; Brunt, E.R.; Heinsen, H.; de Vos, R.A.; Seidel, K.; Burk, K.; Schols, L.; Auburger, G.; Del Turco, D.; Deller, T.; et al. Pathoanatomy of cerebellar degeneration in spinocerebellar ataxia type 2 (SCA2) and type 3 (SCA3). Cerebellum 2012, 11, 749–760. [Google Scholar] [CrossRef] [PubMed]
- Seidel, K.; Siswanto, S.; Brunt, E.R.; den Dunnen, W.; Korf, H.W.; Rub, U. Brain pathology of spinocerebellar ataxias. Acta Neuropathol. 2012, 124, 1–21. [Google Scholar] [CrossRef]
- Rub, U.; Farrag, K.; Seidel, K.; Brunt, E.R.; Heinsen, H.; Burk, K.; Melegh, B.; von Gall, C.; Auburger, G.; Bohl, J.; et al. Involvement of the cholinergic basal forebrain nuclei in spinocerebellar ataxia type 2 (SCA2). Neuropathol. Appl. Neurobiol. 2013, 39, 634–643. [Google Scholar] [CrossRef]
- Olsen, A.S.B.; Faergeman, N.J. Sphingolipids: Membrane microdomains in brain development, function and neurological diseases. Open Biol. 2017, 7, 170069. [Google Scholar] [CrossRef] [Green Version]
- Baumann, N.; Pham-Dinh, D. Biology of oligodendrocyte and myelin in the mammalian central nervous system. Physiol. Rev. 2001, 81, 871–927. [Google Scholar] [CrossRef]
- Imgrund, S.; Hartmann, D.; Farwanah, H.; Eckhardt, M.; Sandhoff, R.; Degen, J.; Gieselmann, V.; Sandhoff, K.; Willecke, K. Adult ceramide synthase 2 (CERS2)-deficient mice exhibit myelin sheath defects, cerebellar degeneration, and hepatocarcinomas. J. Biol. Chem. 2009, 284, 33549–33560. [Google Scholar] [CrossRef] [PubMed] [Green Version]
- Hallett, P.J.; Huebecker, M.; Brekk, O.R.; Moloney, E.B.; Rocha, E.M.; Priestman, D.A.; Platt, F.M.; Isacson, O. Glycosphingolipid levels and glucocerebrosidase activity are altered in normal aging of the mouse brain. Neurobiol. Aging 2018, 67, 189–200. [Google Scholar] [CrossRef] [PubMed]
- Posse de Chaves, E.; Sipione, S. Sphingolipids and gangliosides of the nervous system in membrane function and dysfunction. FEBS Lett. 2010, 584, 1748–1759. [Google Scholar] [CrossRef] [PubMed] [Green Version]
- Yoshihara, T.; Satake, H.; Nishie, T.; Okino, N.; Hatta, T.; Otani, H.; Naruse, C.; Suzuki, H.; Sugihara, K.; Kamimura, E.; et al. Lactosylceramide synthases encoded by B4galt5 and 6 genes are pivotal for neuronal generation and myelin formation in mice. PLoS Genet. 2018, 14, e1007545. [Google Scholar] [CrossRef] [PubMed]
- Paciorkowski, A.R.; Shafrir, Y.; Hrivnak, J.; Patterson, M.C.; Tennison, M.B.; Clark, H.B.; Gomez, C.M. Massive expansion of SCA2 with autonomic dysfunction, retinitis pigmentosa, and infantile spasms. Neurology 2011, 77, 1055–1060. [Google Scholar] [CrossRef] [PubMed]
- Yagishita, S.; Inoue, M. Clinicopathology of spinocerebellar degeneration: Its correlation to the unstable CAG repeat of the affected gene. Pathol. Int. 1997, 47, 1–15. [Google Scholar] [CrossRef]
- Jellinger, K.A. Multiple System Atrophy: An Oligodendroglioneural Synucleinopathy1. J. Alzheimer’s Dis. 2018, 62, 1141–1179. [Google Scholar] [CrossRef] [Green Version]
- Park, H.; Kim, H.J.; Jeon, B.S. Parkinsonism in spinocerebellar ataxia. Biomed Res. Int. 2015, 2015, 125273. [Google Scholar] [CrossRef] [Green Version]
- Saini, H.S.; Coelho, R.P.; Goparaju, S.K.; Jolly, P.S.; Maceyka, M.; Spiegel, S.; Sato-Bigbee, C. Novel role of sphingosine kinase 1 as a mediator of neurotrophin-3 action in oligodendrocyte progenitors. J. Neurochem. 2005, 95, 1298–1310. [Google Scholar] [CrossRef]
- Di Pardo, A.; Maglione, V. Sphingolipid Metabolism: A New Therapeutic Opportunity for Brain Degenerative Disorders. Front. Neurosci. 2018, 12, 249. [Google Scholar] [CrossRef]
- Ben-David, O.; Pewzner-Jung, Y.; Brenner, O.; Laviad, E.L.; Kogot-Levin, A.; Weissberg, I.; Biton, I.E.; Pienik, R.; Wang, E.; Kelly, S.; et al. Encephalopathy caused by ablation of very long acyl chain ceramide synthesis may be largely due to reduced galactosylceramide levels. J. Biol. Chem. 2011, 286, 30022–30033. [Google Scholar] [CrossRef] [PubMed] [Green Version]
- Suzuki, E.; Handa, K.; Toledo, M.S.; Hakomori, S. Sphingosine-dependent apoptosis: A unified concept based on multiple mechanisms operating in concert. Proc. Natl. Acad. Sci. USA 2004, 101, 14788–14793. [Google Scholar] [CrossRef] [PubMed] [Green Version]
- Grassi, S.; Chiricozzi, E.; Mauri, L.; Sonnino, S.; Prinetti, A. Sphingolipids and neuronal degeneration in lysosomal storage disorders. J. Neurochem. 2019, 148, 600–611. [Google Scholar] [CrossRef] [PubMed]
- Miller, L.G., Jr.; Young, J.A.; Ray, S.K.; Wang, G.; Purohit, S.; Banik, N.L.; Dasgupta, S. Sphingosine Toxicity in EAE and MS: Evidence for Ceramide Generation via Serine-Palmitoyltransferase Activation. Neurochem. Res. 2017, 42, 2755–2768. [Google Scholar] [CrossRef] [PubMed]
- Snook, E.R.; Fisher-Perkins, J.M.; Sansing, H.A.; Lee, K.M.; Alvarez, X.; MacLean, A.G.; Peterson, K.E.; Lackner, A.A.; Bunnell, B.A. Innate immune activation in the pathogenesis of a murine model of globoid cell leukodystrophy. Am. J. Pathol. 2014, 184, 382–396. [Google Scholar] [CrossRef] [PubMed] [Green Version]
- Velazquez-Perez, L.; Rodriguez-Labrada, R.; Torres-Vega, R.; Montero, J.M.; Vazquez-Mojena, Y.; Auburger, G.; Ziemann, U. Central motor conduction time as prodromal biomarker in spinocerebellar ataxia type 2. Mov. Disord. 2016, 31, 603–604. [Google Scholar] [CrossRef]
- Hussain, M.M.; Jin, W.; Jiang, X.C. Mechanisms involved in cellular ceramide homeostasis. Nutr. Metab. 2012, 9, 71. [Google Scholar] [CrossRef] [Green Version]
- Airola, M.V.; Hannun, Y.A. Sphingolipid metabolism and neutral sphingomyelinases. Handb. Exp. Pharmacol. 2013, 215, 57–76. [Google Scholar]
- Cui, M.; Ying, R.; Jiang, X.; Li, G.; Zhang, X.; Zheng, J.; Tam, K.Y.; Liang, B.; Shi, A.; Gobel, V.; et al. A Model of Hereditary Sensory and Autonomic Neuropathy Type 1 Reveals a Role of Glycosphingolipids in Neuronal Polarity. J. Neurosci. 2019, 39, 5816–5834. [Google Scholar] [CrossRef] [Green Version]
- Rotthier, A.; Auer-Grumbach, M.; Janssens, K.; Baets, J.; Penno, A.; Almeida-Souza, L.; Van Hoof, K.; Jacobs, A.; De Vriendt, E.; Schlotter-Weigel, B.; et al. Mutations in the SPTLC2 subunit of serine palmitoyltransferase cause hereditary sensory and autonomic neuropathy type I. Am. J. Hum. Genet. 2010, 87, 513–522. [Google Scholar] [CrossRef] [Green Version]
- Couttas, T.A.; Kain, N.; Suchowerska, A.K.; Quek, L.E.; Turner, N.; Fath, T.; Garner, B.; Don, A.S. Loss of ceramide synthase 2 activity, necessary for myelin biosynthesis, precedes tau pathology in the cortical pathogenesis of Alzheimer’s disease. Neurobiol. Aging 2016, 43, 89–100. [Google Scholar] [CrossRef] [PubMed]
- Mosbech, M.B.; Olsen, A.S.; Neess, D.; Ben-David, O.; Klitten, L.L.; Larsen, J.; Sabers, A.; Vissing, J.; Nielsen, J.E.; Hasholt, L.; et al. Reduced ceramide synthase 2 activity causes progressive myoclonic epilepsy. Ann. Clin. Transl. Neurol. 2014, 1, 88–98. [Google Scholar] [CrossRef] [PubMed]
- Vanni, N.; Fruscione, F.; Ferlazzo, E.; Striano, P.; Robbiano, A.; Traverso, M.; Sander, T.; Falace, A.; Gazzerro, E.; Bramanti, P.; et al. Impairment of ceramide synthesis causes a novel progressive myoclonus epilepsy. Ann. Neurol. 2014, 76, 206–212. [Google Scholar] [CrossRef] [PubMed]
- Mullen, T.D.; Hannun, Y.A.; Obeid, L.M. Ceramide synthases at the centre of sphingolipid metabolism and biology. Biochem. J. 2012, 441, 789–802. [Google Scholar] [CrossRef] [Green Version]
- Yabu, T.; Shiba, H.; Shibasaki, Y.; Nakanishi, T.; Imamura, S.; Touhata, K.; Yamashita, M. Stress-induced ceramide generation and apoptosis via the phosphorylation and activation of nSMase1 by JNK signaling. Cell Death Differ. 2015, 22, 258–273. [Google Scholar] [CrossRef] [Green Version]
- Wheeler, D.; Knapp, E.; Bandaru, V.V.; Wang, Y.; Knorr, D.; Poirier, C.; Mattson, M.P.; Geiger, J.D.; Haughey, N.J. Tumor necrosis factor-alpha-induced neutral sphingomyelinase-2 modulates synaptic plasticity by controlling the membrane insertion of NMDA receptors. J. Neurochem. 2009, 109, 1237–1249. [Google Scholar] [CrossRef] [Green Version]
- Iguchi, Y.; Eid, L.; Parent, M.; Soucy, G.; Bareil, C.; Riku, Y.; Kawai, K.; Takagi, S.; Yoshida, M.; Katsuno, M.; et al. Exosome secretion is a key pathway for clearance of pathological TDP-43. Brain 2016, 139, 3187–3201. [Google Scholar] [CrossRef] [Green Version]
- Stoffel, W.; Jenke, B.; Schmidt-Soltau, I.; Binczek, E.; Brodesser, S.; Hammels, I. SMPD3 deficiency perturbs neuronal proteostasis and causes progressive cognitive impairment. Cell Death Dis. 2018, 9, 507. [Google Scholar] [CrossRef]
- Hernandez-Corbacho, M.J.; Salama, M.F.; Canals, D.; Senkal, C.E.; Obeid, L.M. Sphingolipids in mitochondria. Biochim. Et Biophys. Acta. Mol. Cell Biol. Lipids 2017, 1862, 56–68. [Google Scholar] [CrossRef] [Green Version]
- Lin, G.; Wang, L.; Marcogliese, P.C.; Bellen, H.J. Sphingolipids in the Pathogenesis of Parkinson’s Disease and Parkinsonism. Trends Endocrinol. Metab. 2019, 30, 106–117. [Google Scholar] [CrossRef]
- Schuchman, E.H.; Desnick, R.J. Types A and B Niemann-Pick disease. Mol. Genet. Metab. 2017, 120, 27–33. [Google Scholar] [CrossRef] [PubMed] [Green Version]
- Mao, C.; Obeid, L.M. Ceramidases: Regulators of cellular responses mediated by ceramide, sphingosine, and sphingosine-1-phosphate. Biochim. Et Biophys. Acta 2008, 1781, 424–434. [Google Scholar] [CrossRef] [PubMed] [Green Version]
- Tani, M.; Sano, T.; Ito, M.; Igarashi, Y. Mechanisms of sphingosine and sphingosine 1-phosphate generation in human platelets. J. Lipid Res. 2005, 46, 2458–2467. [Google Scholar] [CrossRef] [PubMed] [Green Version]
- Sundaram, K.; Mather, A.R.; Marimuthu, S.; Shah, P.P.; Snider, A.J.; Obeid, L.M.; Hannun, Y.A.; Beverly, L.J.; Siskind, L.J. Loss of neutral ceramidase protects cells from nutrient- and energy -deprivation-induced cell death. Biochem. J. 2016, 473, 743–755. [Google Scholar] [CrossRef] [Green Version]
- Monick, M.M.; Cameron, K.; Powers, L.S.; Butler, N.S.; McCoy, D.; Mallampalli, R.K.; Hunninghake, G.W. Sphingosine kinase mediates activation of extracellular signal-related kinase and Akt by respiratory syncytial virus. Am. J. Respir. Cell Mol. Biol. 2004, 30, 844–852. [Google Scholar] [CrossRef]
- Kihara, A. Very long-chain fatty acids: Elongation, physiology and related disorders. J. Biochem. 2012, 152, 387–395. [Google Scholar] [CrossRef]
- Mueller, N.; Sassa, T.; Morales-Gonzalez, S.; Schneider, J.; Salchow, D.J.; Seelow, D.; Knierim, E.; Stenzel, W.; Kihara, A.; Schuelke, M. De novo mutation in ELOVL1 causes ichthyosis, acanthosis nigricans, hypomyelination, spastic paraplegia, high frequency deafness and optic atrophy. J. Med. Genet. 2019, 56, 164–175. [Google Scholar] [CrossRef]
- Kutkowska-Kazmierczak, A.; Rydzanicz, M.; Chlebowski, A.; Klosowska-Kosicka, K.; Mika, A.; Gruchota, J.; Jurkiewicz, E.; Kowalewski, C.; Pollak, A.; Stradomska, T.J.; et al. Dominant ELOVL1 mutation causes neurological disorder with ichthyotic keratoderma, spasticity, hypomyelination and dysmorphic features. J. Med. Genet. 2018, 55, 408–414. [Google Scholar] [CrossRef]
- Shimano, H. Novel qualitative aspects of tissue fatty acids related to metabolic regulation: Lessons from Elovl6 knockout. Prog. Lipid Res. 2012, 51, 267–271. [Google Scholar] [CrossRef]
- Hoxha, E.; Gabriele, R.M.C.; Balbo, I.; Ravera, F.; Masante, L.; Zambelli, V.; Albergo, C.; Mitro, N.; Caruso, D.; Di Gregorio, E.; et al. Motor Deficits and Cerebellar Atrophy in Elovl5 Knock Out Mice. Front. Cell. Neurosci. 2017, 11, 343. [Google Scholar] [CrossRef] [Green Version]
- Di Gregorio, E.; Borroni, B.; Giorgio, E.; Lacerenza, D.; Ferrero, M.; Lo Buono, N.; Ragusa, N.; Mancini, C.; Gaussen, M.; Calcia, A.; et al. ELOVL5 mutations cause spinocerebellar ataxia 38. Am. J. Hum. Genet. 2014, 95, 209–217. [Google Scholar] [CrossRef] [PubMed] [Green Version]
- Blasco, H.; Veyrat-Durebex, C.; Bocca, C.; Patin, F.; Vourc’h, P.; Kouassi Nzoughet, J.; Lenaers, G.; Andres, C.R.; Simard, G.; Corcia, P.; et al. Lipidomics Reveals Cerebrospinal-Fluid Signatures of ALS. Sci. Rep. 2017, 7, 17652. [Google Scholar] [CrossRef] [PubMed]
- Blasco, H.; Patin, F.; Descat, A.; Garcon, G.; Corcia, P.; Gele, P.; Lenglet, T.; Bede, P.; Meininger, V.; Devos, D.; et al. A pharmaco-metabolomics approach in a clinical trial of ALS: Identification of predictive markers of progression. PLoS ONE 2018, 13, e0198116. [Google Scholar] [CrossRef] [PubMed]
- McIntosh, T.J.; Simon, S.A.; Needham, D.; Huang, C.H. Structure and cohesive properties of sphingomyelin/cholesterol bilayers. Biochemistry 1992, 31, 2012–2020. [Google Scholar] [CrossRef]
- Saher, G.; Brugger, B.; Lappe-Siefke, C.; Mobius, W.; Tozawa, R.; Wehr, M.C.; Wieland, F.; Ishibashi, S.; Nave, K.A. High cholesterol level is essential for myelin membrane growth. Nat. Neurosci. 2005, 8, 468–475. [Google Scholar] [CrossRef]
- Canet-Pons, J.; Sen, N.E.; Arsovic, A.; Almaguer-Mederos, L.E.; Halbach, M.V.; Key, J.; Doering, C.; Kerksiek, A.; Picchiarelli, G.; Cassel, R.; et al. Atxn2-CAG100-KnockIn mouse spinal cord shows progressive TDP-43 pathology associated with cholesterol biosynthesis suppression. bioRxiv 2019. [Google Scholar] [CrossRef] [Green Version]
- Brown, F.R., 3rd; Chen, W.W.; Kirschner, D.A.; Frayer, K.L.; Powers, J.M.; Moser, A.B.; Moser, H.W. Myelin membrane from adrenoleukodystrophy brain white matter--biochemical properties. J. Neurochem. 1983, 41, 341–348. [Google Scholar] [CrossRef]
- Contreras, F.X.; Ernst, A.M.; Haberkant, P.; Bjorkholm, P.; Lindahl, E.; Gonen, B.; Tischer, C.; Elofsson, A.; von Heijne, G.; Thiele, C.; et al. Molecular recognition of a single sphingolipid species by a protein’s transmembrane domain. Nature 2012, 481, 525–529. [Google Scholar] [CrossRef] [Green Version]
- Hannun, Y.A.; Bell, R.M. Regulation of protein kinase C by sphingosine and lysosphingolipids. Clin. Chim. Acta 1989, 185, 333–345. [Google Scholar] [CrossRef]
- Shimobayashi, E.; Kapfhammer, J.P. Calcium Signaling, PKC Gamma, IP3R1 and CAR8 Link Spinocerebellar Ataxias and Purkinje Cell Dendritic Development. Curr. Neuropharmacol. 2018, 16, 151–159. [Google Scholar] [CrossRef]
- Noh, K.M.; Hwang, J.Y.; Shin, H.C.; Koh, J.Y. A novel neuroprotective mechanism of riluzole: Direct inhibition of protein kinase C. Neurobiol. Dis. 2000, 7, 375–383. [Google Scholar] [CrossRef] [PubMed] [Green Version]
- Krieger, C.; Lanius, R.A.; Pelech, S.L.; Shaw, C.A. Amyotrophic lateral sclerosis: The involvement of intracellular Ca2+ and protein kinase C. Trends Pharmacol. Sci. 1996, 17, 114–120. [Google Scholar] [CrossRef]
- Avramopoulos, D.; Wang, R.; Valle, D.; Fallin, M.D.; Bassett, S.S. A novel gene derived from a segmental duplication shows perturbed expression in Alzheimer’s disease. Neurogenetics 2007, 8, 111–120. [Google Scholar] [CrossRef] [PubMed]
- Levy, M.; Futerman, A.H. Mammalian ceramide synthases. Iubmb Life 2010, 62, 347–356. [Google Scholar] [CrossRef]
- Becker, I.; Wang-Eckhardt, L.; Yaghootfam, A.; Gieselmann, V.; Eckhardt, M. Differential expression of (dihydro)ceramide synthases in mouse brain: Oligodendrocyte-specific expression of CerS2/Lass2. Histochem. Cell Biol. 2008, 129, 233–241. [Google Scholar] [CrossRef]
- Yang, F.; Guan, Y.; Feng, X.; Rolfs, A.; Schluter, H.; Luo, J. Proteomics of the corpus callosum to identify novel factors involved in hypomyelinated Niemann-Pick Type C disease mice. Mol. Brain 2019, 12, 17. [Google Scholar] [CrossRef]
- Maphis, N.M.; Jiang, S.; Binder, J.; Wright, C.; Gopalan, B.; Lamb, B.T.; Bhaskar, K. Whole Genome Expression Analysis in a Mouse Model of Tauopathy Identifies MECP2 as a Possible Regulator of Tau Pathology. Front. Mol. Neurosci. 2017, 10, 69. [Google Scholar] [CrossRef]
- Anheuser, S.; Breiden, B.; Sandhoff, K. Ganglioside GM2 catabolism is inhibited by storage compounds of mucopolysaccharidoses and by cationic amphiphilic drugs. Mol. Genet. Metab. 2019. [Google Scholar] [CrossRef]
- Lang, P.A.; Schenck, M.; Nicolay, J.P.; Becker, J.U.; Kempe, D.S.; Lupescu, A.; Koka, S.; Eisele, K.; Klarl, B.A.; Rubben, H.; et al. Liver cell death and anemia in Wilson disease involve acid sphingomyelinase and ceramide. Nat. Med. 2007, 13, 164–170. [Google Scholar] [CrossRef]
- Fucho, R.; Martinez, L.; Baulies, A.; Torres, S.; Tarrats, N.; Fernandez, A.; Ribas, V.; Astudillo, A.M.; Balsinde, J.; Garcia-Roves, P.; et al. ASMase regulates autophagy and lysosomal membrane permeabilization and its inhibition prevents early stage non-alcoholic steatohepatitis. J. Hepatol. 2014, 61, 1126–1134. [Google Scholar] [CrossRef] [Green Version]
- Bhuvaneswaran, C.; Venkatesan, S.; Mitropoulos, K.A. Lysosomal accumulation of cholesterol and sphingomyelin: Evidence for inhibition of acid sphingomyelinase. Eur. J. Cell Biol. 1985, 37, 98–106. [Google Scholar] [PubMed]
- Anheuser, S.; Breiden, B.; Sandhoff, K. Membrane lipids and their degradation compounds control GM2 catabolism at intralysosomal luminal vesicles. J. Lipid Res. 2019, 60, 1099–1111. [Google Scholar] [CrossRef] [PubMed]
- Breiden, B.; Sandhoff, K. Emerging mechanisms of drug-induced phospholipidosis. Biol. Chem. 2019. [Google Scholar] [CrossRef] [PubMed]
- Breiden, B.; Sandhoff, K. Lysosomal Glycosphingolipid Storage Diseases. Annu. Rev. Biochem. 2019, 88, 461–485. [Google Scholar] [CrossRef] [PubMed]
- Del Castillo, U.; Gnazzo, M.M.; Sorensen Turpin, C.G.; Nguyen, K.C.Q.; Semaya, E.; Lam, Y.; de Cruz, M.A.; Bembenek, J.N.; Hall, D.H.; Riggs, B.; et al. Conserved role for Ataxin-2 in mediating endoplasmic reticulum dynamics. Traffic 2019, 20, 436–447. [Google Scholar] [CrossRef] [Green Version]
- Ralser, M.; Nonhoff, U.; Albrecht, M.; Lengauer, T.; Wanker, E.E.; Lehrach, H.; Krobitsch, S. Ataxin-2 and huntingtin interact with endophilin-A complexes to function in plastin-associated pathways. Hum. Mol. Genet. 2005, 14, 2893–2909. [Google Scholar] [CrossRef]
- Lamming, D.W.; Sabatini, D.M. A Central role for mTOR in lipid homeostasis. Cell Metab. 2013, 18, 465–469. [Google Scholar] [CrossRef] [Green Version]
- Laplante, M.; Sabatini, D.M. Regulation of mTORC1 and its impact on gene expression at a glance. J. Cell Sci. 2013, 126, 1713–1719. [Google Scholar] [CrossRef] [Green Version]
- Figlia, G.; Gerber, D.; Suter, U. Myelination and mTOR. Glia 2018, 66, 693–707. [Google Scholar] [CrossRef] [Green Version]
- Wang, W.; He, Q.; Guo, Z.; Yang, L.; Bao, L.; Bao, W.; Zheng, X.; Wang, Y.; Wang, Z. Inhibition of Mammalian Target of Rapamycin Complex 1 (mTORC1) Downregulates ELOVL1 Gene Expression and Fatty Acid Synthesis in Goat Fetal Fibroblasts. Int. J. Mol. Sci. 2015, 16, 16440–16453. [Google Scholar] [CrossRef] [Green Version]
- Wehbe, Z.; Alatibi, K.; Jellusova, J.; Spiekerkoetter, U.; Tucci, S. The fate of medium-chain fatty acids in very long-chain acylCoA dehydrogenase deficiency (VLCADD): A matter of sex? Biochim. Et Biophys. Acta. Mol. Cell Biol. Lipids 2019, 1864, 1591–1605. [Google Scholar] [CrossRef] [PubMed]
- Guo, Z.; Wang, Y.; Feng, X.; Bao, C.; He, Q.; Bao, L.; Hao, H.; Wang, Z. Rapamycin Inhibits Expression of Elongation of Very-long-chain Fatty Acids 1 and Synthesis of Docosahexaenoic Acid in Bovine Mammary Epithelial Cells. Asian-Australas. J. Anim. Sci. 2016, 29, 1646–1652. [Google Scholar] [CrossRef] [PubMed] [Green Version]
- Garay-Lugo, N.; Dominguez-Lopez, A.; Miliar Garcia, A.; Aguilar Barrera, E.; Gomez Lopez, M.; Gomez Alcala, A.; Martinez Godinez Mde, L.; Lara-Padilla, E. n-3 Fatty acids modulate the mRNA expression of the Nlrp3 inflammasome and Mtor in the liver of rats fed with high-fat or high-fat/fructose diets. Immunopharmacol. Immunotoxicol. 2016, 38, 353–363. [Google Scholar] [CrossRef] [PubMed]
- DeMille, D.; Badal, B.D.; Evans, J.B.; Mathis, A.D.; Anderson, J.F.; Grose, J.H. PAS kinase is activated by direct SNF1-dependent phosphorylation and mediates inhibition of TORC1 through the phosphorylation and activation of Pbp1. Mol. Biol. Cell 2015, 26, 569–582. [Google Scholar] [CrossRef]
- Kato, M.; Yang, Y.S.; Sutter, B.M.; Wang, Y.; McKnight, S.L.; Tu, B.P. Redox State Controls Phase Separation of the Yeast Ataxin-2 Protein via Reversible Oxidation of Its Methionine-Rich Low-Complexity Domain. Cell 2019, 177, 711–721. [Google Scholar] [CrossRef] [PubMed] [Green Version]
- Yang, Y.S.; Kato, M.; Wu, X.; Litsios, A.; Sutter, B.M.; Wang, Y.; Hsu, C.H.; Wood, N.E.; Lemoff, A.; Mirzaei, H.; et al. Yeast Ataxin-2 Forms an Intracellular Condensate Required for the Inhibition of TORC1 Signaling during Respiratory Growth. Cell 2019, 177, 697–710. [Google Scholar] [CrossRef] [Green Version]
- Lavieu, G.; Scarlatti, F.; Sala, G.; Carpentier, S.; Levade, T.; Ghidoni, R.; Botti, J.; Codogno, P. Regulation of autophagy by sphingosine kinase 1 and its role in cell survival during nutrient starvation. J. Biol. Chem. 2006, 281, 8518–8527. [Google Scholar] [CrossRef] [Green Version]
- Qin, J.; Berdyshev, E.; Poirer, C.; Schwartz, N.B.; Dawson, G. Neutral sphingomyelinase 2 deficiency increases hyaluronan synthesis by up-regulation of Hyaluronan synthase 2 through decreased ceramide production and activation of Akt. J. Biol. Chem. 2012, 287, 13620–13632. [Google Scholar] [CrossRef] [Green Version]
- Thedieck, K.; Holzwarth, B.; Prentzell, M.T.; Boehlke, C.; Klasener, K.; Ruf, S.; Sonntag, A.G.; Maerz, L.; Grellscheid, S.N.; Kremmer, E.; et al. Inhibition of mTORC1 by astrin and stress granules prevents apoptosis in cancer cells. Cell 2013, 154, 859–874. [Google Scholar] [CrossRef] [Green Version]
- Meierhofer, D.; Halbach, M.; Sen, N.E.; Gispert, S.; Auburger, G. Ataxin-2 (Atxn2)-Knock-Out Mice Show Branched Chain Amino Acids and Fatty Acids Pathway Alterations. Mol. Cell. Proteom. 2016, 15, 1728–1739. [Google Scholar] [CrossRef] [Green Version]
- Seidel, G.; Meierhofer, D.; Sen, N.E.; Guenther, A.; Krobitsch, S.; Auburger, G. Quantitative Global Proteomics of Yeast PBP1 Deletion Mutants and Their Stress Responses Identifies Glucose Metabolism, Mitochondrial, and Stress Granule Changes. J. Proteome Res. 2017, 16, 504–515. [Google Scholar] [CrossRef] [PubMed]
- Halbach, M.V.; Stehning, T.; Damrath, E.; Jendrach, M.; Sen, N.E.; Basak, A.N.; Auburger, G. Both ubiquitin ligases FBXW8 and PARK2 are sequestrated into insolubility by ATXN2 PolyQ expansions, but only FBXW8 expression is dysregulated. PLoS ONE 2015, 10, e0121089. [Google Scholar] [CrossRef] [PubMed] [Green Version]
- Sen, N.E.; Gispert, S.; Auburger, G. PINK1 and Ataxin-2 as modifiers of growth. Oncotarget 2017, 8, 32382–32383. [Google Scholar] [CrossRef] [PubMed]
- Moscatelli, E.A.; Isaacson, E. Gas liquid chromatographic analysis of sphingosine bases in sphingolipids of human normal and multiple sclerosis cerebral white matter. Lipids 1969, 4, 550–555. [Google Scholar] [CrossRef] [PubMed]
- Obinata, H.; Hla, T. Sphingosine 1-phosphate and inflammation. Int. Immunol. 2019, 31, 617–625. [Google Scholar] [CrossRef]
- Jones, Z.B.; Ren, Y. Sphingolipids in spinal cord injury. Int. J. Physiol. Pathophysiol. Pharmacol. 2016, 8, 52–69. [Google Scholar]
- Torres-Odio, S.; Key, J.; Hoepken, H.H.; Canet-Pons, J.; Valek, L.; Roller, B.; Walter, M.; Morales-Gordo, B.; Meierhofer, D.; Harter, P.N.; et al. Progression of pathology in PINK1-deficient mouse brain from splicing via ubiquitination, ER stress, and mitophagy changes to neuroinflammation. J. Neuroinflammation 2017, 14, 154. [Google Scholar] [CrossRef] [Green Version]
- Sliter, D.A.; Martinez, J.; Hao, L.; Chen, X.; Sun, N.; Fischer, T.D.; Burman, J.L.; Li, Y.; Zhang, Z.; Narendra, D.P.; et al. Parkin and PINK1 mitigate STING-induced inflammation. Nature 2018, 561, 258–262. [Google Scholar] [CrossRef]
- Young, M.M.; Kester, M.; Wang, H.G. Sphingolipids: Regulators of crosstalk between apoptosis and autophagy. J. Lipid Res. 2013, 54, 5–19. [Google Scholar] [CrossRef] [Green Version]
- Molino, S.; Tate, E.; McKillop, W.M.; Medin, J.A. Sphingolipid pathway enzymes modulate cell fate and immune responses. Immunotherapy 2017, 9, 1185–1198. [Google Scholar] [CrossRef]
- Giussani, P.; Tringali, C.; Riboni, L.; Viani, P.; Venerando, B. Sphingolipids: Key regulators of apoptosis and pivotal players in cancer drug resistance. Int. J. Mol. Sci. 2014, 15, 4356–4392. [Google Scholar] [CrossRef] [PubMed] [Green Version]
- Albeituni, S.; Stiban, J. Roles of Ceramides and Other Sphingolipids in Immune Cell Function and Inflammation. Adv. Exp. Med. Biol. 2019, 1161, 169–191. [Google Scholar] [PubMed]
- Tsai, H.C.; Han, M.H. Sphingosine-1-Phosphate (S1P) and S1P Signaling Pathway: Therapeutic Targets in Autoimmunity and Inflammation. Drugs 2016, 76, 1067–1079. [Google Scholar] [CrossRef] [PubMed]
- Kurschner, G.; Zhang, Q.; Clima, R.; Xiao, Y.; Busch, J.F.; Kilic, E.; Jung, K.; Berndt, N.; Bulik, S.; Holzhutter, H.G.; et al. Renal oncocytoma characterized by the defective complex I of the respiratory chain boosts the synthesis of the ROS scavenger glutathione. Oncotarget 2017, 8, 105882–105904. [Google Scholar] [CrossRef]
- Gielisch, I.; Meierhofer, D. Metabolome and proteome profiling of complex I deficiency induced by rotenone. J. Proteome Res. 2015, 14, 224–235. [Google Scholar] [CrossRef] [Green Version]
- Livak, K.J.; Schmittgen, T.D. Analysis of relative gene expression data using real-time quantitative PCR and the 2(-Delta Delta C(T)) Method. Methods 2001, 25, 402–408. [Google Scholar] [CrossRef]


© 2019 by the authors. Licensee MDPI, Basel, Switzerland. This article is an open access article distributed under the terms and conditions of the Creative Commons Attribution (CC BY) license (http://creativecommons.org/licenses/by/4.0/).
Share and Cite
Sen, N.-E.; Arsovic, A.; Meierhofer, D.; Brodesser, S.; Oberschmidt, C.; Canet-Pons, J.; Kaya, Z.-E.; Halbach, M.-V.; Gispert, S.; Sandhoff, K.; et al. In Human and Mouse Spino-Cerebellar Tissue, Ataxin-2 Expansion Affects Ceramide-Sphingomyelin Metabolism. Int. J. Mol. Sci. 2019, 20, 5854. https://doi.org/10.3390/ijms20235854
Sen N-E, Arsovic A, Meierhofer D, Brodesser S, Oberschmidt C, Canet-Pons J, Kaya Z-E, Halbach M-V, Gispert S, Sandhoff K, et al. In Human and Mouse Spino-Cerebellar Tissue, Ataxin-2 Expansion Affects Ceramide-Sphingomyelin Metabolism. International Journal of Molecular Sciences. 2019; 20(23):5854. https://doi.org/10.3390/ijms20235854
Chicago/Turabian StyleSen, Nesli-Ece, Aleksandar Arsovic, David Meierhofer, Susanne Brodesser, Carola Oberschmidt, Júlia Canet-Pons, Zeynep-Ece Kaya, Melanie-Vanessa Halbach, Suzana Gispert, Konrad Sandhoff, and et al. 2019. "In Human and Mouse Spino-Cerebellar Tissue, Ataxin-2 Expansion Affects Ceramide-Sphingomyelin Metabolism" International Journal of Molecular Sciences 20, no. 23: 5854. https://doi.org/10.3390/ijms20235854
APA StyleSen, N.-E., Arsovic, A., Meierhofer, D., Brodesser, S., Oberschmidt, C., Canet-Pons, J., Kaya, Z.-E., Halbach, M.-V., Gispert, S., Sandhoff, K., & Auburger, G. (2019). In Human and Mouse Spino-Cerebellar Tissue, Ataxin-2 Expansion Affects Ceramide-Sphingomyelin Metabolism. International Journal of Molecular Sciences, 20(23), 5854. https://doi.org/10.3390/ijms20235854