Article

Genome-Wide Identification and Characterization of FBA Gene Family in Polyploid Crop Brassica napus

1
Oil Crops Research Institute of the Chinese Academy of Agricultural Sciences, Key Laboratory of Biology and Genetic Improvement of Oil Crops, Ministry of Agriculture and Rural Affairs, Wuhan 430062, China
2
Henan key laboratory of Plant Stress Biology, School of Life Sciences, Henan University, Kaifeng 475004, China
*
Authors to whom correspondence should be addressed.
These authors contributed equally to this work.
Int. J. Mol. Sci. 2019, 20(22), 5749; https://doi.org/10.3390/ijms20225749
Submission received: 1 November 2019 / Revised: 14 November 2019 / Accepted: 14 November 2019 / Published: 15 November 2019
(This article belongs to the Special Issue Mapping Abiotic Stress-Tolerance Genes in Plants)

Abstract

:
Fructose-1,6-bisphosphate aldolase (FBA) is a versatile metabolic enzyme involved in multiple important processes of glycolysis, gluconeogenesis, and Calvin cycle. Despite its significance in plant biology, the identity of this gene family in oil crops is lacking. Here, we performed genome-wide identification and characterization of FBAs in an allotetraploid species, oilseed rape Brassica napus. Twenty-two BnaFBA genes were identified and divided into two groups based on integrative analyses of functional domains, phylogenetic relationships, and gene structures. Twelve and ten B. napus FBAs (BnaFBAs) were predicted to be localized in the chloroplast and cytoplasm, respectively. Notably, synteny analysis revealed that Brassica-specific triplication contributed to the expansion of the BnaFBA gene family during the evolution of B. napus. Various cis-acting regulatory elements pertinent to abiotic and biotic stresses, as well as phytohormone responses, were detected. Intriguingly, each of the BnaFBA genes exhibited distinct sequence polymorphisms. Among them, six contained signatures of selection, likely having experienced breeding selection during adaptation and domestication. Importantly, BnaFBAs showed diverse expression patterns at different developmental stages and were preferentially highly expressed in photosynthetic tissues. Our data thus provided the foundation for further elucidating the functional roles of individual BnaFBA and also potential targets for engineering to improve photosynthetic productivity in B. napus.

1. Introduction

Fructose-1,6-bisphosphate aldolase (FBA, EC4.1.2.13 or aldolase) is an essential metabolism enzyme in the glycolytic pathway [1]. FBA catalyzes the reversible aldol cleavage of fructose-1,6-bisphosphate (FBP) into dihydroxyacetone phosphate (DHAP) and glyceraldehyde-3-phosphate (G3P), two important intermediates for oil biosynthesis [2]. DHAP could be further converted to diacylglycerol (DAG) by multiple enzymatic reactions, and DAG is a key substrate of diacylglycerol acyltransferase (DGAT) for the synthesis of triacylglycerols (TAGs). Meanwhile, G3P could be converted to malonyl CoA (coenzyme A) that is then used to produce fatty acids. Thus, FBA is not only one of the key regulatory enzymes in the glycolysis pathway but also may control the flux of carbohydrates and, therefore, play an important role in the oil yield of oilseeds [3,4].
FBAs could be broadly classified into two classes, namely class-I and class-II, based on their catalytic mechanisms and prevalence among species in evolution [5,6]. Class-I FBAs are usually tetrameric enzymes, forming a Schiff base with the substrate as intermediate, and utilize a lysine residue to generate a nucleophilic enamine from DHAP and are not inhibited by EDTA or affected by potassium ions. Class-II FBAs are found as homodimers and require divalent cations as cofactors to stabilize the DHAP enolate intermediate involved in the aldol condensation reaction and are inhibited by EDTA [7]. FBAs of class-I are found in some bacteria, animals, and plants, while class-II FBAs occur in most bacteria, yeast, and fungi [8,9,10]. However, FBAs of class-II are also found in wheat and green algae, such as Euglena gracilis, Chlamydomonas mundane, and Chlamydomonas rheinhardii [11,12,13].
In higher plants, one set of FBA isoenzymes is localized in the cytosolic (cFBA), and another one in the chloroplast/plastid (cpFBA) [14,15]. Both cFBA and cpFBA are encoded by separate nuclear genes that probably evolved from duplication of a common ancestral gene [16]. To date, different members of the FBA family genes have been reported in a variety of monocots and eudicots species. For example, in Arabidopsis thaliana (A. thaliana), eight FBA family genes (AtFBA1–8) were identified, including three chloroplast/plastid members (AtFBA1–3) and five cytosolic members (AtFBA4–8) [17]. In tomato, eight FBA genes, including five cFBAs and three cpFBAs, were characterized based on the phylogenetic tree, gene structures, and conserved motifs [18,19]. In addition, two homologous genes of cpFBAs were isolated from green leaves of Nicotiana paniculata [20]. One SpFBA gene was cloned from Sesuvium portulacastrum roots [21]. In wheat, 21 genes encoding Thermus aquaticus FBA (TaFBA) isoenzymes were identified and categorized into three subgroups of class-I cpFBAs, class-I cFBAs, and class-II cpFBAs [11]. In rice, two OsFBAs were reported to localize in the chloroplasts, while the other five OsFBAs in the cytoplasm [22]. One chloroplastic FBA and one cytosolic FBA were detected in the leaves of maize seedlings [23]. Four developmentally up-regulated FBAs (CoFBA1–4) genes were identified in tea oil tree (Camellia oleifera) seeds [24]. However, there is no report on the identification of FBA family genes so far in oilseed rape Brassica napus.
Recent studies suggest that the FBA genes are playing important roles in diverse significant physiological and biochemical processes in plants. The cpFBA is an essential enzyme in the Calvin cycle, in which its activity generates metabolites for starch biosynthesis [25]. For instance, the loss of the AtFBA6 function resulted in a lower germination rate after abscisic acid (ABA) treatment in A. thaliana [17]. The expression levels of CoFBA1 and CoFBA3 genes were highly correlated with the amount of tea oil in the seeds of tea oil tree [24]. Reduction of plastid FBA activity inhibits photosynthesis and alters carbon partitioning in potato, whereas increased FBA activity in plastids could promote CO2 fixation and enhance the growth and photosynthesis in tobacco [26,27]. Inhibition of chloroplastic FBA affects the development of fruit size in tomato [28]. Gibberellin (GA) treatment could increase the levels of cytoplasmic FBA in all regions of the roots, resulting in the stimulation of the root growth mediating the energy production in rice [29]. Thus, FBA family genes appear to be also associated with the response to phytohormones. Besides, FBAs also participate in response to various environmental stimuli in plants, such as salinity, drought, anoxygenic stress, abnormal temperature, light acclimation, and Rhizoctonia solani Kuhn infection [21,30,31,32].
Brassica napus L. (B. napus), a relatively recent allotetraploid formed from hybridization between Brassica rapa (B. rapa) and Brassica oleracea (B. oleracea), is the second-largest source of vegetable oil crop and cultivated around the world [33,34]. B. napus has adapted to diverse climate zones and latitudes by forming three main ecotype groups, namely winter, semi-winter, and spring types [35,36]. Although FBA family genes have been studied in several plant species, little is known regarding this gene family in oil crops. Here, we systematically identified FBA family genes in B. napus and profiled their gene structures, chromosome locations, conserved motifs, cis-acting elements in the promoter regions, phylogenetic classifications, and sequence polymorphisms. We further analyzed their expression patterns in different developmental tissues and in response to stresses. Our results provided the foundation for further elucidating the functional roles of FBA family genes and potential targets for engineering to improve photosynthetic capacity in B. napus.

2. Results

2.1. Identification, Properties, and Genomic Distribution of BnaFBA Genes

To identify each member of the FBA gene family in B. napus, the glycolytic domain (PF00274) and fructose-bisphosphate aldolase class-II domain (PF01116) from the Pfam database (http://pfam.xfam.org/) were employed as queries to search against B. napus var. Darmor-bzh protein dataset. The peptides of putative B. napus FBAs (BnaFBAs) with the best hit of A. thaliana FBAs (AtFBAs) and TaFBAs were further used to predict functional domains by using the Pfam and SMART databases to confirm the presence of the fructose-bisphosphate aldolase domains. As indicated in Table 1, we identified 22 BnaFBA genes in B. napus. Meanwhile, we found 14 BraFBAs and fourteen BolFBAs in B. rapa var. Z1 and B. oleracea var. HDEM, respectively (Table S1).
The transcript length of BnaFBA genes varied from 951 bp to 4149 bp. All identified BnaFBA genes encoded proteins ranging from 317 (BnaFBA2e) to 1382 (BnaFBA9b) amino acids (aa), molecular weight (MW) from 34.18 (BnaFBA2e) to 148 kDa (BnaFBA9b), isoelectric point (pI) from 5.7 (BnaFBA2a) to 8.47 (BnaFBA3a), and grand average of hydropathy (GRAVY) from −0.263 (BnaFBA3a) to 0.076 (BnaFBA9b) (Table 1). Twelve BnaFBAs (BnaFBA1a/b/c, BnaFBA2a/b/c/d/e/f, BnaFBA3a/b, and BnaFBA9a) were predicted to be localized in chloroplast, with the other 10 BnaFBAs (BnaFBA5a/b, BnaFBA6, BnaFBA8a/b/c/d/e/f, and BnaFBA9a) being in the cytoplasm (Table 1). Similarly, in B. rapa and B. oleracea, seven B. Oleracea FBAs (BolFBAs) and seven B. rapa FBAs (BraFBAs) were predicted to be chloroplast-localized proteins, six BolFBAs and six BraFBAs were cytoplasm-localized ones, whereas BolFBA9 and BraFBA6a were predicted to be localized in plasma membrane and nucleus, respectively (Table S1).
Based on the functional domains contained, the 22 BnaFBAs could be divided into two classes—class-I and class-II. All the BnaFBAs of class-I harbored one glycolytic domain (PF00274) across the proteins, and BnaFBA9a and BnaFBA9b of class-II had one fructose-bisphosphate aldolase class-II domain (PF01116). Except for the glycolytic domain (PF00274), some members of class-I FBA, such as BnaFBA5b, as the longest FBA of class-I with 870 aa, also harbored PRK (phosphoribulokinase kinase) (PF00485) and UPRTase (uracil phosphoribosyltransferase) (PF14681) domains in the N terminal. Likewise, in B. oleracea, BolFBA5 contained three functional domains of PF00274, PF00485, and PF14681, and BolFBA6b had two tandem copies of glycolytic domains (PF00274). Interestingly, BraFBA6a contained both glycolytic domain (PF00274) and RNA polymerase II-binding domain (PF04818), suggesting that it might be involved in RNA processing in the nucleus (Table S1).
To attain a general view of the distribution of BnaFBA genes on the genome of B. napus, the 22 BnaFBAs were mapped on the corresponding chromosomes according to their physical positions. Of the 22 BnaFBA genes, 19 were evenly distributed on the 15 B. napus chromosomes, while the three other BnaFBAs were assigned to the random chromosomes (two on the An chromosomes and one on the Cn chromosome). The number of BnaFBAs per chromosome ranged from one to two. Among them, eleven BnaFBA genes were distributed over the seven A subgenome chromosomes of B. napus, including A01, A02, A04, A06, A07, A08, and A09, as well as Ann_random. Equally, the other 11 BnaFBAs were distributed over eight C subgenome chromosomes of B. napus, including C01, C02, C03, C04, C05, C06, C07, and C08, as well as Cnn_random. Most of the BnaFBAs were not localized in the terminal regions of the chromosomes, where the gene density was relatively high in B. napus (Figure 1).

2.2. Phylogenetic and Structure Analysis of BnaFBAs

To explore the molecular evolution of the FBA gene family in B. napus, a total of 79 FBA genes from B. napus, B. rapa, B. oleracea, A. thaliana, and wheat, were used to construct an unrooted phylogenetic tree. According to the phylogenetic relationships of these FBA genes, they could be divided into two independent classes, consistent with the classification by functional domains they contained (Figure 2A). Furthermore, the FBA genes of class-I could be further classified into four subclasses, namely class-Ia, class-Ib, class-Ic, and class-Id. Therefore, in B. napus, there were seven BnaFBA genes in the class-Ia group, two in class-Ib, nine in class-Ic, two in class-Id, and two in class-II. Consistent with its polyploid origin, except for the FBA4 gene, the genome of B. napus maintained homologs of each FBA gene derived from the diploid parents, B. rapa and B. oleracea (Figure 2A).
Based on the gene information of the genome available in the GENOSCOPE database, we performed gene structure analysis by comparing the coding sequence (CDS) of BnaFBAs, BraFBAs, and BolFBAs. In B. napus, A subgenome homologs and C subgenome homologs of FBA genes that were in the adjacent branches of the phylogenetic tree exhibited the same gene structure (Figure 2B). Within each class of FBA genes, the features of exons, such as order, length, and number, were largely conserved except for FBA6 genes (Figure 2B). Besides, the organization of the introns of BnaFBA genes was highly variable. The length of introns varied extensively in different members of the BnaFBA gene family, ranging from 30 to 4152 bp, with the number ranging from 2 to 41. Compared to the class-I BnaFBA genes, the class-II genes were much longer and had much more exons and introns (Figure 2B).
To further explore the higher-order structure of the BnaFBA proteins, the three-dimensional (3D) structural models for BnaFBA1a, BnaFBA8a, and BnaFBA9a were generated using SWISS-MODEL. Based on the experimental structure of class-I rabbit muscle aldolase, the SWISS-MODEL analysis results revealed that BnaFBA1a and BnaFBA8a of the class-I group could form tetramers structures, and interfaces A and B were observed in the BnaFBA1a and BnaFBA8a tetramers. Different from BnaFBA1a and BnaFBA8a, BnaFBA9a belonged to class-II group and form dimers based on its relatively high similarity to class-II aldolases of Thermus aquaticus (Figure 3A–C). Furthermore, the catalytic residues of D74-K147-K186-R188-E226-E228-K269-S301-R331 and D30-K103-K142-R144-E183-E185-K225-S266-R298 were observed in BnaFBA1a and BnaFBA8a, respectively. Additionally, similar to the class-II FBAs of Thermus aquaticus, BnaFBA9a contained active sites of H1181-E1232-H1277-H1309 that also serve as the divalent metal cation binding sites (Figure 3E,F). Multiple sequence alignment results indicated that class-I BnaFBAs, BraFBAs, BolFBAs, and AtFBAs had high conserved catalytic residues (Figure S1). The active sites among class-II BnaFBAs, BraFBAs, and BolFBAs were the same as FBA isozymes in the Thermus aquaticus (Figure S2).

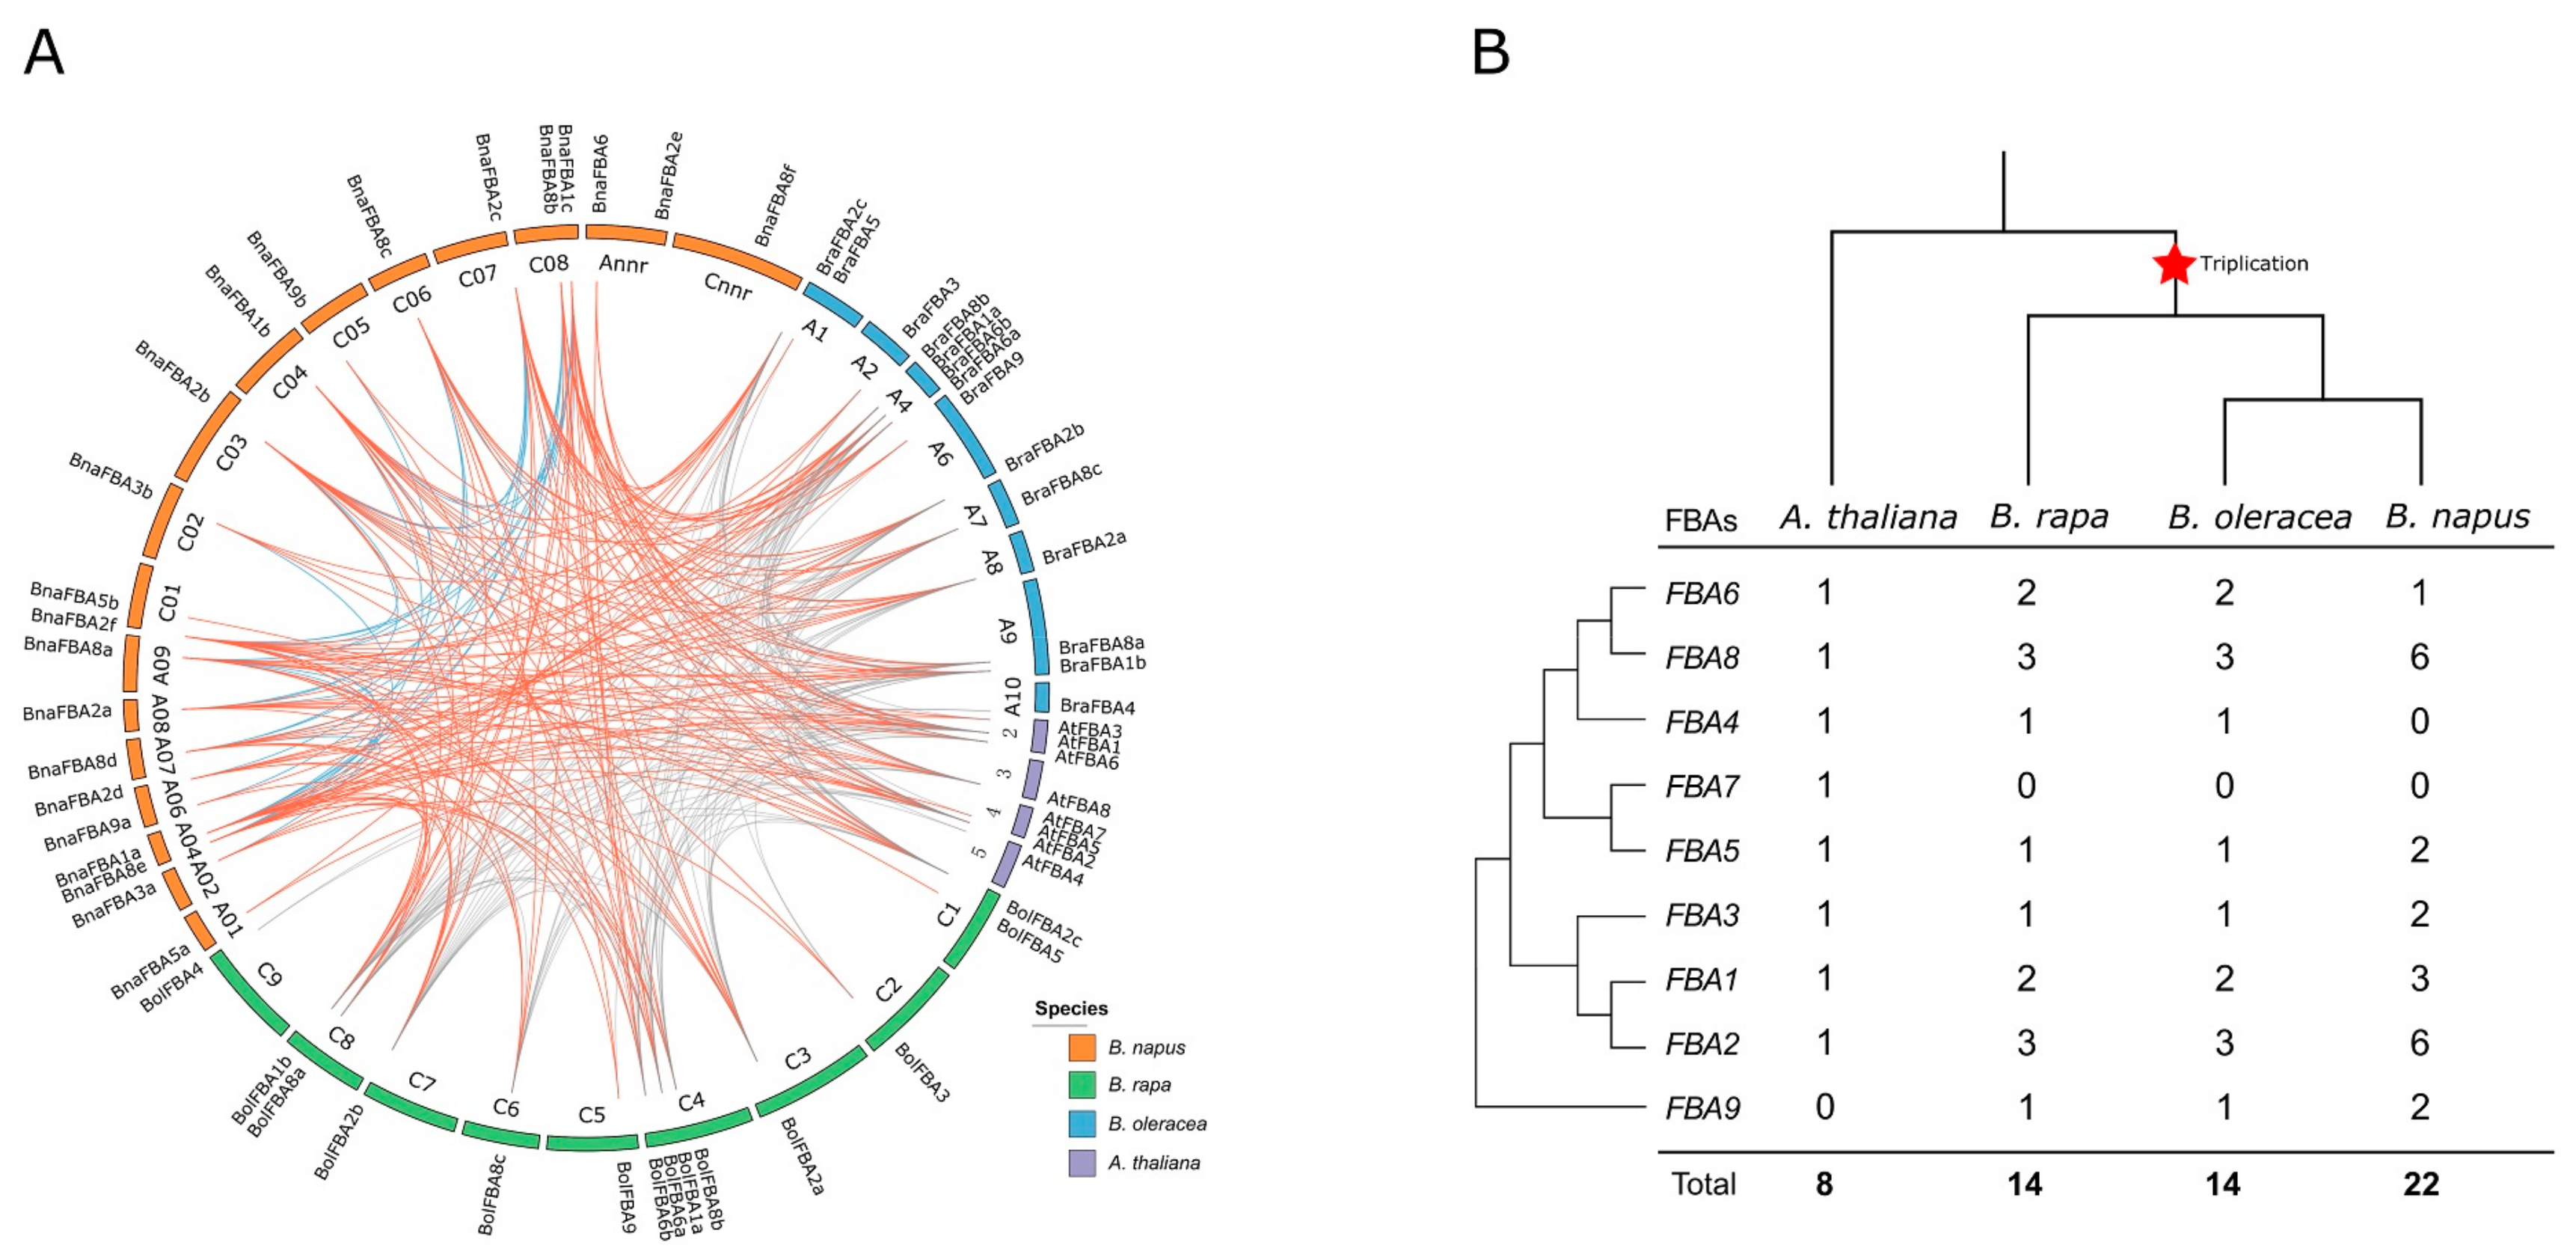
2.3. Synteny and Gene Duplication of BnaFBA Genes

A. thaliana is the most prominent model system for plant molecular biology and genetics research, whose structural genes have been identified and functionally characterized. Thus, we traced the orthologous gene pairs between A. thaliana and Brassica species to investigate the evolutionary history by syntenic gene analysis. A total of 29 orthologous gene pairs were identified between A. thaliana and B. napus, 20 between A. thaliana and B. rapa, and 19 between A. thaliana and B. oleracea. In addition, we also obtained 29, 15, and 15 paralogous gene pairs within B. napus, B. rapa, and B. oleracea, respectively (Figure 4A). The previous study revealed that crucifer (Brassicaceae) lineage experienced two whole-genome duplications (named α and β) and one triplication event (γ) shared by most dicots [37]. Moreover, Brassica species experienced an extra whole-genome triplication (WGT) event compared with A. thaliana [38]. As WGT of the Brassica ancestor, FBA genes in the A. thaliana genome might have triplicated orthologous copies in B. rapa and B. oleracea. Consequently, some FBA genes (i.e., FBA2 and FBA8) existed triple the number of those in A. thaliana, while the other genes (i.e., FBA1, FBA3, FBA5, and FBA6) had double or equal the number (Figure 4B). The FBA genes of B. napus were inherited from its diploid ancestors; thus, most of the BnaFBA genes were double the number of those in B. rapa and B. oleracea (i.e., FBA2, FBA3, FBA5, FBA8, and FBA9). However, both FBA1 and FBA6 genes lost one copy in the C subgenome of B. napus, while FBA4 lost all the copies in B. napus compared to its two ancestors (Figure 4B). Gene duplication analysis with syntenic and phylogenomic approaches using tool DupGen_finder in B. napus showed that all BnaFBA genes had corresponding duplicate genes. In B. napus, a total of 42 gene pairs were derived from whole-genome duplication (WGD), with one gene pair of BnaFBA2e-BnaFBA2f being derived from transposed duplication (Table S2).

2.4. Cis-Acting Elements in the Putative Promoter Regions of BnaFBA Genes

As important molecular switches, cis-acting elements in the promoter region could provide useful information to understand the function and regulation of the genes during plant development and responses to various stresses. The 1.5 kb genomic DNA sequences identified from upstream of the BnaFBA genes were extracted and deployed in cis-acting regulatory elements analysis with PlantCARE. Various cis-acting regulatory elements existed within the promoter regions of BnaFBA genes (Table 2 and Table S3). For example, BnaFBA genes contained multiple phytohormone responsive elements, such as ABRE (abscisic acid-responsive element), AuxRE (auxin-responsive element), ERE (ethylene-responsive element), GARE (gibberellin-responsive element), MeJARE (MeJA-responsive element), and SARE (salicylic acid-responsive element). This suggested that the expression of BnaFBAs might be induced by different phytohormones. Besides, the cis-acting regulatory elements involved in stress-responsive elements, such as ARE (anoxic-responsive element), DRE (damage-responsive element), DIRE (drought-responsive element), DSRE (drought- and stress-responsive element), HSRE (heat stress-responsive element), LTRE (low-temperature-responsive element), and WRE (wound-responsive element), were also found within the promoters of BnaFBA genes, suggesting that expression levels of BnaFBAs might be also regulated by various environmental factors like drought, heat, and low-temperature. Globally, three phytohormone-related elements (i.e., ABRE, ERE, and MeJARE) and two stress-responsive elements (ARE and HSRE) were detected with high frequency in the promoter regions of BnaFBA genes. Notably, each BnaFBA had multi-copy LREs (light-responsive elements) ranging from 8 to 26, implying that BnaFBAs might play roles in light responses.

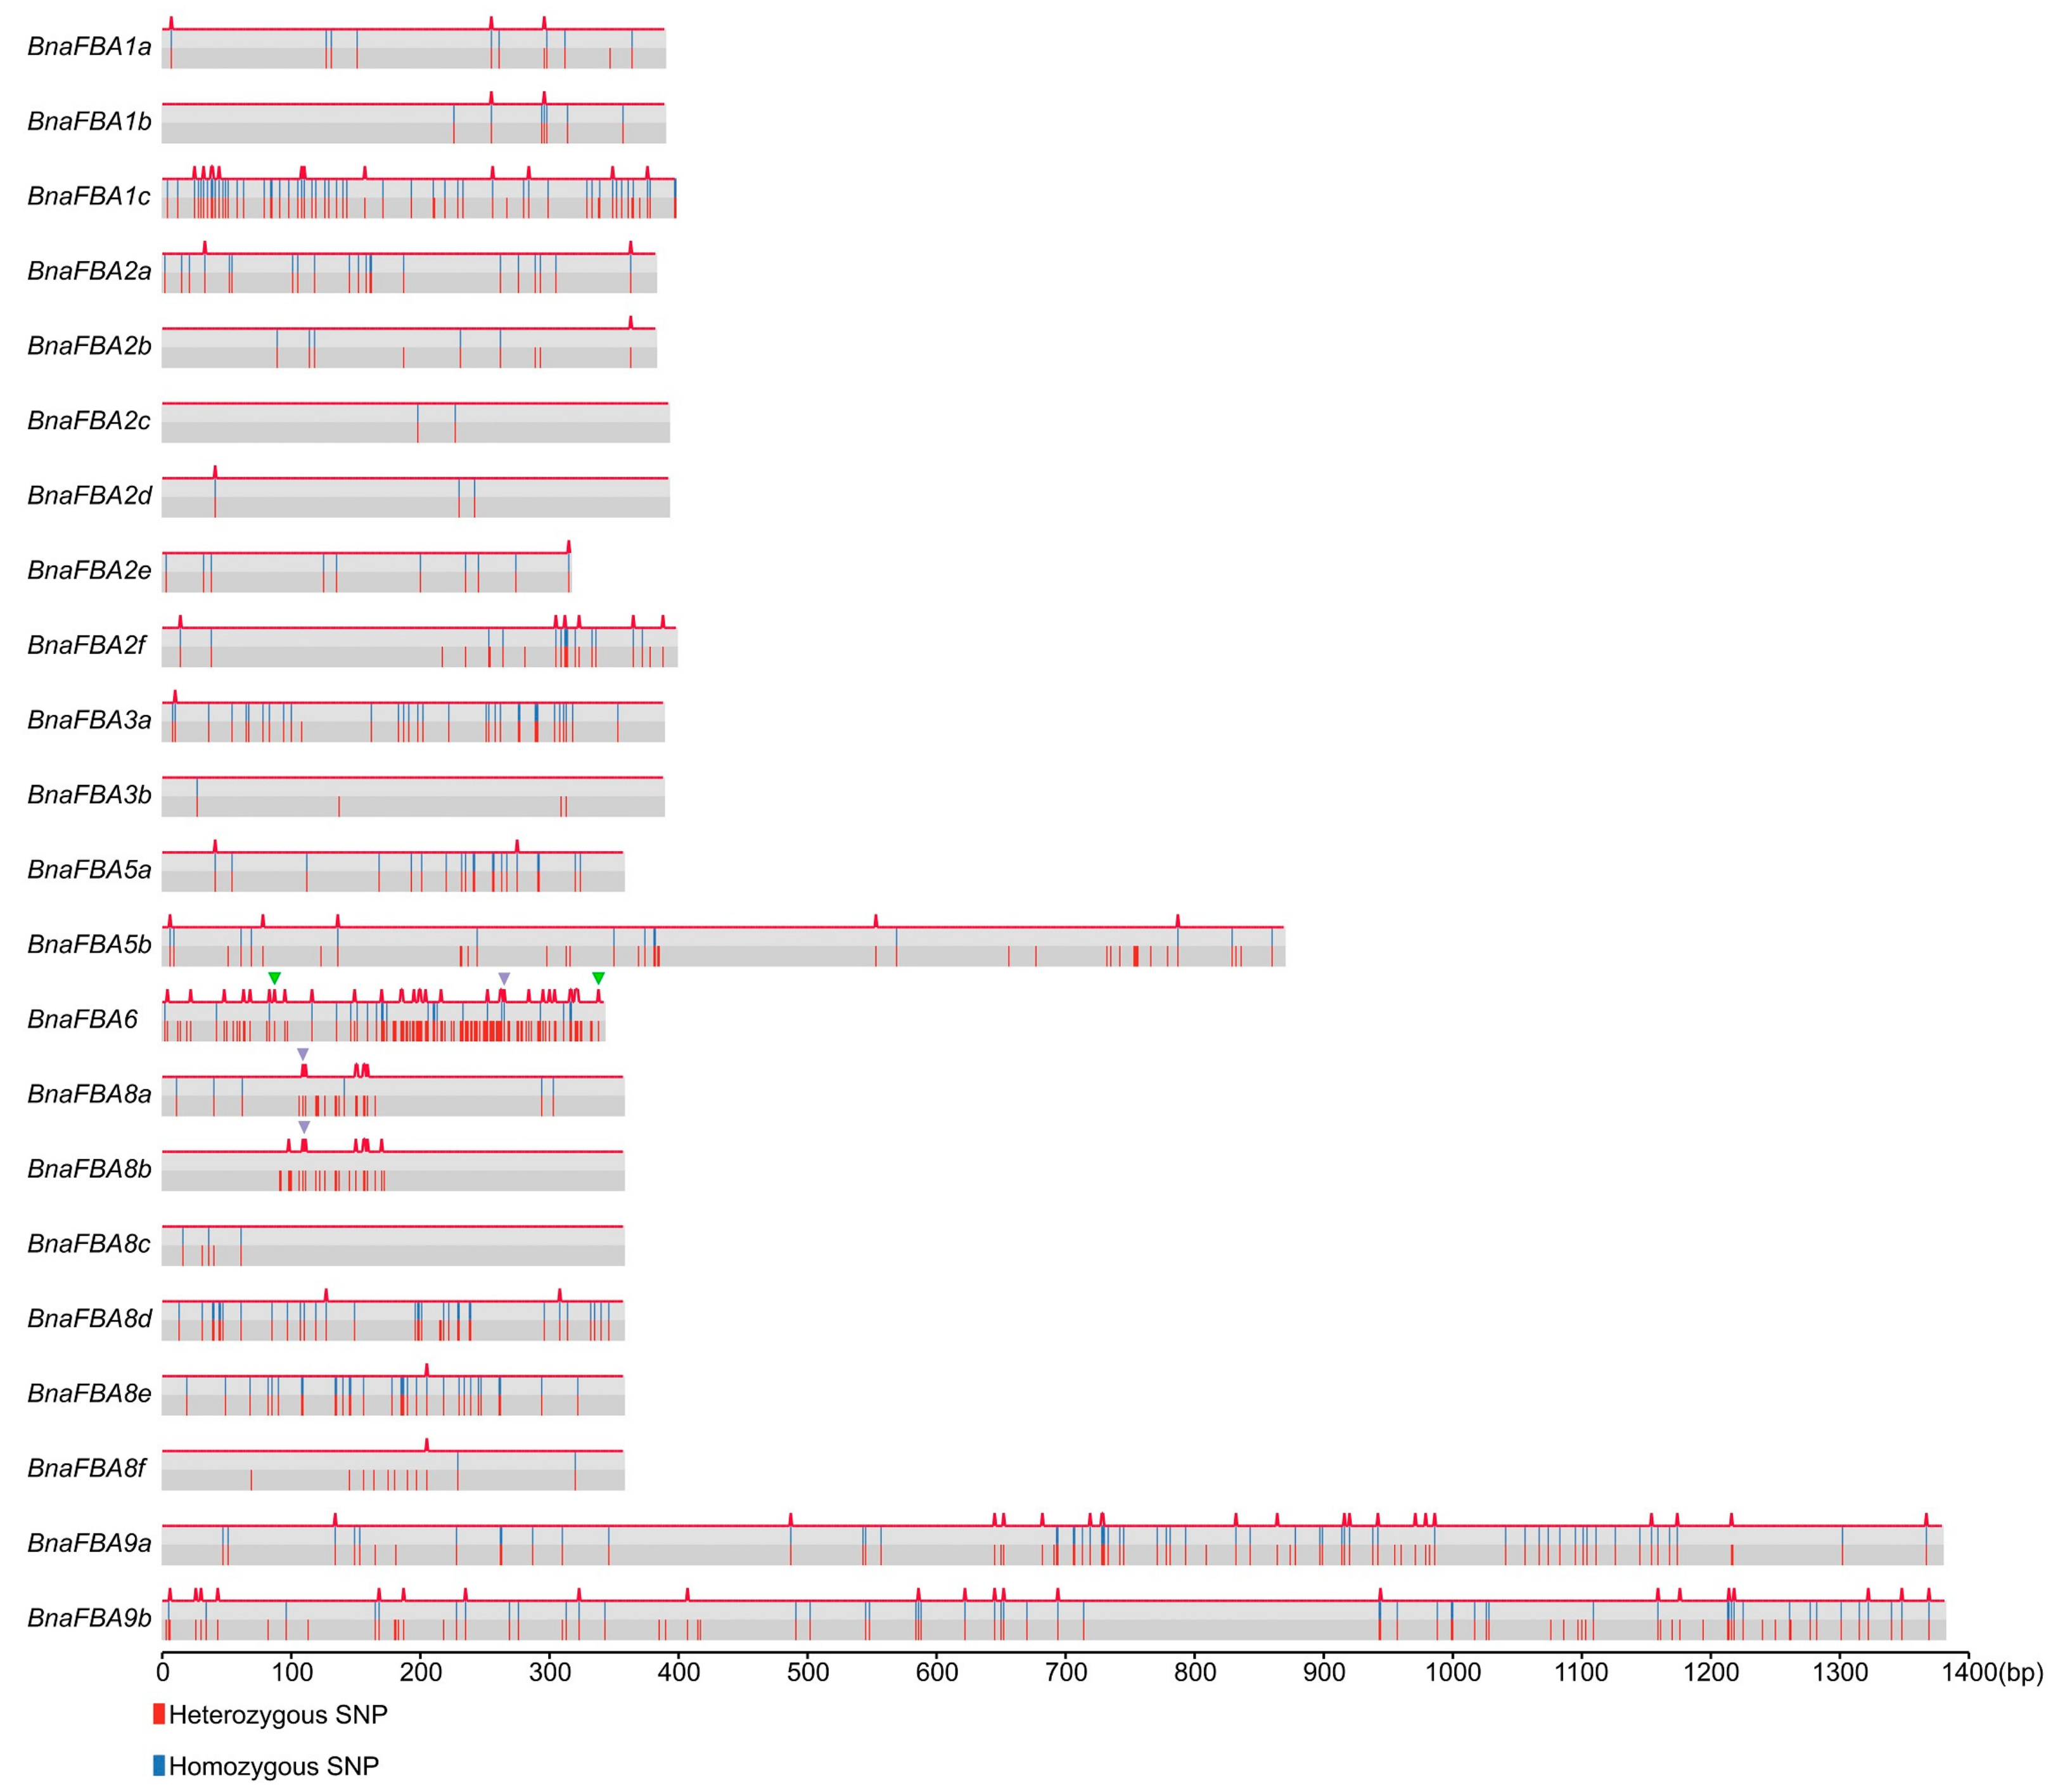
2.5. Natural Variations of BnaFBA Family Genes in B. Napus

Critical sequence polymorphism across the gene and its flanking regions may reflect the evolutionary process of species adapting to different environments. The public resequencing datasets of 991 B. napus germplasm accessions covering three main ecotype groups, namely winter, semi-winter, and spring types, were collected for variation analysis of the BnaFBA family genes [39]. The polymorphism sites of CDS in BnaFBA family genes ranged from two (BnaFBA2c) to 130 (BnaFBA6) (Table 3). The π and θw of nucleotide diversity parameters extended from 0.00057 (BnaFBA3b) to 0.04158 (BnaFBA6) and from 0.00054 (BnaFBA3b) to 0.02255 (BnaFBA6), respectively. Some members of BnaFBA gene family were conserved, such as BnaFBA3bw = 0.00054), BnaFBA2cw = 0.00092), and BnaFBA2dw = 0.00098), while others had high polymorphism, such as BnaFBA9bw = 0.00511), BnaFBA5aw = 0.00535), BnaFBA8bw = 0.0056), BnaFBA8ew = 0.00598), BnaFBA3a (θw = 0.00665), BnaFBA8aw = 0.00706), BnaFBA1cw = 0.00762), BnaFBA8dw = 0.00807), and BnaFBA6w = 0.0225). Besides, the BnaFBA6 variation ratio reached a peak of 12.60 among the 22 BnaFBA genes, whereas BnaFBA2c had the lowest variation ratio of 0.17, with only two polymorphic sites (Table 3). Generally, due to the longer length of genes, BnaFBA9a and BnaFBA9b of class-II had much more variations than FBA genes of class-I; however, the variation ratio and nucleotide diversity of the coding regions of BnaFBA9a and BnaFBA9b showed no difference with the BnaFBA genes of class-I except for BnaFBA6 (Table 3). In addition to CDS regions, a total of 1029 and 814 variations were also identified in the upstream/downstream 1.5 kb regions and intronic regions of BnaFBA genes, respectively (Table S4). Notably, BnaFBA8a, BnaFBA8b, and BnaFBA6 each harbored one stop-gain mutation that led to premature stop codons, which indicated that these genes exhibited loss-of-function (Figure 5, Table S5). Only a few of the Indels had been detected in BnaFBAs. For example, BnaFBA1c had three non-frameshift Indels, and BnaFBA3b contained only one non-frameshift Indel, with BnaFBA6 harboring two frameshift deletion/insertion variations (Figure 5). To study the population selection pressure, we conducted neutral testing using Tajima’s D. Tajima’s D values of all the BnaFBAs were positive, with significant Tajima’s D values (p < 0.01) being observed in BnaFBA1a, BnaFBA1e, BnaFBA2d, and BnaFBA2e (Table 3). Particularly, the Tajima’s D values of BnaFBA1b and BnaFBA8a reached extremely significant levels (p < 0.001 and p < 0.0001). Based on the variation of BnaFBA genes, we performed principal component analysis (PCA), in which no significant difference in the polymorphism of BnaFBA genes was seen between different ecotype groups of B. napus (Figure S3).

2.6. Expression Patterns of BnaFBA Genes

The members of the FBA gene family are playing important roles in diverse significant physiological and biochemical processes in plants [21,25]. Besides, FBAs also participate in response to various environmental stimuli [30,31,32]. To identify the function of BnaFBA genes under various conditions, the expression levels of BnaFBAs were evaluated during growth and development, as well as in response to biotic stresses and phytohormones in B. napus.
To explore the expression patterns of the BnaFBAs during growth in B. napus, we analyzed their expression levels in twelve various tissues (leaf, root, stem, cauline leaf, pistil, stamen, petal, flower bud, axillary bud, silique wall, embryo, and seed) at different developmental stages. As a result, at the trefoil stage and the flowering stage, BnaFBA genes showed opposite expression patterns between leaves and roots. For example, BnaFBA1a/b/c, BnaFBA2a/b/c/d/f, and BnaFBA5a/b displayed relatively high expression level in leaves than that in roots. On the contrary, BnaFBA3a/b and BnaFBA8a/b/c/d/e/f exhibited relatively high expression levels in roots than that in leaves. At the flowering stage, the expression levels of BnaFBA1a/b/c and BnaFBA2a/b/c/d/f were higher in pistil than that in stamen and petal tissues. At the pod stage, BnaFBA1a/b/c and BnaFBA2a/b/c/d/f were highly expressed in the silique wall, with their expression levels being increased during the development of pod. BnaFBA3a, BnaFBA3b, BnaFBA8c, and BnaFBA8d were highly and constantly expressed in all tissues, particularly showing the highest expression levels in the embryo at 25 days after pollination (DAP). In addition, the expression of BnaFBA2a/b/c/d/e/f increased during the development of seeds and reached high levels at 4 weeks after pollination (WAP), then decreased in the following mature stages of seed development (Figure 6A). BnaFBA9a and BnaFBA9b of class-II showed constitutive expression at relatively low levels in all the tissues examined. BnaFBA6 of class-I exhibited unexpressed in most tissues. Taken together, these results suggested that BnaFBA genes displayed diverse spatiotemporal expression patterns during the growth and development of different tissues in B. napus.
To identify the physiological functions of BnaFBAs in response to various environmental stresses and phytohormones, as an illustration, we investigated the expression of BnaFBA genes in leaf and root tissues under drought stress, Sclerotinia sclerotiorum infection, and strigolactones (SLs) treatments. After 24 h of Sclerotinia sclerotiorum infection, BnaFBA1a/b/c, BnaFBA2a/b/c/d/e/f, BnaFBA5a/b, and BnaFBA9b were down-regulated, while BnaFBA3a/b and BnaFBA8a/b/c/d/e/f were up-regulated compared to the control in the leaves of the two B. napus cultivars—wester and ZY821 (Figure 6B). Under drought stress, the expression levels of BnaFBA1a/c, BnaFBA2a/b/c/d/e/f, and BnaFBA5a/b decreased in the leaves. Similarly, the expression levels of BnaFBA1b, BnaFBA2b/d/e/f also decreased in roots compared to the control (Figure 6B). We further examined the expression of BnaFBAs under exogenous SLs treatments in B. napus. Notably, the members of the BnaFBA2 group showed diverse expression patterns after SLs treatments in B. napus. At 12 h after SLs treatments, the expression levels of BnaFBA2a/b/c/f were significantly down-regulated, while the expression of BnaFBA2d was slightly decreased relative to the control. At 1 day after SLs treatment, BnaFBA2a/b/c/d expression levels were significantly up-regulated compared to the control, whereas BnaFBA2e/f showed no difference. At 4 days after SLs treatment, all members of the BnaFBA2 group exhibited up-regulated expression compared to the control. Then, at 7 days after SLs treatments, the expression levels of BnaFBA2a/b/c/d turned to be down-regulated, while BnaFBA2e/f expression levels were still up-regulated compared to the control (Figure 6B).

2.7. qRT-PCR Analysis of Selected BnaFBA Genes under Abiotic Stresses

To further validate the functional roles of BnaFBAs under abiotic stresses, four BnaFBA genes from different clusters were selected for the examination of their expression levels under three stress conditions using quantitative real-time PCR (qRT-PCR) in B. napus. These genes included BnaFBA2a, BnaFBA5b, and BnaFBA8a of class-I, and BnaFBA9a of class-II. The qRT-PCR analysis was carried out using rapeseed plants exposed to salt, heat, and drought stresses. At 3 days after NaCl treatment, the expression level of BnaFBA8a was significantly up-regulated by approximately 11-fold compared with the control, while BnaFBA2a, BnaFBA5b, and BnaFBA9a were significantly down-regulated, particularly, the expression levels of BnaFBA5b and BnaFBA9a were largely reduced (Figure 7). In addition, at three days after heat and drought stress treatments, the expression level of BnaFBA5b was significantly reduced nearly by half, whereas the expression of BnaFBA8a was slightly increased compared to the control (Figure 7).

2.8. Co-Regulatory Networks of BnaFBA Genes

Based on the publically available RNA-seq datasets collected from different tissues, biotic and abiotic stresses, and phytohormone treatments in B. napus, we calculated the Pearson correlation coefficients (PCCs) of the expression levels of BnaFBA genes and constructed co-regulatory networks. Positive correlations were observed between members of class-Ia and class-Ib, such as BnaFBA3a/b, BnaFBA8a/b/c/d/e/f, and BnaFBA6. Likewise, the BnaFBA genes of class-Ic and class-Id also showed positive correlations between each other. Particularly, members of class-Id, including BnaFBA1a/b/c and BnaFBA2a/b/c/d, exhibited strong positive correlations. BnaFBA2b and BnaFBA2f showed significant negative correlation with BnaFBA3a/b and BnaFBA8a/b/e/f. However, they displayed a significant positive correlation with other BnaFBA genes of class-Ic and class-Id (Figure 8A). All the significant PCCs (p-value ≤ 0.05 and |PCC| > 0.5) of BnaFBAs were extracted and used to construct co-regulatory networks delineated by Cytoscape (version 3.1, Seattle, WA, USA) (Figure 8B). The co-regulatory networks of BnaFBAs were constituted with 22 nodes and 83 edges. There were four BnaFBA gene pairs showing negative correlations (p-value ≤ 0.05 and PCC < −0.5), including BnaFBA2f and BnaFBA8a, BnaFBA2b and BnaFBA8a, BnaFBA2f and BnaFBA8b, and BnaFBA2d and BnaFBA8a. Besides, 79 BnaFBA gene pairs showed positive correlations, of which 38 pairs exhibited strong positive correlations (p-value ≤ 0.05 and PCC > 0.8). Notably, three gene clusters of BnaFBAs were observed, including cluster 1 consisting of BnaFBA3a/b, BnaFBA6, and BnaFBA8a/b/c/d/e/f, cluster 2 consisting of BnaFBA1a/b/c, BnaFBA2a/b/c/d/e/f, and BnaFBA5a/b, and cluster 3 consisting of BnaFBA9a/b. Members within each cluster showed strong positive correlations between the expression levels, whereas only a few significant negative correlations existed between cluster 1 and cluster 2. Moreover, cluster 3 was independent among the three clusters (Figure 8B).

3. Discussion

The Calvin cycle is the initial pathway of photosynthetic carbon fixation, which plays a requisite role in the growth and development of plants [40]. Extensive efforts for seeking a breakthrough in the regulation of this cycle have been made to substantially enhance photosynthetic CO2 capacity and plant productivity. The carboxylation capacity of ribulose bisphosphate carboxylase oxygenase (Rubisco) and the regenerative capacity of ribulose diphosphate (RuBP) are uncovered to be essential for maintaining high photosynthetic CO2 fixation capacity. Previous studies revealed that three non-regulated enzymes, including fructose−1,6-bisphosphate aldolase (FBA or aldolase), sedoheptulose 1,7-bisphosphatase (SBPase), and transketolase (TK), had significantly higher control coefficient on photosynthesis than the other Calvin cycle enzymes, which indicated that they could limit photosynthetic rate and exert significant control over photosynthetic carbon flux other than Rubisco [41]. Particularly, FBA could catalyze the reversible conversion of DHAP and FBP and also catalyze DHAP and erythrose 4-phosphate (E4P) to sedoheptulose 1,7-bisphosphate (SBP). Thus, FBA is not only one of the key regulatory enzymes in the glycolysis pathway but also may lie in a vital strategic position to determine the carbon partitioning in the Calvin cycle, which made FBA probably an important candidate target of engineering to boost photosynthetic carbon CO2 fixation capacity [42].
B. napus is the second-largest source of vegetable oil crops and is cultivated around the world [33,34]. B. napus seeds contain oil, carbohydrates, and proteins as major storage reserves. In most seeds, glycolysis in plastids supplies carbon for fatty acid (FA) synthesis [43]. FBA, as a key enzyme in the glycolytic metabolism, provides precursors for amino acid and fatty acid synthesis [26]. To our best knowledge, there is not any report in the literature describing FBA family genes and their function in B. napus so far. In this study, we performed a comprehensive identification and characterization of the FBA gene family in B. napus. Compared to the number of FBA genes identified in other plant species, such as eight in A. thaliana [17], seven in rice [22], eight in tomato [19], and 21 in wheat [11], B. napus had more FBA genes, including 22 BnaFBA genes distributed in fifteen B. napus chromosomes and two random chromosomes. The BnaFBAs can be classified into two classes based on the functional domains contained, class-I and class-II. Enzyme kinetics analysis of aldolase 1 (class-I FBAs) and aldolase 2 (class-II FBAs) in Escherichia coli revealed that aldolase 1 and 2 hydrolyze fructose 1,6-bisphosphate by the aldol cleavage reaction [12]. Class-I BnaFBA proteins could form tetramer structures with high conserved catalytic residues of D-K-K-R-E-E-K-S-R that were homologous to those of rabbit FBA isozymes [44]. Class-II BnaFBA could form dimers with the active sites of H-E-H-H that corresponded to those of FBA isozymes in the Thermus aquaticus [45,46]. Eleven BnaFBAs of class-I and BnaFBA9a of class-II were predicted to be localized in chloroplast, while nine class-I BnaFBAs and BnaFBA9b of class-II were in the cytoplasm. This is consistent with the subcellular localization of their homologs in A. thaliana [17] and wheat [11]. Although AT1G18270 in Arabidopsis is the homolog of BnaFBA9a and BnaFBA9b, and it is annotated as ketose-bisphosphate aldolase class-II family protein; however, it contains fructose-bisphosphate aldolase class-II (pfam01116) domain and zinc-binding site and is further assigned as fructose-bisphosphate aldolase (NCBI Reference Sequence: NP_001117303.1). More accurately, AT1G18270 is fructose-bisphosphate aldolase class-II family protein. This inaccuracy might result from the homologous protein annotation in bacteria, such as Variovorax paradoxus B4. Now, the ketose-bisphosphate aldolase, class-II protein, was further assigned as fructose-1,6-bisphosphate aldolase, class-II in Variovorax paradoxus B4 (GenBank: AGU50177.1). Therefore, BnaFBA9a and BnaFBA9b were classified as class-II FBA genes in Brassica napus.
In contrast to the model plant A. thaliana, except for the paleo-polyploidization of alpha (α)-beta (β)-gamma (γ) WGD events, the Brassica species, such as B. rapa and B. oleracea, experienced an extra whole-genome triplication (WGT) event at approximately 15.9 Mya [47,48,49]. B. napus is a relatively new species of Brassica genus with a short history of post-Neolithic speciation (~7500 years) and domestication (~700 years) and a recent allotetraploid formed from hybridization between B. rapa and B. oleracea [35]. Therefore, B. napus has experienced five genome duplication events (3  ×  2  ×  2  ×  3  ×  2) at times during the evolution process. Gene duplication that resulted from whole-genome duplication (WGD), tandem duplication (TD), proximal duplication, transposed duplication, or dispersed duplication is one of the primary driving forces to the evolution of morphological and physiological diversity in plants [50]. Our results showed that Brassica species had an extended FBA gene family, containing extra copies of FBA1, FBA2, FBA6, and FBA8. Most gene duplications of the FBA gene family resulted from WGD (Table S2). Considering the collinear correlations and subgenome, transposed duplication and triplication events in the FBA family had contributed to this expansion prior to the speciation of Brassica species. WGD is often followed by intensive gene loss to adapt to continuously changing environments. Compared to A. thaliana and its two ancestors, B. napus species lost some copies of FBA genes (i.e., FBA1, 3, 4, 5, and 6). The remaining duplicated or triplicated FBA genes identified might be conducive to the adaptation of B. napus to various adverse environments during speciation and domestication.
Genome resequencing provides an effective way to identify a large number of variations, which lay a foundation for further identification and functional validation of candidate genes contributed to important traits in crop plants, such as rice, tomato, and soybean [51,52,53]. Critical sequence polymorphisms across the gene and its flanking regions may reflect the evolutionary trends and breeding selection effects on the genes. Based on the resequencing of a worldwide collection of 991 B. napus germplasm accessions that released recently, we explored the pattern of genetic polymorphisms of the BnaFBA family genes. The results showed that the 22 BnaFBAs diversified in sequence polymorphism, with the polymorphism sites ranging from two to 130 (Table 3). The BnaFBA genes showed different levels of polymorphism. For example, BnaFBA6, BnaFBA1c, and BnaFBA8d with the highest levels of genetic variation polymorphism might have experienced weak selection pressure during the evolution process, whereas BnaFBA2c, BnaFBA2d, and BnaFBA3b were highly conserved after strong selection. Particularly, BnaFBA6 harbored the highest levels of genetic variation, including two missense polymorphism sites with a frequency of 12.12% and 5.72%, respectively (Table S5). Moreover, a one-stop gained site with a frequency of 1.02% was also found in the CDS regions of the BnaFBA6 gene. These results suggested that the BnaFBA6 gene might be under the pseudogenization process. Furthermore, BnaFBA genes might have experienced balancing selection or population shrinkage. For example, six FBA family genes, including BnaFBA8b, BnaFBA1b, BnaFBA1c, BnaFBA2e, BnaFBA1a, and BnaFBA2d, harbored some selected signals and probably underwent breeding selection in the process of natural selection and domestication in B. napus.
Fructose-1,6-bisphosphate aldolase (FBA) is a non-regulated enzyme in the Calvin cycle, whose activity is not regulated by effectors or posttranslational modification but by expressional regulation or protein degradation [42]. Recent studies using transgenic plants with reduced enzyme levels have revealed that FBAs play important roles in regulating carbon flux through the Calvin cycle. Elevated plastid aldolase activity accelerated RuBP regeneration and resulted in increased photosynthetic capacity, growth rate, and biomass yield in tobacco and cyanobacterium [27,54]. Increased activity of FBA in Anabaena sp. strain PCC 7120 stimulated photosynthetic yield [55]. Generally, the expression levels of BnaFBA family genes were higher in the overground tissues than that in the underground. In B. napus, some members of the FBA family, such as BnaFBA5a, BnaFBA5b, BnaFBA2b, BnaFBA2c, and BnaFBA2d, showed higher expression levels in mature leaves and the top of stems than that in young leaves and the base of stems. Notably, BnaFBA genes were preferentially highly expressed in the photosynthetic tissues and stages, particularly leaves and silique wall in B. napus. For example, during the development of silique, BnaFBA5a and BnaFBA5b exhibited the highest expression levels at 10 days after DAP, while BnaFBA1a, BnaFBA2a, and BnaFBA2b had highest expression levels at 15 days after DAP in the silique wall. Besides, BnaFBA1a, BnaFBA2a, BnaFBA2b, BnaFBA2c, BnaFBA2d, BnaFBA2e, and BnaFBA2f showed the highest expression levels at four weeks after DAP in the seed tissues when seed fill begins with rapid embryo growth, oil biosynthesis, and protein accumulation [56]. In addition, BnaFBA3a, BnaFBA3b, BnaFBA8c, and BnaFBA8d also showed the highest expression levels at 25 days in the embryo tissues. Thus, the members of BnaFBAs that have a strong correlation with photosynthetic events are potential targets for engineering to improve photosynthetic capacity in the future, which would be further investigated in our next study.
Previous studies revealed FBA family genes also involved in plant defense and response to various biotic and abiotic stresses, such as cold and heat stress [17], salt stress [21], drought stress [21], water-deficit stress [30], stress with Rhizoctonia solani Kuhn [31], and high light acclimation stress [32]. Here, we found that the members of the BnaFBA family showed diverse expression patterns in response to Sclerotinia sclerotiorum infection and drought stress in B. napus. For example, BnaFBA1a/b/c, BnaFBA2a/b/c/d/e/f, BnaFBA5a/b, and BnaFBA9b were down-regulated, while BnaFBA3a/b and BnaFBA8a/b/c/d/e/f were up-regulated compared to the control in the leaves at 24 h after Sclerotinia sclerotiorum infection. Under drought stress, the expression levels of 10 BnaFBA genes (BnaFBA1a/c, BnaFBA2a/b/c/d/e/f, and BnaFBA5a/b) decreased in the leaves and five BnaFBA genes (BnaFBA1b, BnaFBA2b/d/e/f) lowered in roots. Besides, we applied salt, heat, and drought stresses on B. napus seedlings to explore the expression changes of BnaFBAs. The expression of the BnaFBAs selected was induced by the three stresses. The expression levels of BnaFBA2a, BnaFBA5b, and BnaFBA9a were down-regulated, while BnaFBA8a was up-regulated compared to the control after treatments. In addition, FBA family genes were reported to play roles in response to phytohormones, such as ABA [17] and GA [29]. Various cis-acting regulatory elements related to phytohormone responsive elements were observed in the promoter regions of BnaFBA genes in B. napus, including ABRE, AuxRE, ERE, GARE, MeJARE, and SARE, indicating that the expression levels of BnaFBA family genes might be affected by ABA, IAA (indolylacetic acid), ethylene, GA, MeJA, and SA. Furthermore, our results showed that BnaFBAs, such as BnaFBA2a/b/c/d/e/f, could be also induced by strigolactones (SLs), a new class of plant hormones playing functional roles in the development of root.
In wheat, some FBA genes showed close correlations in expression patterns and could be classified into different clusters, such as TaFBA1/2/3, TaFBA14/15/17, and TaFBA19/20/21 [11]. Similarly, based on the co-regulatory networks of BnaFBAs, the 22 BnaFBA family genes could be divided into three gene clusters. Strong positive correlations between the expression levels were observed among the members within each gene cluster of BnaFBAs. Meanwhile, only a few significant negative correlations appeared between minority members of cluster 1 and cluster 2. Cluster 3, consisting of BnaFBA9a/b of class-II, was independent among the three clusters. The results suggested that the BnaFBA genes might have functional redundancy within gene clusters and functional diversification among gene clusters in B. napus.
In summary, we performed a genome-wide identification of FBA family genes in B. napus, as well as B. rapa and B. oleracea, and further investigated their gene structures and phylogenetic relationships. The cis-acting regulatory elements in the promoter regions, natural variations, and expression patterns of BnaFBAs in different tissues or under treatments were analyzed. Our findings provided useful information regarding FBA family genes in B. napus. Remarkably, we found that some members of the FBA family that underwent breeding selection and were highly expressed in leaves and silique wall probably had positive roles in the promotion of photosynthetic capacity in B. napus. These BnaFBA genes might be utilized in the development and selection of high-yield B. napus cultivars.

4. Materials and Methods

4.1. Identification and Property Analysis of BnaFBA Genes

The genome sequence, annotation, and protein datasets of B. napus var. Darmor-bzh, B. rapa var. Z1, and B. oleracea var. HDEM were obtained from the GENOSCOPE database (http://www.genoscope.cns.fr/brassicanapus/ and http://www.genoscope.cns.fr/externe/plants/). The glycolytic domain (PF00274) and fructose-bisphosphate aldolase class-II domain (PF01116) from the Pfam database (http://pfam.xfam.org/) were applied as queries to search against local B. napus protein sequence dataset using HMMER (version 3.2.1, HHMI, Chevy Chase MD, USA) with E-value setting at 1e-5 [57]. Then, for further confirmation of BnaFBA proteins, the sequences of predicted BnaFBA proteins were searched against all the annotated proteins of A. thaliana and wheat (Triticum aestivum L.) using BLASTP (version 2.2.26, Bethesda, MD, USA) with E-value < 1 × 10⁻⁵. The putative BnaFBAs with best hits of the A. thaliana and wheat FBA proteins remained and were further deployed to determine the fructose-bisphosphate aldolase domains by using the Pfam and SMART databases (http://smart.embl-heidelberg.de/). The molecular weight (MW), isoelectric point (pI), and grand average of hydropathy (GRAVY) of each BnaFBA were calculated using the ProtParam tool (http://web.expasy.org/protparam/).

4.2. Cis-Acting Regulatory Elements and Subcellular Localization Analysis

The 1.5 kb promoter sequence upstream from the transcription start site of each BnaFBA gene was extracted from the B. napus genome sequence and used to predict cis-acting regulatory elements by PlantCARE [58]. The subcellular localization of each BnaFBA was predicted by Plant-mPLoc (http://www.csbio.sjtu.edu.cn/bioinf/plant/) [59].

4.3. Structure and Chromosomal Localization Analysis

The gene structures of the BnaFBA genes were inferred by aligning their coding sequences to the B. napus genomic sequence. Then, a schematic map of the exon-intron structure of each BnaFBA gene was drawn by Gene Structure Display Server 2.0 (http://gsds.cbi.pku.edu.cn/) [60]. Three-dimensional (3D) protein models of the BnaFBAs were generated using SWISS-MODEL [61,62]. The physical chromosomal locations of BnaFBAs were obtained from the B. napus genome annotation information. The graphical representation of the BnaFBA genes on chromosomes was plotted using R software with RIdeogram package (https://github.com/TickingClock1992/RIdeogram) [63].

4.4. Multiple Alignments and Phylogenetic Analysis

Multiple alignments of FBA protein sequences from B. napus, B. rapa, B. oleracea, A. thaliana, and wheat were performed using MUSCLE (version 3.8, Hinxton, Cambridge, UK) with default parameters [64]. The phylogenetic tree was generated using MEGA7.1 with the neighbor-joining method, and the robustness of each node in the tree was determined using 1000 bootstrap replicates [65].

4.5. Synteny and Duplicate Gene Analysis

The genomic collinearity between all pairwise combinations of B. napus, B. rapa, B. oleracea, and A. thaliana genomes was analyzed using MCScanX (version Nov. 11, 2013, Athens, GA, USA) with the default parameters [66]. Then, the syntenic relationships of BnaFBAs, BraFBAs, BolFBAs, and AtFBAs were determined according to the genomic collinearity between pairwise genomes. The syntenic map was illustrated by CIRCOS (version 0.69-9, BCGSC, Vancouver, BC, Canada) software [67,68]. The duplicated gene pairs and the modes of gene duplication were identified among FBA genes using DupGen_finder (https://github.com/qiao-xin/DupGen_finder) in B. napus, B. rapa, B. oleracea, and A. thaliana [69].

4.6. Variations Analysis and Principal Component Analysis

The publically available genome resequencing datasets of 991 B. napus germplasm accessions were downloaded from the National Center of Biotechnology Information (NCBI) under SRP155312 [39]. The sequencing reads for each accession were mapped to B. napus var. Darmor-bzh reference genome using the MEM algorithm of Burrows–Wheeler Aligner (version 0.7.17, Hinxton, Cambridge, UK) [70]. The mapping results were sorted using SAMTOOLS (version 1.1, Hinxton, Cambridge, UK) [71]. The duplicated reads were marked with PICARD (version 2.0.1, Broad Institute, Cambridge, MA, USA) [72]. Variations, including SNPs and InDels, were called using the HaplotypeCaller module in GATK (version 4.1.3.0, https://github.com/broadinstitute/gatk/) for each accession. SNP and InDels annotation was performed using ANNOVAR (version 2018Apr16, Philadelphia, PA, USA) software based on the annotation of B. napus var. Darmor-bzh genome [73]. Principal component analysis (PCA) was performed using the R software with the ggbiplot package (https://github.com/vqv/ggbiplot).

4.7. Expression Analysis of BnaFBA Genes

The publically available RNA-seq dataset of 12 different tissues (sepal, pistil, stamen, ovule, pericarp, blossomy pistil, wilting pistil, root, flower, leaf, silique wall, and stem) collected from different stages of the growth (BioProject ID: PRJNA394926) [36], RNA-seq dataset of leaf and root tissues under drought stress (BioProject ID: PRJNA256233) [74], RNA-seq dataset of seeds across four phases of the development (BioProject ID: PRJNA311067) [56], RNA-seq dataset of stems and leaves after Sclerotinia sclerotiorum infection (BioProject ID: PRJNA321917) [75], and time-series RNA-seq dataset of roots under a synthetic analog of strigolactones (rac-GR24) treatments (BioProject ID: PRJNA484313) [76] were downloaded from the NCBI SRA database, and further used as main sources to perform gene expression profiling of BnaFBA genes in B. napus. The transcriptome reads were mapped to B. napus var. Darmor-bzh reference genome using HISAT2 (version 2.1.0, Baltimore, MD, USA) with the default settings [77]. The read counts per gene were generated by featureCounts [78]. Fragments per kilobase of exon per million fragments mapped (FPKM) was used for the quantification of gene expression. The clustered heatmaps were visualized with expression levels (log2) of BnaFBA genes by R software using the pheatmap function package (https://cran.r-project.org/web/packages/pheatmap/).

4.8. Plant Materials and Treatments

Rapeseed seeds were germinated on a filter paper saturated with distilled water in darkness at 22 °C for two days. Then, the seedling plants were transferred to a 4 L hydroponic system containing continuously aerated 1/2 Murashige and Skoog (MS) liquid solution (pH 5.8, without agar and sugar) and grown in an incubator under a photosynthetic flux of 160 μmol photons m−2 s−1 and a humidity of about 50% (16 h light at 25 °C/8 h darkness at 22 °C). The 1/2 MS liquid solution was changed once every two days. After three weeks, the seedlings were transferred to a new 1/2 MS liquid solution (pH 5.8, without agar and sugar) for different stress treatments. For salt, heat, and drought stress treatments, seedlings were exposed to 1/2 MS solution (pH 5.8, without agar and sugar) containing 250-mM NaCl, 40 °C conditions, and 20% (w/v) polyethylene glycol (PEG), respectively. Seedlings exposed to 1/2 MS solution at 22 °C were used as controls. Leaf samples were collected 3 days after each treatment. All collected samples were immediately frozen in liquid nitrogen and stored at −70 °C for further analysis.

4.9. RNA Isolation and Quantitative Real-Time Polymerase Chain Reaction (qRT-PCR) Analysis

Total RNAs were extracted from each sample using an RNA extraction kit (Takara, Dalian, China) following the manufacturer’s procedure. Two micrograms of total RNA was used to synthesize the first-strand cDNA using the Prime Script RT reagent Kit (Takara, Dalian, China) according to the manufacturer’s protocol. Real-time quantitative PCR was performed using 2 mL of cDNA in a 20 mL reaction volume using an SYBR Green PCR kit (GeneCopoeia Inc., Rockville, MD, USA) with ViiATM 7 Dx platform (ABI, Los Angeles, CA, USA). The qRT-PCR reaction condition was as follows: 95 °C for 5 min, 40 cycles at 95 °C for 30 s, 55 °C for 30 s, and 72 °C for 30 s. Gene-specific primers were designed and listed in Supplementary Materials (Table S6). The relative expression levels of these genes were analyzed by the 2△△Ct method. The BnaTMA7 gene (BnaC05g11560D), which exhibited stable expression in different/same tissues under various experimental conditions, was used as an internal control [79]. All qRT-PCR reactions were assayed in triplicates.

4.10. Pearson Correlation Analysis

On the basis of the RNA-seq results, the Pearson correlation coefficients (PCCs) and p-value of the expression levels of BnaFBA gene pairs were calculated using R software with cor and cor.test function packages, respectively. The correlation heatmap was generated by R software with the corrplot function package. The gene co-regulatory networks were constructed by Cytoscape (version 3.1, Seattle, WA, USA) based on the PCCs of BnaFBA gene pairs with a p-value ≤ 0.05 [80].

Supplementary Materials

Supplementary materials can be found at https://www.mdpi.com/1422-0067/20/22/5749/s1.

Author Contributions

J.L. (Jing Liu) and W.Z. designed the research and wrote the article. W.Z. and H.L. collected data and performed most of the data analysis. Z.H. and L.Z. performed the experiments. W.H. provided the research facility. J.L. (Jun Liu) participated in the revision of the manuscript. S.X. coordinated the study. All authors read and approved the final manuscript.

Funding

This research was supported by the National Key Basic Research Program of China (2015CB150200), the National Natural Science Foundation of China (Grant No. U1304303 and 31500237), the Ministry of Science and Technology of China (2016YFD0100500), and the Agricultural Science and Technology Innovation Project of Chinese Academy of Agricultural Sciences (CAAS-ASTIP-OCRI).

Conflicts of Interest

The authors declare no conflict of interest.

Abbreviations

ABAAbscisic acid
IAAIndolylacetic acid
MeJAMethyl Jasmonic acid
GAGibberellin
SASalicylic acid
SLsStrigolactones
EDTAEthylene diamine tetraacetic acid
CDSCoding sequence
GRAVYGrand average of hydropathy
FPKMFragments per kilobase of exon per million fragments mapped
PCCsPearson correlation coefficients
SNPSingle nucleotide polymorphism
IndelsInsertions and deletions
MWMolecular weight
pIIsoelectric point
aaAmino acid
bpBase pair
kbKilobase
MbMegabase
kDaKilodalton

References

  1. Rutter, W.J. Evolution of aldolase. Fed Proc. 1964, 23, 1248–1257. [Google Scholar] [PubMed]
  2. Berg, I.A.; Kockelkorn, D.; Ramos-Vera, W.H.; Say, R.F.; Zarzycki, J.; Hügler, M.; Alber, B.E.; Fuchs, G. Autotrophic carbon fixation in archaea. Nat. Rev. Microbiol. 2010, 8, 447. [Google Scholar] [CrossRef] [PubMed]
  3. Vigeolas, H.; Waldeck, P.; Zank, T.; Geigenberger, P. Increasing seed oil content in oil-seed rape (Brassica napus L.) by over-expression of a yeast glycerol-3-phosphate dehydrogenase under the control of a seed-specific promoter. Plant. Biotechnol. J. 2007, 5, 431–441. [Google Scholar] [CrossRef] [PubMed]
  4. Cao, H.; Shockey, J.M.; Klasson, K.T.; Chapital, D.C.; Mason, C.B.; Scheffler, B.E. Developmental regulation of diacylglycerol acyltransferase family gene expression in tung tree tissues. PloS ONE 2013, 8, e76946. [Google Scholar] [CrossRef]
  5. Nakahara, K.; Yamamoto, H.; Miyake, C.; Yokota, A. Purification and characterization of class-I and class-II fructose-1, 6-bisphosphate aldolases from the cyanobacterium Synechocystis sp. PCC 6803. Plant Cell physiol. 2003, 44, 326–333. [Google Scholar] [CrossRef]
  6. Marsh, J.J.; Lebherz, H.G. Fructose-bisphosphate aldolases: An evolutionary history. Trends Biochem. Sci. 1992, 17, 110–113. [Google Scholar] [CrossRef]
  7. Gross, W.; Lenze, D.; Nowitzki, U.; Weiske, J.; Schnarrenberger, C. Characterization, cloning, and evolutionary history of the chloroplast and cytosolic class I aldolases of the red alga Galdieria sulphuraria. Gene 1999, 230, 7–14. [Google Scholar] [CrossRef]
  8. Tolan, D.R.; Niclas, J.; Bruce, B.D.; Lebo, R.V. Evolutionary implications of the human aldolase-A,-B,-C, and-pseudogene chromosome locations. Am. J. Hum. Genet. 1987, 41, 907. [Google Scholar]
  9. Penhoet, E.; Kochman, M.; Valentine, R.; Rutter, W.J. The subunit structure of mammalian fructose diphosphate aldolase. Biochemistry 1967, 6, 2940–2949. [Google Scholar] [CrossRef]
  10. Henze, K.; Morrison, H.G.; Sogin, M.L.; Müller, M. Sequence and phylogenetic position of a class II aldolase gene in the amitochondriate protist, Giardia lamblia. Gene 1998, 222, 163–168. [Google Scholar] [CrossRef]
  11. Lv, G.; Guo, X.; Xie, L.; Xie, C.; Zhang, X.; Yang, Y.; Xiao, L.; Tang, Y.; Pan, X.; Guo, A.; et al. Molecular characterization, gene evolution, and expression analysis of the fructose-1, 6-bisphosphate aldolase (FBA) gene family in wheat (Triticum aestivum L.). Front. Plant. Sci. 2017, 8, 1030. [Google Scholar] [CrossRef] [PubMed]
  12. Stribling, D.; Perham, R.N. Purification and characterization of two fructose diphosphate aldolases from Escherichia coli (Crookes’ strain). Biochem. J. 1973, 131, 833–841. [Google Scholar] [CrossRef] [PubMed]
  13. Guerrini, A.M.; Cremona, T.; Preddie, E.C. The aldolases of Chlamydomonas reinhardii. Arch. Biochem. Biophys. 1971, 146, 249–255. [Google Scholar] [CrossRef]
  14. Lebherz, H.G.; Rutter, W.J. Distribution of fructose diphosphate aldolase variants in biological systems. Biochemistry 1969, 8, 109–121. [Google Scholar] [CrossRef] [PubMed]
  15. Bukowiecki, A.C.; Anderson, L.E. Multiple forms of aldolase and triose phosphate isomerase in diverse plant species. Plant Sci. Lett. 1974, 3, 381–386. [Google Scholar] [CrossRef]
  16. Plaxton, W.C. The organization and regulation of plant glycolysis. Annu Rev. Plant. Physiol. Plant. Mol. Biol. 1996, 47, 185–214. [Google Scholar] [CrossRef]
  17. Lu, W.; Tang, X.; Huo, Y.; Xu, R.; Qi, S.; Huang, J.; Zheng, C.; Wu, C.A. Identification and characterization of fructose 1, 6-bisphosphate aldolase genes in Arabidopsis reveal a gene family with diverse responses to abiotic stresses. Gene 2012, 503, 65–74. [Google Scholar] [CrossRef]
  18. Zhang, G.; Liu, Y.; Ni, Y.; Meng, Z.; Lu, T.; Li, T. Exogenous calcium alleviates low night temperature stress on the photosynthetic apparatus of tomato leaves. PLoS ONE 2014, 9, e97322. [Google Scholar] [CrossRef]
  19. Cai, B.; Li, Q.; Xu, Y.; Yang, L.; Bi, H.; Ai, X. Genome-wide analysis of the fructose 1, 6-bisphosphate aldolase (FBA) gene family and functional characterization of FBA7 in tomato. Plant Physiol. Biochem. 2016, 108, 251–265. [Google Scholar] [CrossRef]
  20. Yamada, S.; Komori, T.; Hashimoto, A.; Kuwata, S.; Imaseki, H.; Kubo, T. Differential expression of plastidic aldolase genes in Nicotiana plants under salt stress. Plant Sci. 2000, 154, 61–69. [Google Scholar] [CrossRef]
  21. Fan, W.; Zhang, Z.; Zhang, Y. Cloning and molecular characterization of fructose-1, 6-bisphosphate aldolase gene regulated by high-salinity and drought in Sesuvium portulacastrum. Plant Cell Rep. 2009, 28, 975–984. [Google Scholar] [CrossRef] [PubMed]
  22. Zhang, Y. Functional Analysis of a Fructose-1, 6-diphosphatase Aldolase Gene ALD Y in Rice. Master’s Degree Dissertation, Huazhong Agricultural University, Wuhan, China, June 2014. [Google Scholar]
  23. Valenti, V.; Pupillo, P.; Scagliarini, S. Compartmentation of aldolase isoforms in maize leaves. J. Exp. Bot. 1987, 38, 1228–1237. [Google Scholar] [CrossRef]
  24. Zeng, Y.; Tan, X.; Zhang, L.; Jiang, N.; Cao, H. Identification and expression of fructose-1, 6-bisphosphate aldolase genes and their relations to oil content in developing seeds of tea oil tree (Camellia oleifera). PLoS ONE 2014, 9, e107422. [Google Scholar] [CrossRef] [PubMed]
  25. Sonnewald, U.; Lerchl, J.; Zrenner, R.; Frommer, W. Manipulation of sink-source relations in transgenic plants. Plant Cell Environ. 1994, 17, 649–658. [Google Scholar] [CrossRef]
  26. Haake, V.; Zrenner, R.; Sonnewald, U.; Stitt, M. A moderate decrease of plastid aldolase activity inhibits photosynthesis, alters the levels of sugars and starch, and inhibits growth of potato plants. Plant. J. 1998, 14, 147–157. [Google Scholar] [CrossRef]
  27. Uematsu, K.; Suzuki, N.; Iwamae, T.; Inui, M.; Yukawa, H. Increased fructose 1, 6-bisphosphate aldolase in plastids enhances growth and photosynthesis of tobacco plants. J. Exp. Bot. 2012, 63, 3001–3009. [Google Scholar] [CrossRef]
  28. Obiadalla-Ali, H.; Fernie, A.R.; Lytovchenko, A.; Kossmann, J.; Lloyd, J.R. Inhibition of chloroplastic fructose 1, 6-bisphosphatase in tomato fruits leads to decreased fruit size, but only small changes in carbohydrate metabolism. Planta 2004, 219, 533–540. [Google Scholar] [CrossRef]
  29. Konishi, H.; Yamane, H.; Maeshima, M.; Komatsu, S. Characterization of fructose-bisphosphate aldolase regulated by gibberellin in roots of rice seedling. Plant. Mol. Biol. 2004, 56, 839–848. [Google Scholar] [CrossRef]
  30. Khanna, S.M.; Taxak, P.C.; Jain, P.K.; Saini, R.; Srinivasan, R. Glycolytic enzyme activities and gene expression in Cicer arietinum exposed to water-deficit stress. Appl. Biochem. Biotechnol. 2014, 173, 2241–2253. [Google Scholar] [CrossRef]
  31. Mutuku, J.M.; Nose, A. Changes in the contents of metabolites and enzyme activities in rice plants responding to Rhizoctonia solani Kuhn infection: Activation of glycolysis and connection to phenylpropanoid pathway. Plant Cell Physiol. 2012, 53, 1017–1032. [Google Scholar] [CrossRef]
  32. Oelze, M.L.; Muthuramalingam, M.; Vogel, M.O.; Dietz, K.J. The link between transcript regulation and de novo protein synthesis in the retrograde high light acclimation response of Arabidopsis thaliana. BMC Genom. 2014, 15, 320. [Google Scholar] [CrossRef] [PubMed]
  33. Rana, D.; van den Boogaart, T.; O’Neill, C.M.; Hynes, L.; Bent, E.; Macpherson, L.; Park, J.Y.; Lim, Y.P.; Bancroft, I. Conservation of the microstructure of genome segments in Brassica napus and its diploid relatives. Plant J. 2004, 40, 725–733. [Google Scholar] [CrossRef] [PubMed]
  34. Lu, C.; Napier, J.A.; Clemente, T.E.; Cahoon, E.B. New frontiers in oilseed biotechnology: Meeting the global demand for vegetable oils for food, feed, biofuel, and industrial applications. Curr. Opin. Biotechnol. 2011, 22, 252–259. [Google Scholar] [CrossRef] [PubMed]
  35. Chalhoub, B.; Denoeud, F.; Liu, S.; Parkin, I.A.; Tang, H.; Wang, X.; Chiquet, J.; Belcram, H.; Tong, C.; Samans, B.; et al. Early allopolyploid evolution in the post-Neolithic Brassica napus oilseed genome. Science 2014, 345, 950–953. [Google Scholar] [CrossRef] [PubMed] [Green Version]
  36. Sun, F.; Fan, G.; Hu, Q.; Zhou, Y.; Guan, M.; Tong, C.; Li, J.; Du, D.; Qi, C.; Jiang, L.; et al. The high-quality genome of Brassica napus cultivar ‘ZS11′ reveals the introgression history in semi-winter morphotype. Plant J. 2017, 92, 452–468. [Google Scholar] [CrossRef] [PubMed] [Green Version]
  37. Bowers, J.E.; Chapman, B.A.; Rong, J.; Paterson, A.H. Unravelling angiosperm genome evolution by phylogenetic analysis of chromosomal duplication events. Nature 2003, 422, 433. [Google Scholar] [CrossRef]
  38. Cheng, F.; Wu, J.; Wang, X. Genome triplication drove the diversification of Brassica plants. Hortic Res. 2014, 1, 14024. [Google Scholar] [CrossRef] [Green Version]
  39. Wu, D.; Liang, Z.; Yan, T.; Xu, Y.; Xuan, L.; Tang, J.; Zhou, G.; Lohwasser, U.; Hua, S.; Wang, H.; et al. Whole-Genome Resequencing of a Worldwide Collection of Rapeseed Accessions Reveals the Genetic Basis of Ecotype Divergence. Mol. Plant 2019, 12, 30–43. [Google Scholar] [CrossRef] [Green Version]
  40. Furbank, R.T.; Taylor, W.C. Regulation of photosynthesis in C3 and C4 plants: A molecular approach. Plant Cell 1995, 7, 797. [Google Scholar] [CrossRef] [Green Version]
  41. Raines, C.A. The Calvin cycle revisited. Photosynth. Res. 2003, 75, 1–10. [Google Scholar] [CrossRef]
  42. Graciet, E.; Lebreton, S.; Gontero, B. Emergence of new regulatory mechanisms in the Benson-Calvin pathway via protein-protein interactions: A glyceraldehyde-3-phosphate dehydrogenase/CP12/phosphoribulokinase complex. J. Exp. Bot. 2004, 55, 1245–1254. [Google Scholar] [CrossRef] [PubMed] [Green Version]
  43. Hay, J.; Schwender, J. Computational analysis of storage synthesis in developing Brassica napus L. (oilseed rape) embryos: Flux variability analysis in relation to 13C metabolic flux analysis. Plant J. 2011, 67, 513–525. [Google Scholar] [CrossRef] [PubMed]
  44. Blom, N.; Sygusch, J. Product binding and role of the C-terminal region in Class I D-fructose 1, 6-bisphosphate aldolase. Nat. Struct. Biol. 1997, 4, 36–39. [Google Scholar] [CrossRef] [PubMed]
  45. Sauve’, V.; Sygusch, J. Crystallization and preliminary X-ray analysis of native and selenomethionine fructose-1,6-bisphosphate aldolase from Thermus aquaticus. Acta Crystallogr. 2001, 57, 310–313. [Google Scholar]
  46. Izard, T.; Sygusch, J. Induced fit movements and metal cofactor selectivity of class II aldolases: Structure of Thermus aquaticus fructose-1,6-bisphosphate aldolase. J. Biol. Chem. 2004, 279, 11825–11833. [Google Scholar] [CrossRef] [PubMed] [Green Version]
  47. Lysak, M.A.; Koch, M.A.; Pecinka, A.; Schubert, I. Chromosome triplication found across the tribe Brassiceae. Genome Res. 2005, 15, 516–525. [Google Scholar] [CrossRef] [PubMed] [Green Version]
  48. Town, C.D.; Cheung, F.; Maiti, R.; Crabtree, J.; Haas, B.J.; Wortman, J.R.; Hine, E.E.; Althoff, R.; Arbogast, T.S.; Tallon, L.J.; et al. Comparative genomics of Brassica oleracea and Arabidopsis thaliana reveal gene loss, fragmentation, and dispersal after polyploidy. Plant Cell 2006, 18, 1348–1359. [Google Scholar] [CrossRef] [Green Version]
  49. Liu, S.; Liu, Y.; Yang, X.; Tong, C.; Edwards, D.; Parkin, I.A.; Zhao, M.; Ma, J.; Yu, J.; Huang, S.; et al. The Brassica oleracea genome reveals the asymmetrical evolution of polyploid genomes. Nat. Commun. 2014, 5, 3930. [Google Scholar] [CrossRef]
  50. Paterson, A.H.; Freeling, M.; Tang, H.; Wang, X. Insights from the comparison of plant genome sequences. Annu. Rev. Plant Biol. 2010, 61, 349–372. [Google Scholar] [CrossRef]
  51. Xu, X.; Liu, X.; Ge, S.; Jensen, J.D.; Hu, F.; Li, X.; Dong, Y.; Gutenkunst, R.N.; Fang, L.; Li, J.; et al. Resequencing 50 accessions of cultivated and wild rice yields markers for identifying agronomically important genes. Nat. Biotechnol. 2011, 30, 105. [Google Scholar] [CrossRef]
  52. Lin, T.; Zhu, G.; Zhang, J.; Xu, X.; Yu, Q.; Zheng, Z.; Zhang, Z.; Lun, Y.; Li, S.; Wang, X.; et al. Genomic analyses provide insights into the history of tomato breeding. Nat. Genet. 2014, 46, 1220. [Google Scholar] [CrossRef] [PubMed]
  53. Zhou, Z.; Jiang, Y.; Wang, Z.; Gou, Z.; Lyu, J.; Li, W.; Yu, Y.; Shu, L.; Zhao, Y.; Ma, Y.; et al. Resequencing 302 wild and cultivated accessions identifies genes related to domestication and improvement in soybean. Nat. Biotechnol. 2015, 33, 408. [Google Scholar] [CrossRef] [PubMed] [Green Version]
  54. Miyagawa, Y.; Tamoi, M.; Shigeoka, S. Overexpression of a cyanobacterial fructose-1,6-/sedoheptulose-1,7-bisphosphatase in tobacco enhances photosynthesis and growth. Nat. Biotechnol. 2001, 19, 965–969. [Google Scholar] [CrossRef] [PubMed]
  55. Ma, W.; Wei, L.; Long, Z.; Chen, L.; Wang, Q. Increased activity of only an individual non-regulated enzyme fructose-1, 6-bisphosphate aldolase in Anabaena sp. strain PCC 7120 stimulates photosynthetic yield. Acta Physiol. Plant 2008, 30, 897. [Google Scholar] [CrossRef]
  56. Wan, H.; Cui, Y.; Ding, Y.; Mei, J.; Dong, H.; Zhang, W.; Wu, S.; Liang, Y.; Zhang, C.; Li, J.; et al. Time-Series Analyses of Transcriptomes and Proteomes Reveal Molecular Networks Underlying Oil Accumulation in Canola. Front. Plant Sci. 2017, 7, 2007. [Google Scholar] [CrossRef] [Green Version]
  57. Finn, R.D.; Clements, J.; Eddy, S.R. HMMER web server: Interactive sequence similarity searching. Nucleic Acids Res. 2011, 39, W29–W37. [Google Scholar] [CrossRef] [Green Version]
  58. Rombauts, S.; Déhais, P.; Van Montagu, M.; Rouzé, P. PlantCARE, a plant cis-acting regulatory element database. Nucleic Acids Res. 1999, 27, 295–296. [Google Scholar] [CrossRef] [Green Version]
  59. Chou, K.C.; Shen, H.B. Cell-PLoc: A package of Web servers for predicting subcellular localization of proteins in various organisms. Nat. Protoc. 2008, 3, 153. [Google Scholar] [CrossRef]
  60. Kayum, M.A.; Park, J.I.; Nath, U.K.; Saha, G.; Biswas, M.K.; Kim, H.T.; Nou, I.S. Genome-wide characterization and expression profiling of PDI family gene reveals function as abiotic and biotic stress tolerance in Chinese cabbage (Brassica rapa ssp. pekinensis). BMC Genom. 2017, 18, 885. [Google Scholar] [CrossRef] [Green Version]
  61. Biasini, M.; Bienert, S.; Waterhouse, A.; Arnold, K.; Studer, G.; Schmidt, T.; Kiefer, F.; Gallo Cassarino, T.; Bertoni, M.; Bordoli, L.; et al. SWISS-MODEL: Modelling protein tertiary and quaternary structure using evolutionary information. Nucleic Acids Res. 2014, 42, W252–W258. [Google Scholar] [CrossRef]
  62. Arnold, K.; Bordoli, L.; Kopp, J.; Schwede, T. The SWISS-MODEL Workspace: A web-based environment for protein structure homology modeling. Bioinformatics 2006, 22, 195–201. [Google Scholar] [CrossRef] [Green Version]
  63. Hao, Z.; Lv, D.; Ge, Y.; Shi, J.; Weijers, D.; Yu, G.; Chen, J. RIdeogram: Drawing SVG graphics to visualize and map genome-wide data on the idiograms. PeerJ Prepr. 2019, 7, e27928v1. [Google Scholar]
  64. Edgar, R.C. MUSCLE: Multiple sequence alignment with high accuracy and high throughput. Nucleic Acids Res. 2004, 32, 1792–1797. [Google Scholar] [CrossRef] [Green Version]
  65. Tamura, K.; Peterson, D.; Peterson, N.; Stecher, G.; Nei, M.; Kumar, S. MEGA5: Molecular evolutionary genetics analysis using maximum likelihood, evolutionary distance, and maximum parsimony methods. Mol. Biol. Evol. 2011, 28, 2731–2739. [Google Scholar] [CrossRef] [Green Version]
  66. Wang, Y.; Tang, H.; DeBarry, J.D.; Tan, X.; Li, J.; Wang, X.; Lee, T.; Jin, H.; Marler, B.; Guo, H.; et al. MCScanX: A toolkit for detection and evolutionary analysis of gene synteny and collinearity. Nucleic Acids Res. 2012, 40, e49. [Google Scholar] [CrossRef] [Green Version]
  67. Tang, H.; Wang, X.; Bowers, J.E.; Ming, R.; Alam, M.; Paterson, A.H. Unraveling ancient hexaploidy through multiply-aligned angiosperm gene maps. Genome Res. 2008, 18, 1944–1954. [Google Scholar] [CrossRef] [Green Version]
  68. Krzywinski, M.; Schein, J.; Birol, I.; Connors, J.; Gascoyne, R.; Horsman, D.; Jones, S.J.; Marra, M.A. Circos: An information aesthetic for comparative genomics. Genome Res. 2009, 19, 1639–1645. [Google Scholar] [CrossRef] [Green Version]
  69. Qiao, X.; Li, Q.; Yin, H.; Qi, K.; Li, L.; Wang, R.; Zhang, S.; Paterson, A.H. Gene duplication and evolution in recurring polyploidization-diploidization cycles in plants. Genome Bio. 2019, 20, 38. [Google Scholar] [CrossRef] [Green Version]
  70. Li, H.; Durbin, R. Fast and accurate short read alignment with Burrows-Wheeler transform. Bioinformatics 2009, 25, 1754–1760. [Google Scholar] [CrossRef] [Green Version]
  71. Li, H.; Handsaker, B.; Wysoker, A.; Fennell, T.; Ruan, J.; Homer, N.; Marth, G.; Abecasis, G.; Durbin, R. Genome Project Data Processing, Subgroup. The sequence alignment/map format and SAMtools. Bioinformatics 2009, 25, 2078–2079. [Google Scholar] [CrossRef] [Green Version]
  72. Picard Toolkit. Broad Institute, GitHub Repository. Available online: http://broadinstitute.github.io/picard/ (accessed on 5 August 2019).
  73. Wang, K.; Li, M.; Hakonarson, H. ANNOVAR: Functional annotation of genetic variants from next-generation sequencing data. Nucleic Acids Res. 2010, 38, e164. [Google Scholar] [CrossRef] [PubMed]
  74. Liu, C.Q.; Zhang, X.K.; Zhang, K.; An, H.; Hu, K.N.; Wen, J.; Shen, J.S.; Ma, C.Z.; Yi, B.; Tu, J.X.; et al. Comparative Analysis of the Brassica napus Root and Leaf Transcript Profiling in Response to Drought Stress. Int. J. Mol. Sci. 2015, 16, 18752–18777. [Google Scholar] [CrossRef] [PubMed] [Green Version]
  75. Girard, I.J.; Tong, C.; Becker, M.G.; Mao, X.; Huang, J.; de Kievit, T.; Fernando, W.G.D.; Liu, S.; Belmonte, M.F. RNA sequencing of Brassica napus reveals cellular redox control of Sclerotinia infection. J. Exp. Bot. 2017, 68, 5079–5091. [Google Scholar] [CrossRef] [PubMed] [Green Version]
  76. Ma, N.; Hu, C.; Wan, L.; Hu, Q.; Xiong, J.L.; Zhang, C.L. Strigolactones Improve Plant Growth, Photosynthesis, and Alleviate Oxidative Stress under Salinity in Rapeseed (Brassica napus L.) by Regulating Gene Expression. Front. Plant Sci. 2017, 8, 1671. [Google Scholar] [CrossRef] [PubMed] [Green Version]
  77. Kim, D.; Langmead, B.; Salzberg, S.L. HISAT: A fast spliced aligner with low memory requirements. Nat. Methods 2015, 12, 357–360. [Google Scholar] [CrossRef] [PubMed] [Green Version]
  78. Liao, Y.; Smyth, G.K.; Shi, W. featureCounts: An efficient general purpose program for assigning sequence reads to genomic features. Bioinformatics 2014, 30, 923–930. [Google Scholar] [CrossRef] [Green Version]
  79. Zhu, X.Y.; Huang, C.Q.; Zhang, L.; Liu, H.F.; Yu, J.H.; Hu, Z.Y.; Hua, W. Systematic Analysis of Hsf Family Genes in the Brassica napus Genome Reveals Novel Responses to Heat, Drought and High CO2 Stresses. Front. Plant Sci. 2017, 8, 1174. [Google Scholar] [CrossRef] [Green Version]
  80. Shannon, P.; Markiel, A.; Ozier, O.; Baliga, N.S.; Wang, J.T.; Ramage, D.; Amin, N.; Schwikowski, B.; Ideker, T. Cytoscape: A software environment for integrated models of biomolecular interaction networks. Genome Res. 2003, 13, 2498–2504. [Google Scholar] [CrossRef]
Figure 1. Genomic distributions of BnaFBA genes on B. napus chromosomes. The BnaFBAs were plotted based on the location of genes, length of chromosomes, and positions of centromeres. Heatmap of each chromosome indicated the gene density by the frequency per 1 Mb.
Ijms 20 05749 g001
Figure 2. Phylogenetic relationships and gene structure of BnaFBA genes. (A) Phylogenetic relationships of BnaFBAs, BraFBAs, BolFBAs, AtFBAs, and TaFBAs. The unrooted tree was generated using MEGA7.1 software by the neighbor-joining method. The numbers next to the branch show the 1000 bootstrap replicates expressed in percentage. The phylogenetic classes of FBA genes were marked by corresponding colors that are shown in the color legend at the bottom right. (B) The schematic diagrams of the exon-intron organization of FBA genes in B. napus, B. rapa, and B. oleracea. The phylogenetic tree of the FBA genes is placed at the left, and the color squares represent phylogenetic classes. The green boxes and lines indicate CDS (coding sequence) and introns, respectively. The length of the scale is at the bottom.
Ijms 20 05749 g002
Figure 3. Predicted three-dimensional model of representative Brassica napus Fructose-1,6-bisphosphate aldolase (BnaFBA) proteins. (A) Tetrameric BnaFBA1a. (B) Tetrameric BnaFBA8a. (C) Dimeric BnaFBA9a. (D) Active site residues of BnaFBA1a. (E) Active site residues of BnaFBA8a. (F) Active site residues of BnaFBA9a. The sites of the Asp167/124 substitutions are indicated on interface B, and the filled circle represents the divalent metal cation of BnaFBA9a.
Ijms 20 05749 g003
Figure 4. Collinear correlations and copy number variation of the FBA family genes in B. napus, B. rapa, B. oleracea, and A. thaliana. (A) Collinear correlations of FBA genes in the B. napus, B. rapa, B. oleracea, and A. thaliana genomes. The B. napus, B. rapa, B. oleracea, and A. thaliana chromosomes were colored by corresponding colors that are shown in the color legend at the bottom right. The blue lines represent the collinear correlations of FBA genes within B. napus, and the orange lines are for the collinear correlations of FBA genes between B. napus and the other species, with the grey lines representing the collinear correlations of FBA genes among B. rapa, B. oleracea, and A. thaliana. The figure was created using CIRCOS software. (B) Copy number variation of the FBA family genes in B. napus, B. rapa, B. oleracea, and A. thaliana. The phylogenetic tree of FBA genes is shown on the left, with the species tree shown at the top. The Brassica-specific triplication was indicated on the branches of the trees according to the Plant Genome Duplication Database. The numbers are the copy numbers of each FBA gene in A. thaliana, B. napus, B. rapa, and B. oleracea.
Ijms 20 05749 g004
Figure 5. The variation distribution of BnaFBA genes. The heterozygous SNPs and homozygous SNPs were marked as red and blue lines, respectively. The red peak on the top of each FBA gene represents nonsynonymous variation. The green and purple triangles signify frameshift deletion/insertion and stop-gain variations, respectively. The length of the scale is placed at the bottom.
Ijms 20 05749 g005
Figure 6. Expression analysis of the 22 BnaFBA genes in B. napus. (A) Expression patterns of the BnaFBA genes in various tissues at different developmental stages. The color bar represents log2 expression levels (FPKM, fragments per kilobase of exon per million fragments mapped) of each gene. (B) Expression patterns of the BnaFBA genes under drought stress, Sclerotinia sclerotiorum infection, and strigolactones treatments in B. napus. The color scale of heatmap indicates expression values, with blue-white and red representing low and high levels of transcript abundance, respectively. The cluster tree of BnaFBA genes, based on the expression level, is shown on the left.
Ijms 20 05749 g006
Figure 7. The real-time PCR analysis of the selected four representative BnaFBA genes responded to salt, heat, and drought stresses. The dotted lines represent the equivalent levels of expression. Statistically significant differences (Student’s t-test) are indicated as followed: ** p < 0.01.
Ijms 20 05749 g007
Figure 8. Correlations and co-regulatory networks of BnaFBA genes. (A) Correlation analysis of BnaFBA genes was performed based on the Pearson correlation coefficients (PCCs) of BnaFBA gene pairs. Correlations are indicated by the size and color of circles. The left bar represents the correlation values of PCCs. The class information for BnaFBAs is indicated by the squares with different colors at the right. Black star signifies the correlation with p-value ≤ 0.05. (B) The co-regulatory network of BnaFBA genes was generated on the basis of the significant PCCs of gene pairs (p-value ≤ 0.05). The distinct correlation levels of gene pairs are marked by edge lines with different colors shown at the bottom. The co-regulatory network was illustrated by Cytoscape (version 3.1, Seattle, WA, USA).
Ijms 20 05749 g008
Table 1. Summary Information on FBA Family Genes in B. Napus.
Gene NameLocus NameGene Location 1Transcript Length (bp)Protein Length (aa)MW (kDa)pIGRAVYDomain 2 (Start-End aa) Homolog of ArabidopsisClassifi-cationSubcellular Localization
BnaFBA1aBnaA04g12130DchrA04:10353159–10354905:−117339042.26.92−0.194PF00274
(55–390)
AT2G21330
(AtFBA1)
IChloroplast
BnaFBA1bBnaC04g33570DchrC04:35146154–35147860:+117339042.166.92−0.19PF00274
(55–390)
AT2G21330
(AtFBA1)
IChloroplast
BnaFBA1cBnaC08g35820DchrC08:33457869–33459923:+119739842.816.78−0.155PF00274
(54–398)
AT2G21330
(AtFBA1)
IChloroplast
BnaFBA2aBnaA08g16820DchrA08:13562506–13564430:+115238341.35.7−0.179PF00274
(44–383)
AT4G38970
(AtFBA2)
IChloroplast
BnaFBA2bBnaC03g60280DchrC03:49437707–49439536:−115238341.335.7−0.185PF00274
(44–383)
AT4G38970
(AtFBA2)
IChloroplast
BnaFBA2cBnaC07g47470DchrC07:44670819–44672806:+118239342.586.87−0.196PF00274
(54–393)
AT4G38970
(AtFBA2)
IChloroplast
BnaFBA2dBnaA06g37230DchrA06:24314148–24316076:+118239342.647.61−0.208PF00274
(54–393)
AT4G38970
(AtFBA2)
IChloroplast
BnaFBA2eBnaAnng40850DchrAnn_random:46872917–46874555:+95131734.186.77−0.036PF00274
(54–306)
AT4G38970
(AtFBA2)
IChloroplast
BnaFBA2fBnaC01g00070DchrC01:20706–22753:−120039942.956.07−0.137PF00274
(44–399)
AT4G38970
(AtFBA2)
IChloroplast
BnaFBA3aBnaA02g27140DchrA02:20044496–20046087:+117038942.38.47−0.263PF00274
(45–389)
AT2G01140
(AtFBA3)
IChloroplast
BnaFBA3bBnaC02g33660DchrC02:36012928–36014598:−117038942.288.47−0.257PF00274
(45–389)
AT2G01140
(AtFBA3)
IChloroplast
BnaFBA5aBnaA01g15640DchrA01:8017642–8018970:+107735838.236.38−0.072PF00274
(11–358)
AT4G26530
(AtFBA5)
ICytoplasm
BnaFBA5bBnaC01g18640DchrC01:12962252–12967551:+261387095.976.82−0.107PF00485
(52–237);
PF14681
(266–458);
PF00274
(523–870)
AT4G26530
(AtFBA5)
ICytoplasm
BnaFBA6BnaAnng07310DchrAnn_random:7183202–7186036:+103234336.915.8−0.189PF00274
(11–338)
AT2G36460
(AtFBA6)
ICytoplasm
BnaFBA8aBnaA09g33290DchrA09:24581809–24583398:−107735838.456.28−0.197PF00274
(11–358)
AT3G52930
(AtFBA8)
ICytoplasm
BnaFBA8bBnaC08g24100DchrC08:26197819–26199427:-107735838.456.28−0.197PF00274
(11–358)
AT3G52930
(AtFBA8)
ICytoplasm
BnaFBA8cBnaC06g14270DchrC06:17065486–17066935:−107735838.426.22−0.177PF00274
(11–358)
AT3G52930
(AtFBA8)
ICytoplasm
BnaFBA8dBnaA07g15900DchrA07:13618484–13619930:−107735838.426.22−0.177PF00274
(11–358)
AT3G52930
(AtFBA8)
ICytoplasm
BnaFBA8eBnaA04g05120DchrA04:3768229–3769737:+107735838.496.28−0.218PF00274
(11–358)
AT3G52930
(AtFBA8)
ICytoplasm
BnaFBA8fBnaCnng50220DchrCnn_random:49773855–49775405:+107735838.496.28−0.218PF00274
(11–358)
AT3G52930
(AtFBA8)
ICytoplasm
BnaFBA9aBnaA06g12420DchrA06:6440041–6449829:−41431380147.665.820.067PF01116
(1104–1379)
AT1G18270
(ketose-bisphosphate aldolase class-II family protein)
IIChloroplast
BnaFBA9bBnaC05g14020DchrC05:8111222–8120981:−414913821485.750.076PF01116
(1106–1381)
AT1G18270
(ketose-bisphosphate aldolase class-II family protein)
IICytoplasm
1 Chromosome: start position-end position: strand, (–) means antisense strand of chromosome, (+) means positive-sense strand of chromosome. 2 Glycolytic, fructose-bisphosphate aldolase class-I (PF00274); F_bP_aldolase, fructose-bisphosphate aldolase class-II (PF01116); Uracil phosphoribosyltransferase, UPRTase (PF14681); PRK, phosphoribulokinase / uridine kinase family (PF00485); AP2, apetala 2 (PF00847).
Table 2. Cis-Acting Elements in the Promoter Region of 22 BnaFBA Genes.
GeneCis-Acting Elements 1
ABREAREAuxRECircadianDIREDREDSREEREGAREHSRELRELTREMeJARESAREWRE
BnaFBA1a1331 1 2612
BnaFBA1b117 2 1 216282
BnaFBA1c531 11 21 41
BnaFBA2a412 131 16110
BnaFBA2b4 2 132 18 12
BnaFBA2c412 1 12 14 4
BnaFBA2d433 12 14 4
BnaFBA2e46 112131 1
BnaFBA2f124 1 11924
BnaFBA3a2 2 1111101 2
BnaFBA3b 31 2 1219 2
BnaFBA5a51 12 211113 2
BnaFBA5b13 1 2110 10 1
BnaFBA61 13 12113 41
BnaFBA8a75 212 116141
BnaFBA8b12 1121110 2
BnaFBA8c29 1 4 281 1
BnaFBA8d24 11 1 591 2
BnaFBA8e4211 13 115 41
BnaFBA8f3311 111 8
BnaFBA9a1521 1 11 123 1011
BnaFBA9b33 111 1312
1 Abscisic acid-responsive element (ABRE), Anoxic-responsive element (ARE), Auxin-responsive element (AuxRE), Circadian-responsive element (Circadian), Damage-responsive element (DRE), Defense- and stress-responsive element (DSRE), Drought-responsive element (DIRE), Ethylene-responsive element (ERE), Gibberellin-responsive element (GARE), Heat stress-responsive element (HSRE), Light-responsive element (LRE), Low-temperature-responsive element (LTRE), MeJA-responsive element (MeJARE), Salicylic acid-responsive element (SARE), and Wound-responsive element (WRE).
Table 3. Summary of Polymorphic Sites of the 22 BnaFBA Genes.
GeneCDS Length (bp)Sample SizeNo. of Polymorphic Sites 1Sequence Variation Ratio (%)Nucleotide DiversityTajima’s D 4
π/bp 2θw/bp 3
BnaFBA1a1173401110.940.003760.001872.28214 *
BnaFBA1b117346970.600.002860.001552.56152 **
BnaFBA1c1197198605.010.012990.007622.14201 *
BnaFBA2a1152163232.000.006570.003941.45126
BnaFBA2b1152505100.870.002790.002110.98657
BnaFBA2c118278020.170.001130.000921.89306
BnaFBA2d118272730.250.001450.000981.9818 *
BnaFBA2e951289101.050.00440.002392.43882 *
BnaFBA2f1200552211.750.005090.002981.90478
BnaFBA3a1170249342.910.008940.006650.81257
BnaFBA3b117021050.430.000570.000540.17874
BnaFBA5a1077307211.950.007830.005351.49221
BnaFBA5b2613228421.610.00530.003491.63186
BnaFBA6103213213012.600.041580.022551.99668
BnaFBA8a1077379292.690.009590.007061.32819
BnaFBA8b1077529292.690.012510.00563.68226 ***
BnaFBA8c107772650.460.002410.001431.43186
BnaFBA8d1077251383.530.012060.008071.33435
BnaFBA8e1077234312.880.01080.005981.93228
BnaFBA8f1077429121.110.00330.002081.81155
BnaFBA9a4143100791.910.004670.003550.97966
BnaFBA9b414943862.070.006730.005111.19193
1 polymorphic includes the SNPs (single nucleotide polymorphisms) and Indels (insertions and deletions). 2 π, average nucleotide differences per site between the two sequences. 3 θw, Watterson estimator. 4 Tajima’s D, test for neutral selection (*: significant at p < 0.01; **: significant at p < 0.001; ***: significant at p < 0.0001). CDS, coding sequence.

