Communication

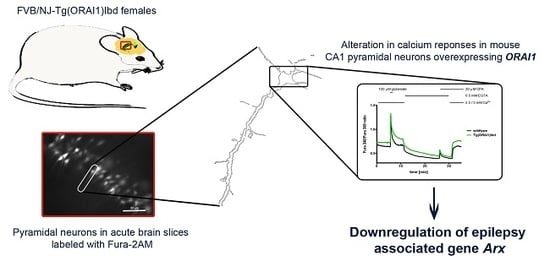
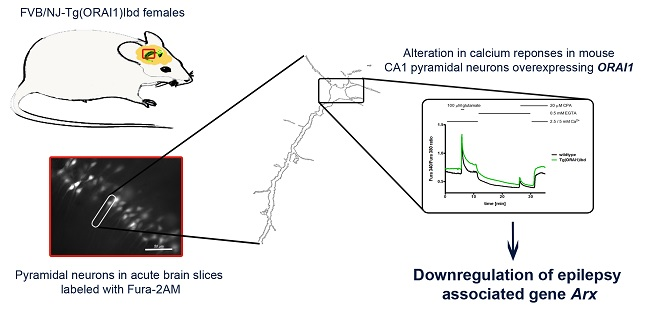
Changes in Calcium Homeostasis and Gene Expression Implicated in Epilepsy in Hippocampi of Mice Overexpressing ORAI1

1
Laboratory of Neurodegeneration, International Institute of Molecular and Cell Biology in Warsaw, Trojdena 4, 02-109 Warsaw, Poland
2
Laboratory of Molecular Neurobiology, Nencki Institute of Experimental Biology, PAS, Pasteura 3, 02-093 Warsaw, Poland
*
Author to whom correspondence should be addressed.
Ph.D. student at the Postgraduate School of Molecular Medicine, Warsaw Medical University, 61 Żwirki i Wigury St., 02-091 Warsaw, Poland.
Int. J. Mol. Sci. 2019, 20(22), 5539; https://doi.org/10.3390/ijms20225539
Submission received: 30 September 2019 / Revised: 4 November 2019 / Accepted: 4 November 2019 / Published: 6 November 2019
(This article belongs to the Special Issue Calcium Signaling in Human Health and Diseases 2.0)

Abstract

:
Previously, we showed that the overexpression of ORAI1 calcium channel in neurons of murine brain led to spontaneous occurrence of seizure-like events in aged animals of transgenic line FVB/NJ-Tg(ORAI1)Ibd (Nencki Institute of Experimental Biology). We aimed to identify the mechanism that is responsible for this phenomenon. Using a modified Ca2+-addback assay in the CA1 region of acute hippocampal slices and FURA-2 acetomethyl ester (AM) Ca2+ indicator, we found that overexpression of ORAI1 in neurons led to altered Ca2+ response. Next, by RNA sequencing (RNAseq) we identified a set of genes, whose expression was changed in our transgenic animals. These data were validated using customized real-time PCR assays and digital droplet PCR (ddPCR) ddPCR. Using real-time PCR, up-regulation of hairy and enhancer of split-5 (Hes-5) gene and down-regulation of aristaless related homeobox (Arx), doublecortin-like kinase 1 (Dclk1), and cyclin-dependent kinase-like 5 (Cdkl5, also known as serine/threonine kinase 9 (Stk9)) genes were found. Digital droplet PCR (ddPCR) analysis revealed down-regulation of Arx. In humans, ARX, DCLK1, and CDLK5 were shown to be mutated in some rare epilepsy-associated disorders. We conclude that the occurrence of seizure-like events in aged mice overexpressing ORAI1 might be due to the down-regulation of Arx, and possibly of Cdkl5 and Dclk1 genes.

Graphical Abstract

1. Introduction

Store operated calcium entry (SOCE) is a well-described process in non-excitable cells. It was initially known under the name “capacitative Ca2+ entry” [1] and has recently been identified also in neurons and called as nSOCE [2,3,4,5]. In the 1980s, several groups observed a phenomenon that decreasing intracellular [Ca2+] activates a transmembrane Ca2+ current [6,7,8]. During the next two decades of studies, the scientific community established molecular basis of SOCE (reviewed in [9]). Reduction in [Ca2+]ER results in activation of plasma membrane Ca2+ channels that mediate sustained Ca2+ influx, which is required for a variety of processes. They include maintaining Ca2+ oscillations [10], mitochondrial fatty acid oxidation [11], refilling of Ca2+ stores, and a few other [12]. The essential components of SOCE are stromal interaction molecules (STIM1 and STIM2), which function as sensors of the Ca2+ concentration inside the endoplasmic reticulum (ER) [13,14] and ORAIs (ORAI1-3), which are highly selective Ca2+ channels at the plasma membrane (PM) [15,16]. Upon store depletion, STIMs form multimers, which translocate within the endoplasmic reticulum (ER) membrane towards ER-PM junctions, where they activate highly Ca2+-selective Ca2+-release-activated Ca2+ channels (CRACs) – ORAIs [17]. CRAC channels function as hexamer complexes that are composed of potentially multiple ORAI homologues [18,19]. Heteromeric channels that are built of endogenous ORAI1 and ORAI2 homologues were found in murine T-cells [20] and in mast cells [21], whereas in the enamel cells [22], dorsal root ganglion (DRG) neurons [23] and in overexpression studies, ORAI1:ORAI3 multimers were observed [24]. In murine immune cells, deletion of Orai1 reduces, whereas deletion of Orai2 increases SOCE, which indicates that ORAI2 is a less conductive subunit of CRAC channels and enables shaping of the magnitude of SOCE and modulation of the immune response [20]. Eckstein et al. postulated that ORAI1 and ORAI2 were the main channel subunits of CRAC channels in enamel cells, noting that ORAI3 can act as an inhibitor of ORAI1 in these cells [22]. In contrast, knockdown of both Orai1 and Orai3 in DRG neurons reduced SOCE compared with Orai1 or Orai3 knockdown alone [23]. These manipulations resulted in altered neuronal excitability [23]. All of these studies have shown that homo- and heteromeric CRAC channels demonstrate different SOCE response, which indicates the importance of the stoichiometry of different ORAI homologues that form the CRAC channel. The expression profile of all three homologues of ORAI varies in different tissues, with the highest level of ORAI1 in immune cells [25] and ORAI2 in the brain [26], whereas ORAI3 is abundant in many solid organs and its enhanced gene expression is reported in cancerous cells [27]. Physiologically, the best-characterized homolog is ORAI1 [28,29]. Patients with inherited null or loss of function mutations in ORAI1 suffer from severe combined immunodeficiency-like disease that is accompanied with chronic, often lethal infections and a variety of non-immunological symptoms [30,31].
Our recently published results indicate that overexpression of ORAI1 in the murine brain leads to spontaneous occurrence of seizure-like events in aged animals [32]. In the present study, we extended the phenotyping of the established transgenic line overexpressing ORAI1 in neurons (FVB/NJ-Tg(ORAI1)Ibd; Nencki Institute of Experimental Biology) by the analysis of Ca2+ response in the hippocampal CA1 pyramidal cells and RNA sequencing (RNAseq) gene expression profiling. Differential expression of selected genes was next confirmed by real-time PCR and validated using the digital droplet PCR (ddPCR) approach. The observed changes in Ca2+ signals after glutamate treatment or after ER Ca2+ store depletion suggest a new potential site of action for ORAI1. Our observations were supported by the identification of a set of genes, whose expression was changed in FVB/NJ-Tg(ORAI1)Ibd mice. For some of these genes, such as cyclin-dependent kinase-like 5 Cdkl5, aristaless related homeobox (Arx), and doublecortin-like kinase 1 (Dclk1), mutations in their human homologoues that lead to rare epilepsy-associated disorders were reported. Together, our results provided novel insight into the Ca2+ dependent actions evoked by CRAC channels that might underlie the occurrence of seizure-like episodes in FVB/NJ-Tg(ORAI1)Ibd mice.

2. Results

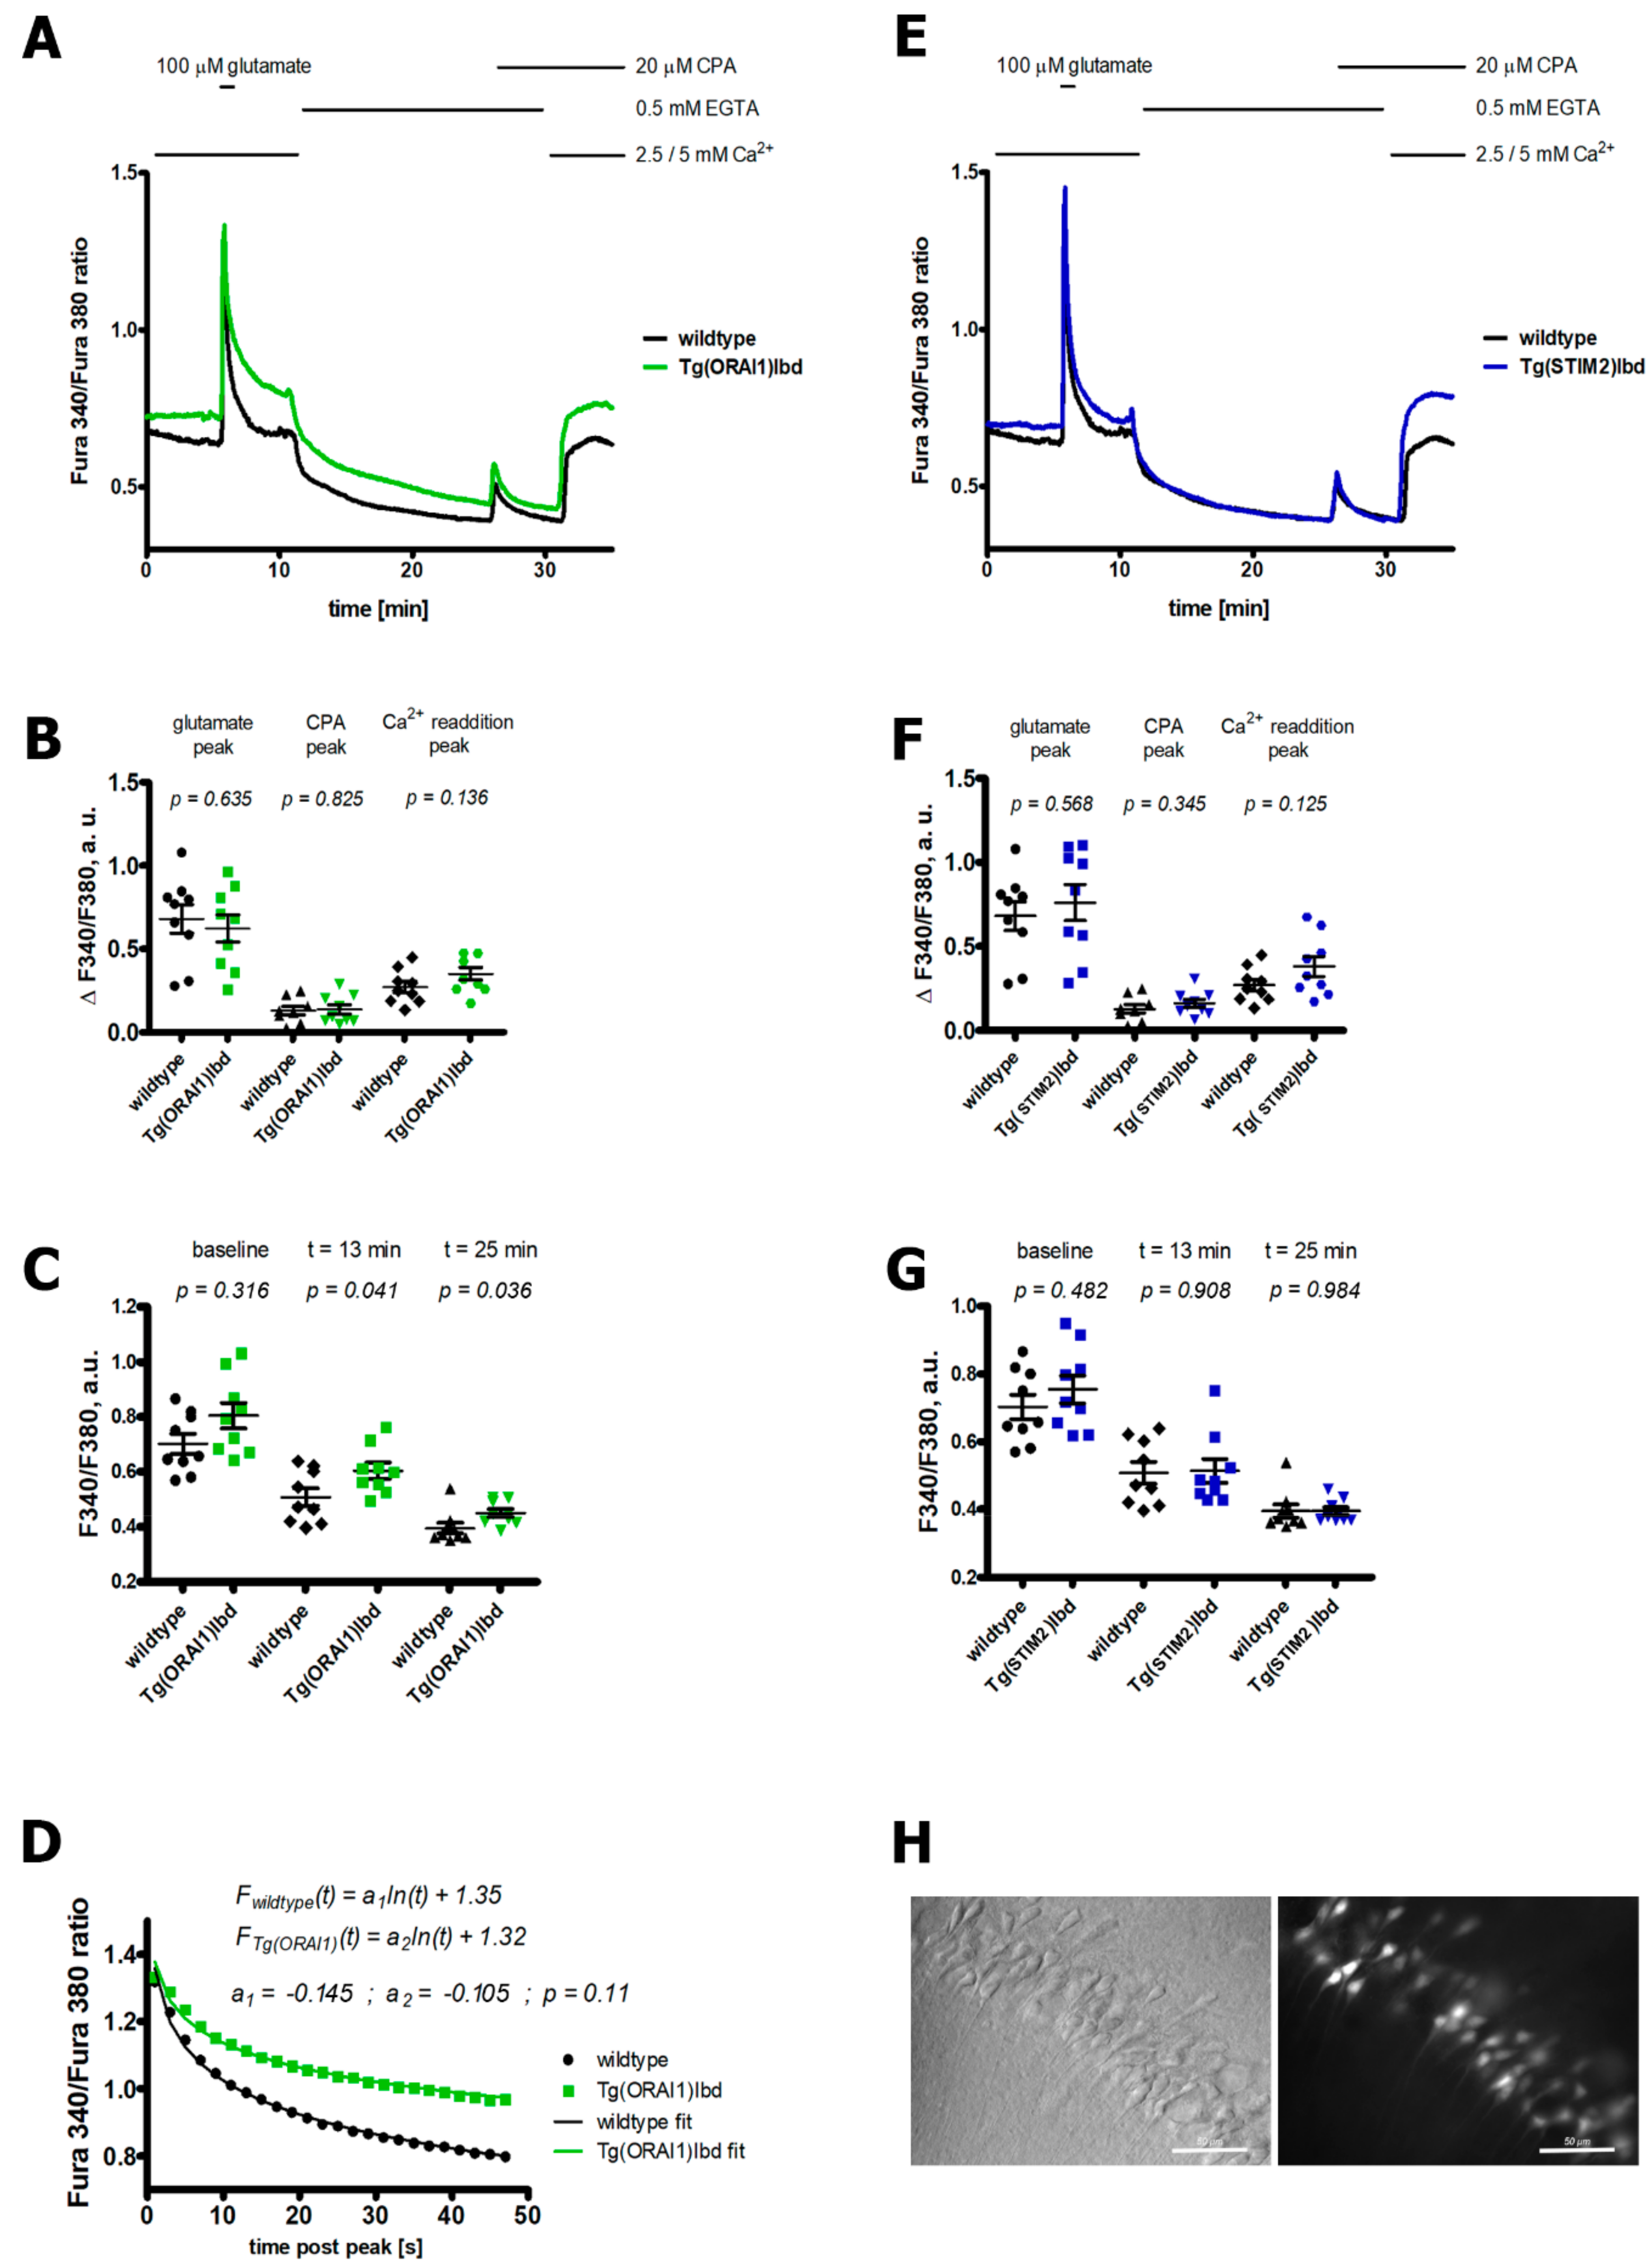
2.1. Overexpression of ORAI1 in Neurons Leads to Altered Ca2+ Response in a Modified Ca2+ Addback Assay in CA1 Hippocampal Region

Acute brain slices of hippocampi of wild-type and transgenic ORAI1 mice were analyzed by fluorescent imaging. Calcium measurements were performed using Fura-2 acetomethyl ester (AM) indicator that was loaded into the cells by gradual pipetting over the slice with the use of an automated perfusion system. To assess Ca2+ homeostasis in the ORAI1 overexpressing neurons, we used a Ca2+ addback assay that was modified to enable the measurement of Ca2+ release from the ER [33]. According to suggestions that were proposed by Amrhein et al. (2019), the results are presented as raw p-values [34]. Also, the asterisks that are commonly used to signify a particular confidence interval are not shown. As shown in Figure 1A, the basal level of Ca2+ was slightly higher in neurons of transgenic ORAI1 mice. Stimulation by glutamate led to comparable peaks in all genetic variants tested (Figure 1B,F). However, the time-course of signal decay following the brief pulse of glutamate tended to be slower in ORAI1 overexpressing neurons (Figure 1D). The resulting difference in Ca2+ levels persisted during the subsequent application of ethylene glycol-bis(β-aminoethyl ether)-N,N,N′,N′-tetraacetic acid (EGTA) (Figure 1A,C). These changes were absent in neurons with overexpression of STIM2 (Figure 1E,G). This may suggest that neurons of ORAI1 transgenic mice exhibit changes in the mechanisms that are responsible for extrusion of Ca2+ from the cytosol by plasma membrane calcium ATP-ase (PMCA) or Ca2+ uptake into the ER. Moreover, a tendency towards the increased influx of Ca2+ ions upon Ca2+ addback was observed both in ORAI1 and STIM2 overexpressing neurons.

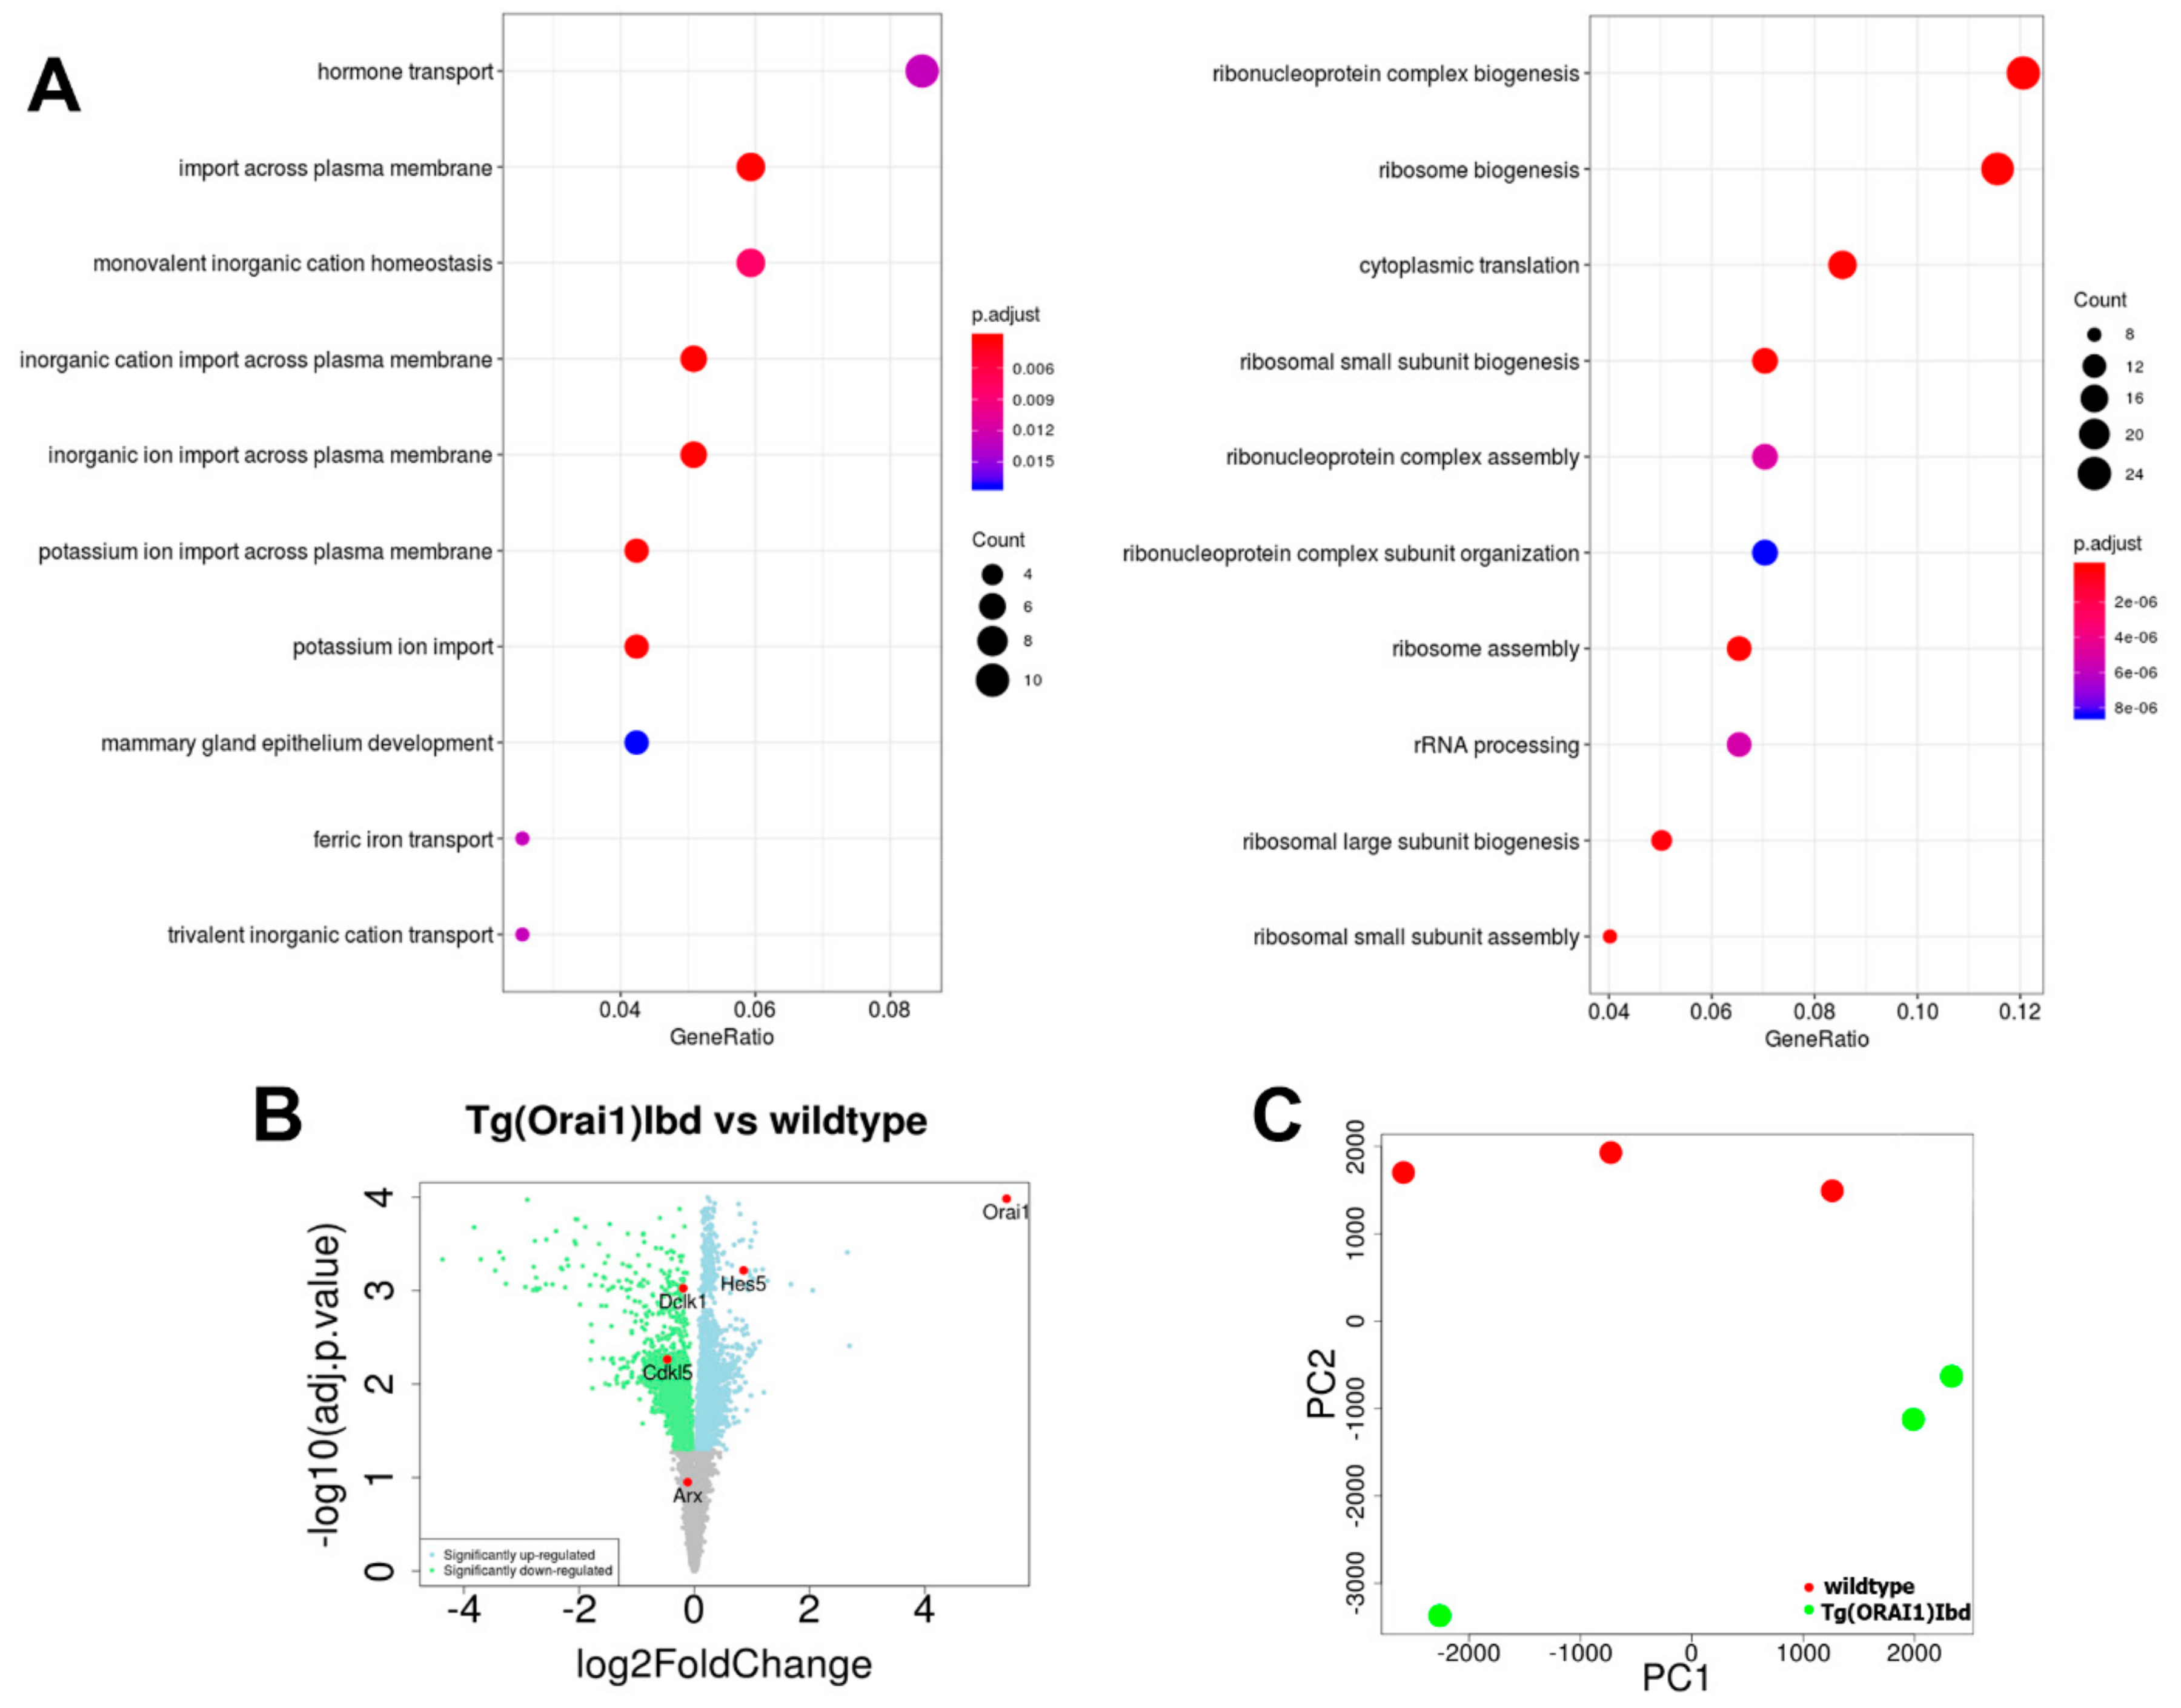
2.2. RNAseq Analysis of Transcripts from Hippocampi Indicates Up-Regulation of the Machinery Involved in Ribosome Biogenesis and Ribonucleoprotein Complex Assembly

We next isolated total RNA from hippocampi of wild-type (n = 3, age 7 months) and of FVB/NJ-Tg(ORAI1)Ibd (n = 3, age 7 months) females and performed RNAseq experiments. Based on the collected RNAseq data, we performed functional (pathways, gene groups) analysis of the genes that were differentially expressed between the hippocampi of wild-type and of FVB/NJ-Tg(Orai1)Ibd females. As shown by the Gene Ontology Biological Process groups (GO BP) (Figure 2A, left), the most down-regulated genes were those belonging to hormone transport group and related with import across plasma membrane and ion transport. Most of the up-regulated genes belonged to the ribonucleprotein complex biogenesis, ribosome biogenesis, and cytoplasmic translation (Figure 2A, right). To extract the complex association between the identified GO BP groups we used the category netplot function (cnetplot). The cnetplot depicts the linkages of genes and biological concepts (GO terms) as a network, which allows to visualize the genes that are involved in the enriched pathways and genes that may belong to multiple annotation categories (Figure S1). Among the up-regulated genes, Orai1 was present, which confirms the identity of transgenic mice (Figure 2C). The lists of genes that were identified among the particular GO BP groups and that are present in dot plots in Figure 2A are listed in data Supplementary data (Tables S1 and S2). The expression of selected genes, some of which are indicated in the volcano plot (Figure 2B), was further validated by the real-time PCR and ddPCR methods.

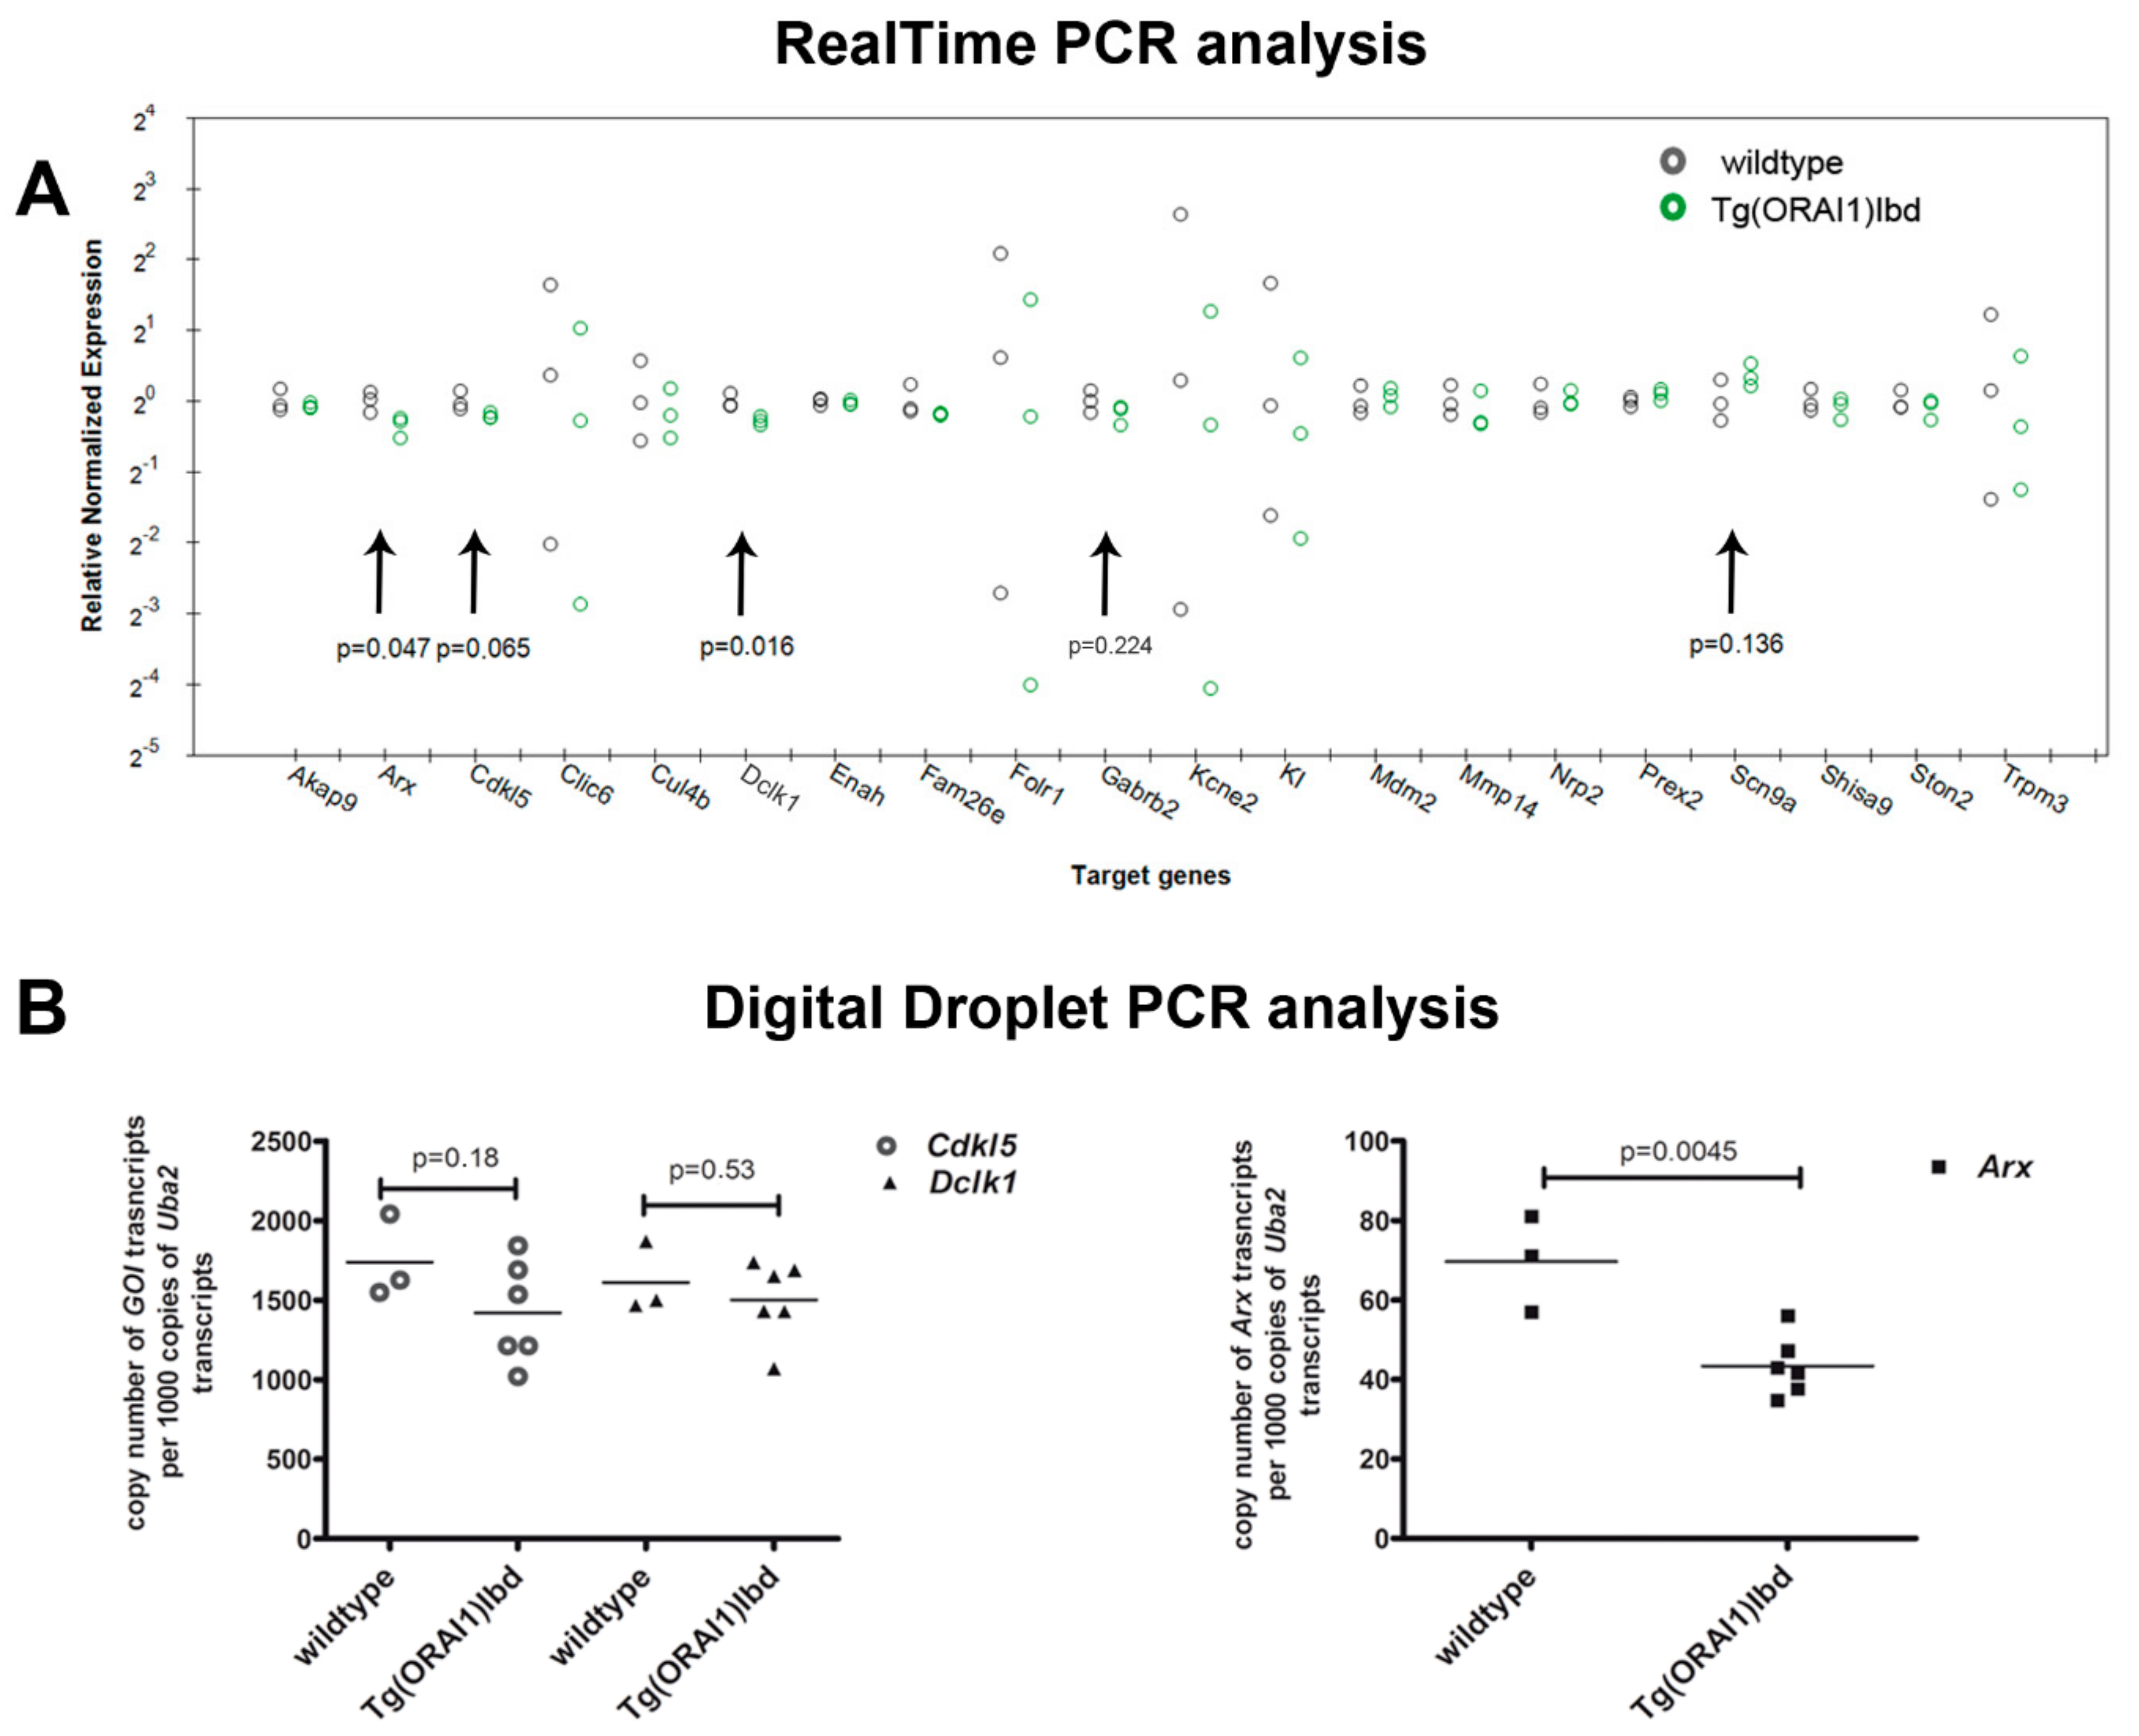
2.3. Validation of RNAseq Data Using Customized Real-Time PCR Assays and ddPCR Technique Indicates Differential Expression of Dclk1, Cdkl5, and Arx Genes in the Hippocampi of Tg(ORAI1)Ibd Females

We next performed real-time PCR analysis to verify the RNAseq data using customized arrays designed for the 23 genes that are listed in Table 1.
As the reference genes, Uba-2 (catalog no. qMmuCID0018845, Bio-Rad), Gapdh (catalog no. qMmuCED0027497, Bio-Rad), and Actin (catalog no. qMmuCED0027505, Bio-Rad) were selected, which meet the criteria of the reference gene selection tool (CFX software, Bio-Rad). RNA was isolated from hippocampi of wild-type (n = 3, age 5 months) and of FVB/NJ-Tg(ORAI1)Ibd females (n = 3, age 6 months). The majority of genes showed a similar level of expression (Figure 3A and Table 1) that was calculated as 2−∆∆Ct. The genes which were markedly down-regulated in the transgenic individuals included Arx (aristaless related homeobox) (2−∆∆Ct = 0.78, p = 0.047), Dclk1 (Serine/threonine-protein kinase) (2−∆∆Ct = 0.82, p = 0.016), and Cdkl5 (Cyclin-dependent kinase-like 5) (2−∆∆Ct = 0.85, p = 0.02 when only Actin was used in the calculations as the reference gene). Human mutations in these genes are associated with epilepsy. Also Gabrb2 (Gamma-aminobutyric acid receptor subunit beta-2) and Scn9a (Sodium channel protein type 9 subunit alpha) genes, which are implicated in epilepsy, showed altered expression in the transgenic animals (2−∆∆Ct = 0.87, p = 0.23; 2−∆∆Ct = 1.26, p = 0.136, respectively). Because the observed changes in 2−∆∆Ct values were relatively modest, to validate the changes in expression of the selected genes we used a novel technique, digital droplet PCR (ddPCR, Bio-Rad). This powerful method is based on partitioning of one PCR reaction mixture into up to 20,000 independent reactions, which resulted in high precision, sensitivity, and accuracy of the data [35]. To fulfill the requirements of validation, the RNA from hippocampi was isolated from the next group of animals (3 wild-type vs. 6 transgenic, age-matched). Using customized assays that were dedicated to ddPCR analysis and Uba-2 gene as a reference, we observed a reduction in the copy number of Arx (43 vs. 69, p = 0.0045) in transgenic females. The differences in the copy number of Cdkl5 and Dclk1 were insignificant (1470 vs. 1739, p = 0.18 and 1501 vs. 1612, p = 0.53, respectively).

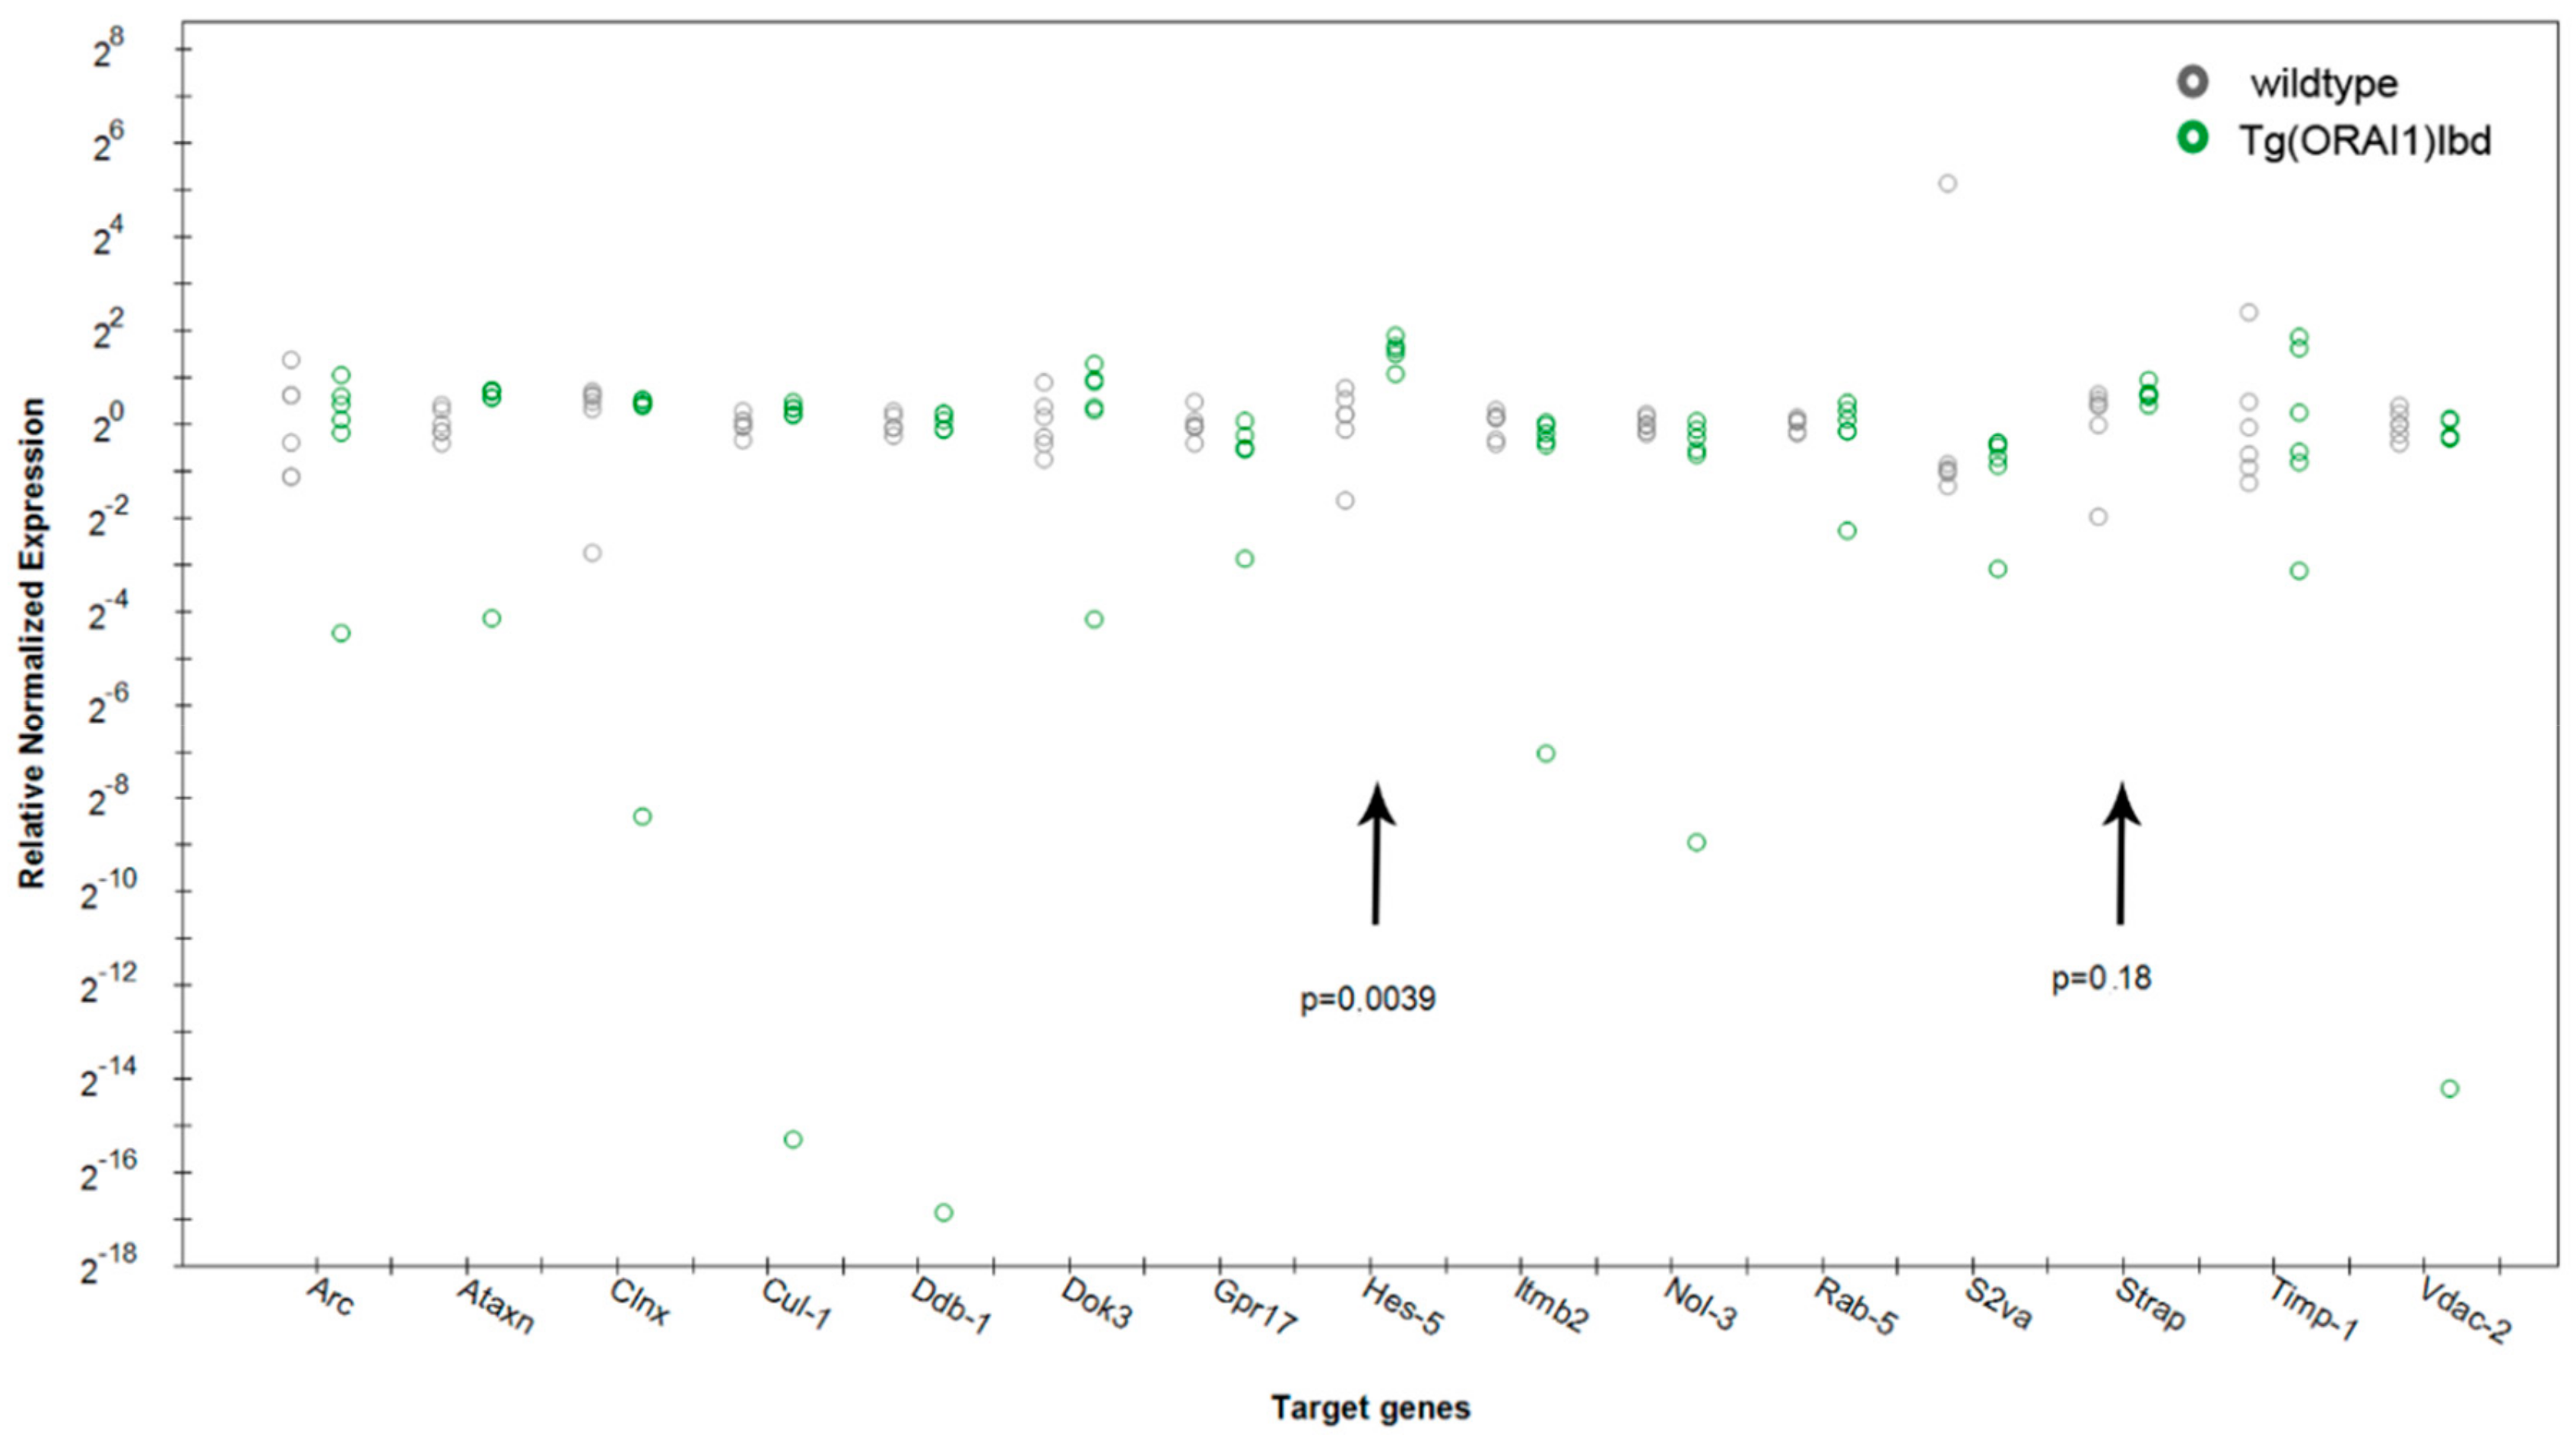
2.4. Expression of Hes-5, a Transcriptional Repressor That Is Involved in Neurogenesis, Is Up-Regulated in Tg(ORAI1) Ibd Females

In the next set of the real-time PCR analysis based on RNAseq data, we designed an additional 15 pairs of primers (Table 2).
Using the matrixes that were derived from previous experiments (6 wild-type vs. 6 transgenic mice) and Uba-2 as a reference gene, we identified an up-regulation of Hes-5 (Transcription factor HES-5) expression (2−∆∆Ct = 2,93, p = 0.0039) (Figure 4). Among the genes that were analyzed and described in Table 2, we detected a trend towards the up-regulation of Strap (Serine-threonine kinase receptor-associated protein). The protein is a part of the survival of motor neurons (SMN) complex that acts as a catalyst in the assembly of small nuclear ribonucleoproteins (snRNPs), the building blocks of the spliceosome (2−∆∆Ct = 1.56, p = 0.18).

3. Discussion

The role of SOCE in neurons and its components, such as STIM proteins and Ca2+ channels, is far from being understood. It becomes clear that not only ORAI and transient receptor potential cation channels (TRPCs) [36], but also voltage-gated dependent channels (VGCC) [37] and α-amino-3-hydroxy-5-methyl-4-isoxazolepropionic acid (AMPA) receptors [38,39] are sensitive to STIMs. Our group also demonstrated the involvement of STIM1 in mGlur-LTD phenomenon in CA3-CA1 projection of hippocampus in the novel FVB/NJ-Tg(STIM1)Ibd transgenic line [40]. On the other hand, it is now well established that local Ca2+ microdomains that appear upon opening of store operated calcium channels activate downstream effectors like calcineurin or adenylyl cyclase in non-excitable cells. The wide scope of processes mediated by Ca2+ nanodomains that are generated by SOCE is well described in a recent review by Barak and Parekh [9].
In hippocampal neurons nSOCE is believed to be mediated mainly by STIM2 together with Orai2 and Trpc6. It was suggested that Ca2+ that is delivered by nSOCE is responsible for Ca2+/calmodulin-dependent protein kinase II (CaMKII) pathway activation, which contributes to spine maintenance of mushroom spines [41]. Ca2+ disruption leads to synaptic loss and cognitive decline in aging and Alzheimer’s disease [41,42,43]. The role of nSOCE seems to be even more complex as indicated by the recent results by Chen–Engerer et al. [26]. They demonstrated that in CA1 pyramidal cells nSOCE that is mediated by ORAI2 is essential for refilling of IP3 sensitive Ca2+ stores, whereas ryanodine-sensitive stores are VGCC dependent. The authors postulate that their observations may help to explain the distinct roles of inositol triphosphate receptor (IP3Rs) and RyRs for various forms of synaptic plasticity.
As a consequence of ORAI1 transgene overexpression in mice used in our studies, we modified the level of ORAI1 in neurons, especially in the hippocampus, in which the predominant isoform is ORAI2. The observed trend of a higher amplitude of nSOCE in neurons of Tg(ORAI1)Ibd transgenic mice is in line with the observation by Vaeth et al. (2017), who showed that ORAI2 was a less conductive subunit of CRAC channel in immune cells [20]. This observation was supported by Fura- 2 quenching experiments using Mn2+, in which we observed faster decay of the signal in ORAI1 overexpressing neurons (Figure S2). Because Mn2+ quenches the fluorescence of Fura-2 and store-operated channels are permeable to them, such approach can be used to assess the activity of SOCs. Moreover, a trend for different kinetics of the [Ca2+] decay after glutamate treatment and the subsequent significant differences in the Ca2+ level in chelating conditions that were described in this work are in agreement with the observations done by Chen–Engerer et al. (2019). They showed the importance of ORAI2-mediated nSOCE in refilling of IP3 sensitive Ca2+ stores [26]. Due to the fact that glutamate stimulation also evokes IP3 signaling cascade that in turn leads to Ca2+ release from the ER, subsequent ORAI-dependent refilling of ER Ca2+ stores might be altered in neurons of our transgenic line [44]. These observations suggest that our transgenic line might be a useful tool for an in-depth analysis of specific molecular targets that are activated by nSOCE in the brain.
RNAseq analysis of the material from Tg(ORAI1)Ibd transgenic line identified up-regulation of the genes that belong to the GO biological processes that are involved in the ribonucleoprotein complex biogenesis, ribosome biogenesis, and assembly, which are all components of translational machinery. It was demonstrated in acinar polarized cells that overexpression of STIM1 increased the density of ribosome-free terminals in rough ER (RER), and facilitated the formation of ER-plasma membrane (ER-PM) junctions and SOCE propagation. If our future validation of these RNAseq data by real-time and ddPCR is positive, it may suggest that Ca2+ microdomains that are generated by nSOCE serve as a regulatory component of the translation process [45,46].
As previously reported by our group, overexpression of ORAI1 in neurons induced seizure-like symptoms in aged female mice [32]. Application of kainic acid and bicuculline to hippocampal slices from Tg(ORAI1)Ibd females revealed a significantly lower frequency of interictal bursts compared with samples that were isolated from wild-type female or transgenic male mice. The down-regulation of Arx, Cdkl5, and Dclk1 genes that we observed in the present work is in line with the report that loss of function mutations of human aristaless related homeobox (ARX), CDKL5, and DCLK1 are found in epileptic patients [47] (Table 3). It might be speculated that the Ca2+ nanodomains that appear locally by the activity of CRAC channels affect the expression of these genes via downstream pathways.
In conclusion, our data indicate that overexpression of ORAI1 changed the subunit composition of CRAC channels, which caused differences in the observed Ca2+ responses and induced specific changes in gene expression. By real-time PCR, we detected a down-regulation of Arx, Cdkl5, and Dclk1 genes, human homologues of which are involved in etiology of epilepsy. This down-regulation might explain seizure-like phenomena that were observed in 15-month-old females of the FVB/NJ-Tg(ORAI1)Ibd line.

4. Materials and Methods

4.1. Animal Care

The mice were housed under standard conditions on a 12 h/12 h light/dark cycle with food and water available ad libitum. All of the animal experiments were approved by the Local Commission for the Ethics of Animal Experimentation No. 1 in Warsaw (approval no. 756/2015, 25 May 2015 and approval no. 416/2017, 21 November 2017) and performed in accordance with the European Communities Council Directive (63/2010/EEC, 22 September 2010). All analyses described in the text were performed on 7 ±1-months-old female mice.

4.2. Generation of FVB/NJ–Tg(ORAI1)Ibd Transgenic Mice and Characterization of Transgene Expression

The details on the generation of the transgenic lines were described elsewhere [32]. In brief, a 1-kb coding sequence of human ORAI1 (cDNA clone MGC:21530 IMAGE:3914595; Dharmacon, USA) was amplified by PCR with XhoI-containing primers (forward 5′-ACTTCACTCGAGACCATGCATCCGGAGCCCG-3′, reverse 5′- ACTTCACTCGAGCTAGGCATAGTGGCTGCCG-3′). The PCR product was digested with XhoI and subcloned into the XhoI site of the modified mouse Thy-1.2 expression cassette [66,67]. The Thy1.2-ORAI1 construct was subsequently digested with PvuI and NotI and used for typical pronuclear microinjection [68]. Offspring of the F2 generation and onward were genotyped by PCR using the following primers: Thy_Forw_genotype 5′-TCTGAGTGGCAAAGGACCTTAGG-3′ and ORAI1_Rev_genotype 5′-TGGTCCTGTAAGCGGGCAAAC-3′.

4.3. Brain Slice Preparation

The reagents were purchased from Sigma unless indicated otherwise. Hippocampal sections were prepared according to the protective recovery method [69]. Mice of the age P25 ± 5 were sacrificed by cervical dislocation. Next, brains were isolated and placed in a dish filled with N-methyl-D-glucamine (NMDG)-based artificial cerebrospinal fluid (NMDG-aCSF) solution that was cooled to ~2°C and contained, in mM: NMDG, 92, KCl, 2.5, 4-(2-hydroxyethyl)-1-piperazineethanesulfonic acid (HEPES), 20, thiourea, 2, glucose, 25, NaH2PO4, 1.25, NaHCO3, 30, MgSO4, 10, CaCl2, 0.5, Na-ascorbate, 5, Na-pyruvate, 3 N-acetyl-L-cystein (NAC, myprotein.com, Manchester, United Kingdom), 3. Sections that were 350 μm thick were obtained with the use of a vibratome (HM 650V, Thermo Scientific, Waltham, MA, USA). During the slicing procedure, the tissue was submerged in ice-cold NMDG-aCSF solution that was bubbled with carbogen (95%/5% O2/CO2). Next, the sections were incubated in carbogenated NMDG aCSF for 10 min (temperature: ~33 °C). A 2M NaCl solution was gradually added to the solution according to [69]. The slices were then transferred to HEPES-based aCSF that contained, in mM: NaCl, 82, KCl, 2.5, HEPES, 20, thiourea, 2, glucose, 25, NaH2PO4, 1.25, NaHCO3, 30, MgSO4, 2, Na-ascorbate, 5, Na-pyruvate, 3, and 12 mM NAC (temperature: ~25 °C). The recordings were started after 1 h of incubation in HEPES-aCSF. The pH of all of the solutions was between 7.3 and 7.4.

4.4. Dye-Loading Procedure

A 1 mM stock of Fura-2 AM (Thermo-Fisher) that was dissolved in DMSO was diluted in artificial cerebrospinal fluid (aCSF) (it contained, in mM: NaCl, 126, KCl, 2.2, glucose, 20, NaH2PO4, 1.25, NaHCO3, 25, MgSO4, 1, and CaCl2, 2.5; the pH was adjusted to 7.3–7.4) to a final concentration of 50 µM. The solution was supplemented with Pluronic F-127 (Sigma-Aldrich, St. Louis, MO, USA) at a final concentration of 2.5%. The dye solution was applied locally above the hippocampal slice with the use of Perfusion Pencil (Automate Scientific, Berkeley, CA, USA), for 20 min. During the loading procedure, the slices were perfused with aCSF solution at a rate of 4–5 mL/min, at 33 °C, to facilitate incorporation of the dye molecules by the cells. After the loading, the slices were allowed to rest for 20 min, under a constant perfusion of aCSF at a temperature of 25 °C. The consistency of the loading procedure was checked by acquiring fluorescent Fura-2 signal at its isosbestic point (λ = 360 nm). The intensity of the signal excited at this wavelength should not depend on Ca2+ concentration and thus only reflect the quantity of the incorporated and de-esterified dye alone. The signal was comparable across preparations. Moreover, we did not detect any correlation between the loading efficiency and the magnitude of the recorded Ca2+ responses.

4.5. Ca2+ Imaging of Neurons in Brain Slices

The measurements were performed using MetaFluor software, a Zeiss Examiner Z.1 microscope (40×/1.0 objective), and the Retiga ELECTRO™ CCD Camera (Teledyne Qimaging, Surrey, BC, Canada). A peristaltic pump was used to perfuse the hippocampal slices with aCSF that contained 126 mM NaCl, 2.6 mM KCl, 20 mM glucose, 1.25 NaH2PO4, 25 mM NaHCO3, and 1 mM MgSO4. Additionally, aCSF that contained chemicals used for evoking Ca2+ responses was applied locally through a 100 µm wide tip that was positioned 100 µm above the pyramidal neurons of the CA1 hippocampal area. The pencil was connected to an automated perfusion system ValveLink 8.2 (Automate Scientific, Berkeley, CA, USA). For the first 10 min of the recordings (baseline recording, glutamate application, and signal relaxation), 2.5 mM CaCl2 was included in the solution that was perfused with the use of the pump. Next, the solution was manually changed to Ca2+-free aCSF that contained 0.5 mM (ethylene glycol-bis(β-aminoethyl ether)-N,N,N′,N′-tetraacetic acid) EGTA. The pH of aCSF was adjusted to 7.4 at room temperature with carbogen and HCl. The extracellular solution was carbogenated throughout the recordings and heated with an in-line heater (catalog no. 64-0102, controlled by a TC-324B temperature control unit, Warner Instruments) to maintain the temperature in the recording chamber close to 25 °C. The rate of solution flow was 4–5 mL/min.
To assess Ca2+ homeostasis in the CA1 pyramidal neurons of the hippocampus, a Ca2+ addback assay that was modified to allow for the quantification of the Ca2+ efflux from the ER [33] was used. Changes in the fluorescent signal in the neuronal cell bodies were monitored and quantified. For baseline recording, aCSF that contained 2.5 mM Ca2+ was perfused for 5 min, which was followed by the local application of 100 µM Na-glutamate for 10s. Next, the signal relaxation was monitored for another 5 min in 2.5 mM Ca2+ aCSF. To deplete the extracellular milieu from the Ca2+ ions, the solution was changed to aCSF that contained 0.5 mM EGTA for 15 min, which was followed by the local application of 20 μM cyclopiazonic acid (CPA) for 5 min. Next, Ca2+ was re-added to the solution at a concentration of 5 mM Ca2+ for 5 min, in the presence of 20 μM CPA. To limit activity-driven Ca2+ entry, 1 μM Tetrodotoxin (TTX) and 10 μM nifedipine were included in all solutions that were used from the 10th min of the experiment onwards.
For Fura-2 quenching experiments, hippocampal slices were loaded with the dye as described above. For baseline recording, Ringer’s solution (composed of, in mM: NaCl, 137, KCl, 5, glucose, 24, HEPES, 10, CaCl2, 2, MgCl2, 1, pH = 7.3–7.4) was perfused for 5 min, which was followed by application of Ca2+-free Ca2+ depleting solution (Ringer’s solution supplemented with 0.5 mM EGTA and 20 μM CPA) for 15 min. Next, Ca2+-free Ringer’s solution supplemented with 2 mM Mn2+ (as MnCl2) was locally applied above the cells of interest, in the absence of EGTA and presence of 20 μM CPA. To limit activity-driven Ca2+ entry, 1 μM TTX and 10 μM nifedipine were included in all solutions. To quantify the rate of Mn2+ influx, linear part of the curves following Mn2+ addition (which corresponded to the first 25 s of treatment) were approximated with a linear function and the decay slope was calculated (all calculations performed in Microsoft Excel).

4.6. Data Analysis

The acquired signals were quantified and exported with the use of MetaFluor software and further analyzed with Microsoft Excel and GraphPad Prism 5 (USA). Student’s t-test was used to check the statistical significance of the observed differences between the groups.

4.7. Global Gene Expression Profiling

Total RNA was extracted from three individual hippocampi per variant using RNeasy Lipid Mini Kit (Qiagen: 74804, Hilden, Germany) and treated on-column with DNase using the RNase-Free DNase Set (Qiagen: 79254). Preparation of cDNA libraries and sequencing by Illumina HighSeq 1500 (run type: Paired-end sequencing, read length: 1 × 76 bp) were carried out in cooperation with Core Facility of IIMCB and the Nencki Institute. Sequencing reads (fastq) were filtered by Trimmomatic program, discarding all reads contaminated by sequencing adapter sequence as well as discarding reads whose mean quality in a bin of 20 base pair (bp) was below Q30. Minimal length of read used for mapping was set as 65 bp. Quality filtered reads were aligned to mouse genome (mm10) by STAR program. Statistical analyses, including comparisons to other samples, were done in R environment using NOIseq library [70]. Functional analysis was performed for the genes that were differentially expressed in transgenic versus wild-type samples (raw p-value below 0.05), separately for genes up- and down-regulated in transgenic animals. The functional analysis of data was performed using clusterProfiler [71] to find statistically significant Gene Ontology terms. The whole metadata of RNAseq analysis deposit in NCBI’s Gene Expression Omnibus [72] and are accessible through GEO Series accession number GSE138370 (https://www.ncbi.nlm.nih.gov/geo/query/acc.cgi?acc=GSE138370).

4.8. Real-Time Polymerase Chain Reaction Arrays and Quantitative Real-Time PCR (qPCR)

Hippocampi were dissected from three adult female mice (≥ postnatal day 180 (PD180)) per variant for real-time polymerase chain reaction arrays. The material was homogenized in Qiazol (Qiagen, catalog no. 79306, Germany) and subjected to total RNA isolation according to manufacturer’s protocol of RNeasy Lipid Tissue Mini Kit (Qiagen: 74804, Germany). The quality of RNA was checked by absorbance measurements at 260, 280, and 230 nm. For the analysis, only samples whose A260/280 nm and A230/280 nm values exceeded 1.8 were used. There were 1000 ng of RNA templates used to synthesize first-strand cDNA, with the use of iScript reverse transcription supermix (Bio-Rad: 170–8841, USA). The 96-well custom plates that contained primers for target and reference genes (Bio-Rad, USA) and SsoAdvanced Universal SYBR Green Supermix (Bio-Rad:1725274; USA) were used to perform teal-time polymerase chain reaction (RT-PCR, carried out in duplicate). The cDNA (50 ng) was used for each reaction. Small Ubiquitin-like Modifier (SUMO)-activating enzyme subunit 2 (Uba-2), glyceraldehyde-3-phosphate dehydrogenase (Gapdh), and Actin (Actb) were used as reference genes. The reactions were performed using the CFX Connect™ Real-Time PCR Detection System (Bio-Rad). Bio-Rad CFX Maestro 1.1 software was used to analyze the data (Bio-Rad, USA). The reference genes’ stability was acceptable (as evaluated by the reference gene selection tool). For calculation of the expression levels, equal efficiencies were assumed for all reactions and the 2−∆∆Ct method was used. For each gene, the average normalized expression was calculated from the following formula:
Normalized   expressionGOI   = R Q GOI / R Q U b a 2 × R Q G a p d h × R Q A c t b 1 3
where: GOI, gene of interest; RQ, relative quantity, calculated as RQ = 2(−CtGOI).
The statistical significance of the observed differences in the expression levels between the tested groups was determined with the use of analysis of variance (ANOVA), followed by Tukey’s Honestly Significant Difference (HSD) post-hoc test.
The real-time PCR reactions were performed in duplicate for each sample using SsoAdvance Universal SYBR Green Supermix (Bio-Rad) with the following sets of specific gene primers (the primer sequences are listed in Table 2, Sigma). Based on the real-time PCR arrays, SUMO-activating enzyme subunit 2 (Uba-2) was chosen as reference gene. The specificity of the reactions was determined based on dissociation curve analysis. Relative gene expression was calculated using the 2−ΔΔCt method and Bio-Rad CFX Maestro 1.1 software (Bio-Rad, USA). Six adult female mice (≥ postnatal day 180 (PD180), per variant were taken to perform this experiment.

4.9. DdPCR Validation of Selected Genes

Primers for Arx, Cdkl5, Dclk1, and Uba2 were sourced from the EvaGreen ddPCR™ assays (Bio-Rad: dMmuEG5062557; dMmuEG5078166; dMmuEG5084027; dMmuEG5081512, respectively) and diluted according to the kit instructions. For ddPCR technology (QX200 Droplet Digital PCR ddPCR™) System—Bio-Rad, USA) 21 μL reaction mixtures containing 25 ng of cDNA (six transgenics mice vs. 3 wild-type mice variant), primers, and QX200™ddPCR™ EvaGreen Supermix (Bio-Rad: 186–4034) were used. Droplet generation and transfer of emulsified samples to PCR plates (Bio-Rad: 12001925) were performed according to the manufacturer’s instructions (Instruction Manual, QX200™ Droplet Generator—Bio-Rad). The ddPCR plate was sealed with a foil heat seal (Bio-Rad, 181–4040) and the PX1™ PCR Plate Sealer (Bio-Rad; 181–4000). The following cycling protocol was established according to the manufacturer’s protocol: 95 °C enzyme activation step for 5 min followed by 40 cycles of a two-step cycling protocol (95 °C for 30 s and 58 °C for 1 min). The ramp rate between these steps was slowed to 2 °C/second. The post-cycling protocol was in accordance with the kit instructions (Bio-Rad, 186–4034). The absolute quantity of DNA per sample (copies/μL) was processed using QuantaSoft version 1.7.4.0917 (Bio-Rad, USA). The data were next exported to Microsoft Excel for further analysis.

Supplementary Materials

The following are available online at https://www.mdpi.com/1422-0067/20/22/5539/s1.

Author Contributions

L.M. and J.K. designed research. L.M., B.W., and F.M. conducted the experiments and analyzed the data. L.M. and J.K. wrote the manuscript, with input from F.M. and B.W.

Funding

This research was funded by Commercialization Quest internal Grant Program of IIMCB no. QC_4 LM and MAESTRO grant to J.K. from a National Science Centre (2011/02/A/NZ3/00144).

Acknowledgments

We thank T. Węgierski for his critical comments regarding the manuscript and A. Maciąg for his support in calculations.

Conflicts of Interest

The authors declare no conflict of interest. The funders had no role in the design of the study; in the collection, analyses, or interpretation of data; in the writing of the manuscript, or in the decision to publish the results.

Abbreviations

a.u.arbitrary units
aCSFartificial cerebrospinal fluid
AMacetomethyl ester
AMPAα-amino-3-hydroxy-5-methyl-4-isoxazolepropionic acid
Arxaristaless related homeobox
CaMKIICa2+/calmodulin-dependent protein kinase II
Cdkl5cyclin-dependent kinase-like 5, also known as serine/threonine kinase 9 (STK9)
CPAcyclopiazonic acid
CRACcalcium release activated channel
EGTAethylene glycol-bis(β-aminoethyl ether)-N,N,N′,N′-tetraacetic acid
Dclk1doublecortin like kinase 1
ddPCRdigital droplet PCR
DRGdorsal root ganglion
ERendoplasmic reticulum
FPKMFragments Per Kilobase Million
Fura-2 AMFura-2 acetomethyl ester
GO BPgene ontology biological process
Hes-5hairy and enhancer of split-5
IbdInstitute of Experimental Biology, in Polish: Instytut Biologii Doświadczalnej
IP3Rinositol triphosphate receptor
NMDGN-methyl-D-glucamine
nSOCEneuronal store operated calcium entry
PMCAplasma membrane calcium ATP-ase
RERrough endoplasmic reticulum
RNASeqRNA sequencing
SOCEstore operated calcium entry
STIMstromal interaction molecule
Tgtransgenic
TRPCstransient receptor potential cation channels
TTXtetrodotoxin
VGCCvoltage-gated calcium channel

References

  1. Putney, J.W., Jr. A model for receptor-regulated calcium entry. Cell Calcium 1986, 7, 1–12. [Google Scholar] [CrossRef]
  2. Majewski, L.; Kuznicki, J. SOCE in neurons: Signaling or just refilling? Biochim. Biophys. Acta 2015, 1853, 1940–1952. [Google Scholar] [CrossRef] [PubMed] [Green Version]
  3. Moccia, F.; Zuccolo, E.; Soda, T.; Tanzi, F.; Guerra, G.; Mapelli, L.; Lodola, F.; D’Angelo, E. Stim and Orai proteins in neuronal Ca(2+) signaling and excitability. Front. Cell. Neurosci. 2015, 9, 153. [Google Scholar] [CrossRef] [PubMed]
  4. Lu, B.; Fivaz, M. Neuronal SOCE: Myth or Reality? Trends Cell Biol. 2016, 26, 890–893. [Google Scholar] [CrossRef]
  5. Wegierski, T.; Kuznicki, J. Neuronal calcium signaling via store-operated channels in health and disease. Cell Calcium 2018, 74, 102–111. [Google Scholar] [CrossRef] [PubMed]
  6. Poggioli, J.; Mauger, J.P.; Guesdon, F.; Claret, M. A regulatory calcium-binding site for calcium channel in isolated rat hepatocytes. J. Biol. Chem. 1985, 260, 3289–3294. [Google Scholar] [PubMed]
  7. Lewis, R.S.; Cahalan, M.D. Mitogen-induced oscillations of cytosolic Ca2+ and transmembrane Ca2+ current in human leukemic T cells. Cell Regul. 1989, 1, 99–112. [Google Scholar] [CrossRef]
  8. Penner, R.; Matthews, G.; Neher, E. Regulation of calcium influx by second messengers in rat mast cells. Nature 1988, 334, 499–504. [Google Scholar] [CrossRef]
  9. Barak, P.; Parekh, A.B. Signaling through Ca(2+) Microdomains from Store-Operated CRAC Channels. Cold Spring Harb. Perspect. Biol. 2019. [Google Scholar] [CrossRef]
  10. Bird, G.S.; Putney, J.W., Jr. Capacitative calcium entry supports calcium oscillations in human embryonic kidney cells. J. Physiol. 2005, 562, 697–706. [Google Scholar] [CrossRef]
  11. Maus, M.; Cuk, M.; Patel, B.; Lian, J.; Ouimet, M.; Kaufmann, U.; Yang, J.; Horvath, R.; Hornig-Do, H.T.; Chrzanowska-Lightowlers, Z.M.; et al. Store-Operated Ca(2+) Entry Controls Induction of Lipolysis and the Transcriptional Reprogramming to Lipid Metabolism. Cell Metab. 2017, 25, 698–712. [Google Scholar] [CrossRef] [PubMed]
  12. Lacruz, R.S.; Feske, S. Diseases caused by mutations in ORAI1 and STIM1. Ann. N. Y. Acad. Sci. 2015, 1356, 45–79. [Google Scholar] [CrossRef] [PubMed]
  13. Liou, J.; Kim, M.L.; Heo, W.D.; Jones, J.T.; Myers, J.W.; Ferrell, J.E., Jr.; Meyer, T. STIM is a Ca2+ sensor essential for Ca2+-store-depletion-triggered Ca2+ influx. Curr. Biol. 2005, 15, 1235–1241. [Google Scholar] [CrossRef] [PubMed]
  14. Roos, J.; Di Gregorio, P.J.; Yeromin, A.V.; Ohlsen, K.; Lioudyno, M.; Zhang, S.; Safrina, O.; Kozak, J.A.; Wagner, S.L.; Cahalan, M.D.; et al. STIM1, an essential and conserved component of store-operated Ca2+ channel function. J. Cell Biol. 2005, 169, 435–445. [Google Scholar] [CrossRef] [PubMed]
  15. Feske, S.; Gwack, Y.; Prakriya, M.; Srikanth, S.; Puppel, S.H.; Tanasa, B.; Hogan, P.G.; Lewis, R.S.; Daly, M.; Rao, A. A mutation in Orai1 causes immune deficiency by abrogating CRAC channel function. Nature 2006, 441, 179–185. [Google Scholar] [CrossRef]
  16. Vig, M.; Peinelt, C.; Beck, A.; Koomoa, D.L.; Rabah, D.; Koblan-Huberson, M.; Kraft, S.; Turner, H.; Fleig, A.; Penner, R.; et al. CRACM1 is a plasma membrane protein essential for store-operated Ca2+ entry. Science 2006, 312, 1220–1223. [Google Scholar] [CrossRef]
  17. Prakriya, M.; Feske, S.; Gwack, Y.; Srikanth, S.; Rao, A.; Hogan, P.G. Orai1 is an essential pore subunit of the CRAC channel. Nature 2006, 443, 230–233. [Google Scholar] [CrossRef]
  18. Hou, X.; Pedi, L.; Diver, M.M.; Long, S.B. Crystal structure of the calcium release-activated calcium channel Orai. Science 2012, 338, 1308–1313. [Google Scholar] [CrossRef]
  19. Yen, M.; Lokteva, L.A.; Lewis, R.S. Functional Analysis of Orai1 Concatemers Supports a Hexameric Stoichiometry for the CRAC Channel. Biophys. J. 2016, 111, 1897–1907. [Google Scholar] [CrossRef] [Green Version]
  20. Vaeth, M.; Yang, J.; Yamashita, M.; Zee, I.; Eckstein, M.; Knosp, C.; Kaufmann, U.; Karoly Jani, P.; Lacruz, R.S.; Flockerzi, V.; et al. ORAI2 modulates store-operated calcium entry and T cell-mediated immunity. Nat. Commun. 2017, 8, 14714. [Google Scholar] [CrossRef] [Green Version]
  21. Tsvilovskyy, V.; Solis-Lopez, A.; Schumacher, D.; Medert, R.; Roers, A.; Kriebs, U.; Freichel, M. Deletion of Orai2 augments endogenous CRAC currents and degranulation in mast cells leading to enhanced anaphylaxis. Cell Calcium 2018, 71, 24–33. [Google Scholar] [CrossRef] [PubMed]
  22. Eckstein, M.; Vaeth, M.; Aulestia, F.J.; Costiniti, V.; Kassam, S.N.; Bromage, T.G.; Pedersen, P.; Issekutz, T.; Idaghdour, Y.; Moursi, A.M.; et al. Differential regulation of Ca(2+) influx by ORAI channels mediates enamel mineralization. Sci. Signal. 2019, 12, eaav4663. [Google Scholar] [CrossRef] [PubMed]
  23. Wei, D.; Mei, Y.; Xia, J.; Hu, H. Orai1 and Orai3 Mediate Store-Operated Calcium Entry Contributing to Neuronal Excitability in Dorsal Root Ganglion Neurons. Front. Cell. Neurosci. 2017, 11, 400. [Google Scholar] [CrossRef] [PubMed] [Green Version]
  24. Schindl, R.; Frischauf, I.; Bergsmann, J.; Muik, M.; Derler, I.; Lackner, B.; Groschner, K.; Romanin, C. Plasticity in Ca2+ selectivity of Orai1/Orai3 heteromeric channel. Proc. Natl. Acad. Sci. USA 2009, 106, 19623–19628. [Google Scholar] [CrossRef] [PubMed]
  25. Feske, S.; Skolnik, E.Y.; Prakriya, M. Ion channels and transporters in lymphocyte function and immunity. Nat. Rev. Immunol. 2012, 12, 532–547. [Google Scholar] [CrossRef] [PubMed] [Green Version]
  26. Chen-Engerer, H.J.; Hartmann, J.; Karl, R.M.; Yang, J.; Feske, S.; Konnerth, A. Two types of functionally distinct Ca(2+) stores in hippocampal neurons. Nat. Commun. 2019, 10, 3223. [Google Scholar] [CrossRef]
  27. Vashisht, A.; Tanwar, J.; Motiani, R.K. Regulation of proto-oncogene Orai3 by miR18a/b and miR34a. Cell Calcium 2018, 75, 101–111. [Google Scholar] [CrossRef]
  28. Hoth, M.; Niemeyer, B.A. The neglected CRAC proteins: Orai2, Orai3, and STIM2. Curr. Top. Membr. 2013, 71, 237–271. [Google Scholar]
  29. Prakriya, M.; Lewis, R.S. Store-Operated Calcium Channels. Physiol. Rev. 2015, 95, 1383–1436. [Google Scholar] [CrossRef] [Green Version]
  30. Vaeth, M.; Feske, S. Ion channelopathies of the immune system. Curr. Opin. Immunol. 2018, 52, 39–50. [Google Scholar] [CrossRef]
  31. Feske, S. CRAC channels and disease—From human CRAC channelopathies and animal models to novel drugs. Cell Calcium 2019, 80, 112–116. [Google Scholar] [CrossRef] [PubMed]
  32. Maciag, F.; Majewski, L.; Boguszewski, P.M.; Gupta, R.K.; Wasilewska, I.; Wojtas, B.; Kuznicki, J. Behavioral and electrophysiological changes in female mice overexpressing ORAI1 in neurons. Biochim. Biophys. Acta Mol. Cell Res. 2019, 1866, 1137–1150. [Google Scholar] [CrossRef] [PubMed]
  33. Kipanyula, M.J.; Contreras, L.; Zampese, E.; Lazzari, C.; Wong, A.K.; Pizzo, P.; Fasolato, C.; Pozzan, T. Ca2+ dysregulation in neurons from transgenic mice expressing mutant presenilin 2. Aging Cell 2012, 11, 885–893. [Google Scholar] [CrossRef] [PubMed]
  34. Amrhein, V.; Greenland, S.; McShane, B. Scientists rise up against statistical significance. Nature 2019, 567, 305–307. [Google Scholar] [CrossRef] [Green Version]
  35. Taylor, S.C.; Laperriere, G.; Germain, H. Droplet Digital PCR versus qPCR for gene expression analysis with low abundant targets: From variable nonsense to publication quality data. Sci. Rep. 2017, 7, 2409. [Google Scholar] [CrossRef]
  36. Hartmann, J.; Karl, R.M.; Alexander, R.P.; Adelsberger, H.; Brill, M.S.; Ruhlmann, C.; Ansel, A.; Sakimura, K.; Baba, Y.; Kurosaki, T.; et al. STIM1 controls neuronal Ca(2+) signaling, mGluR1-dependent synaptic transmission, and cerebellar motor behavior. Neuron 2014, 82, 635–644. [Google Scholar] [CrossRef]
  37. Dittmer, P.J.; Wild, A.R.; Dell’Acqua, M.L.; Sather, W.A. STIM1 Ca(2+) Sensor Control of L-type Ca(2+)-Channel-Dependent Dendritic Spine Structural Plasticity and Nuclear Signaling. Cell Rep. 2017, 19, 321–334. [Google Scholar] [CrossRef]
  38. Garcia-Alvarez, G.; Lu, B.; Yap, K.A.; Wong, L.C.; Thevathasan, J.V.; Lim, L.; Ji, F.; Tan, K.W.; Mancuso, J.J.; Tang, W.; et al. STIM2 regulates PKA-dependent phosphorylation and trafficking of AMPARs. Mol. Biol. Cell 2015, 26, 1141–1159. [Google Scholar] [CrossRef]
  39. Gruszczynska-Biegala, J.; Sladowska, M.; Kuznicki, J. AMPA Receptors Are Involved in Store-Operated Calcium Entry and Interact with STIM Proteins in Rat Primary Cortical Neurons. Front. Cell. Neurosci. 2016, 10, 251. [Google Scholar] [CrossRef] [Green Version]
  40. Majewski, L.; Maciag, F.; Boguszewski, P.M.; Wasilewska, I.; Wiera, G.; Wojtowicz, T.; Mozrzymas, J.; Kuznicki, J. Overexpression of STIM1 in neurons in mouse brain improves contextual learning and impairs long-term depression. Biochim. Biophys. Acta Mol. Cell Res. 2017, 1864, 1071–1087. [Google Scholar] [CrossRef]
  41. Sun, S.; Zhang, H.; Liu, J.; Popugaeva, E.; Xu, N.J.; Feske, S.; White, C.L., III; Bezprozvanny, I. Reduced synaptic STIM2 expression and impaired store-operated calcium entry cause destabilization of mature spines in mutant presenilin mice. Neuron 2014, 82, 79–93. [Google Scholar] [CrossRef] [PubMed]
  42. Zhang, H.; Sun, S.; Wu, L.; Pchitskaya, E.; Zakharova, O.; Fon Tacer, K.; Bezprozvanny, I. Store-Operated Calcium Channel Complex in Postsynaptic Spines: A New Therapeutic Target for Alzheimer’s Disease Treatment. J. Neurosci. 2016, 36, 11837–11850. [Google Scholar] [CrossRef]
  43. Wojda, U.; Kuznicki, J. Alzheimer’s disease modeling: Ups, downs, and perspectives for human induced pluripotent stem cells. J. Alzheimer Dis. 2013, 34, 563–588. [Google Scholar] [CrossRef] [PubMed]
  44. Greget, R.; Pernot, F.; Bouteiller, J.M.; Ghaderi, V.; Allam, S.; Keller, A.F.; Ambert, N.; Legendre, A.; Sarmis, M.; Haeberle, O.; et al. Simulation of postsynaptic glutamate receptors reveals critical features of glutamatergic transmission. PLoS ONE 2011, 6, e28380. [Google Scholar] [CrossRef] [PubMed]
  45. Weiler, I.J.; Childers, W.S.; Greenough, W.T. Calcium ion impedes translation initiation at the synapse. J. Neurochem. 1996, 66, 197–202. [Google Scholar] [CrossRef]
  46. Lur, G.; Haynes, L.P.; Prior, I.A.; Gerasimenko, O.V.; Feske, S.; Petersen, O.H.; Burgoyne, R.D.; Tepikin, A.V. Ribosome-free terminals of rough ER allow formation of STIM1 puncta and segregation of STIM1 from IP(3) receptors. Curr. Biol. 2009, 19, 1648–1653. [Google Scholar] [CrossRef]
  47. Myers, K.A.; Johnstone, D.L.; Dyment, D.A. Epilepsy genetics: Current knowledge, applications, and future directions. Clin. Genet. 2019, 95, 95–111. [Google Scholar] [CrossRef]
  48. Sherr, E.H. The ARX story (epilepsy, mental retardation, autism, and cerebral malformations): One gene leads to many phenotypes. Curr. Opin. Pediatr. 2003, 15, 567–571. [Google Scholar] [CrossRef]
  49. Abedini, S.S.; Kahrizi, K.; Behjati, F.; Banihashemi, S.; Ghasemi Firoozabadi, S.; Najmabadi, H. Mutational screening of ARX gene in Iranian families with X-linked intellectual disability. Arch. Iran. Med. 2012, 15, 361–365. [Google Scholar]
  50. Bonneau, D.; Toutain, A.; Laquerriere, A.; Marret, S.; Saugier-Veber, P.; Barthez, M.A.; Radi, S.; Biran-Mucignat, V.; Rodriguez, D.; Gelot, A. X-linked lissencephaly with absent corpus callosum and ambiguous genitalia (XLAG): Clinical, magnetic resonance imaging, and neuropathological findings. Ann. Neurol. 2002, 51, 340–349. [Google Scholar] [CrossRef]
  51. Cossee, M.; Faivre, L.; Philippe, C.; Hichri, H.; de Saint-Martin, A.; Laugel, V.; Bahi-Buisson, N.; Lemaitre, J.F.; Leheup, B.; Delobel, B.; et al. ARX polyalanine expansions are highly implicated in familial cases of mental retardation with infantile epilepsy and/or hand dystonia. Am. J. Med. Genet. A 2011, 155a, 98–105. [Google Scholar] [CrossRef] [PubMed]
  52. Olivetti, P.R.; Noebels, J.L. Interneuron, interrupted: Molecular pathogenesis of ARX mutations and X-linked infantile spasms. Curr. Opin. Neurobiol. 2012, 22, 859–865. [Google Scholar] [CrossRef] [PubMed]
  53. Stalpers, X.L.; Spruijt, L.; Yntema, H.G.; Verrips, A. Clinical phenotype of 5 females with a CDKL5 mutation. J. Child Neurol. 2012, 27, 90–93. [Google Scholar] [CrossRef] [PubMed]
  54. Nemos, C.; Lambert, L.; Giuliano, F.; Doray, B.; Roubertie, A.; Goldenberg, A.; Delobel, B.; Layet, V.; N’Guyen, M.A.; Saunier, A.; et al. Mutational spectrum of CDKL5 in early-onset encephalopathies: A study of a large collection of French patients and review of the literature. Clin. Genet. 2009, 76, 357–371. [Google Scholar] [CrossRef]
  55. Liang, J.S.; Shimojima, K.; Takayama, R.; Natsume, J.; Shichiji, M.; Hirasawa, K.; Imai, K.; Okanishi, T.; Mizuno, S.; Okumura, A.; et al. CDKL5 alterations lead to early epileptic encephalopathy in both genders. Epilepsia 2011, 52, 1835–1842. [Google Scholar] [CrossRef]
  56. Saitsu, H.; Osaka, H.; Nishiyama, K.; Tsurusaki, Y.; Doi, H.; Miyake, N.; Matsumoto, N. A girl with early-onset epileptic encephalopathy associated with microdeletion involving CDKL5. Brain Dev. 2012, 34, 364–367. [Google Scholar] [CrossRef]
  57. Kilstrup-Nielsen, C.; Rusconi, L.; La Montanara, P.; Ciceri, D.; Bergo, A.; Bedogni, F.; Landsberger, N. What we know and would like to know about CDKL5 and its involvement in epileptic encephalopathy. Neural Plast. 2012, 2012, 728267. [Google Scholar] [CrossRef]
  58. Stouffer, M.A.; Golden, J.A.; Francis, F. Neuronal migration disorders: Focus on the cytoskeleton and epilepsy. Neurobiol. Dis. 2016, 92, 18–45. [Google Scholar] [CrossRef]
  59. Srivastava, S.; Cohen, J.; Pevsner, J.; Aradhya, S.; McKnight, D.; Butler, E.; Johnston, M.; Fatemi, A. A novel variant in GABRB2 associated with intellectual disability and epilepsy. Am. J. Med. Genet. A 2014, 164a, 2914–2921. [Google Scholar] [CrossRef]
  60. Urak, L.; Feucht, M.; Fathi, N.; Hornik, K.; Fuchs, K. A GABRB3 promoter haplotype associated with childhood absence epilepsy impairs transcriptional activity. Hum. Mol. Genet. 2006, 15, 2533–2541. [Google Scholar] [CrossRef] [Green Version]
  61. Macdonald, R.L.; Kang, J.Q.; Gallagher, M.J. Mutations in GABAA receptor subunits associated with genetic epilepsies. J. Physiol. 2010, 588, 1861–1869. [Google Scholar] [CrossRef] [PubMed]
  62. Doty, C.N. SCN9A: Another sodium channel excited to play a role in human epilepsies. Clin. Genet. 2010, 77, 326–328. [Google Scholar] [CrossRef] [PubMed]
  63. Meisler, M.H.; O’Brien, J.E.; Sharkey, L.M. Sodium channel gene family: Epilepsy mutations, gene interactions and modifier effects. J. Physiol. 2010, 588, 1841–1848. [Google Scholar] [CrossRef] [PubMed]
  64. Singh, N.A.; Pappas, C.; Dahle, E.J.; Claes, L.R.; Pruess, T.H.; De Jonghe, P.; Thompson, J.; Dixon, M.; Gurnett, C.; Peiffer, A.; et al. A role of SCN9A in human epilepsies, as a cause of febrile seizures and as a potential modifier of Dravet syndrome. PLoS Genet. 2009, 5, e1000649. [Google Scholar] [CrossRef] [PubMed]
  65. Heron, S.E.; Hernandez, M.; Edwards, C.; Edkins, E.; Jansen, F.E.; Scheffer, I.E.; Berkovic, S.F.; Mulley, J.C. Neonatal seizures and long QT syndrome: A cardiocerebral channelopathy? Epilepsia 2010, 51, 293–296. [Google Scholar] [CrossRef] [PubMed]
  66. Vidal, M.; Morris, R.; Grosveld, F.; Spanopoulou, E. Tissue-specific control elements of the Thy-1 gene. EMBO J. 1990, 9, 833–840. [Google Scholar] [CrossRef]
  67. Caroni, P. Overexpression of growth-associated proteins in the neurons of adult transgenic mice. J. Neurosci. Methods 1997, 71, 3–9. [Google Scholar] [CrossRef]
  68. Murphy, D.; Carter, D.A. An overview of transgenic mouse production. Methods Mol. Biol. 1993, 18, 111–114. [Google Scholar]
  69. Ting, J.T.; Lee, B.R.; Chong, P.; Soler-Llavina, G.; Cobbs, C.; Koch, C.; Zeng, H.; Lein, E. Preparation of Acute Brain Slices Using an Optimized N-Methyl-D-glucamine Protective Recovery Method. J. Vis. Exp. 2018. [Google Scholar] [CrossRef]
  70. Tarazona, S.; Furio-Tari, P.; Turra, D.; Pietro, A.D.; Nueda, M.J.; Ferrer, A.; Conesa, A. Data quality aware analysis of differential expression in RNA-seq with NOISeq R/Bioc package. Nucleic Acids Res. 2015, 43, e140. [Google Scholar] [CrossRef]
  71. Yu, G.; Wang, L.G.; Han, Y.; He, Q.Y. clusterProfiler: An R package, for comparing biological themes among gene clusters. Omics 2012, 16, 284–287. [Google Scholar] [CrossRef] [PubMed]
  72. Edgar, R.; Domrachev, M.; Lash, A.E. Gene Expression Omnibus: NCBI gene expression and hybridization array data repository. Nucleic Acids Res. 2002, 30, 207–210. [Google Scholar] [CrossRef] [PubMed] [Green Version]
Figure 1. Changes in Ca2+ responses in the hippocampal neurons overexpressing ORAI1 calcium channel (AD) or stromal interaction molecule 2 (STIM2) (EG) compared with wild-type neurons. Ca2+ measurements were performed using Fura-2 acetomethyl ester (Fura-2 AM) indicator that was loaded into the CA1 pyramidal neurons of the hippocampal acute brain slices (H). Typically, ~20 pyramidal neurons per one slice (n) were analyzed; the slices were isolated from at least 5 animals per genetic variant. The total number of slices analyzed per each genetic variant was 9. (A,E) Averaged time-course of background-subtracted fluorescence signal (expressed as F340/F380) from slices overexpressing ORAI1 and STIM2, respectively. (B,F) Quantification of signal amplitudes observed following glutamate, cyclopiazonic acid (CPA), and Ca2+ (re)addition in ORAI1 and STIM2 overexpressing neurons, respectively, arbitrary units (a.u.). (C,G) Quantification of F340/F380 values at baseline (average of 0–5th min of the measurement) and following application of ethylene glycol-bis(β-aminoethyl ether)-N,N,N′,N′-tetraacetic acid (EGTA) (at 13th and 25th min of the measurement) in ORAI1 and STIM2 overexpressing neurons, respectively, a.u. (D) Time-course of signal decay following glutamate application in ORAI1 and wild-type neurons that was fit by a logarithmic function. Student’s t-test was used to check statistical significance of the observed differences; p-values are displayed above the respective charts.
Ijms 20 05539 g001
Figure 2. RNA sequencing (RNAseq) analysis using Noiseq tools based on data gathered from hippocampi of wild-type and FVB/NJ-Tg(ORAI1)Ibd females. (A) Dot plot of Gene Ontology Biological Process groups (GO BP), which are down-regulated and up-regulated in transgenic line (on the left and right, respectively). (B) Volcano plot represents differential gene expression between the tested variants. (C) Principal component analysis (PCA) of principal component 1 (PC1) and 2 (PC2). Transgenic and wild-type mice are color-coded in green and red, respectively. PCA analysis was carried out from FPKM (Fragments Per Kilobase Million) normalized RNAseq data using prcomp function in R software.
Ijms 20 05539 g002
Figure 3. Expression profile of selected genes in hippocampi of the tested mouse variants. (A) Rea-time PCR analysis of the selected genes that was based on RNAseq data. The results are presented as scatter plot, each circle corresponds to one animal. Black circle corresponds to each tested wild-type probe, whereas green corresponds to transgenic ones. The obtained results suggest a down-regulation of expression of Arx, Cdkl5, and Dclk1. The data are presented as a fold change (2−∆∆Ct) normalized to the three reference genes (Uba-2, Gapdh, Actin). The statistics was estimated by CFX software (Bio-Rad) using the post hoc method (Tukey’s test). (B) The ddPCR analysis of Arx, Cdkl5, Dclk1 using customized assays (Bio-Rad). The number of transcript copies of the selected genes are presented in relation to 1000 copies of the reference gene Uba-2. The results are presented as dot plot, where each sign corresponds to an individual animal (3 wild-type, 6 transgenic). The statistics were calculated by GraphPad Prism software using unpaired t-test. The number of Arx transcripts was about 30 times lower than that of Cdkl5 and Dclk1, therefore, it is presented on a separate chart.
Ijms 20 05539 g003
Figure 4. Expression profile of the selected genes in the hippocampi of the tested mouse variants that was obtained by real-time PCR analysis. The results are presented as scatter plot; each circle corresponds to one animal. The obtained results suggest an up-regulation of the expression of Hes-5 and Strap. The data are presented as a fold change (2−∆∆Ct) that was normalized to the reference gene (Uba-2), the statistics was estimated by CFX software (Bio-Rad) using post hoc method (Tukey’s test).
Ijms 20 05539 g004
Table 1. A list of selected genes that were chosen for validation using customized arrays. Arx, Dclk1, Cdkl5 and were subsequently taken to ddPCR analysis (framed in green).
Bio-Rad AssaysqPCR
Gene NameENSEMBL IDDescriptionCat. No.2−∆∆Ctp-Value Tukey
Genes associated with epilepsyKcne2ENSMUSG00000039672potassium voltage-gated channel, Isk-related subfamily, gene 2qMmuCID00110270.4870.670
ArxENSMUSG00000035277aristaless related homeoboxqMmuCED00048310.7870.046
Dclk1ENSMUSG00000027797serine/threonine-protein kinase DCLK1qMmuCID00222220.8270.015
Cdkl5ENSMUSG00000031292cyclin-dependent kinase-like 5qMmuCID00133810.8680.064
Gabrb2ENSMUSG00000007653gamma-aminobutyric acid (GABA) A receptor, subunit beta 2qMmuCID00053340.8860.224
Scn9aENSMUSG00000075316sodium channel protein type 9 subunit alphaqMmuCID00153541.2830.131
Folr1ENSMUSG00000001827folate receptor 1qMmuCID00163300.52620.688
Clic6ENSMUSG00000022949chloride intracellular channel 6qMmuCID00110990.6150.678
KlENSMUSG00000058488klotho, the Klotho peptide generated by cleavage of the membrane-bound isoform may be an anti-aging circulating hormoneqMmuCID00071540.6630.648
Trpm3ENSMUSG00000052387transient receptor potential cation channel, subfamily M, member 3qMmuCID00401630.80.747
Fam26eENSMUSG00000049872calcium homeostasis modulator protein 5qMmuCID00080590.8820.213
Cul4bENSMUSG00000031095cullin 4B, Core component of multiple cullin-RING-based E3 ubiquitin-protein ligase complexesqMmuCID00114780.8840.667
Mmp14ENSMUSG00000000957matrix metallopeptidase 14 (membrane-inserted)qMmuCID00061200.8890.473
Ston2ENSMUSG00000020961stonin 2, adapter protein involved in endocytic machineryqMmuCID00146040.9360.462
Shisa9ENSMUSG00000022494regulator of short-term neuronal synaptic plasticity in the dentate gyrusqMmuCID00226630.9400.523
Akap9ENSMUSG00000040407A-kinase anchor protein 9, scaffolding proteinqMmuCID00234600.9580.542
EnahENSMUSG00000022995ENAH actin regulator; actin-associated proteins involved in a range of processes dependent on cytoskeleton remodeling and cell polarity such as axon guidanceqMmuCID00265810.9850.593
Nrp2ENSMUSG00000025969Neuropilin-2, High affinity receptor for semaphorinsqMmuCID00057431.0210.835
Mdm2ENSMUSG00000020184E3 ubiquitin-protein ligaseqMmuCID00253201.0440.676
Prex2ENSMUSG00000048960phosphatidylinositol-3,4,5-trisphosphate-dependent Rac exchange factor 2qMmuCID00398991.0700.187
Table 2. List of selected genes together with primers sequence whose expression profile was analyzed using real-time PCR. Up-regulation of hairy and enhancer of split-5 (Hes-5), a transcriptional repressor, was detected in the hippocampus of Tg(ORA1)Ibd line (highlighted in green).
Primer sequenceqPCR
Gene NameENSEMBL IDDescriptionForwardRevers2−∆∆Ctp-Value Tukey
Ddb1ENSMUSG00000024740damage specific DNA binding protein 1TCAAAGAGGTGGGAATGTACGGATGTCAATGCTTTCGCCAC0.1470.351
Vdac2ENSMUSG00000021771voltage-dependent anion channel 2TGGAACACCGATAACACTCTGCACTCCCTCTTGTAAGCAGAC0.180.317
Cul1ENSMUSG00000029686cullin 1ACCGATTCTCCAGCAAAGTGTCTCCATGTCACCAATGCAAG0.2040.400
Nol3ENSMUSG00000014776nucleolar protein 3 (apoptosis repressor with CARD domain)TCCAAGAAGAGGATGAATCTGAAGATTTGGCAGTAGGTGTCTCG0.2980.255
Itmbl2ENSMUSG00000022108integral membrane protein 2BTTTGAGGAAGACGCAGTGGTGTTCAGAGGAATCACGTAG0.3960.272
ClnxENSMUSG00000020368calnexinCTTTGCCAGTGTTCCTTGTGCTTCCTCTTCATCCCTCTTGTTC0.4950.534
Sv2aENSMUSG00000038486synaptic vesicle glycoprotein 2 aGTGGACACTCTACTTCGTGCATGCCCAGGTACACAATGAG0.5020.395
Gpr17ENSMUSG00000052229G protein-coupled receptor 17TCTCCTGTCCTTTCCTTCCTTCTCTTGTCCGCATTGCTC0.5870.117
ArcENSMUSG00000022602activity regulated cytoskeletal-associated proteinCTACAGAGCCAGGAGAATGACGTGTCTTGGAACCCATGTAGG0.7520.668
Rab5ENSMUSG00000000711Rab5B. member RAS oncogene familyAGGGAACAAAGCTGACCTTGTGCCAGGAAGAGATCATTCAC0.8200.505
AtxnENSMUSG00000074748ataxin 7-like 3BTGTGTACCCAGCCTATACAATTCCCTGACCATCAACACCATCTAA0.9060.865
TIMP1ENSMUSG00000001131tissue inhibitor of metalloproteinase 1CTCAAAGACCTATAGTGCTGGCCAAAGTGACGGCTCTGGTAG0.9130.890
Dok3ENSMUSG00000035711docking protein 3ACTGGTGCCTTCCTGATTACGATCCTGACGAACATTCTCCG0.9610.949
StrapENSMUSG00000030224serine/threonine kinase receptor associated proteinCCAGGGAGATACAGGAGACTAGACCGCATCCCATACTTTG1.5680.186
Hes-5ENSMUSG00000048001hes family bHLH transcription factor 5CTACCTGAAACACAGCAAAGCAGCTTCATCTGCGTGTCG2.9320.003
Table 3. Phenotypes of human mutations of genes which are associated with epilepsy.
Gene NameEncoded Protein FunctionPhenotype in HumanReference
Arxaristaless related homeobox gene- regulator of gene transcription important forbrain developmentEarly infantile epileptic encephalopathy (EIEE);
X-linked lissencephaly with abnormal genitalia (XLAG)
[48,49,50,51,52]
Cdkl5X-linked serine/threonine kinase cyclin-dependent kinase-like 5Early infantile epileptic encephalopathy (EIEE)[53,54,55,56,57]
Dclk1doublecortin-like kinase 1Focal seizures[58]
Gabrb2subunit of γ-aminobutyric acid type A (GABAA) receptorGeneralized epilepsy with febrile seizures plus (GEFS+); Childhood absence epilepsy (CAE); Lennox-Gastaut syndrome[59,60,61]
Scn9asodium channelDravet syndrome (DS); Familial febrile seizures (FFS); Generalized epilepsy with febrile seizures plus (GEFS+)[62,63,64]
Kcnea family of single-helix transmembrane proteins with 5 known members that modulate the function of several ion channelsFamilial neonatal seizures[65]

