Transcriptional Alterations by Ischaemic Postconditioning in a Pig Infarction Model: Impact on Microvascular Protection

 , , ,
, , ,  , , , , , ,


Abstract
1. Introduction
2. Results
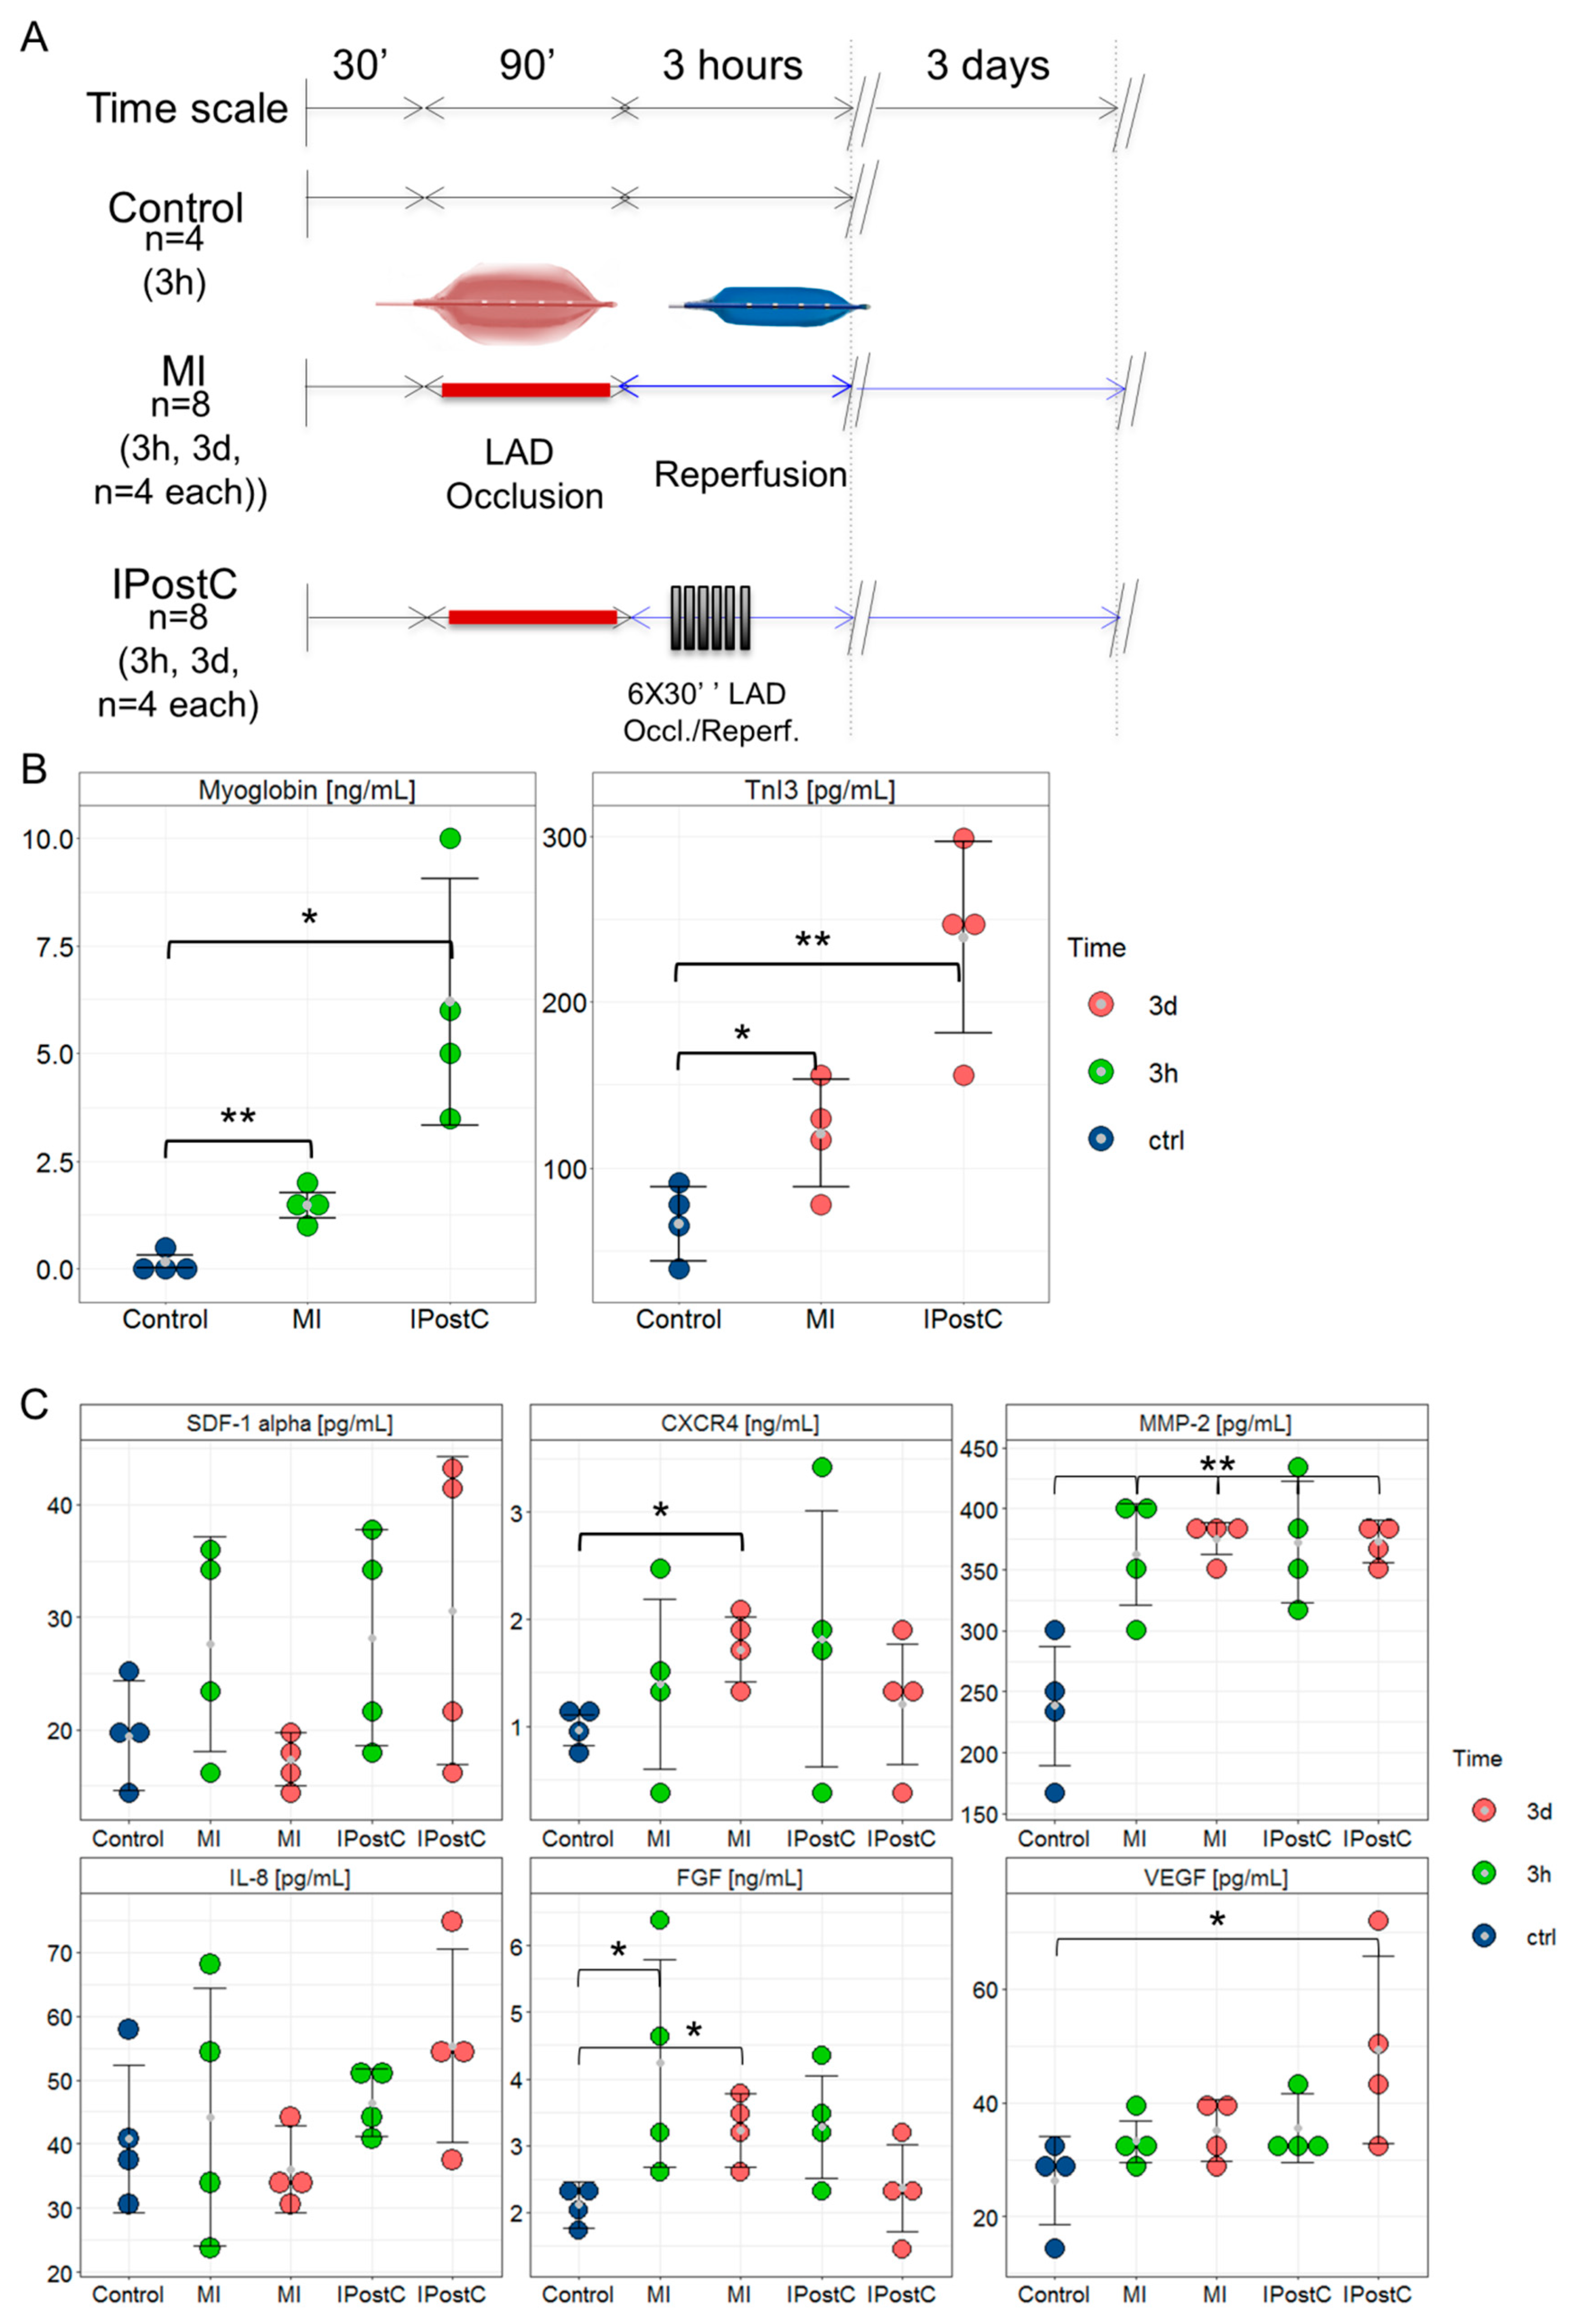
2.1. Assessment of Infarct Severity
2.2. Circulating Cardioprotective Markers
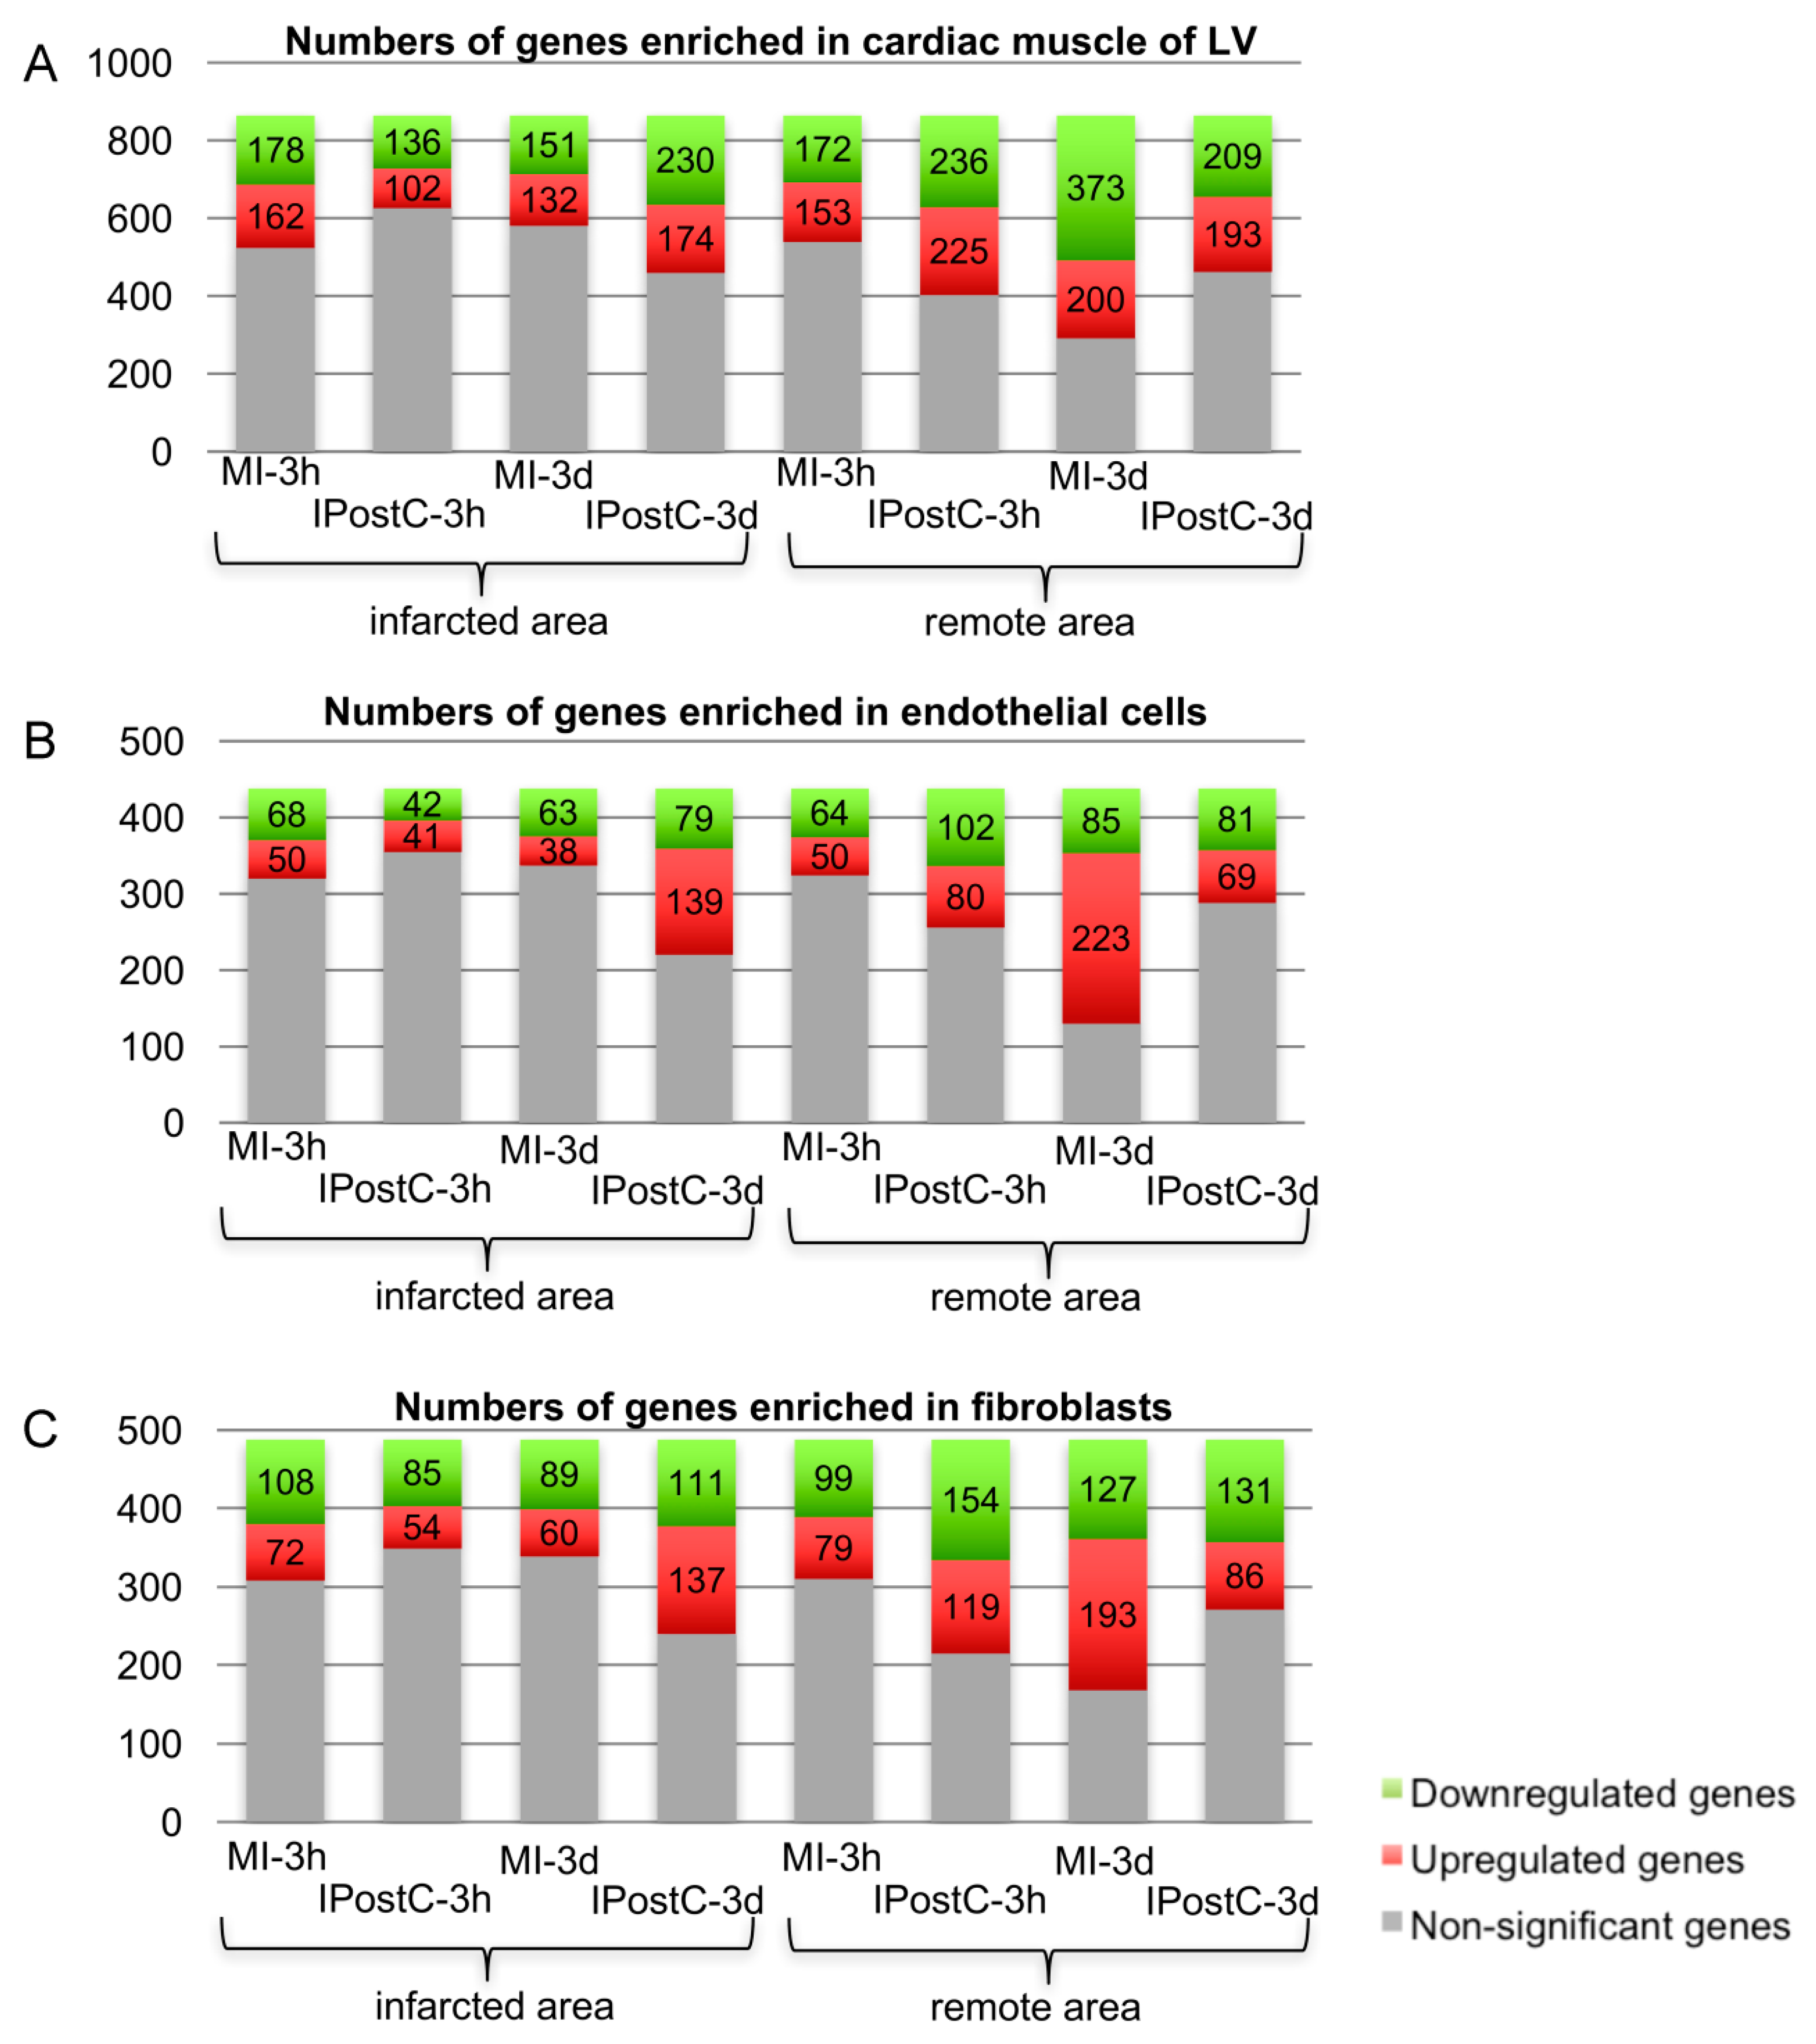
2.3. Analysis of Next Generation Sequencing Expression Data
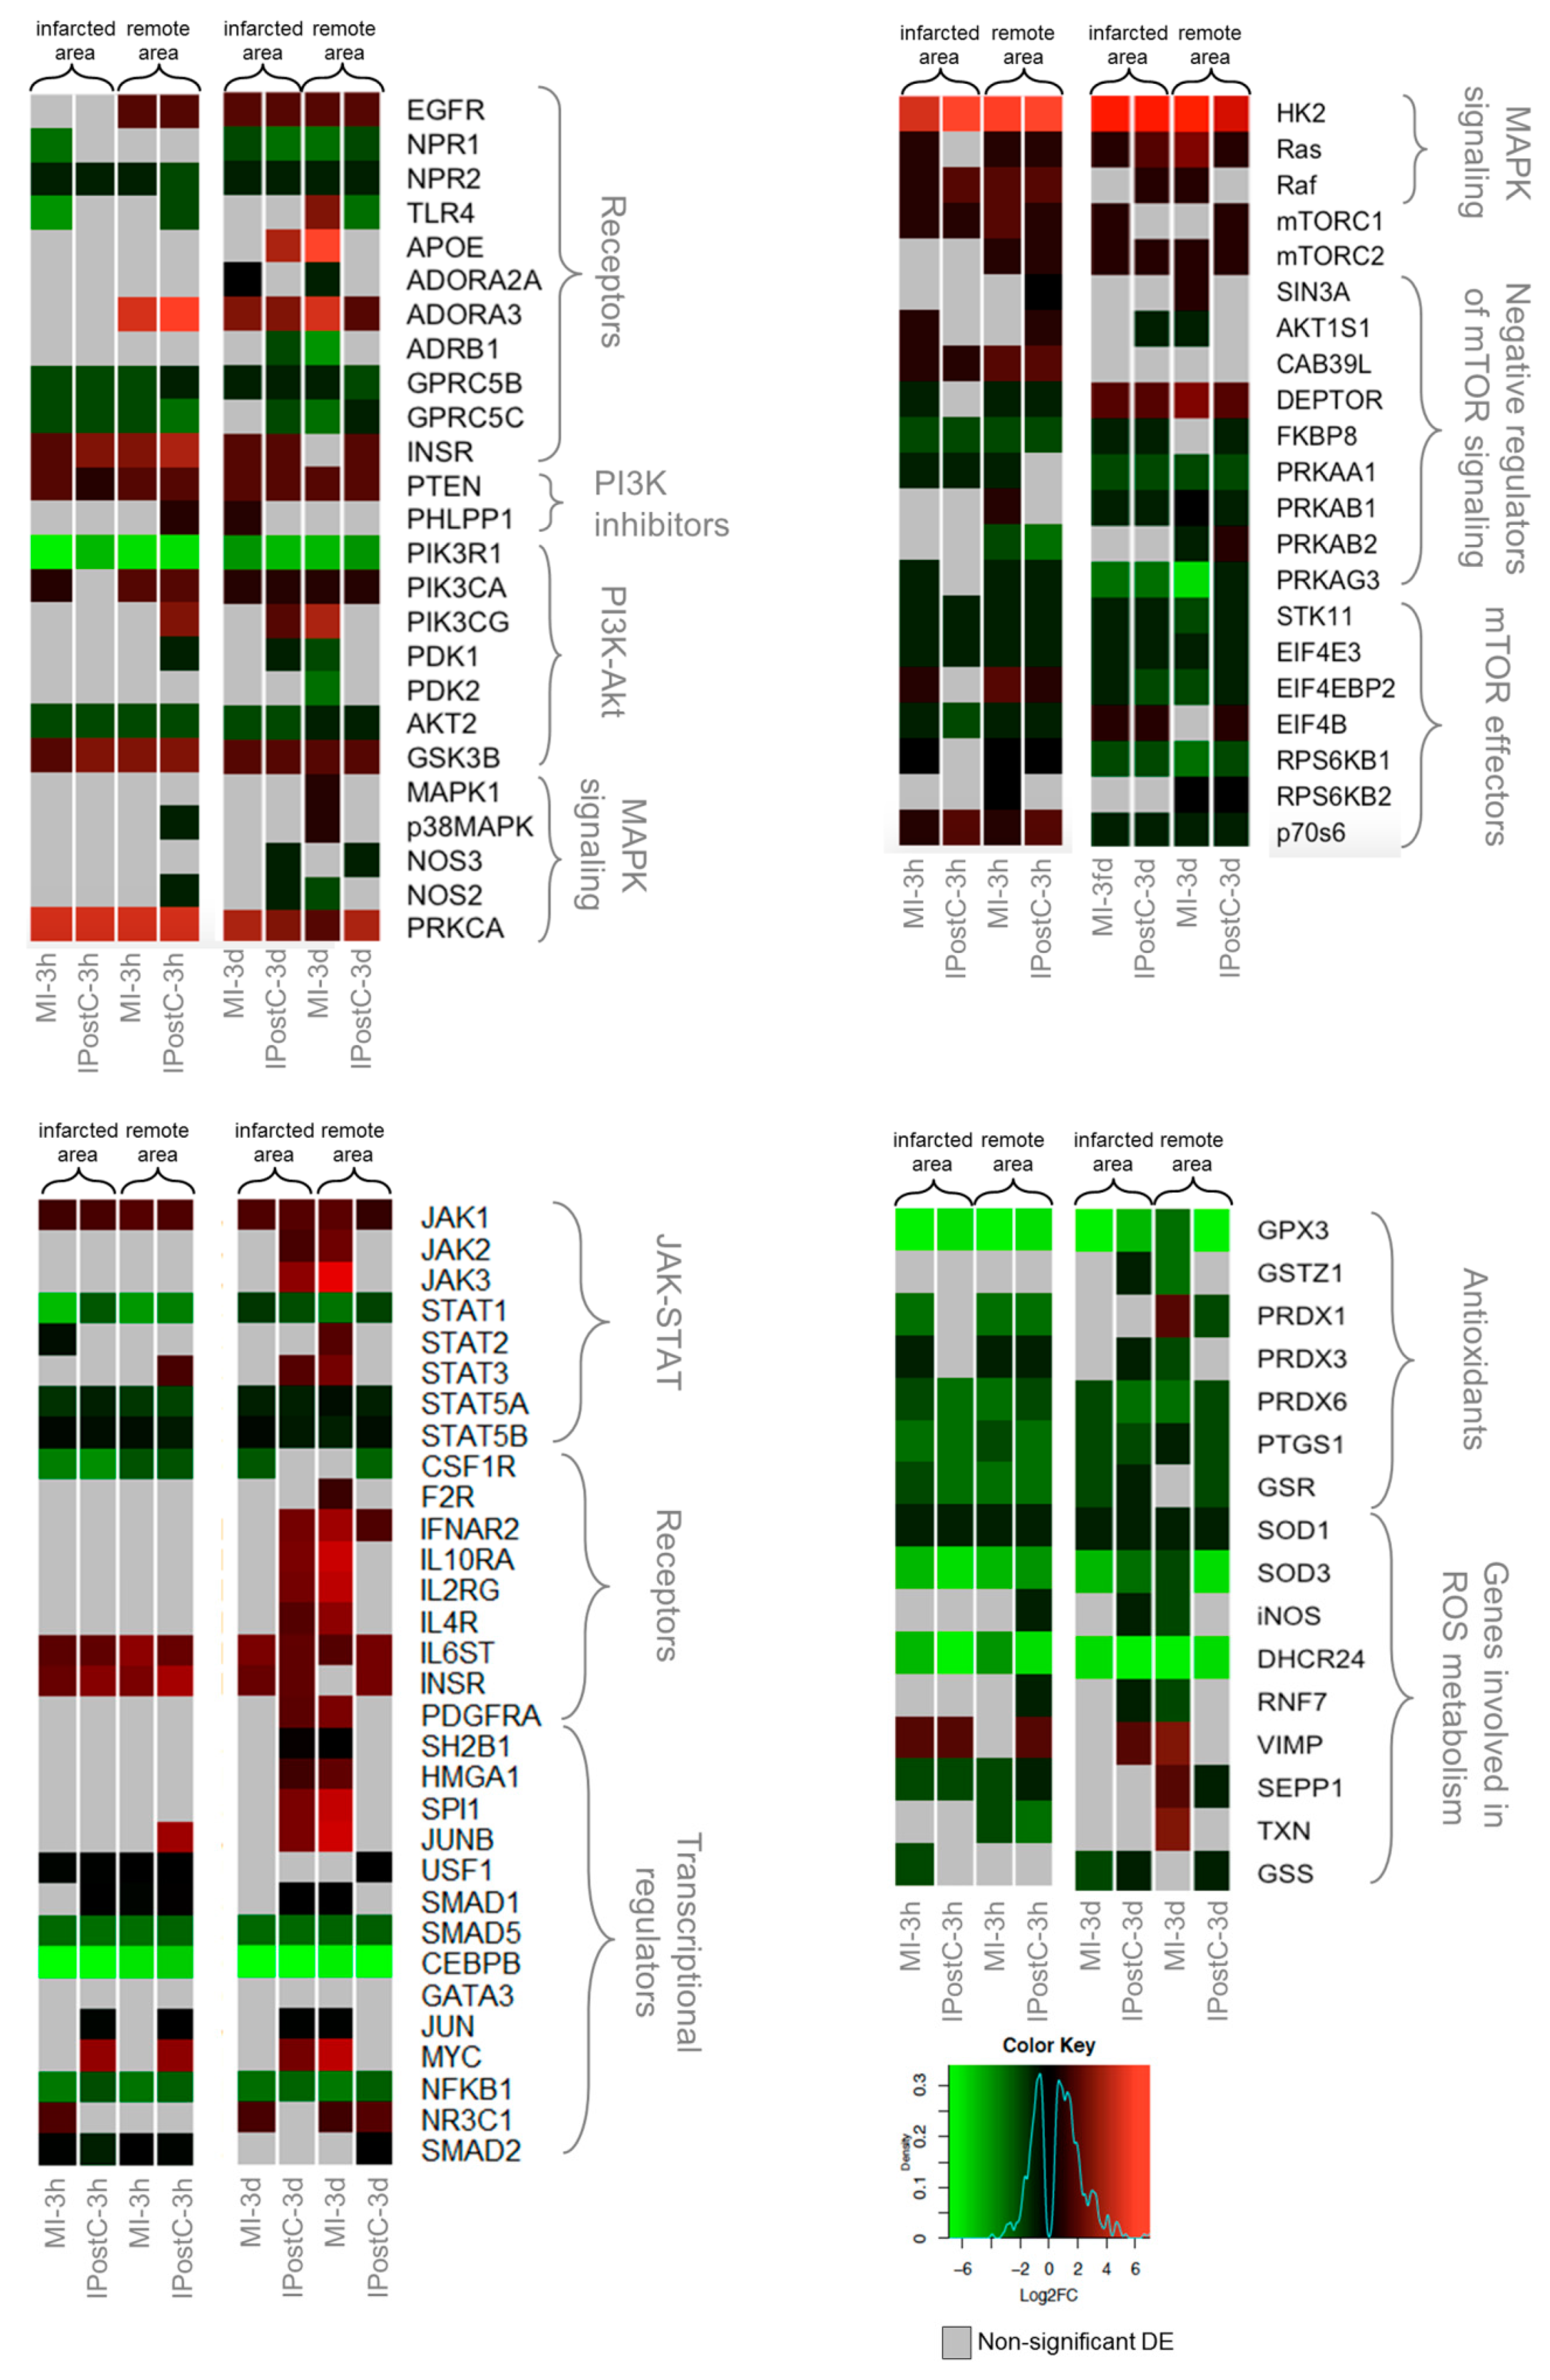
2.4. Effect of IPostC on Pro-Survival Pathways
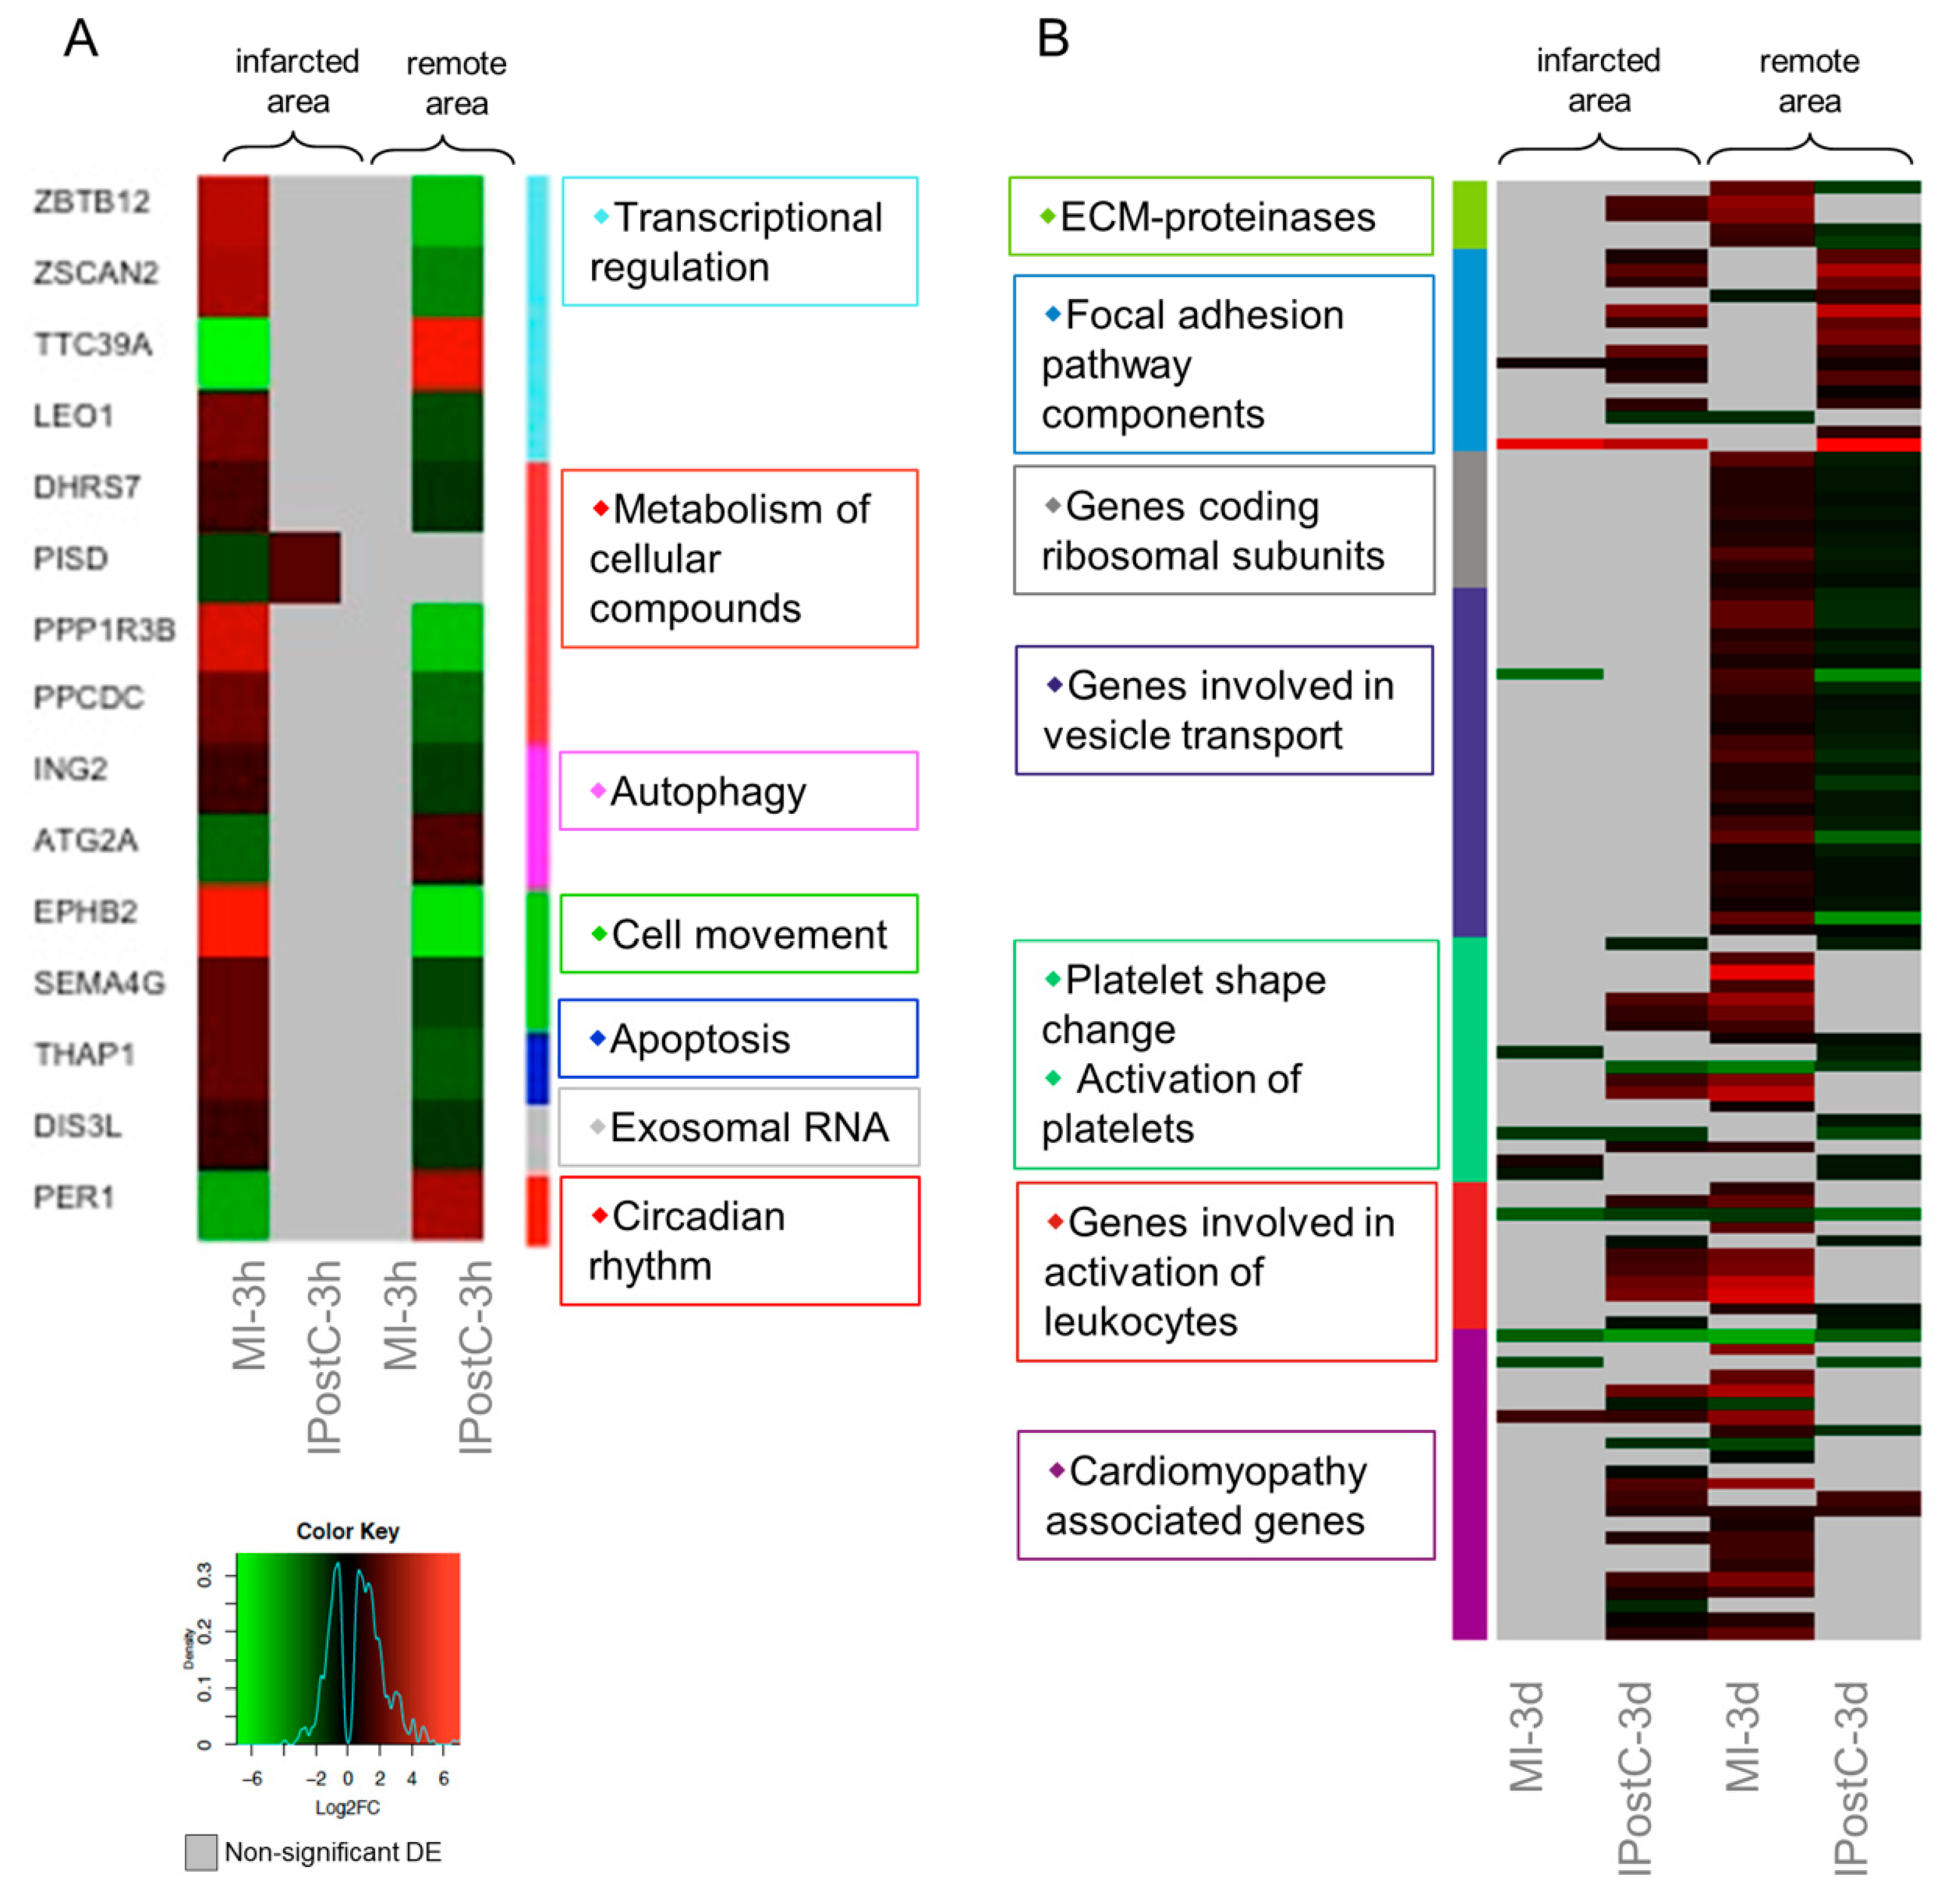
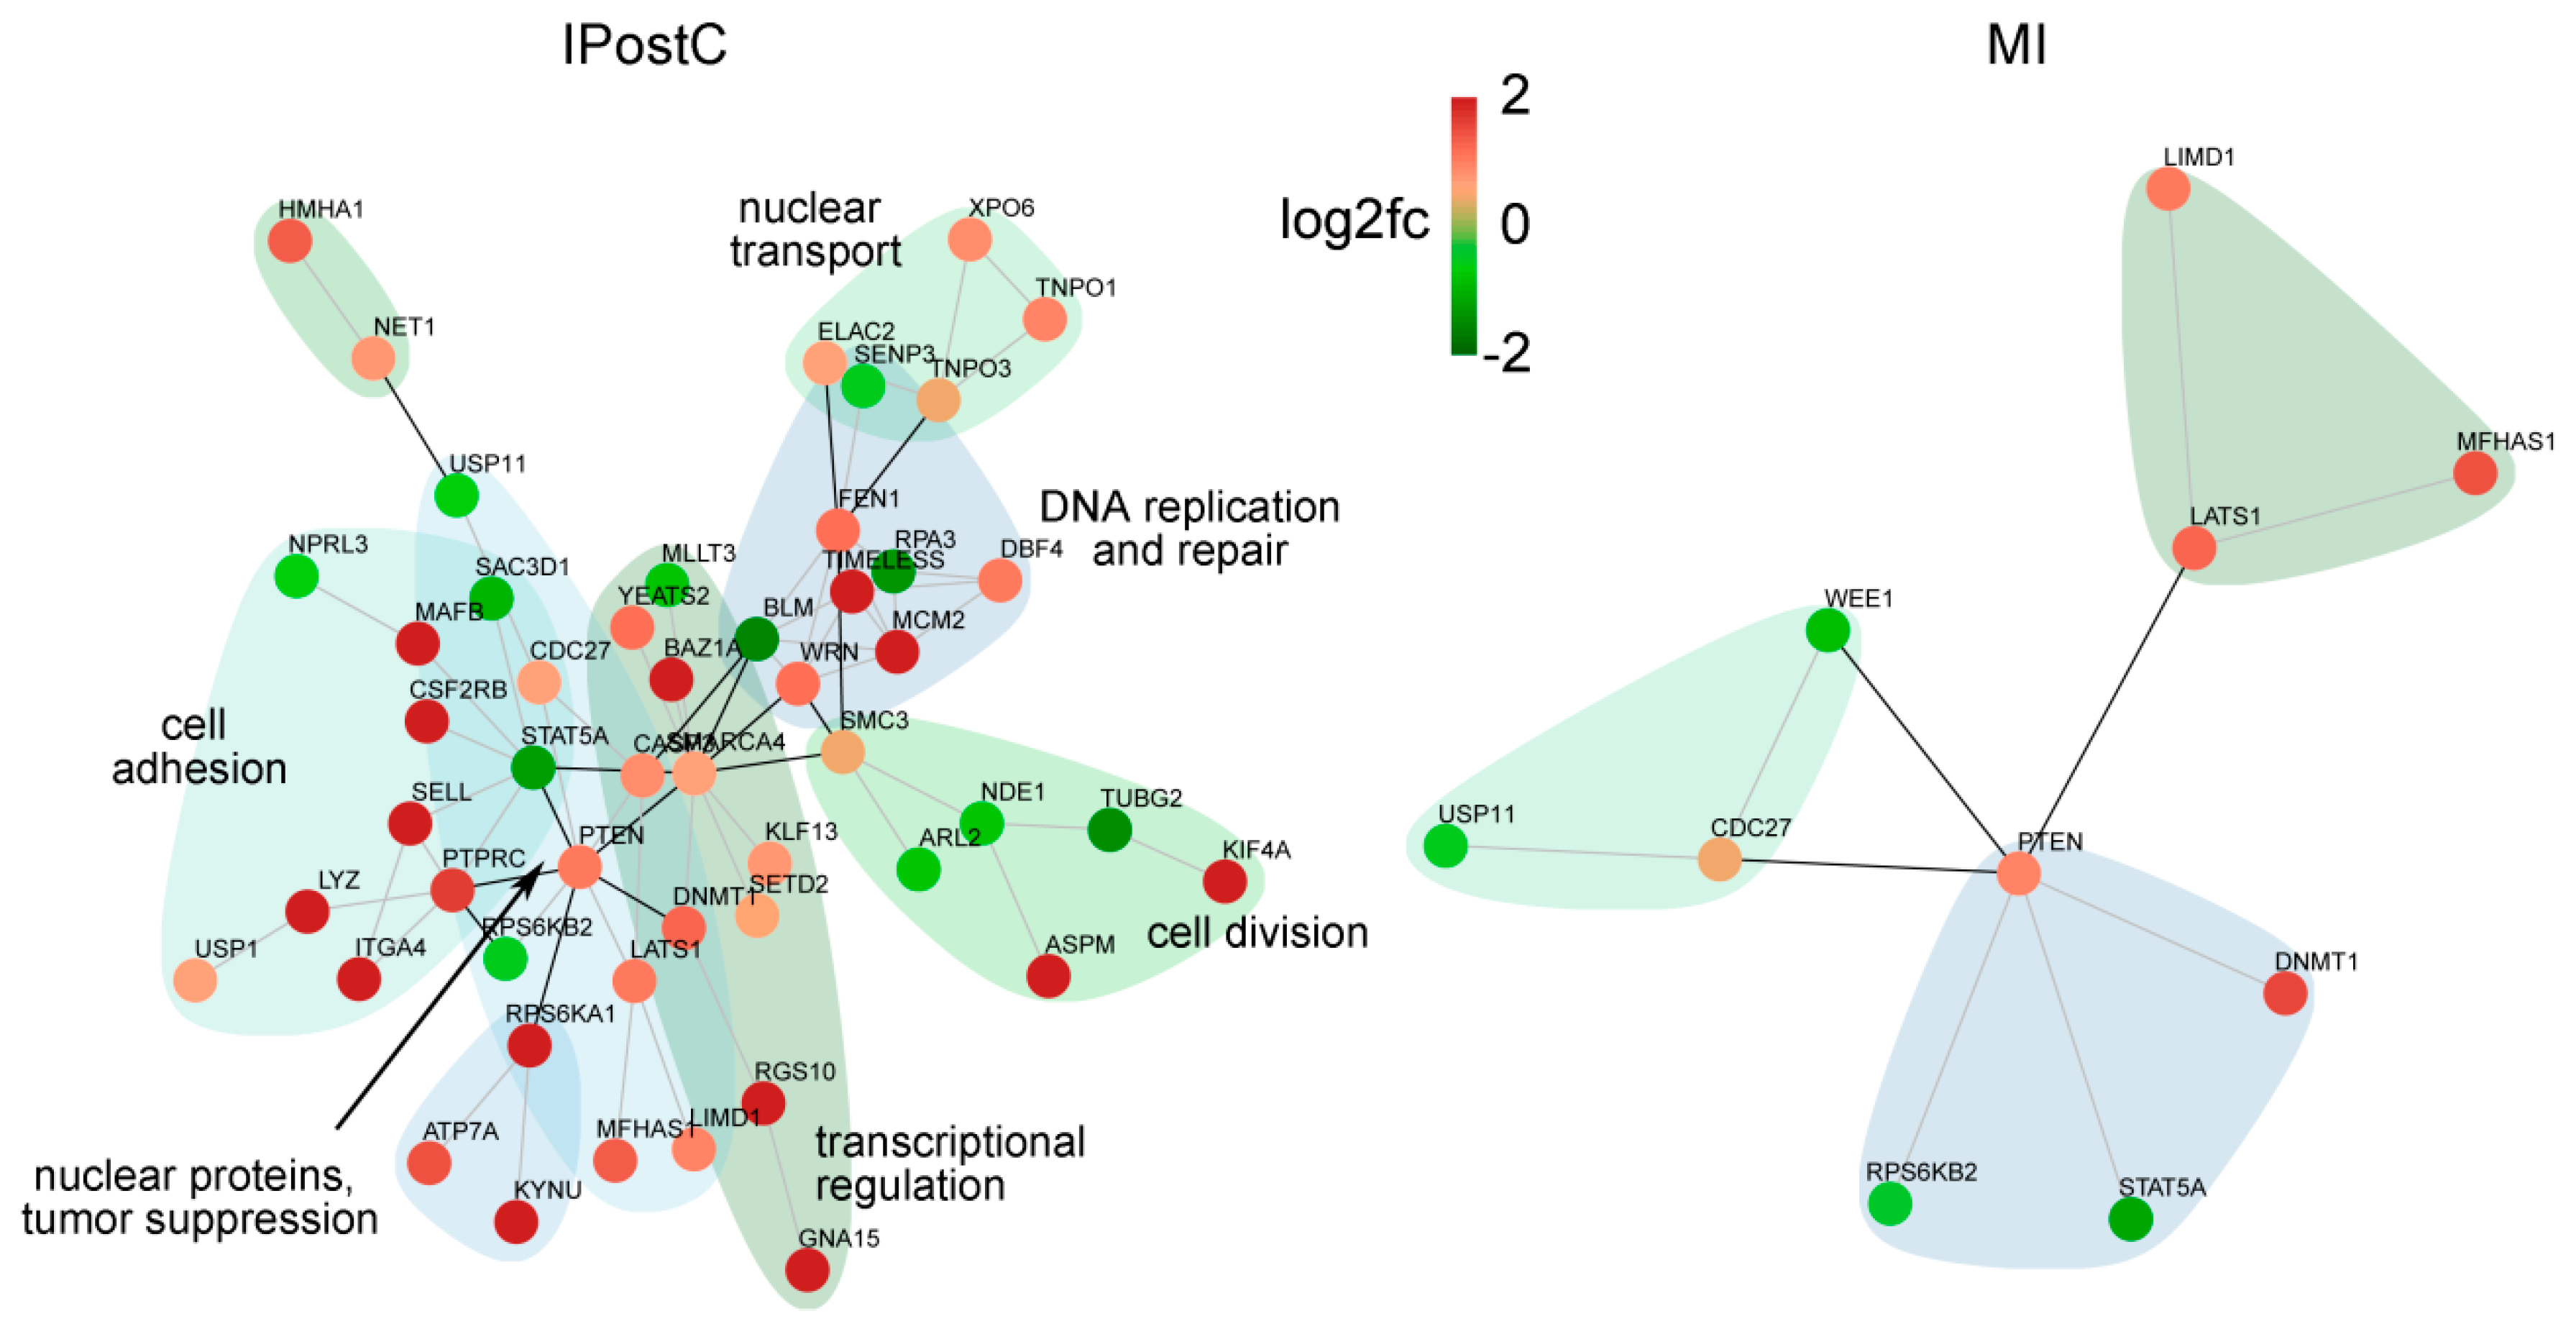
2.5. Analysis of Genes with Opposite Regulation in MI and IPostC
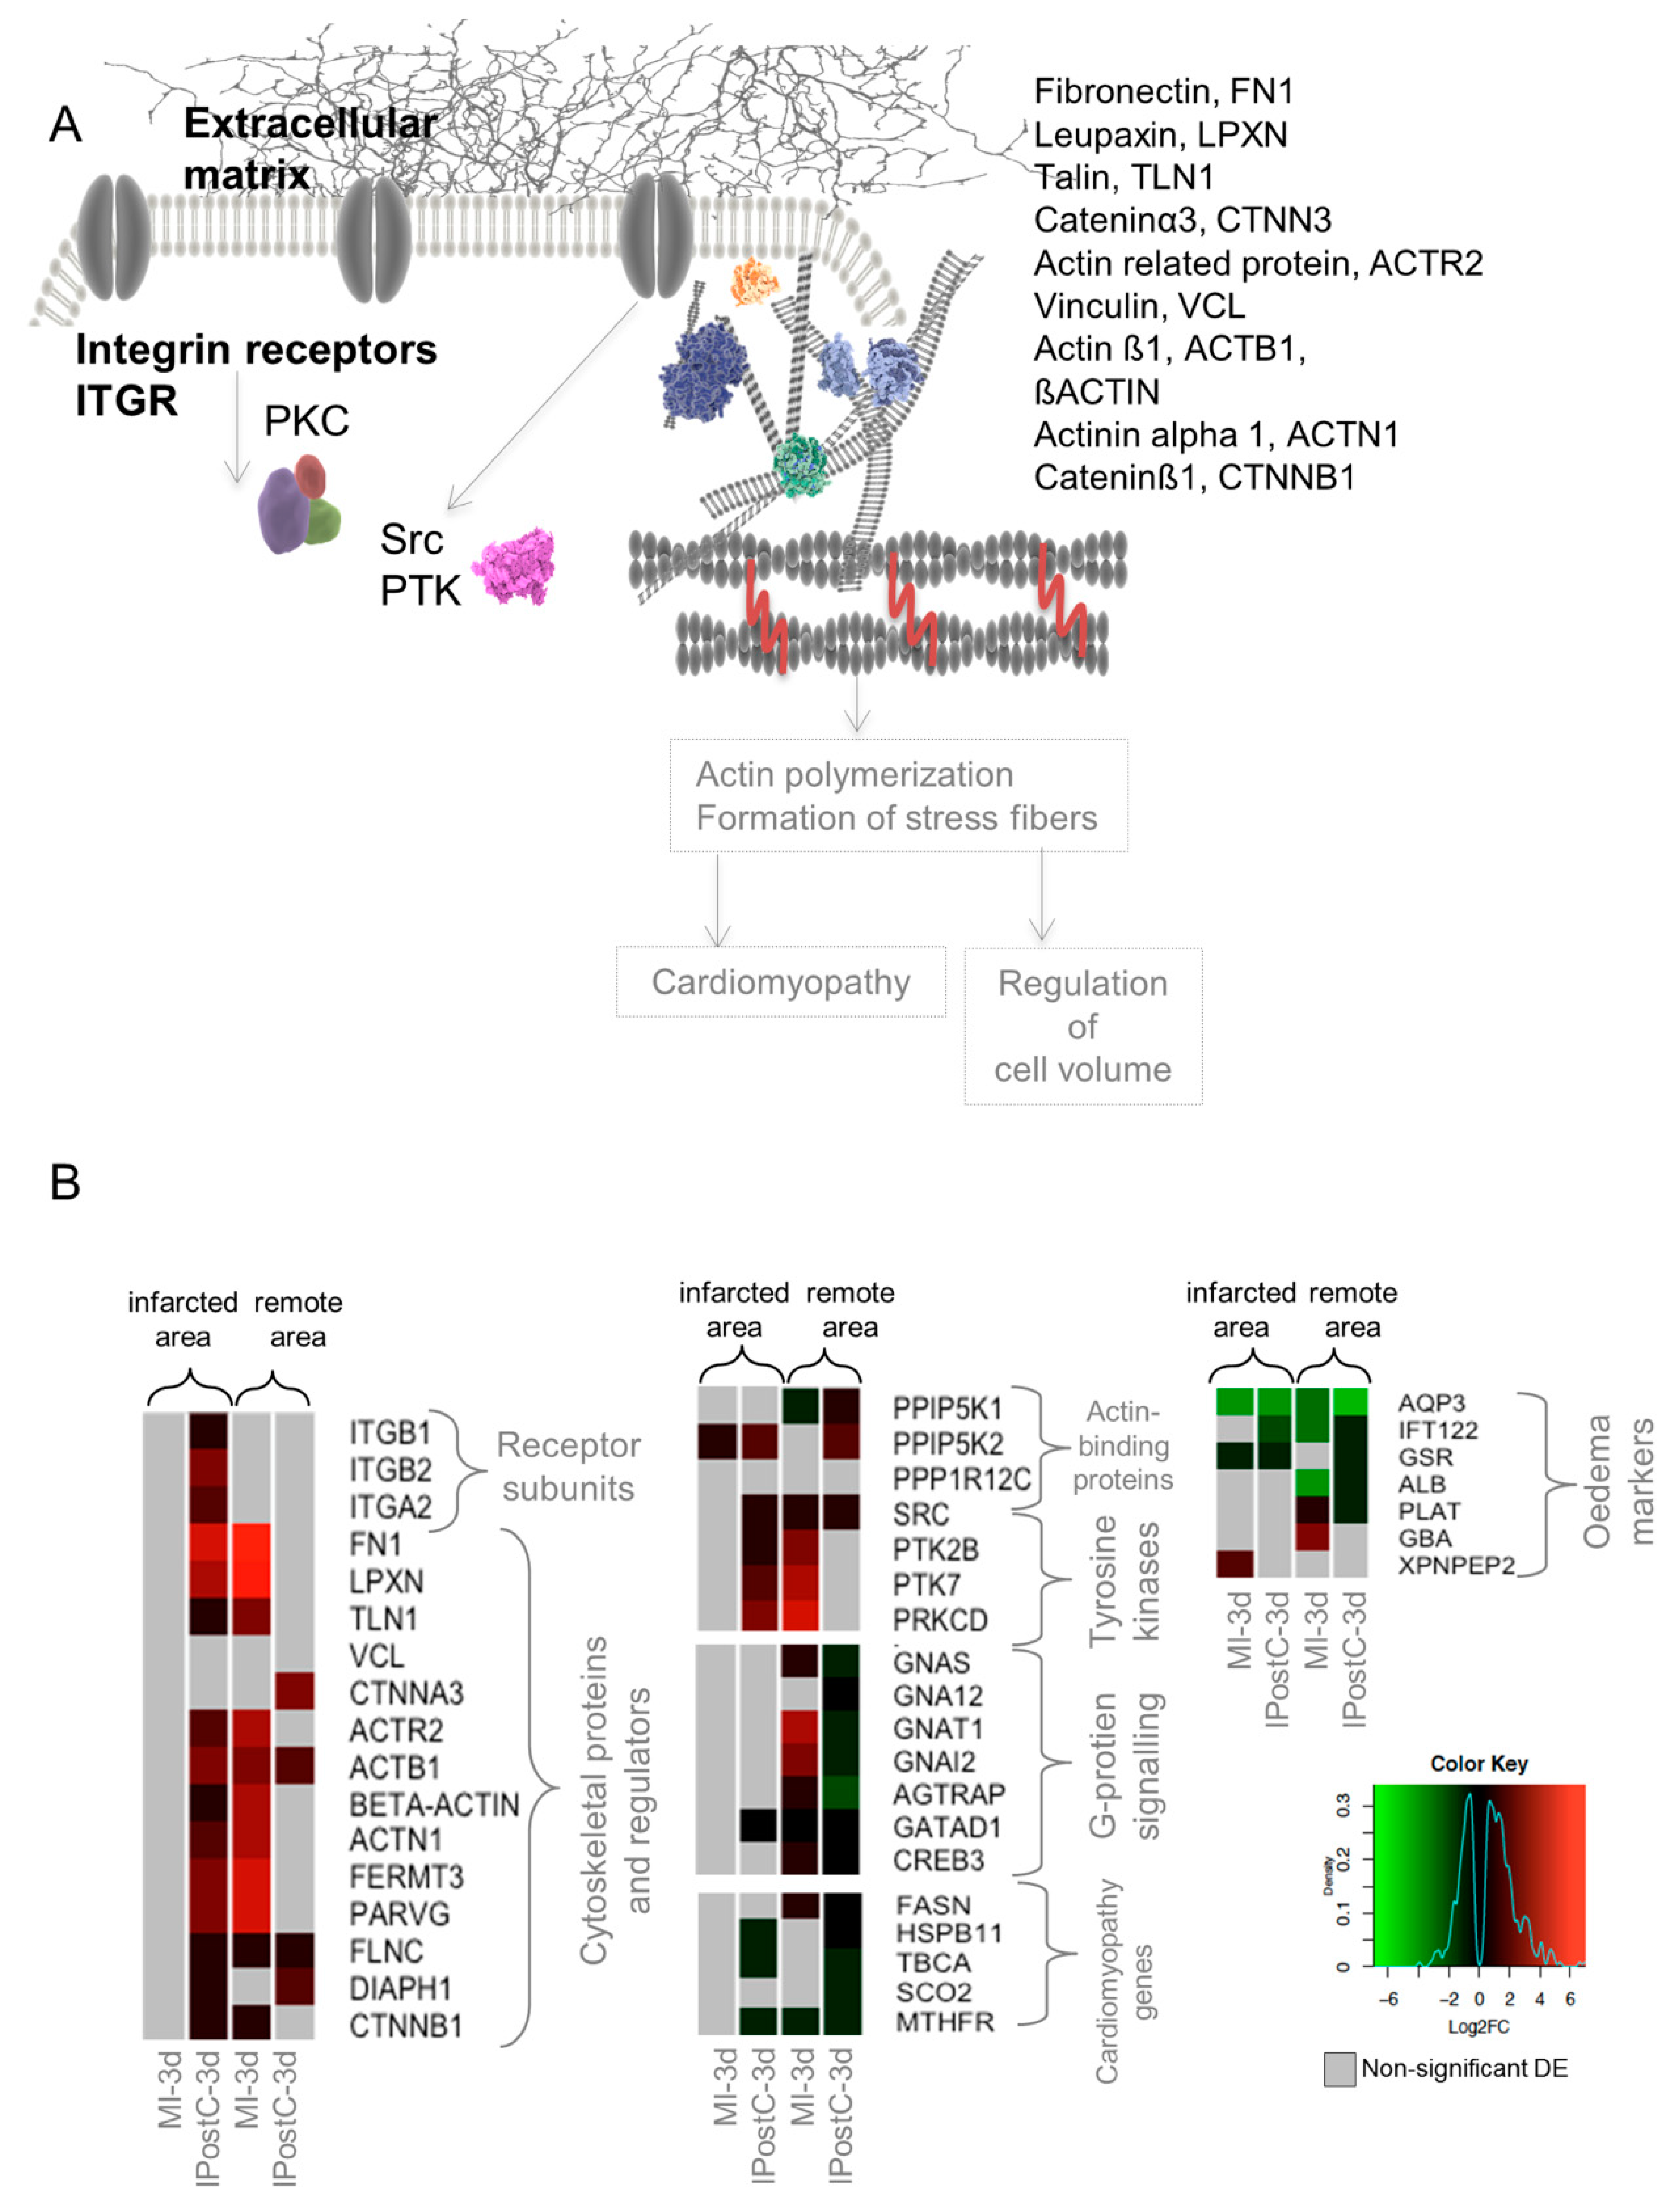
2.6. Role of Focal Adhesion Signalling, Regulation of Cell Volume, and Microvascular Protection in IPostC
2.7. qPCR Validation of Transcripts Involved in Focal Adhesion
3. Discussion
3.1. Large Animal Model of IPostC
3.2. Release of Circulating Cardioprotective Cytokines
3.3. Analogous Response of MI and IPostC to Prosurvival Pathways
3.4. Opposite Regulation of Genes Involved in MI with/without IPostC, Demonstrating the Beneficial Effect of IPostC in Microvascular Protection and Tissue Oedema
3.5. Limitations
4. Materials and Methods
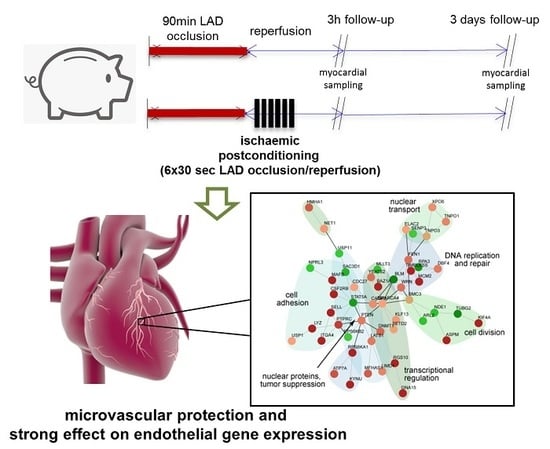
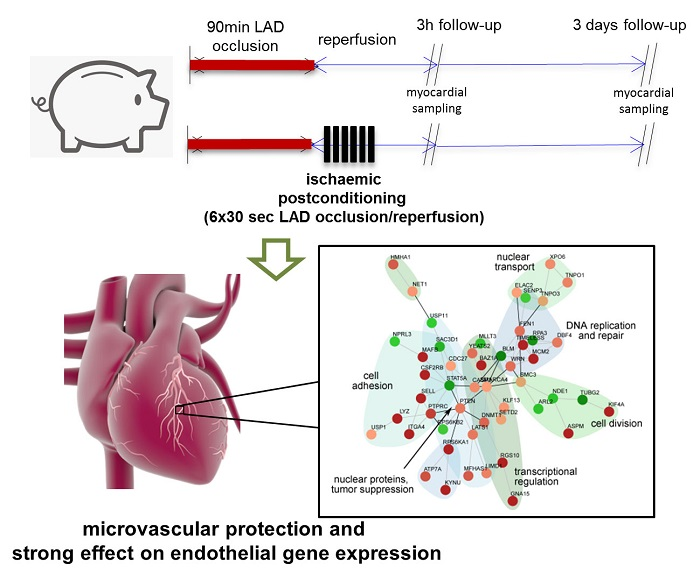
4.1. Study Design
4.2. ELISA
4.3. RNA Extraction
4.4. RNA Sequencing
4.5. Quantitative PCR (qPCR) Analysis for Validation of Pre-Selected Genes
4.6. Statistical Analysis
5. Conclusions
Supplementary Materials
Author Contributions
Funding
Conflicts of Interest
Abbreviations
| DEG | differentially expressed gene |
| ECM | extracellular matrix |
| I/R | ischaemia/reperfusion |
| IPostC | ischaemic postconditioning |
| LAD | left anterior descending artery |
| MI | myocardial infarction |
| MRI | magnetic resonance imaging |
| MVO | microvascular obstruction |
| PCA | principal component analysis |
| SPIA | signaling pathway impact analysis |
| STEMI | ST-segment elevation myocardial infarction |
| TTC | triphenyl tetrazolium chloride |
References
- Na, H.S.; Kim, Y.I.; Yoon, Y.W.; Han, H.C.; Nahm, S.H.; Hong, S.K. Ventricular premature beat-driven intermittent restoration of coronary blood flow reduces the incidence of reperfusion-induced ventricular fibrillation in a cat model of regional ischemia. Am. Heart J. 1996, 132, 78–83. [Google Scholar] [CrossRef]
- Bopassa, J.C.; Ferrera, R.; Gateau-Roesch, O.; Couture-Lepetit, E.; Ovize, M. Pi 3-kinase regulates the mitochondrial transition pore in controlled reperfusion and postconditioning. Cardiovasc. Res. 2006, 69, 178–185. [Google Scholar] [CrossRef]
- Zhang, L.; Ma, J.; Liu, H. Protective effect of ischemic postconditioning against ischemia reperfusion-induced myocardium oxidative injury in IR rats. Molecules 2012, 17, 3805–3817. [Google Scholar] [CrossRef]
- Iliodromitis, E.K.; Georgiadis, M.; Cohen, M.V.; Downey, J.M.; Bofilis, E.; Kremastinos, D.T. Protection from post-conditioning depends on the number of short ischemic insults in anesthetized pigs. Basic Res. Cardiol. 2006, 101, 502–507. [Google Scholar] [CrossRef]
- Schwartz, L.M.; Lagranha, C.J. Ischemic postconditioning during reperfusion activates AKT and ERK without protecting against lethal myocardial ischemia-reperfusion injury in pigs. Am. J. Physiol. Heart Circ. Physiol. 2006, 290, H1011–H1018. [Google Scholar] [CrossRef]
- Hahn, J.Y.; Yu, C.W.; Park, H.S.; Song, Y.B.; Kim, E.K.; Lee, H.J.; Bae, J.W.; Chung, W.Y.; Choi, S.H.; Choi, J.H.; et al. Long-term effects of ischemic postconditioning on clinical outcomes: 1-Year follow-up of the post randomized trial. Am. Heart J. 2015, 169, 639–646. [Google Scholar] [CrossRef]
- Wang, L.; Wang, J.; Xu, H.; Li, B. Postconditioning in patients treated with primary percutaneous coronary intervention: An updated meta-analysis. Catheter. Cardiovasc. Interv. 2013, 82, E662–E671. [Google Scholar] [CrossRef]
- Thuny, F.; Lairez, O.; Roubille, F.; Mewton, N.; Rioufol, G.; Sportouch, C.; Sanchez, I.; Bergerot, C.; Thibault, H.; Cung, T.T.; et al. Post-conditioning reduces infarct size and edema in patients with ST-segment elevation myocardial infarction. J. Am. Coll. Cardiol. 2012, 59, 2175–2181. [Google Scholar] [CrossRef]
- Engstrøm, T.; Kelbæk, H.; Helqvist, S.; Høfsten, D.E.; Kløvgaard, L.; Clemmensen, P.; Holmvang, L.; Jørgensen, E.; Pedersen, F.; Saunamaki, K.; et al. Effect of ischemic postconditioning during primary percutaneous coronary intervention for patients with ST-segment elevation myocardial infarction: A randomized clinical trial. JAMA Cardiol. 2017, 2, 490–497. [Google Scholar] [CrossRef]
- Hausenloy, D.J.; Garcia-Dorado, D.; Bøtker, H.E.; Davidson, S.M.; Downey, J.; Engel, F.B.; Jennings, R.; Lecour, S.; Leor, J.; Madonna, R.; et al. Novel targets and future strategies for acute cardioprotection: Position paper of the european society of cardiology working group on cellular biology of the heart. Cardiovasc. Res. 2017, 113, 564–585. [Google Scholar] [CrossRef]
- Baranyai, T.; Giricz, Z.; Varga, Z.V.; Koncsos, G.; Lukovic, D.; Makkos, A.; Sarkozy, M.; Pavo, N.; Jakab, A.; Czimbalmos, C.; et al. In vivo MRI and ex vivo histological assessment of the cardioprotection induced by ischemic preconditioning, postconditioning and remote conditioning in a closed-chest porcine model of reperfused acute myocardial infarction: Importance of microvasculature. J. Transl. Med. 2017, 15, 67. [Google Scholar] [CrossRef]
- Wu, K.C. CMR of microvascular obstruction and hemorrhage in myocardial infarction. J. Cardiovasc. Magn. Reson. 2012, 14, 68. [Google Scholar] [CrossRef]
- Galea, N.; Dacquino, G.M.; Ammendola, R.M.; Coco, S.; Agati, L.; de Luca, L.; Carbone, I.; Fedele, F.; Catalano, C.; Francone, M. Microvascular obstruction extent predicts major adverse cardiovascular events in patients with acute myocardial infarction and preserved ejection fraction. Eur. Radiol. 2018, 1–9. [Google Scholar] [CrossRef]
- Perrino, C.; Barabasi, A.L.; Condorelli, G.; Davidson, S.M.; de Windt, L.; Dimmeler, S.; Engel, F.B.; Hausenloy, D.J.; Hill, J.A.; van Laake, L.W.; et al. Epigenomic and transcriptomic approaches in the post-genomic era: Path to novel targets for diagnosis and therapy of the ischaemic heart? Position paper of the european society of cardiology working group on cellular biology of the heart. Cardiovasc. Res. 2017, 113, 725–736. [Google Scholar] [CrossRef]
- Varga, Z.V.; Giricz, Z.; Bencsik, P.; Madonna, R.; Gyongyosi, M.; Schulz, R.; Mayr, M.; Thum, T.; Puskas, L.G.; Ferdinandy, P. Functional genomics of cardioprotection by ischemic conditioning and the influence of comorbid conditions: Implications in target identification. Curr. Drug Targets 2015, 16, 904–911. [Google Scholar] [CrossRef]
- Pavo, N.; Lukovic, D.; Zlabinger, K.; Zimba, A.; Lorant, D.; Goliasch, G.; Winkler, J.; Pils, D.; Auer, K.; Jan Ankersmit, H.; et al. Sequential activation of different pathway networks in ischemia-affected and non-affected myocardium, inducing intrinsic remote conditioning to prevent left ventricular remodeling. Sci. Rep. 2017, 7, 43958. [Google Scholar] [CrossRef]
- Yang, X.M.; Proctor, J.B.; Cui, L.; Krieg, T.; Downey, J.M.; Cohen, M.V. Multiple, brief coronary occlusions during early reperfusion protect rabbit hearts by targeting cell signaling pathways. J. Am. Coll. Cardiol. 2004, 44, 1103–1110. [Google Scholar] [CrossRef]
- McCall, F.C.; Telukuntla, K.S.; Karantalis, V.; Suncion, V.Y.; Heldman, A.W.; Mushtaq, M.; Williams, A.R.; Hare, J.M. Myocardial infarction and intramyocardial injection models in swine. Nat. Prot. 2012, 7, 1479–1496. [Google Scholar] [CrossRef]
- Kin, H.; Zhao, Z.Q.; Sun, H.Y.; Wang, N.P.; Corvera, J.S.; Halkos, M.E.; Kerendi, F.; Guyton, R.A.; Vinten-Johansen, J. Postconditioning attenuates myocardial ischemia-reperfusion injury by inhibiting events in the early minutes of reperfusion. Cardiovasc. Res. 2004, 62, 74–85. [Google Scholar] [CrossRef]
- Kamota, T.; Li, T.S.; Morikage, N.; Murakami, M.; Ohshima, M.; Kubo, M.; Kobayashi, T.; Mikamo, A.; Ikeda, Y.; Matsuzaki, M.; et al. Ischemic pre-conditioning enhances the mobilization and recruitment of bone marrow stem cells to protect against ischemia/reperfusion injury in the late phase. J. Am. Coll. Cardiol. 2009, 53, 1814–1822. [Google Scholar] [CrossRef]
- Gyongyosi, M.; Posa, A.; Pavo, N.; Hemetsberger, R.; Kvakan, H.; Steiner-Boker, S.; Petrasi, Z.; Manczur, F.; Pavo, I.J.; Edes, I.F.; et al. Differential effect of ischaemic preconditioning on mobilisation and recruitment of haematopoietic and mesenchymal stem cells in porcine myocardial ischaemia-reperfusion. Thromb. Haemost. 2010, 104, 376–384. [Google Scholar] [PubMed]
- Cheung, P.Y.; Sawicki, G.; Wozniak, M.; Wang, W.; Radomski, M.W.; Schulz, R. Matrix metalloproteinase-2 contributes to ischemia-reperfusion injury in the heart. Circulation 2000, 101, 1833–1839. [Google Scholar] [CrossRef]
- Wang, G.; Li, X.; Wang, H.; Wang, Y.; Zhang, L.; Zhang, L.; Liu, B.; Zhang, M. Later phase cardioprotection of ischemic post-conditioning against ischemia/reperfusion injury depends on inos and pi3k-akt pathway. Am. J. Transl. Res. 2015, 7, 2603–2611. [Google Scholar] [PubMed]
- Xuan, Y.T.; Guo, Y.; Zhu, Y.; Wang, O.L.; Rokosh, G.; Messing, R.O.; Bolli, R. Role of the protein kinase c-epsilon-raf-1-mek-1/2-p44/42 mapk signaling cascade in the activation of signal transducers and activators of transcription 1 and 3 and induction of cyclooxygenase-2 after ischemic preconditioning. Circulation 2005, 112, 1971–1978. [Google Scholar] [CrossRef] [PubMed]
- Barsukevich, V.; Basalay, M.; Sanchez, J.; Mrochek, A.; Whittle, J.; Ackland, G.L.; Gourine, A.V.; Gourine, A. Distinct cardioprotective mechanisms of immediate, early and delayed ischaemic postconditioning. Basic Res. Cardiol. 2015, 110, 452. [Google Scholar] [CrossRef] [PubMed]
- Dawn, B.; Xuan, Y.T.; Guo, Y.; Rezazadeh, A.; Stein, A.B.; Hunt, G.; Wu, W.J.; Tan, W.; Bolli, R. Il-6 plays an obligatory role in late preconditioning via jak-stat signaling and upregulation of inos and cox-2. Cardiovasc. Res. 2004, 64, 61–71. [Google Scholar] [CrossRef] [PubMed]
- Freixa, X.; Bellera, N.; Ortiz-Perez, J.T.; Jimenez, M.; Pare, C.; Bosch, X.; de Caralt, T.M.; Betriu, A.; Masotti, M. Ischaemic postconditioning revisited: Lack of effects on infarct size following primary percutaneous coronary intervention. Eur. Heart J. 2012, 33, 103–112. [Google Scholar] [CrossRef]
- Perricone, A.J.; Bivona, B.J.; Jackson, F.R.; Vander Heide, R.S. Conditional knockout of myocyte focal adhesion kinase abrogates ischemic preconditioning in adult murine hearts. J. Am. Heart Assoc. 2013, 2, e000457. [Google Scholar] [CrossRef]
- Wei, H.; Vander Heide, R.S. Ischemic preconditioning and heat shock activate akt via a focal adhesion kinase-mediated pathway in langendorff-perfused adult rat hearts. Am. J. Physiol. Heart Circ. Physiol. 2010, 298, H152–H157. [Google Scholar] [CrossRef]
- Mitra, S.K.; Hanson, D.A.; Schlaepfer, D.D. Focal adhesion kinase: In command and control of cell motility. Nat. Rev. Mol. Cell Biol. 2005, 6, 56–68. [Google Scholar] [CrossRef]
- Binek, A.; Fernández-Jiménez, R.; Jorge, I.; Camafeita, E.; López, J.A.; Bagwan, N.; Galán-Arriola, C.; Pun, A.; Agüero, J.; Fuster, V.; et al. Proteomic footprint of myocardial ischemia/reperfusion injury: Longitudinal study of the at-risk and remote regions in the pig model. Sci. Rep. 2017, 7, 12343. [Google Scholar] [CrossRef] [PubMed]
- Jaffe, R.; Dick, A.; Strauss, B.H. Prevention and treatment of microvascular obstruction-related myocardial injury and coronary no-reflow following percutaneous coronary intervention: A systematic approach. JACC Cardiovasc. Interv. 2010, 3, 695–704. [Google Scholar] [CrossRef] [PubMed]
- Ma, X.; Zhang, X.; Li, C.; Luo, M. Effect of postconditioning on coronary blood flow velocity and endothelial function and lv recovery after myocardial infarction. J. Intervent. Cardiol. 2006, 19, 367–375. [Google Scholar] [CrossRef] [PubMed]
- Loukogeorgakis, S.P.; Panagiotidou, A.T.; Yellon, D.M.; Deanfield, J.E.; MacAllister, R.J. Postconditioning protects against endothelial ischemia-reperfusion injury in the human forearm. Circulation 2006, 113, 1015–1019. [Google Scholar] [CrossRef]
- Álvarez, P.; Tapia, L.; Mardones, L.A.; Pedemonte, J.C.; Farías, J.G.; Castillo, R.L. Cellular mechanisms against ischemia reperfusion injury induced by the use of anesthetic pharmacological agents. Chem. Biol. Interact. 2014, 218, 89–98. [Google Scholar] [CrossRef]
- Kilkenny, C.; Browne, W.J.; Cuthill, I.C.; Emerson, M.; Altman, D.G. Improving bioscience research reporting: The arrive guidelines for reporting animal research. PLoS Biol. 2010, 8, e1000412. [Google Scholar] [CrossRef]


© 2019 by the authors. Licensee MDPI, Basel, Switzerland. This article is an open access article distributed under the terms and conditions of the Creative Commons Attribution (CC BY) license (http://creativecommons.org/licenses/by/4.0/).
Share and Cite
Lukovic, D.; Gugerell, A.; Zlabinger, K.; Winkler, J.; Pavo, N.; Baranyai, T.; Giricz, Z.; Varga, Z.V.; Riesenhuber, M.; Spannbauer, A.; et al. Transcriptional Alterations by Ischaemic Postconditioning in a Pig Infarction Model: Impact on Microvascular Protection. Int. J. Mol. Sci. 2019, 20, 344. https://doi.org/10.3390/ijms20020344
Lukovic D, Gugerell A, Zlabinger K, Winkler J, Pavo N, Baranyai T, Giricz Z, Varga ZV, Riesenhuber M, Spannbauer A, et al. Transcriptional Alterations by Ischaemic Postconditioning in a Pig Infarction Model: Impact on Microvascular Protection. International Journal of Molecular Sciences. 2019; 20(2):344. https://doi.org/10.3390/ijms20020344
Chicago/Turabian StyleLukovic, Dominika, Alfred Gugerell, Katrin Zlabinger, Johannes Winkler, Noemi Pavo, Tamás Baranyai, Zoltán Giricz, Zoltán V. Varga, Martin Riesenhuber, Andreas Spannbauer, and et al. 2019. "Transcriptional Alterations by Ischaemic Postconditioning in a Pig Infarction Model: Impact on Microvascular Protection" International Journal of Molecular Sciences 20, no. 2: 344. https://doi.org/10.3390/ijms20020344
APA StyleLukovic, D., Gugerell, A., Zlabinger, K., Winkler, J., Pavo, N., Baranyai, T., Giricz, Z., Varga, Z. V., Riesenhuber, M., Spannbauer, A., Traxler, D., Jakab, A., Garamvölgyi, R., Petnehazy, Ö., Pils, D., Tóth, L., Schulz, R., Ferdinandy, P., & Gyöngyösi, M. (2019). Transcriptional Alterations by Ischaemic Postconditioning in a Pig Infarction Model: Impact on Microvascular Protection. International Journal of Molecular Sciences, 20(2), 344. https://doi.org/10.3390/ijms20020344