Article

Endoplasmic Reticulum Stress Impaired Uncoupling Protein 1 Expression via the Suppression of Peroxisome Proliferator-Activated Receptor γ Binding Activity in Mice Beige Adipocytes

1
Laboratory of Molecular Function of Food, Division of Food Science and Biotechnology, Graduate School of Agriculture, Kyoto University, Gokasho, Uji, Kyoto 611-0011, Japan
2
Research Unit for Physiological Chemistry, the Center for the Promotion of Interdisciplinary Education and Research, Kyoto University, Kyoto 606-8501, Japan
*
Author to whom correspondence should be addressed.
Int. J. Mol. Sci. 2019, 20(2), 274; https://doi.org/10.3390/ijms20020274
Submission received: 29 December 2018 / Revised: 29 December 2018 / Accepted: 8 January 2019 / Published: 11 January 2019
(This article belongs to the Special Issue Endoplasmic Reticulum Stress and Unfolded Protein Response)

Abstract

:
Endoplasmic reticulum (ER) homeostasis is critical in maintaining metabolic regulation. Once it is disrupted due to accumulated unfolded proteins, ER homeostasis is restored via activation of the unfolded protein response (UPR); hence, the UPR affects diverse physiological processes. However, how ER stress influences adipocyte functions is not well known. In this study, we investigated the effect of ER stress in thermogenic capacity of mice beige adipocytes. Here, we show that the expression of uncoupling protein 1 (Ucp1) involved in thermoregulation is severely suppressed under ER stress conditions (afflicted by tunicamycin) in inguinal white adipose tissue (IWAT) both in vitro and in vivo. Further investigation showed that extracellular signal-regulated kinase (ERK) and c-Jun N-terminal kinase (JNK) were both activated after ER stress stimulation and regulated the mRNA levels of Ucp1 and peroxisome proliferator-activated receptor γ (Pparγ), which is known as a Ucp1 transcriptional activator, in vitro and ex vivo. We also found that Pparγ protein was significantly degraded, reducing its recruitment to the Ucp1 enhancer, thereby downregulating Ucp1 expression. Additionally, only JNK inhibition, but not ERK, rescued the Pparγ protein. These findings provide novel insights into the regulatory effect of ER stress on Ucp1 expression via Pparγ suppression in beige adipocytes.

1. Introduction

Adipose tissue has been broadly characterized as white and brown adipocytes through their distinct characteristics in lipid metabolism. White adipose tissue (WAT) functions as energy storage, while brown adipose tissue (BAT) dissipates energy as heat supported by its high oxidative capacity [1,2,3]. Recent findings show inducible brown-like white adipocytes, known as beige adipocytes. Beige adipocytes are developed within WAT in response to β-adrenergic receptor (β-AR) stimulation, termed as browning of WAT, and exhibit similar characteristic as BAT [2,4]. The transcription of uncoupling protein 1 (Ucp1) is tightly regulated during browning, thus it is often used as a browning marker of adipose tissue [1,5]. Interestingly, in addition to browning, beige adipocytes also show unique plasticity to undergo whitening (reversal of browning) [6,7,8].
The endoplasmic reticulum (ER) is a critical organelle in sensing and handling cellular nutrient required for normal cellular functions and survival [9]. Certain physiological and pathological factors such as nutrient deprivation, lipids, or increased synthesis of secretory proteins can induce cell stress and disrupt ER homeostasis by promoting unfolded protein overload [9]. Unfolded protein response (UPR) is activated as an adaptive response to restore ER activity and maintain protein quality to ensure proper protein synthesis, secretion, and correct folding of protein [10,11,12]. When ER stress is severe and/or prolonged, it can shift toward apoptosis (cell death), although the mechanism for this transition is not well understood [10,13,14,15]. ER stress has been linked to multiple disorders ranging from neurodegenerative diseases to metabolic disorders such as obesity, insulin resistance, type 2 diabetes, and chronic inflammation [9,10,16]. Metabolically active tissue including adipose tissue is not excluded from the ER stress outcomes [17,18,19]. However, the consequences of ER stress on adipocyte functions including thermogenic capacity are poorly understood.
In adipose tissue, obesity results in chronic stress and dysfunction caused by the increased demand of synthetic machinery [17]. Several studies have shown a significant activation of ER stress in high-fat-induced obesity [20,21,22]. In addition, both brown and beige adipocyte activation stimulated by cold exposure was impaired in obese adipose tissue [23]. Adversely, a decrease in adaptive thermogenesis has also been suggested as a contributing factor to obesity [6]. As obesity is characterized by diverse metabolic symptoms such as ER stress and inflammation, there is still no direct link about how ER stress itself could regulate Ucp1 expression in beige adipocytes.
Previous study has shown that the activation of downstream signaling in ER stress, such as that involving inositol-requiring enzyme 1α (IRE1α) and X-box binding protein 1 (XBP1), was needed for Ucp1 expression in BAT [16]. Further, the inactivation of ER stress in BAT, WAT, or macrophages resulted in an improved adaptive thermogenesis response [6,24], while treatment of chemical chaperones (ER stress inhibitor) could increase energy expenditure and activate browning of WAT [25,26,27]. These reports suggest a possible unknown regulatory mechanism of ER stress in the browning of WAT. In this study, we investigated the effect of ER stress stimulation on Ucp1, an adipocyte browning marker, in beige adipocytes.

2. Results

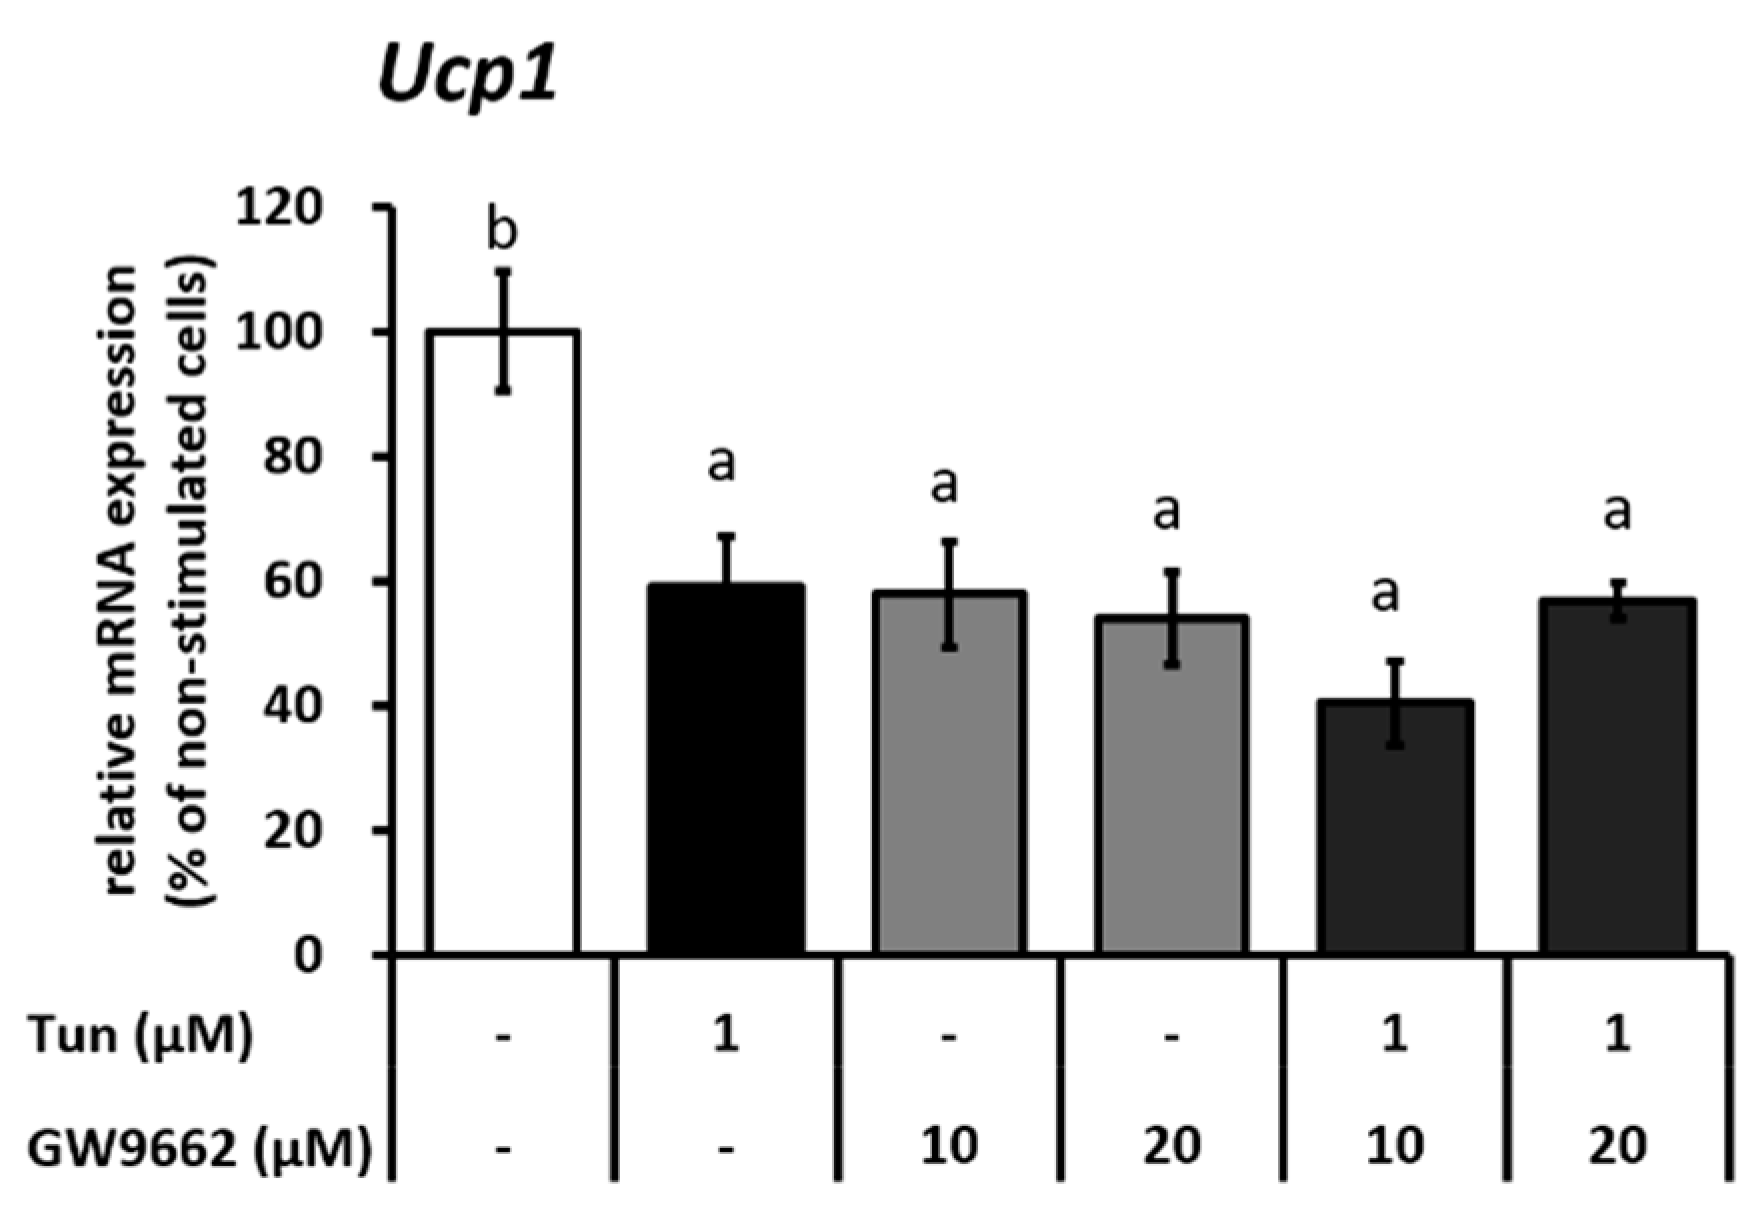
2.1. ER Stress Decreases Ucp1 mRNA Level in Beige Adipocytes

To investigate the regulation of ER stress on the thermogenic capacity of beige adipocytes, inguinal white adipose tissue (IWAT) cells were differentiated to beige adipocytes and treated with tunicamycin, an ER stress inducer. ER stress stimulation was confirmed by the upregulation of ER stress markers: binding immunoglobulin protein (Bip) and CCAAT-enhancer-binding protein homologous protein (Chop) (Figure 1A). Consequently, Ucp1 expression was severely suppressed (Figure 1A). The addition of chemical chaperone 4-phenylbutyrate (PBA) alleviated ER stress markers Bip and Chop, while also rescued Ucp1 expression (Figure 1A). These results indicate that ER stress suppressed Ucp1 expression in beige adipocytes.
Accumulating evidence has identified the cross-talk between UPR and the mitogen-activated protein kinase (MAPK) signaling pathway as a result of ER stress stimulation [13]. Indeed, we found extracellular signal-regulated kinase (ERK) and c-Jun N-terminal kinase (JNK), which are parts of the MAPK signaling pathway, were activated by tunicamycin treatment in our experimental condition. Both ERK (Figure 1B) and JNK (Figure 1C) were phosphorylated after ER stress stimulation. The addition of either ERK or JNK inhibitor (U0126 or SP600125, respectively) could ameliorate tunicamycin-induced suppression of Ucp1 expression (Figure 1D,E and Figure S1A,B) while inhibiting the phosphorylation of ERK (Figure 1F and Figure S1C) or JNK (Figure 1G and Figure S1D), indicating an ER stress-induced suppression of Ucp1 expression via the activation of ERK and JNK pathway.

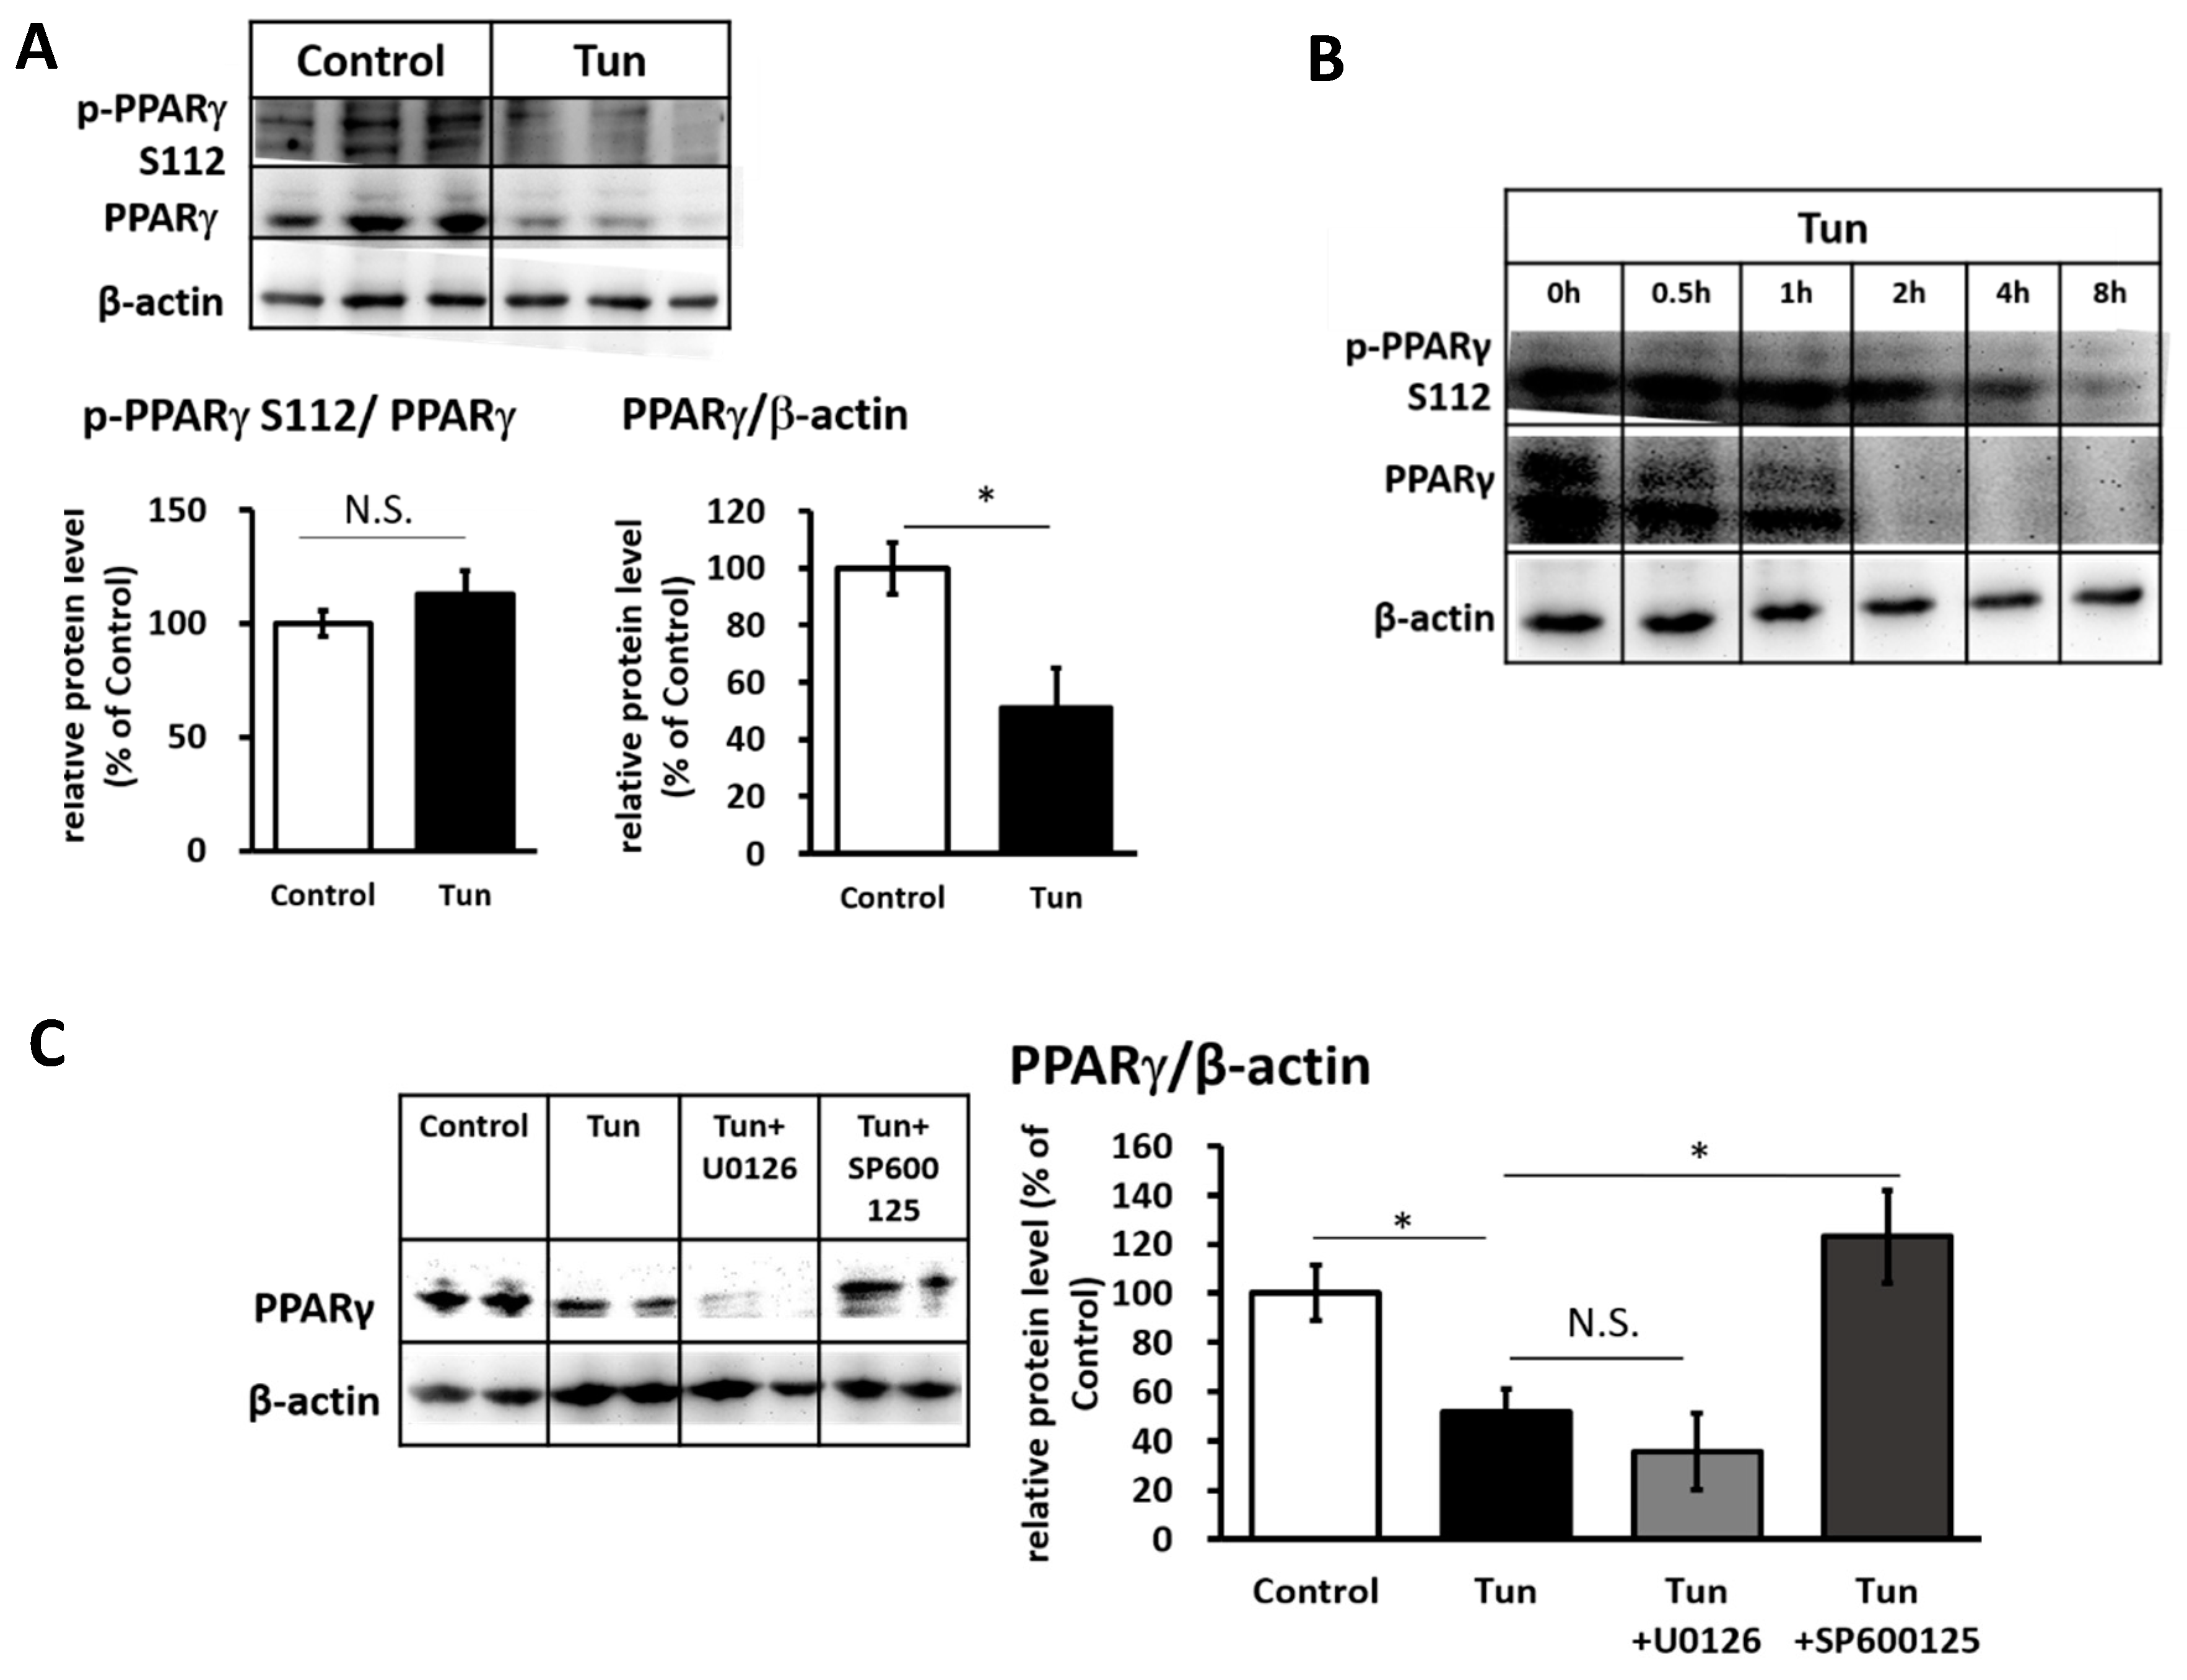
2.2. ER Stress Induces Downregulation of the Ucp1 Activator, Pparγ, Preferably via the JNK Pathway

It has been previously shown that Pparγ is a direct target of both ERK and JNK, which may result in decreased Pparγ transcriptional activity [28] and thus possibly affect Ucp1 expression. Alongside Ucp1 downregulation, the level of Pparγ mRNA was decreased upon tunicamycin treatment (Figure 2A,B) in IWAT cells but rescued when cells were treated with either an ERK (Figure 2A) or JNK inhibitor (Figure 2B). Besides that, ER stress markers (Bip, Chop and X-box binding protein 1 splicing (Xbp1s)) were partially recovered through ERK and JNK inhibition (Figure 2C,D), indicating the involvement of ERK/JNK pathway in regulating Pparγ expression.
We further investigated the possibility of post-translational modifications of Pparγ through the phosphorylation in serine 112 (S112), which is one of the main targets of ERK/JNK [29]. However, we did not find any change in the level of phosphorylation; instead, the Pparγ protein level was significantly reduced (Figure 3A). A time-course experiment revealed that the decrease in the Pparγ protein level was initiated earlier than the decrease in phosphorylation of Pparγ at S112 (Figure 3B). At this time (~4 h), ERK and JNK were both activated (Figure 1B,C). However, only treatment with the JNK inhibitor (SP600125), but not the ERK inhibitor (U0126), could rescue Pparγ protein levels (Figure 3C), suggesting that JNK is the main pathway for the tunicamycin-induced reduction in Pparγ protein.
Next, to confirm the role of Pparγ in ER stress-regulated Ucp1 expression, we treated IWAT cells with Pparγ antagonist (GW9662). GW9662 similarly decreased Ucp1 expression as tunicamycin (Figure 4 and Figure S2). However, the addition of GW9662 in tunicamycin treatment did not enhance the suppression of Ucp1 expression (Figure 4 and Figure S2), suggesting that ER stress-suppressed Ucp1 expression is indeed mediated through Pparγ.

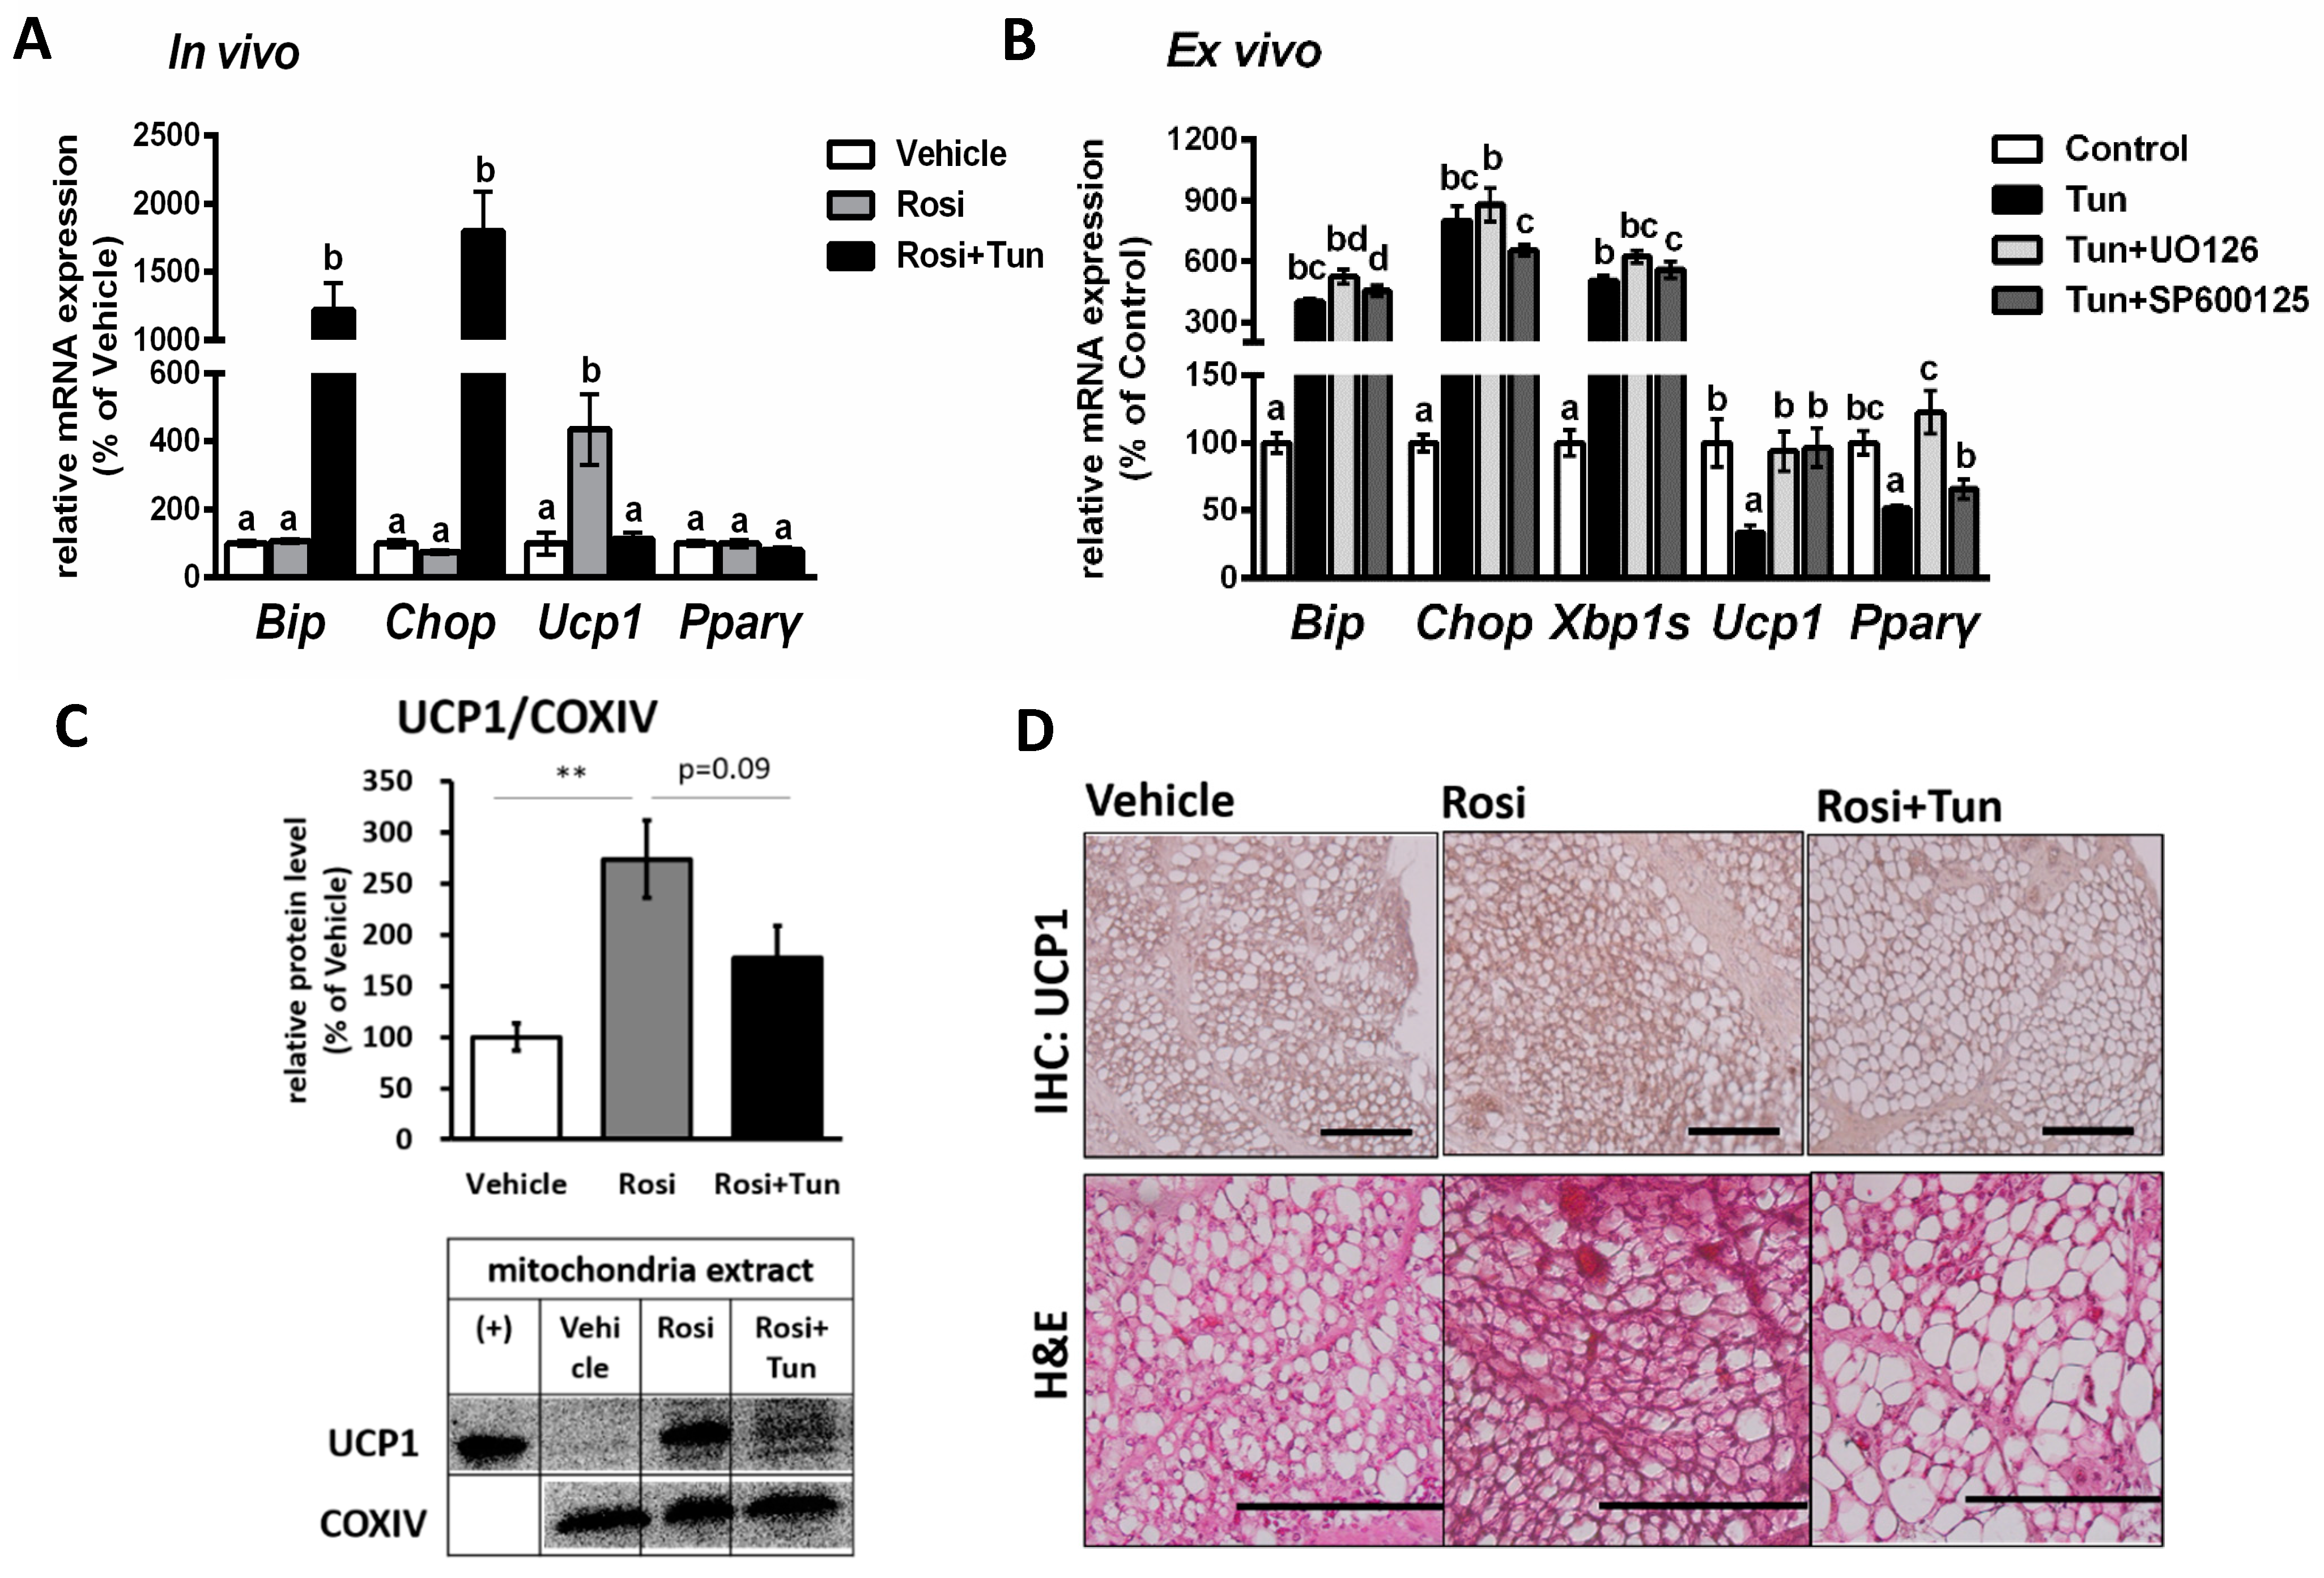
2.3. ER Stress Stimulates Pparγ Degradation that Leads to the Reduced Binding Activity

Next, to investigate whether the decreased Pparγ protein was dependent on the decrease in its mRNA expression, we performed a cycloheximide chase experiment to measure Pparγ protein stability. Tunicamycin treatment seemed to accelerate Pparγ degradation under cycloheximide addition (Figure 5A). The half-life of Pparγ was significantly reduced from 5.9 to 3.5 h upon tunicamycin treatment (Figure 5B). However, the addition of proteasome inhibitor (lactacystin) could rescue Pparγ protein (Figure 5C), suggesting that the degradation of Pparγ was mediated via proteasome degradation.
To further examine the consequence of Pparγ degradation for its role as activator, luciferase assay was done to analyze PPAR response element (PPRE) transcriptional activity under tunicamycin stimulation. Although it was in undifferentiated IWAT cells, a luciferase assay clearly showed that the tunicamycin treatment canceled the upregulation of PPRE transcriptional activity by rosiglitazone (Figure 5D). However, the stabilization of Pparγ by lactacystin altered PPRE activity (Figure 5D), indicating that Pparγ degradation indeed affects its binding activity. To finally connect the decrease in Pparγ binding activity to Ucp1 expression, we performed chromatin immunoprecipitation (ChIP) assay to measure the recruitment of Pparγ onto the PPRE within the Ucp1 enhancer region. As shown in Figure 5E, the recruitment level of Pparγ to Ucp1 promoter was significantly decreased after tunicamycin treatment. These data established that ER stress-induced Pparγ degradation was associated with the downregulated Ucp1 expression due to the loss of Pparγ activator binding to Ucp1 promoter.

2.4. ER Stress Suppressed Both Ucp1 mRNA and Protein Expression in Adipose Tissue

After observing a negative regulation of ER stress on Ucp1 expression in vitro, we next investigated if the same phenomena also occur in vivo. Browning of WAT was induced by injecting Pparγ agonist (rosiglitazone) for 10 days. As shown by the expression level of ER stress marker genes Bip and Chop (Figure 6A), the rosiglitazone treatment had no effect on ER stress. IWAT, known as the most typical browning-stimulated WAT, was confirmed to undergo browning through a significant increase in Ucp1 mRNA level (Figure 6A) after rosiglitazone treatment. After beige adipocytes were developed in IWAT, ER stress was afflicted through tunicamycin treatment. A single injection of tunicamycin could stimulate ER stress in IWAT as indicated by elevated Bip and Chop (Figure 6A) mRNA levels. In this state, tunicamycin canceled Ucp1 mRNA upregulation by rosiglitazone to basal levels (Figure 6A). However, similar to in vitro result, ERK and JNK inhibition could ameliorate the tunicamycin-suppressed Ucp1 expression ex vivo (Figure 6B). It is important to note that ERK and JNK inhibition barely altered ER stress marker (Bip, Chop, and Xbp1s) (Figure 6B), suggesting that the alteration of ERK and JNK pathway possibly only affect the downstream signaling of UPR, which in this case was Ucp1 regulation.
As mRNA expression was reduced, the Ucp1 protein level was subsequently decreased under ER stress stimulation (Figure 6C and Figure S3A). The Ucp1 downregulation was also observed via immunohistochemistry (IHC) of Ucp1 (Figure 6D) in IWAT. Hematoxylin and eosin (H&E) staining showed an increasing size of lipid droplet after tunicamycin injection (Figure 6D and Figure S4), indicating a reversal of browning (whitening). These data demonstrated that ER stress is a strong negative regulator of Ucp1 expression in IWAT. Following the in vitro result, we also found a significant reduction in Pparγ protein levels in vivo (Figure 7 and Figure S3B), but not mRNA levels (Figure 6A), suggesting the decreased Pparγ protein as the main factor for Ucp1 downregulation during ER stress stimulation.

3. Discussion

ER stress and inflammation have been known as a hallmark of metabolic syndrome. While how inflammation could defect Ucp1 expression in adipose tissue has been reported [23,30], the effect of ER stress in Ucp1 regulation is still unclear. However, as shown in Figure 6C, Ucp1 protein level was not detected in the basal level of IWAT (without rosiglitazone). Subsequently, Ucp1 protein level remained undetected when ER stress was induced by tunicamycin (Figure S3A). Therefore, we decided to investigate the effect of ER stress specifically in beige adipocytes. We first needed to induce the formation of beige adipocytes in IWAT by using drug-induced BAT activation. Among those, β3-adrenergic receptor agonist (such as isoproterenol) and the activators of Pparγ (such as rosiglitazone) have been widely used for treating obesity and type 2 diabetes through the browning-related modification in carbohydrate and lipid metabolism [31,32]. Isoproterenol and rosiglitazone themselves have been reported to increase the levels of Ucp1 mRNA in adipocytes, thus both drugs can be used to induce beige adipocytes [31,33,34,35]. However, isoproterenol is reported to stimulate ER stress [36] while activating Ucp1, as confirmed in our preliminary experiment (data not shown), therefore using isoproterenol did not fit this study. Unlike isoproterenol, rosiglitazone could induce browning in beige adipocytes without afflicting ER stress, which is shown in this report. Hence, the use of rosiglitazone would not hinder the main ER stress stimulator from tunicamycin. It is also important to note that the long treatment of rosiglitazone has been reported to have adverse effects such as weight gain (due to fluid retention) and the expansion of adipose tissue in many studies [37]. However, we have confirmed that our experimental model was done with no side effect in body weight (data not shown) or adipose tissue expansion (Figure 6D).
Pparγ has been widely known as an important activator that could influence Ucp1 expression [1,38,39]. Interestingly, we found that Pparγ protein level is decreased under ER stress stimulation even at the basal level ( s3 B). Thus, there is a possibility that ER stress-reduced Pparγ protein would further affect Ucp1 expression and prevent WAT to undergo browning. Although this possibility could not be proven due to low Ucp1 detection in WAT, our study clearly shows that ER stress was indeed a strong negative regulator of both Ucp1 mRNA and protein expression in beige adipocytes. Furthermore, ER stress stimulation seemed to increase the lipid droplet size even in the activated beige adipocytes, which indicates whitening (reversal of browning) as shown in this study, suggesting ER stress may closely involve to the impaired browning.
To find the mechanism under ER stress-suppressed Ucp1 expression, we first noticed the major involvement of MAPK pathways: ERK and JNK as a part of UPR during ER stress. Among the three ER stress sensors that have been established, IRE1 activation has been reported to promote the phosphorylation of ERK and JNK [13,20,40], which was also shown in this study. However, the consequences of ERK and JNK activation to Ucp1 expression during ER stress is unknown. Herein, we found that both ERK and JNK inhibition could recover Ucp1_expression under ER stress condition, suggesting that ER stress suppressed-Ucp1 expression might be mediated through ERK and JNK pathways. Furthermore, Pparγ regulation by ERK and JNK during ER stress stimulation seemed to have similar pattern as Ucp1. Following that, Pparγ protein level was also decreased by tunicamycin treatment. However, only JNK inhibition could rescue Pparγ protein level. These results suggesting that the reduced Ucp1 expression was mediated preferably through JNK-Pparγ interaction.
It has been known that Pparγ is a phosphorylation target of MAPK which includes ERK and JNK [29]. Pparγ phosphorylation at Serine 112 by either ERK or JNK has been known to change Pparγ conformation that lead to the protein degradation and repressed transcriptional activation [29,41]. However, to our surprise, we did not find significant change in phosphorylation of Pparγ. Instead, Pparγ protein level was decreased earlier than its phosphorylation. Thus, we assume that although JNK-mediated the reduction of Pparγ activity by phosphorylation has been established through several studies [29,41,42], the detail mechanism may be different depending on the source of JNK activation. In the case of ER stress, JNK might mediate the decrease of Pparγ mRNA and protein level independent of phosphorylation modification. Accordingly, JNK activation is also known to be associated with apoptosis through promoting phosphorylation and activation of pro-apoptotic protein Bcl-2-associated X protein (Bax) [13,43,44]. Indeed, we found that chronic ER stress (12–20 h) in our experimental condition induced cell apoptosis, indicated by the upregulated Chop expression, decreased cell viability (Figure S5A), and increased in cleavage Caspase 3 (Figure S5B,C). Chop has been reported to participate in cell death program during ER stress [45]. On the other hand, Caspase 3 (apoptosis marker) has been found to mediate Pparγ cleavage [46]. These pieces of evidence suggest that JNK-mediated reduced Pparγ activity may be related to the cell apoptosis response.
Regardless, we found a consistent decrease in Pparγ activity in vitro, ex vivo, and in vivo after ER stress stimulation. Indeed, when we reduced Pparγ activity by Pparγ antagonist (GW9662), it similarly downregulated Ucp1 expression as tunicamycin. Furthermore, the co-treatment between tunicamycin and GW9662 did not enhance the suppression of Ucp1 expression, suggesting that both compounds regulated Ucp1 expression preferably through the same pathway, which in this case was through Pparγ. To finally connect the consequence of Pparγ reduction to Ucp1 expression, we investigated the PPRE activity under tunicamycin treatment. Ucp1 is one of the established activation target of Pparγ in adipose tissue, equipped with PPRE binding sequence located on the Ucp1 distal enhancer (-2494 to -2318 bp) [1]. Herein, we showed that PPRE activity was significantly affected after ER stress stimulation, based on the luciferase assay. Although it was performed in undifferentiated IWAT cells due to the low transfection efficiency in differentiated cells, we further confirmed in ChIP assay that Pparγ recruitment to Ucp1 promoter was consistently reduced in differentiated IWAT cells. These pieces of evidence thus show that the reduced Pparγ binding to Ucp1 promoter are likely due to the decreased protein level and subsequently affected Ucp1 mRNA downregulation as ER stress was stimulated.
While the reduced Pparγ mRNA expression was only seen in vitro, the Pparγ protein level was decreased both in vitro and in vivo. These results might indicate that the loss of Pparγ protein was not dependent on its mRNA expression. Later, we found that Pparγ protein stability was disturbed by ER stress stimulation, suggesting that Pparγ protein was degraded. In addition, it has been known that ER stress induction could lead to the activation of protein degradation pathway to remove the accumulation of unfolded protein [14]. Basically, there are two major protein degradation pathways: proteasomes (via ER-associated degradation or ERAD) and lysosome (via autophagy) degradation [14,47]. Between two pathways, ERAD is recognized as the predominant cellular mechanism for removal of unfolded protein [14,48]. Certainly, the addition of proteasome inhibitor (lactacystin) rescued Pparγ protein and PPRE activity, suggesting proteasome-mediated Pparγ degradation affects its binding activity to Ucp1 promoter during ER stress stimulation in beige adipocytes.
Interestingly, the induction of ER stress did not only affect Ucp1 mRNA expression, but also Ucp1 protein level. Although, it might be linear to the decreased in mRNA expression, there still has possibility that the reduced Ucp1 protein level was affected directly through ERAD mechanism. Therefore, further investigation is needed to carefully assess Ucp1 protein modification in ER stress. Regardless, this study presents a novel evidence about the negative regulation of ER stress signaling to Ucp1 expression via the suppression of activator Pparγ in beige adipocytes.

4. Materials and Methods

4.1. Materials

All chemicals were obtained from Nacalai Tesque (Kyoto, Japan), Wako (Osaka, Japan), Corning (Corning, NY, USA), Qiagen (Hilden, Germany), Invitrogen (Carlsbad, CA, USA), and Sigma-Aldrich (St. Louis, MO, USA). Tunicamycin, U0126, SP600125, and cycloheximide were purchased from Nacalai Tesque (Kyoto, Japan). GW9662 (Sigma-Aldrich, St. Louis, MO, USA), rosiglitazone (LKT Laboratories, St. Paul, MN, USA), and PBA (Santa Cruz Biotechnology, Dallas, TX, USA) were acquired from the indicated companies.

4.2. Animal Experiment

Mice were kept in a temperature-controlled room at 23 ± 1 °C with a 12 h light/dark cycle and free access to food (standard diet) and water. To stimulate browning, 6–10-week-old male C57BL/6J mice (SLC, Shizuoka, Japan) were intraperitoneally injected with 10 mg/kg rosiglitazone daily for 10 days [49]. On Day 10, 10 mg/kg tunicamycin was injected to induce ER stress. Mice were then fasted overnight. Twenty-four hours after the last injection, mice were sacrificed, and IWAT was harvested for mRNA and protein analysis. The mice were handled in accordance with procedures approved by the Kyoto University Animal Care Committee (Permission number: 29-62, 20 April 2012).

4.3. Ex Vivo Experiment

To stimulate browning, 6-week-old male C57BL/6J mice (SLC, Shizuoka, Japan) were intraperitoneally injected with 10 mg/kg rosiglitazone daily for 10 days [49]. Twenty-four hours after last injection, IWAT was collected and immediately incubated in serum free medium containing 1 μM tunicamycin for 24 h with or without 100 μM ERK inhibitor (U0126) for 26 h/25 μM JNK inhibitor (SP600125) for 25 h. IWAT was then extracted for mRNA analysis.

4.4. Cell Culture

Immortalized primary IWAT cells were kindly provided by Dr. S. Kajimura (University of California, San Francisco, CA, USA). IWAT cells were maintained in a humidified 5% CO2 atmosphere at 37 °C using basic medium (DMEM) supplemented with 10% fetal bovine serum and 1% penicillin/streptomycin. To induce the differentiation into beige adipocytes [49], two days post-confluent IWAT cells were stimulated with 0.5 mM 1-methyl-3-isobutylxanthine, 2 μg/mL dexamethasone, 10 μg/mL insulin, 1 nM triiodo-L-thyronine (T3), 0.5 μM rosiglitazone (rosi), and 125 μM indomethacin for 48 h. The media was then replaced by basic medium containing 5 μg/mL insulin, 1 nM T3, and 0.5 μM rosi every 2 days. Generally, the differentiation process took 8–10 days. ER stress was induced by the addition of tunicamycin (1 μM) in serum-free medium for 12 h, unless mentioned.

4.5. RNA Preparation and Quantification of Gene Expression

RNA was extracted as described previously [50]. Total RNA was collected from cultured cells or tissues using Sepasol-RNA I Super G (Nacalai Tesque, Kyoto, Japan) or QIAzol Lysis Reagent (Qiagen, Hilden, Germany), respectively. RNA expression was quantified by real-time PCR using a LightCycler System (Roche Diagnostics, Mannheim, Germany) with SYBR green fluorescence signal detection. All mRNA signals were normalized to a 36b4 internal control. The primer sequences are listed in Table 1.

4.6. Protein Extraction and Western Blotting

Western blotting was performed as previously described [50]. The protein concentration was measured using the DC protein assay (Bio-Rad, Hercules, CA, USA). The primary antibodies included anti-Ucp1 (Sigma-Aldrich, St. Louis, MO, USA), anti-COXIV, anti-phospho-p44/42 MAPK (ERK1/2), anti-phospho-SAPK/JNK (Thr183/Tyr185), anti-SAPK/JNK, anti-Pparγ, and anti-β-actin (all purchased from Cell Signaling Technology, Danvers, MA, USA). The secondary antibody staining was visualized using a chemiluminescent horseradish peroxidase substrate (Millipore, Burlington, MA USA).

4.7. Chromatin Immunoprecipitation (ChIP) Assay

The ChIP assay was performed as described previously [50]. The cells were subjected to overnight immunoprecipitation with 8 μg Pparγ antibody (Perseus Proteomics, Tokyo, Japan), or rabbit IgG isotype control (Novus Biological, Littleton, CO, USA) as a mock control and analyzed by real-time PCR. The primer sequences are listed in Table 2.

4.8. Luciferase Assay

The luciferase assay was performed according to company protocol (Invitrogen, Carlsbad, CA, USA). Undifferentiated IWAT cells were transfected with plasmid containing the reporter vector driven by PPAR response element (PPRE-Luc) and a Pparγ expression vector using Lipofectamine 2000 reagent (Invitrogen, Carlsbad, CA, USA). The transfected cells were treated with 0.5 μM rosiglitazone for 24 h and 10 μM tunicamycin with or without 10 μM lactacystin for 4 h.

4.9. Statistical Analysis

All data were analyzed using Student’s t-test or one-way ANOVA followed by Tukey–Kramer test, when variances were heterogeneous. All data are presented as means ± SEM. Differences were considered significant at p < 0.05.

5. Conclusions

The present study highlights a novel mechanism of ER stress regulation to Ucp1 expression preferentially via the suppression of activator Pparγ in beige adipocytes. Furthermore, it may provide a solid foundation about the involvement of ER stress to the impaired thermogenic capacity, especially in obese adipose tissue. Thus, recovering ER stress is proven essential to rescue thermogenic activity in adipose tissue.

Supplementary Materials

Supplementary Materials can be found at https://www.mdpi.com/1422-0067/20/2/274/s1. Figure S1: The effect of extracellular signal-regulated kinase (ERK) and c-Jun N-terminal kinase (JNK) inhibitor in beige adipocytes; Figure S2: The effect of peroxisome proliferator-activated receptor gamma (Pparγ) antagonist treatment in beige adipocytes; Figure S3: The effect of ER stress induction in IWAT; Figure S4: The lipid size of IWAT after ER stress stimulation; Figure S5: ER stress stimulation induces cell death program in beige adipocytes.

Author Contributions

Conceptualization, A.Y., A.D., and T.G.; Methodology, A.Y., A.D., H.-F.J., and J.K.; Analysis, A.Y. and A.D.; Writing—Original Draft Preparation, A.Y.; Writing—Review and Editing, H.-F.J., W.N., H.T., T.A., and T.G.; Supervision, H.-F.J., W.N., H.T., T.A., T.K., and T.G.; and Funding Acquisition, T.K. and T.G.

Acknowledgments

This study was supported by Grants-in-Aid for Scientific Research from the Ministry of Education, Culture, Sports, Science and Technology of Japan (16K07734 and 16H02551). The authors thank M. Komori and R. Yoshii for kindly providing technical assistance and secretarial support. We also appreciate S. Kajimura for providing the IWAT cells line. A.Y. was supported by Indonesia Endowment Fund for Education (LPDP) by Ministry of Finance, Indonesia. J.K. was supported by Monbukagakusho/MEXT, Japan.

Conflicts of Interest

The authors declare no conflict of interest.

Abbreviations

β-ARbeta-adrenergic receptor
BATbrown adipose tissue
Bipbinding immunoglobulin protein
ChIPchromatin immunoprecipitation
ChopCCAAT-enhancer-binding protein homologous protein
COXIVcytochrome c oxidase subunit IV
ERendoplasmic reticulum
ERADER-associated degradation
ERKextracellular signal-regulated kinase
H&Ehematoxylin and eosin
IHCimmunohistochemical staining
IRE1αinositol-requiring enzyme 1 alpha
IWATinguinal white adipose tissue
JNKc-Jun N-terminal kinase
MAPKmitogen-activated protein kinase
PBA4-phenylbutyrate
Pparγperoxisome proliferator-activated receptor gamma
PPREPPAR response element
Rosirosiglitazone
S112serine 112
T3triiodo-L-thyronine
Ucp1uncoupling protein 1
WATwhite adipose tissue
XBP1sX-box binding protein 1 splicing

References

  1. Villarroya, F.; Iglesias, R.; Giralt, M. PPARs in the control of uncoupling proteins gene expression. PPAR Res. 2007, 2007. [Google Scholar] [CrossRef] [PubMed]
  2. Harms, M.; Seale, P. Brown and beige fat: Development, function and therapeutic potential. Nat. Med. 2013, 19, 1252–1263. [Google Scholar] [CrossRef] [PubMed]
  3. Cannon, B.; Nedergaard, J. Brown adipose tissue: Function and physiological significance. Physiol. Rev. 2004, 84, 277–359. [Google Scholar] [CrossRef] [PubMed]
  4. Vitali, A.; Murano, I.; Zingaretti, M.C.; Frontini, A.; Ricquier, D.; Cinti, S. The adipose organ of obesity-prone C57BL/6J mice is composed of mixed white and brown adipocytes. J. Lipid Res. 2012, 53, 619–629. [Google Scholar] [CrossRef] [PubMed] [Green Version]
  5. Kalinovich, A.V.; de Jong, J.M.A.; Cannon, B.; Nedergaard, J. UCP1 in adipose tissues: Two steps to full browning. Biochimie 2017, 134, 127–137. [Google Scholar] [CrossRef] [PubMed]
  6. Okla, M.; Wang, W.; Kang, I.; Pashaj, A.; Carr, T.; Chung, S. Activation of Toll-like receptor 4 (TLR4) attenuates adaptive thermogenesis via endoplasmic reticulum stress. J. Biol. Chem. 2015, 290, 26476–26490. [Google Scholar] [CrossRef]
  7. Lee, Y.K.; Cowan, C.A. White to brite adipocyte transition and back again. Nat. Cell Biol. 2013, 15, 568–569. [Google Scholar] [CrossRef]
  8. Rosenwald, M.; Perdikari, A.; Rülicke, T.; Wolfrum, C. Bi-directional interconversion of brite and white adipocytes. Nat. Cell Biol. 2013, 15, 659–667. [Google Scholar] [CrossRef]
  9. Ozcan, U.; Cao, Q.; Yilmaz, E.; Lee, A.-H.; Iwakoshi, N.N.; Ozdelen, E.; Tuncman, G.; Gorgun, C.; Glimcher, L.H.; Hostamisligil, G.S. Endoplasmic Reticulum Stress Links Obesity, Insulin Action, and Type 2 Diabetes. Science 2003, 299, 1033–1036. [Google Scholar] [CrossRef]
  10. Lindholm, D.; Korhonen, L.; Eriksson, O.; Kõks, S. Recent Insights into the Role of Unfolded Protein Response in ER Stress in Health and Disease. Front. Cell Dev. Biol. 2017, 5, 1–16. [Google Scholar] [CrossRef]
  11. Walter, P.; Ron, D. The Unfolded Protein Response: From Stress Pathway to Homeostatic Regulation. Science 2011, 334, 1081–1085. [Google Scholar] [CrossRef]
  12. Hetz, C.; Chevet, E.; Harding, H.P. Targeting the unfolded protein response in disease. Nat. Rev. Drug Discov. 2013, 12, 703–719. [Google Scholar] [CrossRef]
  13. Darling, N.J.; Cook, S.J. The role of MAPK signalling pathways in the response to endoplasmic reticulum stress. Biochim. Biophys. Acta 2014, 1843, 2150–2163. [Google Scholar] [CrossRef] [Green Version]
  14. Sano, R.; Reed, J.C. ER stress-induced cell death mechanisms. Biochim. Biophys. Acta 2013, 1833, 3460–3470. [Google Scholar] [CrossRef] [Green Version]
  15. Tabas, I.; Ron, D. Integrating the mechanisms of apoptosis induced by endoplasmic reticulum stress. Nat. Cell Biol. 2011, 13, 184–190. [Google Scholar] [CrossRef] [Green Version]
  16. Kawasaki, N.; Asada, R.; Saito, A.; Kanemoto, S.; Imaizumi, K. Obesity-induced endoplasmic reticulum stress causes chronic inflammation in adipose tissue. Sci. Rep. 2012, 2, 1–7. [Google Scholar] [CrossRef]
  17. Gregor, M.F.; Hotamisligil, G.S. Thematic review series: Adipocyte Biology. Adipocyte stress: The endoplasmic reticulum and metabolic disease. J. Lipid Res. 2007, 48, 1905–1914. [Google Scholar] [CrossRef]
  18. Han, J.; Kaufman, R.J. The role of ER stress in lipid metabolism and lipotoxicity. J. Lipid Res. 2016, 57, 1329–1338. [Google Scholar] [CrossRef] [Green Version]
  19. Bartelt, A.; Widenmaier, S.B.; Schlein, C.; Johann, K.; Goncalves, R.L.S.; Eguchi, K.; Fischer, A.W.; Parlakgül, G.; Snyder, N.A.; Nguyen, T.B.; et al. Brown adipose tissue thermogenic adaptation requires Nrf1-mediated proteasomal activity. Nat. Med. 2018, 24, 292–303. [Google Scholar] [CrossRef]
  20. Salvadó, L.; Palomer, X.; Barroso, E.; Vázquez-Carrera, M. Targeting endoplasmic reticulum stress in insulin resistance. Trends Endocrinol. MeTable 2015, 26, 438–448. [Google Scholar] [CrossRef]
  21. Alcalá, M.; Calderon-Dominguez, M.; Bustos, E.; Ramos, P.; Casals, N.; Serra, D.; Viana, M.; Herrero, L. Increased inflammation, oxidative stress and mitochondrial respiration in brown adipose tissue from obese mice. Sci. Rep. 2017, 7, 1–12. [Google Scholar] [CrossRef]
  22. Deng, J.; Liu, S.; Zou, L.; Xu, C.; Geng, B.; Xu, G. Lipolysis response to endoplasmic reticulum stress in adipose cells. J. Biol. Chem. 2012, 287, 6240–6249. [Google Scholar] [CrossRef]
  23. Sakamoto, T.; Nitta, T.; Maruno, K.; Yeh, Y.-S.; Kuwata, H.; Tomita, K.; Goto, T.; Takahashi, N.; Kawada, T. Macrophage infiltration into obese adipose tissues suppresses the induction of UCP1 expression in mice. Am. J. Physiol. 2016. [Google Scholar] [CrossRef]
  24. Shan, B.; Wang, X.; Wu, Y.; Xu, C.; Xia, Z.; Dai, J.; Shao, M.; Zhao, F.; He, S.; Yang, L.; et al. The metabolic ER stress sensor IRE1α suppresses alternative activation of macrophages and impairs energy expenditure in obesity. Nat. Immunol. 2017, 18, 519–529. [Google Scholar] [CrossRef]
  25. Wagner, S.; Ribich, S.; Arrojo, R.; Castillo, M. The chemical chaperones tauroursodeoxycholic and 4-phenylbutyric acid accelerate thyroid hormone activation and energy expenditure. FEBS Lett. 2012, 585, 539–544. [Google Scholar] [CrossRef]
  26. Contreras, C.; González-García, I.; Seoane-Collazo, P.; Martínez-Sánchez, N.; Liñares-Pose, L.; Rial-Pensado, E.; Fernø, J.; Tena-Sempere, M.; Casals, N.; Diéguez, C.; et al. Reduction of hypothalamic endoplasmic reticulum stress activates browning of white fat and ameliorates obesity. Diabetes 2017, 66, 87–99. [Google Scholar] [CrossRef]
  27. Özcan, U.; Yilmaz, E.; Özcan, L.; Furuhashi, M.; Vaillancourt, E.; Smith, R.O.; Görgün, C.Z.; Hotamisligil, G.S. Chemical Chaperones Reduce ER stress and restore glucoes homeostasis in a mouse model of type 2 diabetes. Science 2006, 313, 1137–1140. [Google Scholar] [CrossRef]
  28. Gehart, H.; Kumpf, S.; Ittner, A.; Ricci, R. MAPK signalling in cellular metabolism: Stress or wellness? EMBO Rep. 2010, 11, 834–840. [Google Scholar] [CrossRef]
  29. Burgermeister, E.; Seger, R. MAPK kinases as nucleo-cytoplasmic shuttles for PPARγ. Cell Cycle 2007, 6, 1539–1548. [Google Scholar] [CrossRef]
  30. Sakamoto, T.; Takahashi, N.; Sawaragi, Y.; Naknukool, S.; Yu, R.; Goto, T.; Kawada, T. Inflammation induced by RAW macrophages suppresses UCP1 mRNA induction via ERK activation in 10T1/2 adipocytes. AJP Cell Physiol. 2013, 304, C729–C738. [Google Scholar] [CrossRef] [Green Version]
  31. Mukherjee, J.; Baranwal, A.N.; Schade, K. Classification of Therapeutic and Experimental Drugs for Brown Adipose Tissue Activation: Potential Treatment Strategies for Diabetes and Obesity. Curr. Diabetes Rev. 2016, 12, 414–428. [Google Scholar] [CrossRef]
  32. Salomone, S. Pleiotropic effects of glitazones: A double edge sword? Front. Pharmacol. 2011. [Google Scholar] [CrossRef]
  33. Digby, J.E.; Montague, C.T.; Sewter, C.P.; Sanders, L.; Wilkison, W.O.; O’Rahilly, S.; Prins, J.B. Thiazolidinedione exposure increases the expression of uncoupling protein 1 in cultured human preadipocytes. Diabetes 1998, 47, 138–141. [Google Scholar] [CrossRef]
  34. Asano, H.; Kanamori, Y.; Higurashi, S.; Nara, T.; Kato, K.; Matsui, T.; Funaba, M. Induction of Beige-Like Adipocytes in 3T3-L1 Cells. J. Vet. Med. Sci. 2014, 76, 57–64. [Google Scholar] [CrossRef] [Green Version]
  35. Miller, C.N.; Yang, J.Y.; England, E.; Yin, A.; Baile, C.A.; Rayalam, S. Isoproterenol increases uncoupling, glycolysis, and markers of beiging in mature 3T3-L1 adipocytes. PLoS ONE 2015, 10, 1–14. [Google Scholar] [CrossRef]
  36. Zhuo, X.Z.; Wu, Y.; Ni, Y.J.; Liu, J.H.; Gong, M.; Wang, X.H.; Wei, F.; Wang, T.Z.; Yuan, Z.; Ma, A.Q.; et al. Isoproterenol instigates cardiomyocyte apoptosis and heart failure via AMPK inactivation-mediated endoplasmic reticulum stress. Apoptosis 2013, 18, 800–810. [Google Scholar] [CrossRef]
  37. Soccio, R.E.; Chen, E.R.; Lazar, M.A. Thiazolidinediones and the promise of insulin sensitization in type 2 diabetes. Cell MeTable 2014, 20, 573–591. [Google Scholar] [CrossRef]
  38. Chen, H.Y.; Liu, Q.; Salter, A.M.; Lomax, M.A. Synergism between cAMP and PPAR γ signalling in the initiation of UCP1 gene expression in HIB1B brown adipocytes. PPAR Res. 2013, 2013. [Google Scholar] [CrossRef]
  39. Xue, B.; Coulter, A.; Rim, J.S.; Koza, R. a; Kozak, L.P. Transcriptional Synergy and the Regulation of Ucp1 during Brown Adipcytes Induction in White Fat Depots. Mol. Cell. Biol. 2005, 25, 8311–8322. [Google Scholar] [CrossRef]
  40. Urano, F.; Wang, X.-Z.; Bertolotti, A.; Zhang, Y.; Chung, P.; Harding, H.P.; Ron, D. Coupling of Stress in the Endoplasmic Reticulum to Activation of JNK Protein Kinases by Transmembrane Protein Kinase IRE1. Science 2000, 287, 664–666. [Google Scholar] [CrossRef]
  41. Hauser, S.; Adelmant, G.; Sarraf, P.; Wright, H.M.; Mueller, E.; Spiegelman, B.M. Degradation of the peroxisome proliferator-activated receptor γ is linked to ligand-dependent activation. J. Biol. Chem. 2000, 275, 18527–18533. [Google Scholar] [CrossRef]
  42. Camp, H.S.; Tafuri, S.R.; Leff, T.; Biology, C.; Biology, M. c-Jun N-Terminal Kinase Phosphorylates Peroxisome Proliferator-Activated Receptor- gamma 1 and Negatively Regulates Its Transcriptional Activity. Endocrinology 1999, 140, 392–397. [Google Scholar] [CrossRef]
  43. Molton, S.A.; Todd, D.E.; Cook, S.J. Selective activation of the c-Jun N-terminal kinase (JNK) pathway fails to elicit Bax activation or apoptosis unless the phosphoinositide 3′-kinase (PI3K) pathway is inhibited. Oncogene 2003, 22, 4690–4701. [Google Scholar] [CrossRef] [Green Version]
  44. Kim, B.J.; Ryu, S.W.; Song, B.J. JNK- and p38 kinase-mediated phosphorylation of Bax leads to its activation and mitochondrial translocation and to apoptosis of human hepatoma HepG2 cells. J. Biol. Chem. 2006, 281, 21256–21265. [Google Scholar] [CrossRef]
  45. Zinszner, H.; Kuroda, M.; Wang, X.Z.; Batchvarova, N.; Lightfoot, R.T.; Remotti, H.; Stevens, J.L.; Ron, D. CHOP is implicated in programmed cell death in response to impaired function of the endoplasmic reticulum. Genes Dev. 1998, 12, 982–995. [Google Scholar] [CrossRef] [Green Version]
  46. Guilherme, A.; Tesz, G.J.; Guntur, K.V.P.; Czech, M.P. Tumor necrosis factor-α induces caspase-mediated cleavage of peroxisome proliferator-activated receptor γ in adipocytes. J. Biol. Chem. 2009, 284, 17082–17091. [Google Scholar] [CrossRef]
  47. Zha, B.S.; Zhou, H. ER stress and lipid metabolism in adipocytes. Biochem. Res. Int. 2012, 2012. [Google Scholar] [CrossRef]
  48. Lockhart, D.J.; Travers, K.J.; Walter, P.; Patil, C.K.; Wodicka, L.; Weissman, J.S.; Lockhart, D.J.; Weissman, J.S.; Walter, P. Functional and genomic analyses reveal an essential coordination between the unfolded protein response and ER-associated degradation. Cell 2000, 101, 249–258. [Google Scholar] [CrossRef]
  49. Ohno, H.; Shinoda, K.; Spiegelman, B.M.; Kajimura, S. PPARγ agonists induce a white-to-brown fat conversion through stabilization of PRDM16 protein. Cell MeTable 2012, 15, 395–404. [Google Scholar] [CrossRef]
  50. Yuliana, A.; Jheng, H.-F.; Kawarasaki, S.; Nomura, W.; Takahashi, H.; Ara, T.; Kawada, T.; Goto, T. β-adrenergic Receptor Stimulation Revealed a Novel Regulatory Pathway via Suppressing Histone Deacetylase 3 to Induce Uncoupling Protein 1 Expression in Mice Beige Adipocyte. Int. J. Mol. Sci. 2018, 19, 2436. [Google Scholar] [CrossRef]
Figure 1. Endoplasmic reticulum (ER) stress stimulation downregulates uncoupling protein 1 (Ucp1) through phosphorylation of extracellular signal-regulated kinase (ERK) and c-Jun N-terminal kinase (JNK) in inguinal white adipose tissue (IWAT) cells. (A) the mRNA expression levels of ER stress markers: binding immunoglobulin protein (Bip), CCAAT-enhancer-binding protein homologous protein (Chop), and adipocyte browning markers Ucp1 after treatment with 1 μM tunicamycin (Tun) for 12 h with or without 20 mM 4-phenylbutyrate (PBA) for 24 h before collection. Phosphorylation of (B) ERK and (C) JNK at different time points when treated with 1 μM tunicamycin. (D,E) Ucp1 mRNA expression and phosphorylation of ERK (F) or JNK (G) after being treated with (D,F) 80 or 100 μM ERK inhibitor (U0126) for 14 h, or (E,G) 25 μM JNK inhibitor (SP600125) for 13 h, followed by tunicamycin (1 μM; 12 h). Data are presented as mean ± S.E.M. (error bars). n = 4 in each group. Different letters indicate significant differences (p < 0.05) according to one-way ANOVA followed by Tukey–Kramer multiple comparison test.
Ijms 20 00274 g001
Figure 2. ER stress decreases Ucp1 activator, peroxisome proliferator-activated receptor γ (Pparγ) mRNA expression through ERK and JNK pathway in IWAT cells. Pparγ and ER stress marker (Bip, Chop, and X-box binding protein 1 splicing-Xbp1s) mRNA expression in cells treated with (A,C) 100 μM ERK inhibitor (U0126) for 14 h or (B,D) 25 μM JNK inhibitor (SP600125) for 13 h, followed by tunicamycin (1 μM, 12 h). Data are presented as mean ± S.E.M. (error bars). n = 4 in each group. Different letters indicate significant differences (p < 0.05) according to one-way ANOVA followed by Tukey–Kramer multiple comparison test.
Ijms 20 00274 g002
Figure 3. ER stress decreases Pparγ protein level preferably through JNK pathway in IWAT cells. Pparγ phosphorylation at serine 112 (S112) and Pparγ protein level in cells treated with 1 μM tunicamycin (A) for 12 h or (B) at different time points. (C) Pparγ protein after treated with 100 μM U0126 for 14 h or 25 μM SP600125 for 13 h, followed by tunicamycin (1 μM, 12 h). β-actin was used as a loading control. Data are presented as mean ± S.E.M. (error bars). n = 3–4 in each group. * indicates significant differences (p < 0.05) according to unpaired-t test. N.S., not significant.
Ijms 20 00274 g003
Figure 4. ER stress suppresses Ucp1 expression through the reduced activity of Pparγ in IWAT cells. Pparγ mRNA expression in cells treated with Ucp1 mRNA expression after treatment with 10 or 20 μM Pparγ antagonist (GW9662) for 13 h, followed by 1 μM tunicamycin (12 h). Data are presented as mean ± S.E.M. (error bars). n = 4 in each group. Different letters indicate significant differences (p < 0.05) according to one-way ANOVA followed by Tukey–Kramer multiple comparison test.
Ijms 20 00274 g004
Figure 5. ER stress induces Pparγ degradation and reduces its binding activity in IWAT cells. (A) Pparγ protein level in cells during the cycloheximide chase experiment (20 μg/mL) at different time points with or without 1 μM tunicamycin treatment. (B) Regression analysis of Pparγ protein stability of (A). (C) Pparγ protein level after treated with 1 μM tunicamycin and/or 10 μM proteasome inhibitor, lactacystin (Lac) for 4 h in the presence of cycloheximide (20 μg/mL). β-actin was used as a loading control. (D) PPAR response element (PPRE) transcriptional activity in undifferentiated IWAT cells after treated with 0.5 μM rosiglitazone (Rosi) for 24 h, 10 μM tunicamycin and/or 10 μM lactacystin for 4 h, based on a luciferase assay. (E) Pparγ recruitment level in the Ucp1 distal enhancer region analyzed by chromatin immunoprecipitation (ChIP) assay after cells were treated with 1 μM tunicamycin. IgG was used as a mock control. Data are presented as mean ± S.E.M. (error bars). n = 3–5 in each group. Different letters indicate significant differences (p < 0.05) according to one-way ANOVA followed by Tukey–Kramer multiple comparison test.
Ijms 20 00274 g005
Figure 6. ER stress stimulation negatively regulates Ucp1 expression in IWAT in vivo and ex vivo. (A) The mRNA expression levels of ER stress markers Bip, Chop, and Xbp1s, and adipocytes browning markers Ucp1 and Pparγ in (A) IWAT in vivo of mice injected with vehicle, 10 mg/kg rosiglitazone for 10 days (Rosi), or rosiglitazone and 10 mg/kg tunicamycin (Rosi+Tun) for the last 24 h or (B) IWAT ex vivo after treated with 1 μM tunicamycin for 24 h with or without 100 μM U0126 for 26 h and 25 μM SP600125 for 25 h. (C) Ucp1 protein level, and (D) immunohistochemical staining (IHC) of Ucp1 (scale bar 200 μM) as well as hematoxylin and eosin (H&E) staining (scale bar 500 μM) in IWAT in vivo. (+) indicates the positive control (brown adipose tissue). Cytochrome c oxidase subunit IV (COXIV) were used as loading controls. Data are presented as mean ± S.E.M. (error bars). n = 3–8 in each group. Different letters indicate significant differences (p < 0.05) according to one-way ANOVA followed by Tukey–Kramer multiple comparison test. ** indicates significant differences (p < 0.01) according to unpaired-t test. N.S., not significant.
Ijms 20 00274 g006
Figure 7. ER stress reduced Pparγ protein in IWAT. Pparγ protein level in IWAT of mice injected with vehicle, 10 mg/kg rosiglitazone for 10 days (Rosi), or rosiglitazone and 10 mg/kg tunicamycin (Rosi+Tun) for the last 24 h. β-actin were used as loading controls. Data are presented as mean ± S.E.M. (error bars). n = 3–8 in each group. Different letters indicate significant differences (p < 0.05) according to one-way ANOVA followed by Tukey–Kramer multiple comparison test.
Ijms 20 00274 g007
Table 1. Primers used for RNA quantification.
GeneForwardReverse
Ucp15′-CAAAGTCCGCCTTCAGATCC-3′5′-AGCCGGCTGAGATCTTGTTT-3′
Pparγ5′-GGAGATCTCCAGTGATATCGACCA-3′5′-ACGGCTTCTACGGATCGAAAACT-3′
36b45′-TCCTTCTTCCAGGCTTTGGG-3′5′-GACACCCTCCAGAAAGCGAG-3′
Bip5′-GTTTGCTGAGGAAGACAAAAAGCTC-3′5′-CACTTCCATAGAGTTTGCTGATAAT-3′
Chop5′-GTCCAGCTGGGAGCTGGAAG-3′5′-CTGACTGGAATCTGGAGAG-3′
Table 2. Primers used in ChIP assay.
GeneForwardReverse
Ucp1 enhancer5′-CTCCTCTACAGCGTCACAGAGG-3′5-AGTCTGAGGAAAGGGTTGA-3′

