Molecular Characterization of the Transcription Factors in Susceptible Poplar Infected with Virulent Melampsora larici-populina

 , and
, and 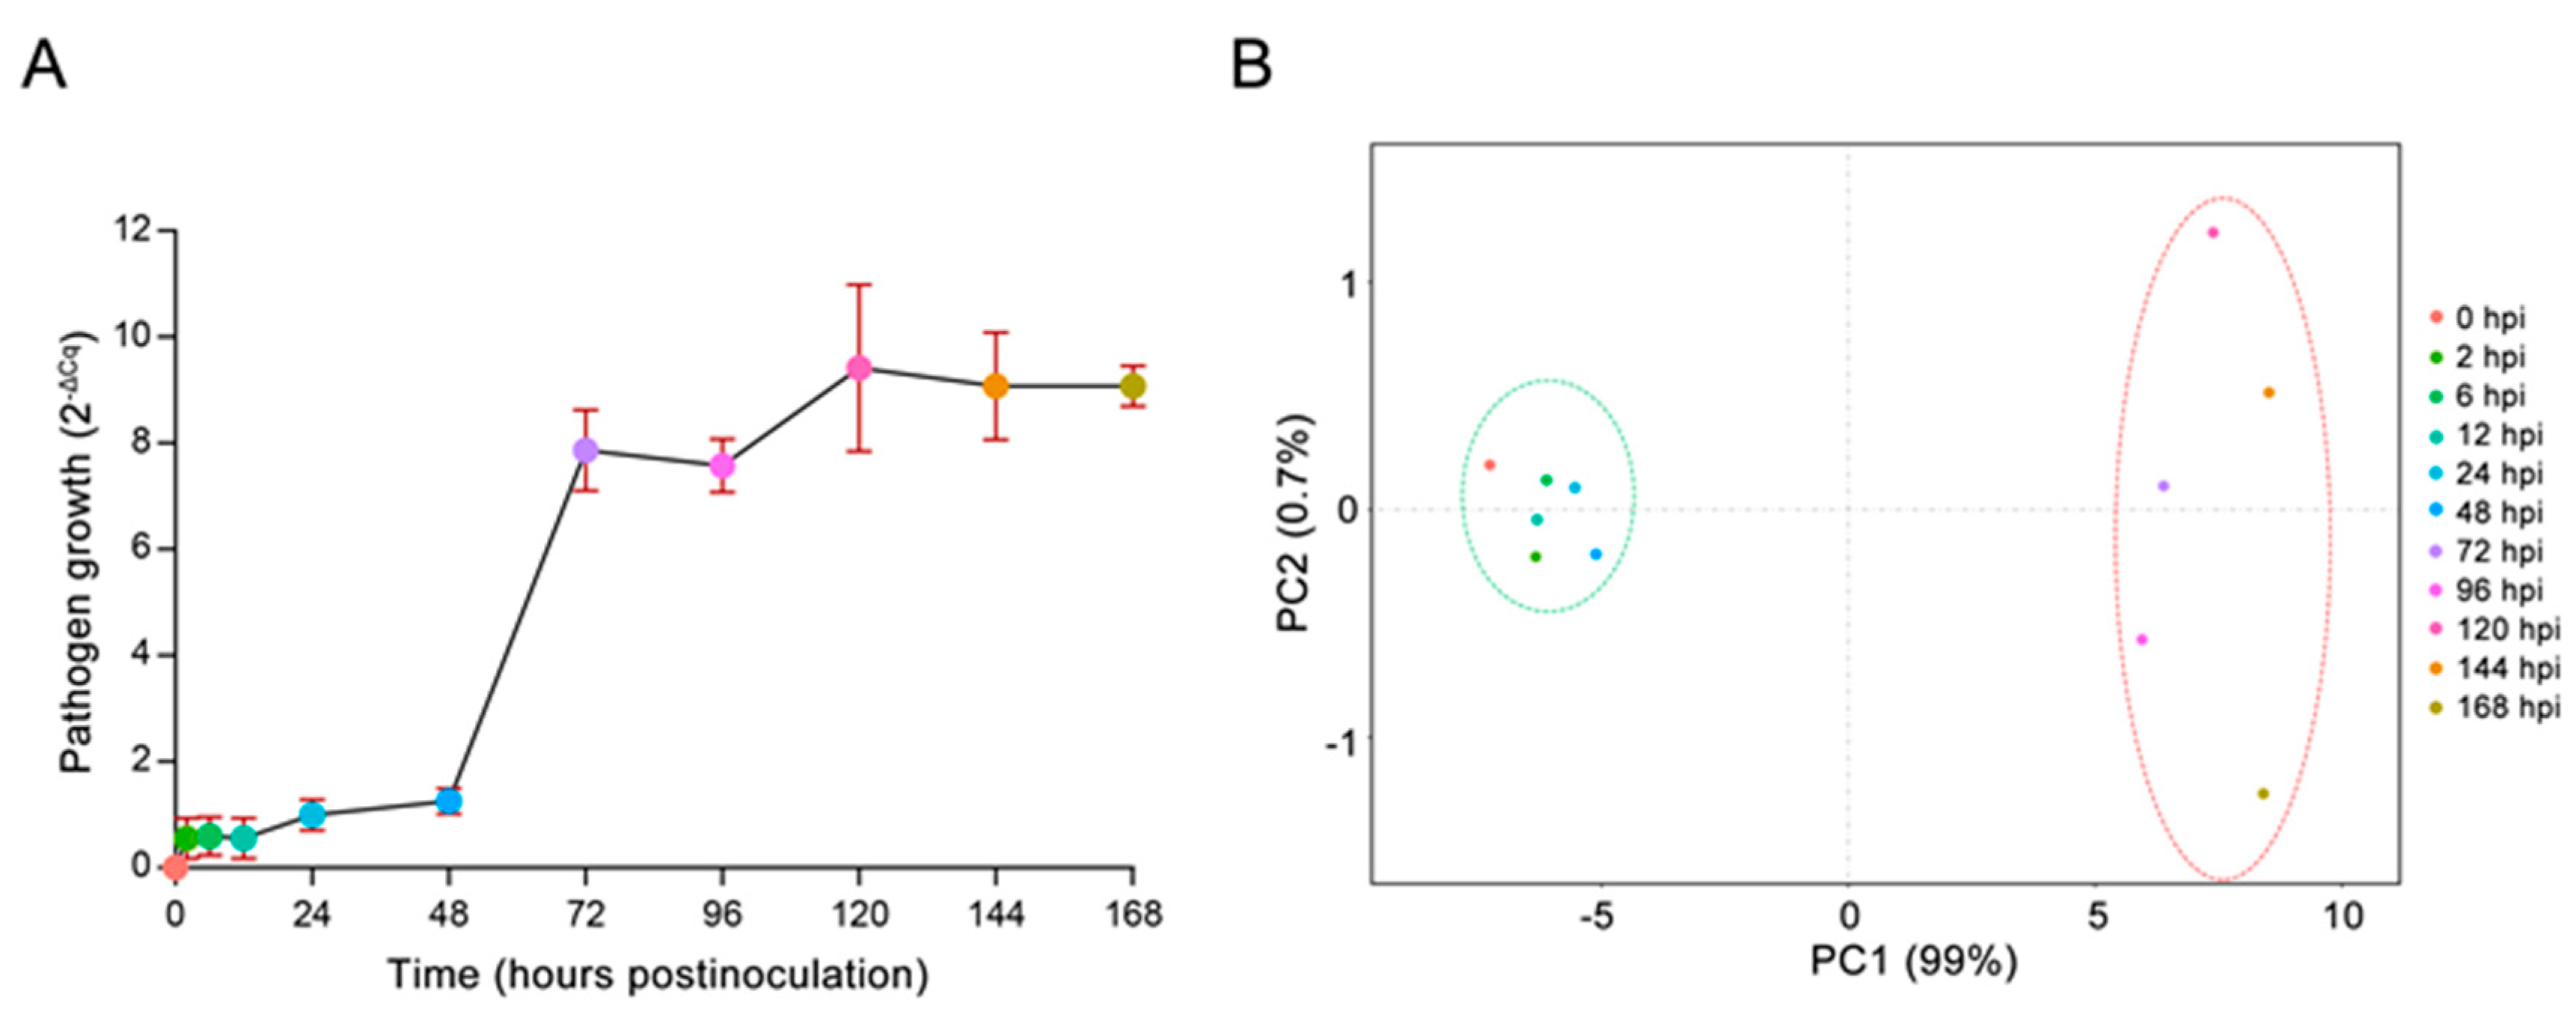
Abstract
1. Introduction
2. Results
2.1. In Vivo Monitoring of E4 Growth
2.2. Identification of Differentially Expressed Poplar Genes Following E4 Infection via Digital Gene Expression Sequencing
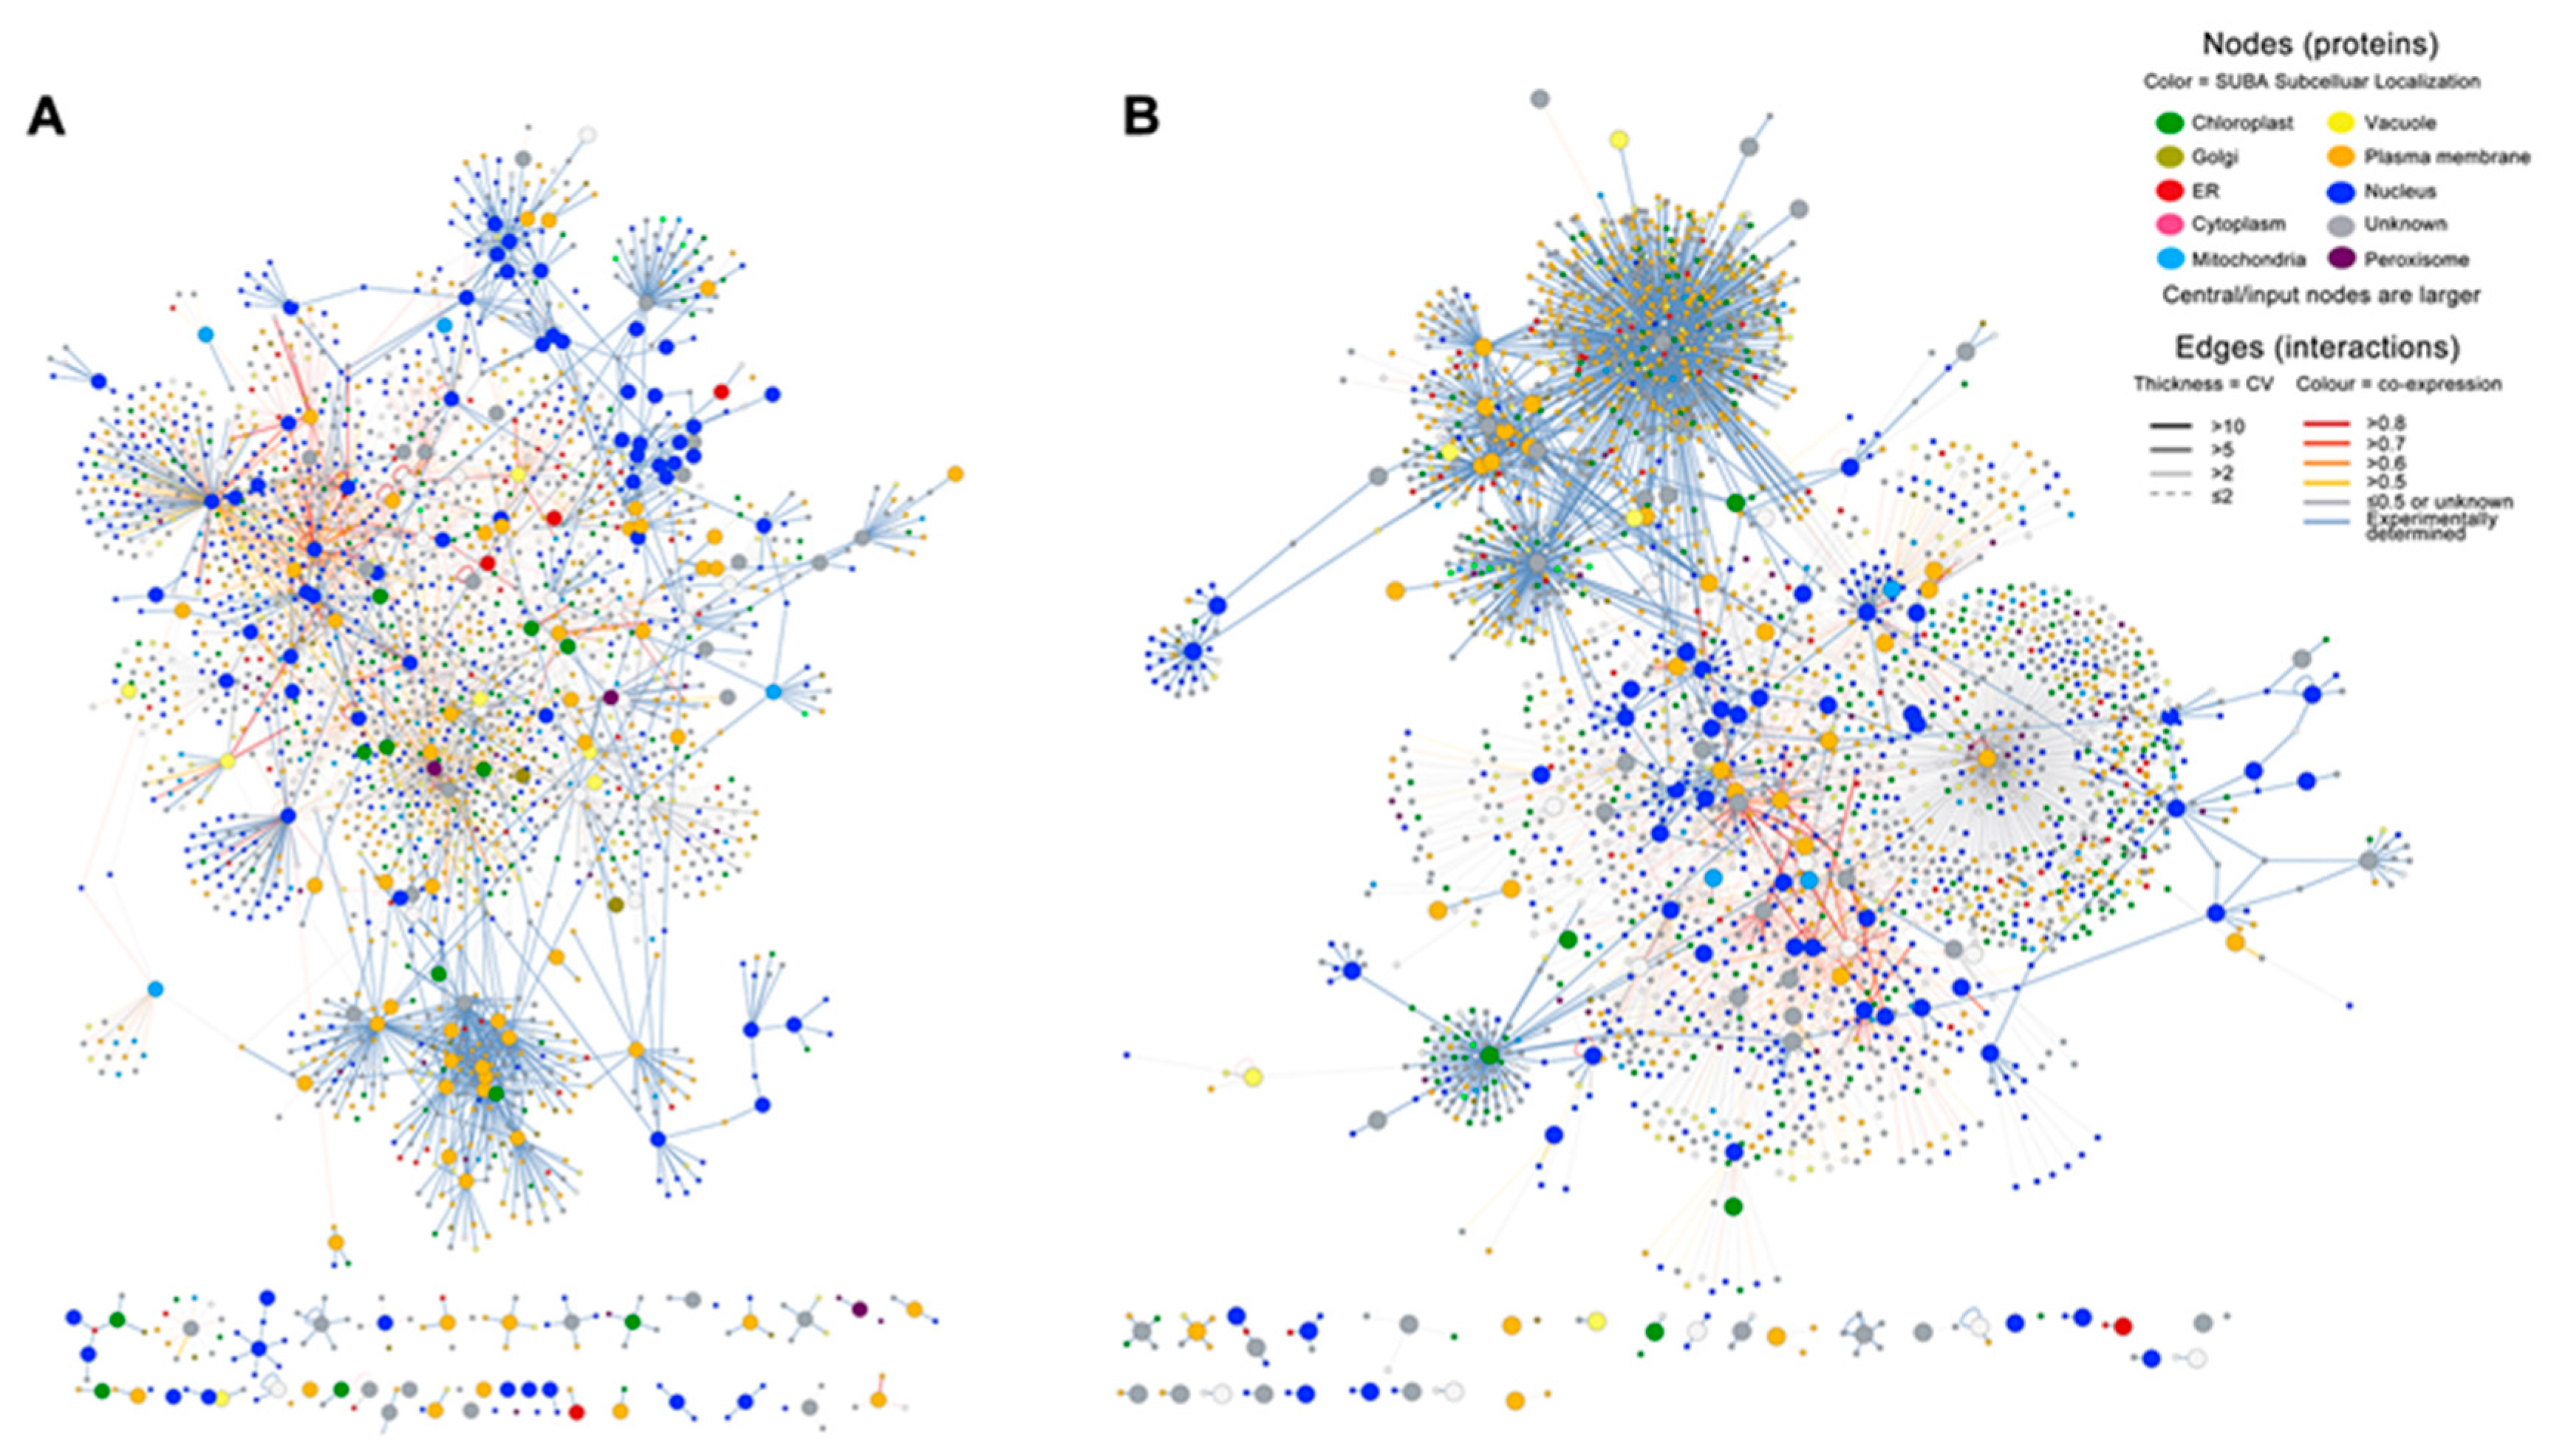
2.3. Infection with E4 Induced a Network Located in the Nucleus
2.4. GO Category Analysis Illustrated an Enrichment of Genes Associated with TFs
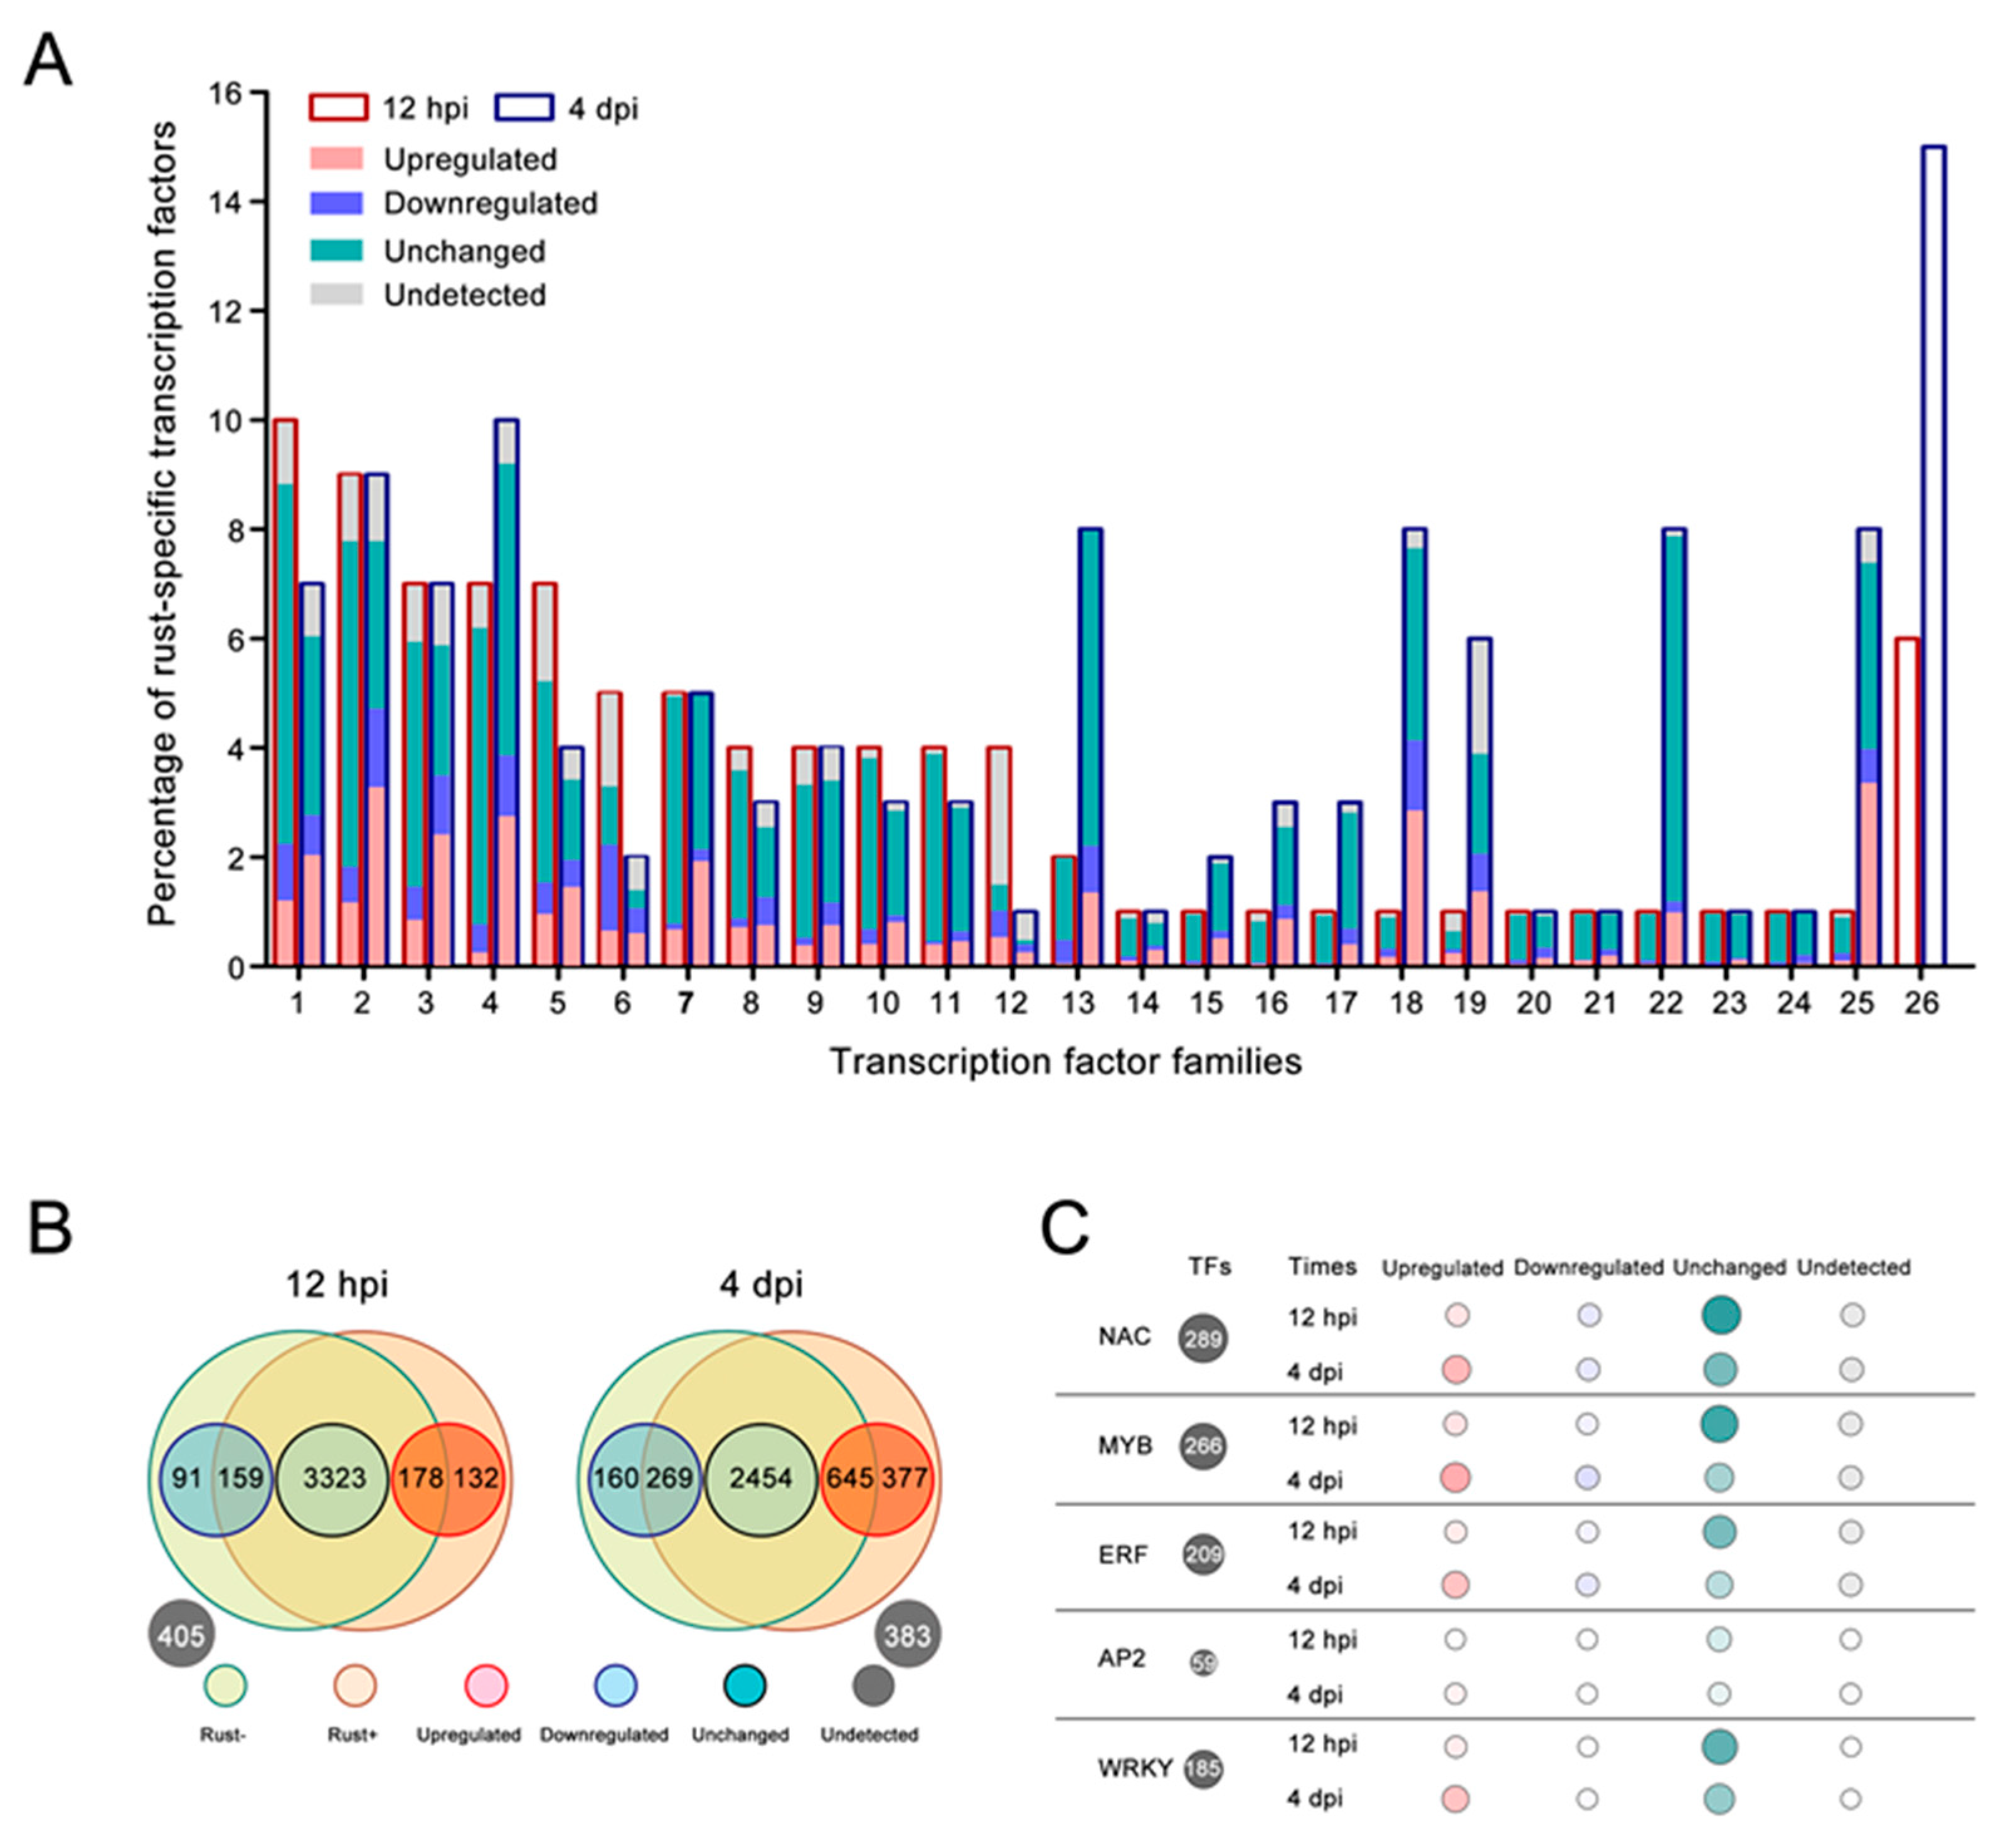
2.5. E4 Infection Did Not Affect Most TFs
2.6. Resistance-Related TF Families Induced by E4 in ‘Robusta’
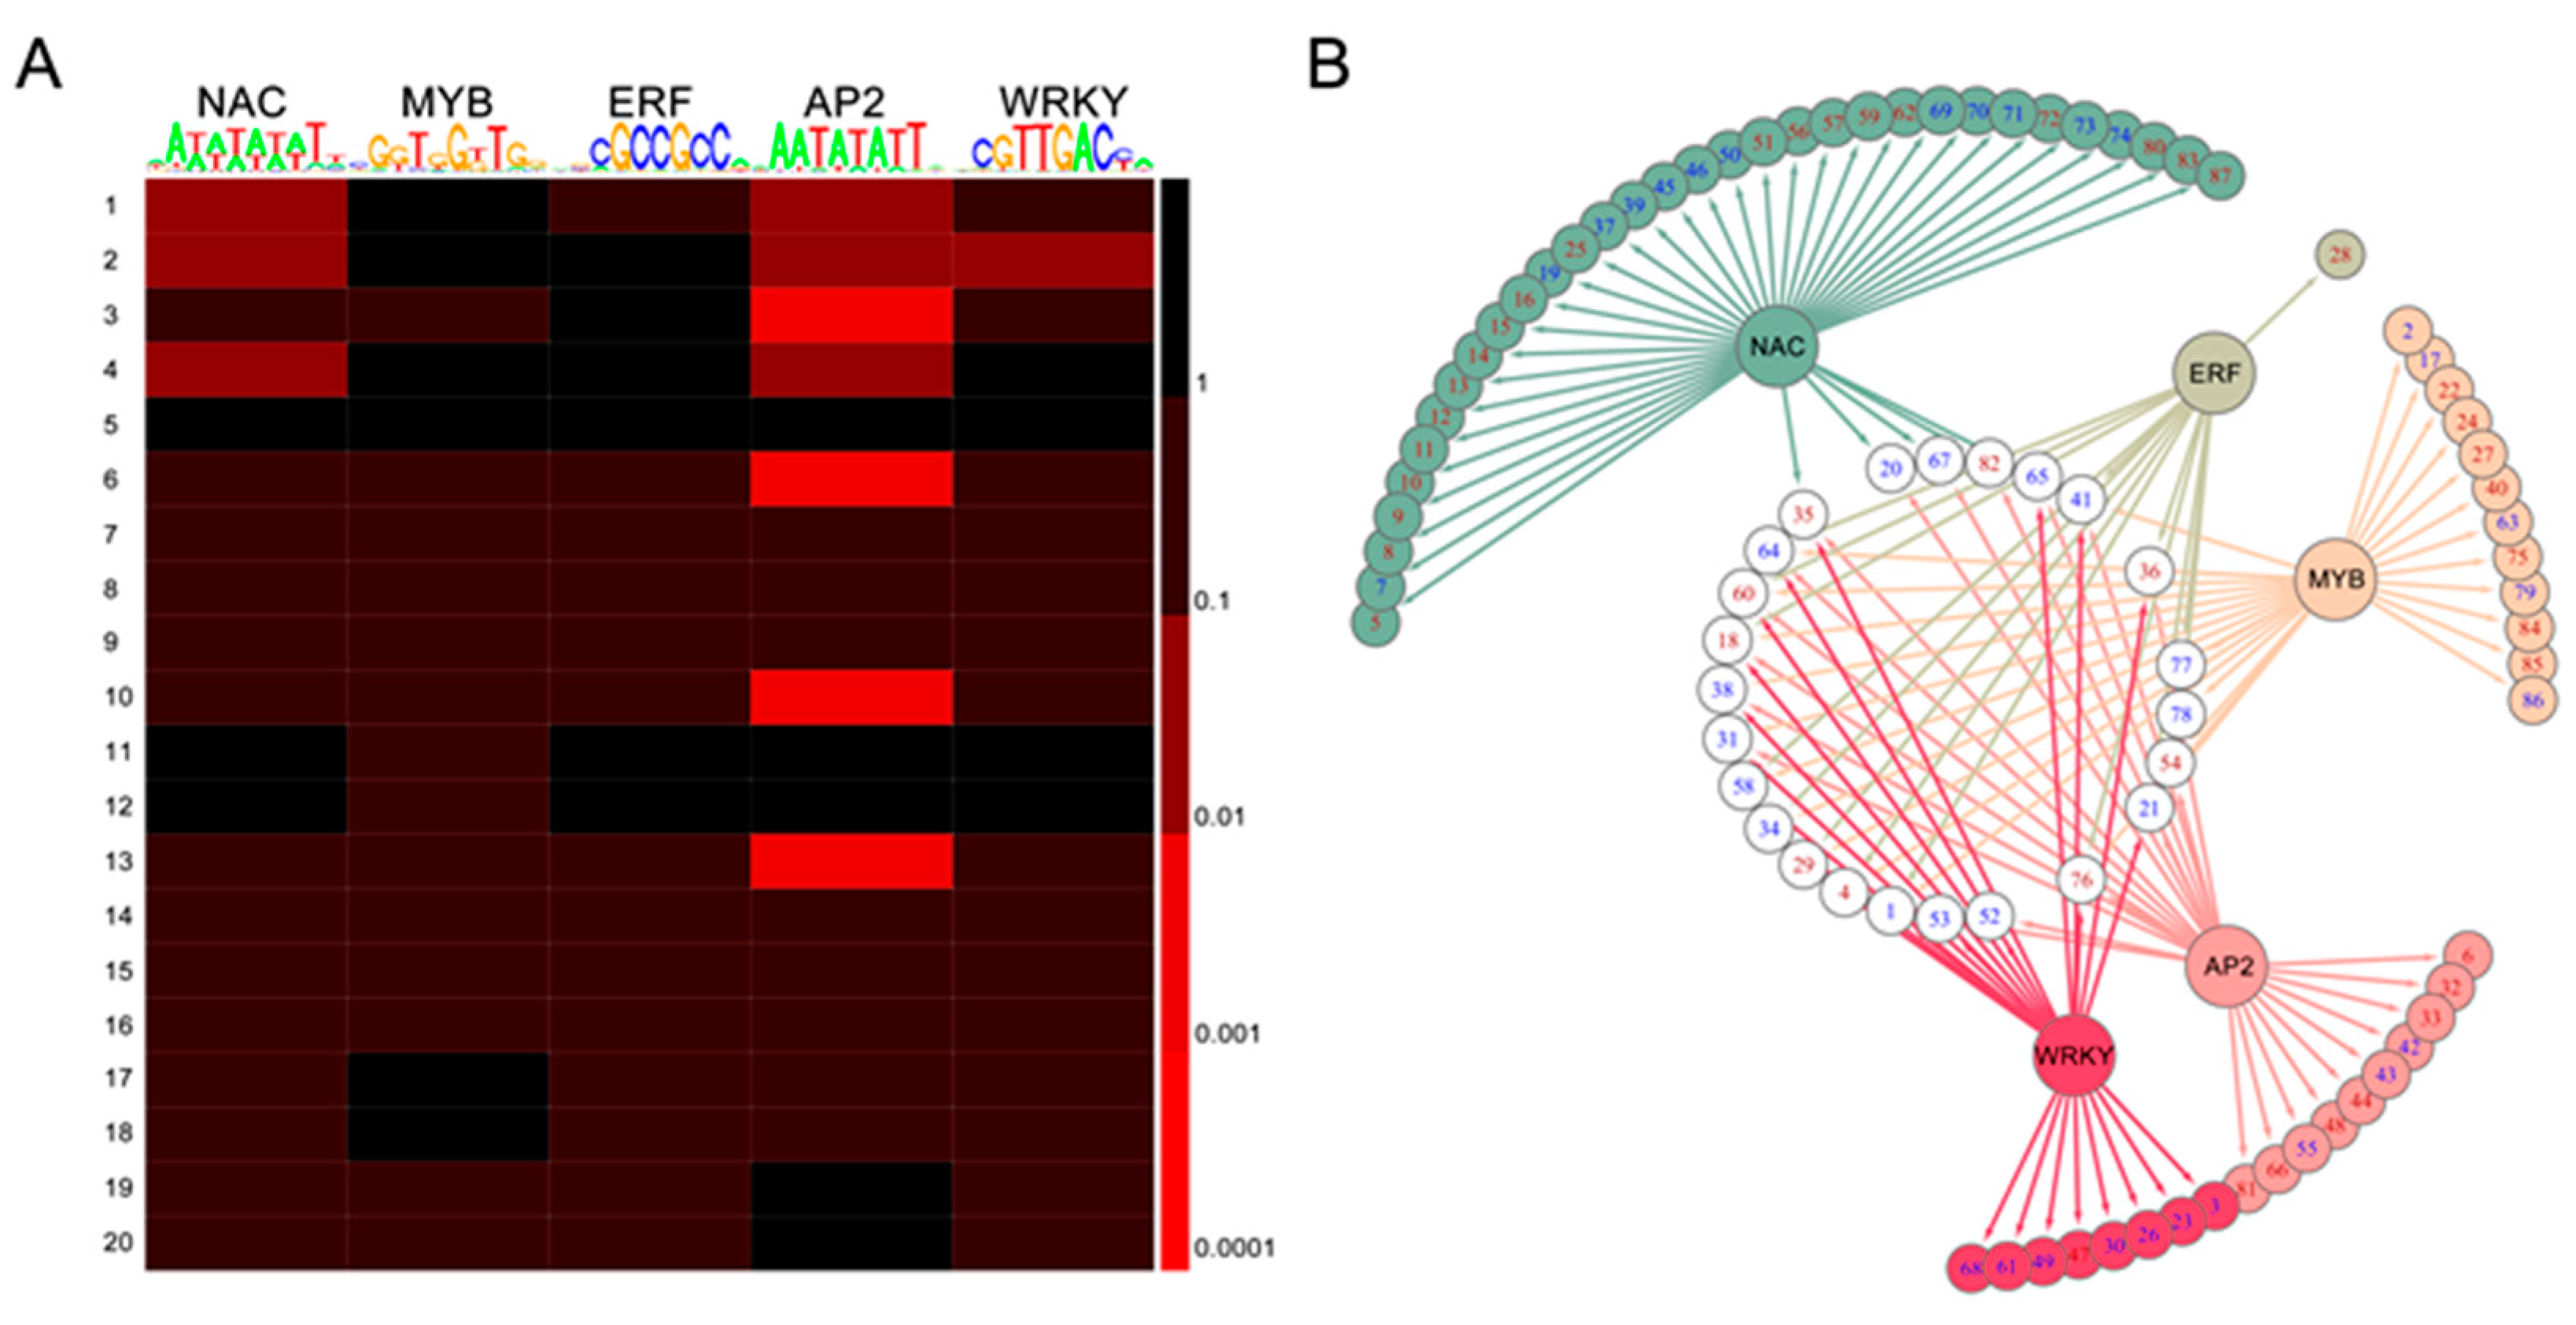
2.7. TF-Binding Motifs Show Specific Enrichment in DEG Groups
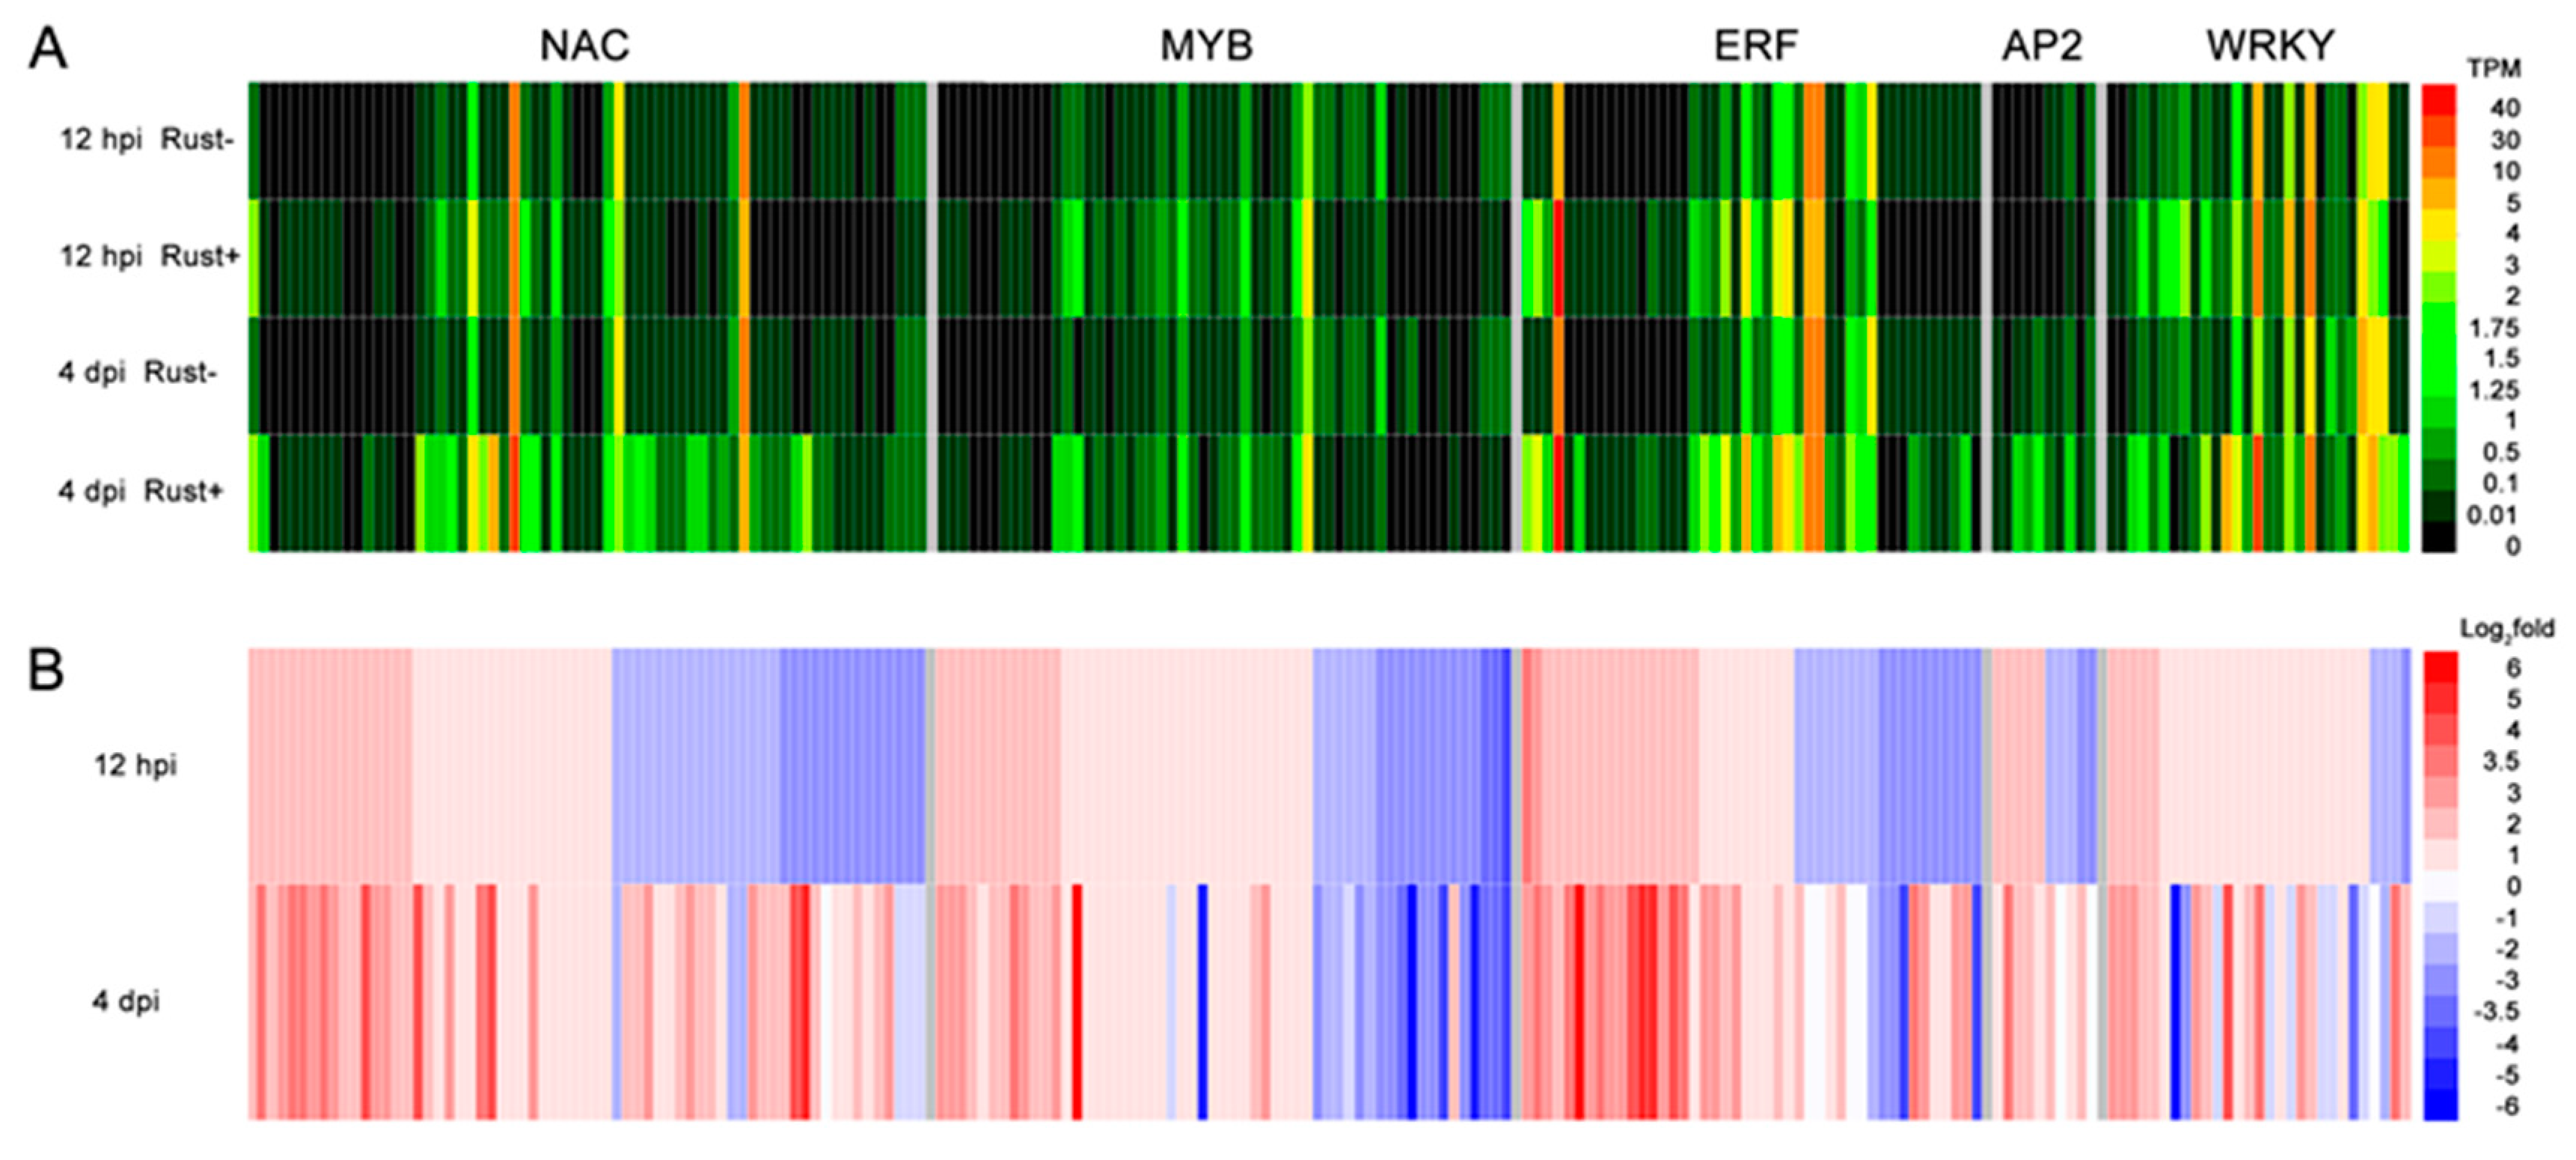
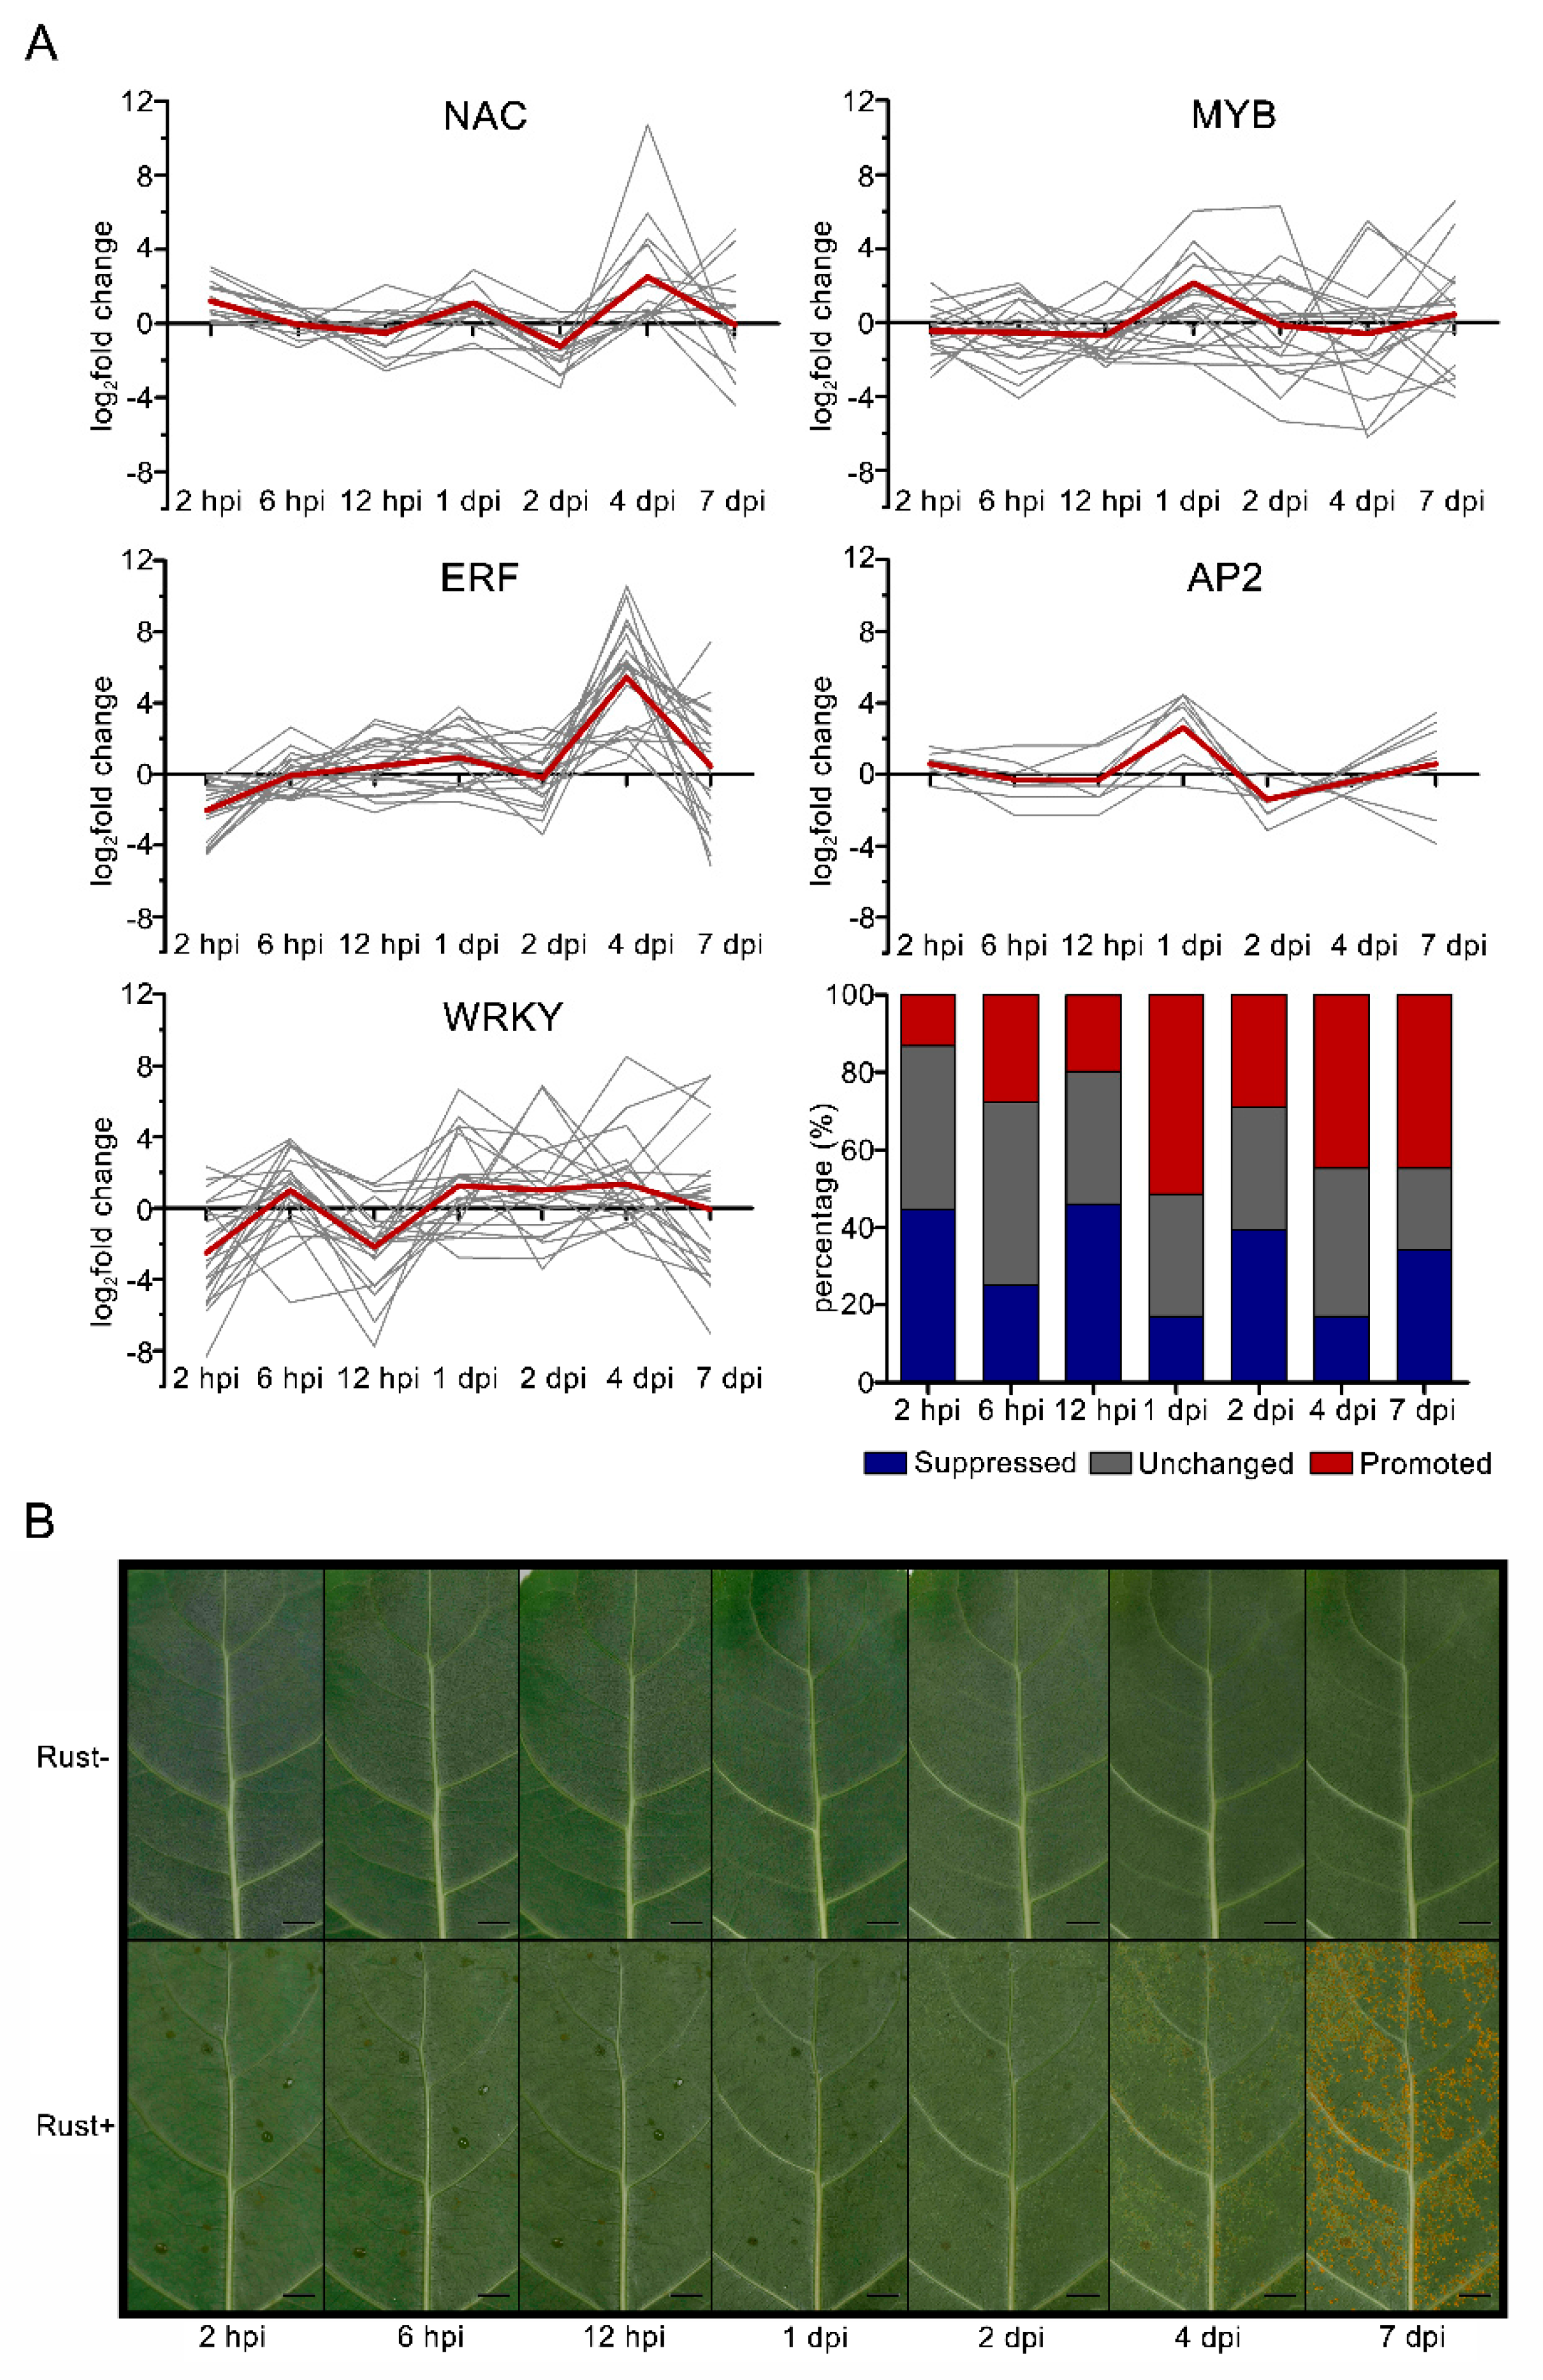
2.8. NAC, MYB, ERF, AP2, and WRKY Genes Did Not Respond to E4 during the Infection Phase
3. Discussion
4. Materials and Methods
4.1. Rust Isolation, Plant Materials, and Inoculation Procedure
4.2. In Vivo Monitoring of Rust Growth
4.3. Total RNA Preparation
4.4. Digital Gene Expression (DGE) Library Preparation and Sequencing
4.5. RT-qPCR of TF Genes
4.6. Bioinformatics and Statistical Analysis
5. Conclusions
Supplementary Materials
Author Contributions
Acknowledgments
Conflicts of Interest
References
- Chisholm, S.T.; Coaker, G.; Day, B.; Staskawicz, B.J. Host-microbe interactions: Shaping the evolution of the plant immune response. Cell 2006, 124, 803–814. [Google Scholar] [CrossRef] [PubMed]
- Gómez-Gómez, L.; Boller, T. Flagellin perception: A paradigm for innate immunity. Trends Plant Sci. 2002, 7, 251–256. [Google Scholar] [CrossRef]
- Zipfel, C.; Oldroyd, G.E.D. Plant signalling in symbiosis and immunity. Nature 2017, 543, 328–336. [Google Scholar] [CrossRef]
- Boller, T.; Felix, G. A renaissance of elicitors: Perception of microbe-associated molecular patterns and danger signals by pattern-recognition receptors. Annu. Rev. Plant Biol. 2009, 60, 379–406. [Google Scholar] [CrossRef] [PubMed]
- Yu, X.; Feng, B.; He, P.; Shan, L. From chaos to harmony: Responses and signaling upon microbial pattern recognition. Annu. Rev. Phytopathol. 2017, 55, 109–137. [Google Scholar] [CrossRef] [PubMed]
- Gómez-Gómez, L.; Bauer, Z.; Boller, T. Both the extracellular leucine-rich repeat domain and the kinase activity of FSL2 are required for flagellin binding and signaling in Arabidopsis. Plant Cell 2001, 13, 1155–1163. [Google Scholar] [CrossRef] [PubMed]
- Zipfel, C.; Kunze, G.; Chinchilla, D.; Caniard, A.; Jones, J.D.G.; Boller, T.; Felix, G. Perception of the bacterial PAMP EF-Tu by the receptor EFR restricts Agrobacterium-mediated transformation. Cell 2006, 125, 749–760. [Google Scholar] [CrossRef] [PubMed]
- Cao, Y.; Liang, Y.; Tanaka, K.; Nguyen, C.T.; Jedrzejczak, R.P.; Joachimiak, A.; Stacey, G. The kinase LYK5 is a major chitin receptor in Arabidopsis and forms a chitin-induced complex with related kinase CERK1. Elife 2014, 3, e03766. [Google Scholar] [CrossRef] [PubMed]
- Lu, D.; Wu, S.; Gao, X.; Zhang, Y.; Shan, L.; He, P. A receptor-like cytoplasmic kinase, BIK1, associates with a flagellin receptor complex to initiate plant innate immunity. Proc. Natl. Acad. Sci. USA 2010, 107, 496–501. [Google Scholar] [CrossRef]
- Meng, X.; Zhang, S. MAPK cascades in plant disease resistance signaling. Annu. Rev. Phytopathol. 2013, 51, 245–266. [Google Scholar] [CrossRef]
- Mizoguchi, T.; Ichimura, K.; Shinozaki, K. Environmental stress response in plants: The role of mitogen-activated protein kinases. Trends Biotechnol. 1997, 15, 15–19. [Google Scholar] [CrossRef]
- Boudsocq, M.; Willmann, M.R.; McCormack, M.; Lee, H.; Shan, L.; He, P.; Bush, J.; Cheng, S.-H.; Sheen, J. Differential innate immune signalling via Ca(2+) sensor protein kinases. Nature 2010, 464, 418–422. [Google Scholar] [CrossRef] [PubMed]
- Pieterse, C.M.J.; Van der Does, D.; Zamioudis, C.; Leon-Reyes, A.; Van Wees, S.C.M. Hormonal modulation of plant immunity. Annu. Rev. Cell Dev. Biol. 2012, 28, 489–521. [Google Scholar] [CrossRef] [PubMed]
- Jones, J.D.; Dangl, J.L. The plant immune system. Nature 2006, 444, 323–329. [Google Scholar] [CrossRef] [PubMed]
- Oñate-Sánchez, L.; Anderson, J.P.; Young, J.; Singh, K.B. AtERF14, a member of the ERF family of transcription factors, plays a nonredundant role in plant defense. Plant Physiol. 2007, 143, 400–409. [Google Scholar] [CrossRef] [PubMed]
- Chen, W.; Provart, N.J.; Glazebrook, J.; Katagiri, F.; Chang, H.-S.; Eulgem, T.; Mauch, F.; Luan, S.; Zou, G.; Whitham, S.A.; et al. Expression profile matrix of Arabidopsis transcription factor genes suggests their putative functions in response to environmental stresses. Plant Cell 2002, 14, 559–574. [Google Scholar] [CrossRef] [PubMed]
- Meng, X.; Xu, J.; He, Y.; Yang, K.-Y.; Mordorski, B.; Liu, Y.; Zhang, S. Phosphorylation of an ERF transcription factor by Arabidopsis MPK3/MPK6 regulates plant defense gene induction and fungal resistance. Plant Cell 2013, 25, 1126–1142. [Google Scholar] [CrossRef] [PubMed]
- Giri, P.; Kumar, A.; Taj, G. In silico-prediction of downstream MYB interacting partners of MAPK3 in Arabidopsis. Bioinformation 2014, 10, 721–725. [Google Scholar] [CrossRef] [PubMed][Green Version]
- Persak, H.; Pitzschke, A. Tight interconnection and multi-level control of Arabidopsis MYB44 in MAPK cascade signalling. PLoS ONE 2013, 8, e57547. [Google Scholar] [CrossRef]
- Pandey, S.P.; Somssich, I.E. The role of WRKY transcription factors in plant immunity. Plant Physiol. 2009, 150, 1648–1655. [Google Scholar] [CrossRef]
- Asai, T.; Tena, G.; Plotnikova, J.; Willmann, M.R.; Chiu, W.-L.; Gomez-Gomez, L.; Boller, T.; Ausubel, F.M.; Sheen, J. MAP kinase signalling cascade in Arabidopsis innate immunity. Nature 2002, 415, 977–983. [Google Scholar] [CrossRef] [PubMed]
- Menke, F.L.H.; Kang, H.-G.; Chen, Z.; Park, J.M.; Kumar, D.; Klessig, D.F. Tobacco transcription factor WRKY1 is phosphorylated by the MAP kinase SIPK and mediates HR-like cell death in tobacco. Mol. Plant Microbe Interact. 2005, 18, 1027–1034. [Google Scholar] [CrossRef] [PubMed]
- Ishihama, N.; Yamada, R.; Yoshioka, M.; Katou, S.; Yoshioka, H. Phosphorylation of the Nicotiana benthamiana WRKY8 transcription factor by MAPK functions in the defense response. Plant Cell 2011, 23, 1153–1170. [Google Scholar] [CrossRef] [PubMed]
- Glazebrook, J. Contrasting mechanisms of defense against biotrophic and necrotrophic pathogens. Annu. Rev. Phytopathol. 2005, 43, 205–227. [Google Scholar] [CrossRef] [PubMed]
- Nimchuk, Z.; Eulgem, T.; Holt, B.F., 3rd; Dangl, J.L. Recognition and response in the plant immune system. Annu. Rev. Genet. 2003, 37, 579–609. [Google Scholar] [CrossRef] [PubMed]
- Pieterse, C.M.J.; Leon-Reyes, A.; Van der Ent, S.; Van Wees, S.C.M. Networking by small-molecule hormones in plant immunity. Nat. Chem. Biol. 2009, 5, 308–316. [Google Scholar] [CrossRef] [PubMed]
- Li, D.; Wang, F.; Wang, C.; Zou, L.; Wang, Z.; Chen, Q.; Niu, C.; Zhang, R.; Ling, Y.; Wang, B. MicroRNA-mediated susceptible poplar gene expression regulation associated with the infection of virulent Melampsora larici-populina. BMC Genom. 2016, 17, 59. [Google Scholar] [CrossRef] [PubMed]
- Hacquard, S.; Petre, B.; Frey, P.; Hecker, A.; Rouhier, N.; Duplessis, S. The poplar-poplar rust interaction: Insights from genomics and transcriptomics. J. Pathog. 2011, 2011, 716041. [Google Scholar] [CrossRef] [PubMed]
- Chen, Q.; Wang, Z.; Li, D.; Wang, F.; Zhang, R.; Wang, J. Molecular characterization of the ERF family in susceptible poplar infected by virulent Melampsora larici-populina. Physiol. Mol. Plant P. 2019, 108, 101437. [Google Scholar] [CrossRef]
- Duplessis, S.; Major, I.; Martin, F.; Séguin, A. Poplar and pathogen interactions: Insights from Populus genome-wide analyses of resistance and defense gene families and gene expression profiling. Crit. Rev. Plant Sci. 2009, 28, 309–334. [Google Scholar] [CrossRef]
- Ng, D.W.; Abeysinghe, J.K.; Kamali, M. Regulating the regulators: The control of transcription factors in plant defense signaling. Int. J. Mol. Sci. 2018, 19, E3737. [Google Scholar] [CrossRef] [PubMed]
- Huot, B.; Yao, J.; Montgomery, B.L.; He, S. Growth-defense tradeoffs in plants: A balancing act to optimize fitness. Mol. Plant 2014, 7, 1267–1287. [Google Scholar] [CrossRef] [PubMed]
- Pei, M.; Ruiz, C.; Bayon, C.; Hunter, T.; Lonsdale, D. Pathogenic variation in poplar rust Melampsora larici-populina from England. Eur. J. Plant Pathol. 2005, 111, 147–155. [Google Scholar] [CrossRef]
- Pei, M.; Ruiz, C.; Bayon, C.; Hunter, T. Rust resistance in Salix to Melampsora larici-epitea. Plant Pathol. 2004, 53, 770–779. [Google Scholar] [CrossRef]
- Pei, M.; Lindegaard, K.; Ruiz, C.; Bayon, C. Rust resistance of some varieties and recently bred genotypes of biomass willows. Biomass Bioenergy 2008, 32, 453–459. [Google Scholar] [CrossRef]
- Hacquard, S.; Veneault-Fourrey, C.; Delaruelle, C.; Frey, P.; Martin, F.; Duplessis, S. Validation of Melampsora larici-populina reference genes for in planta RT-quantitative PCR expression profiling during time-course infection of poplar leaves. Physiol. Mol. Plant P. 2011, 75, 106–112. [Google Scholar] [CrossRef]
- Boyle, B.; Hamelin, R.C.; Séguin, A. In vivo monitoring of obligate biotrophic pathogen growth by kinetic PCR. Appl. Environ. Microbiol. 2005, 71, 1546–1552. [Google Scholar] [CrossRef] [PubMed]
- Rinaldi, C.; Kohler, A.; Frey, P.; Duchaussoy, F.; Ningre, N.; Couloux, A.; Wincker, P.; Thiec, D.L.; Fluch, S.; Martin, F.; et al. Transcript profiling of poplar leaves upon infection with compatible and incompatible strains of the foliar rust Melampsora larici-populina. Plant Physiol. 2007, 144, 347–366. [Google Scholar] [CrossRef]
- Gambino, G.; Perrone, I.; Gribaudo, I. A Rapid and effective method for RNA extraction from different tissues of grapevine and other woody plants. Phytochem. Anal. 2008, 19, 520–525. [Google Scholar] [CrossRef]
- Anders, S.; Huber, W. Differential expression analysis for sequence count data. Genome Biol. 2010, 11, R106. [Google Scholar] [CrossRef]
- Duan, Y.; Jiang, Y.; Ye, S.-l.; Ghani, A.; Karim, A.; Ling, Z.; He, Y.; Yang, S.; Luo, K. PtrWRKY73, a salicylic acid-inducible poplar WRKY transcription factor, is involved in disease resistance in Arabidopsis thaliana. Plant Cell Rep. 2015, 34, 831–841. [Google Scholar] [CrossRef] [PubMed]
- Butler, D.M.; Kokalis-Burelle, N.; Muramoto, J.; Shennan, C.; Mccollum, T.G.; Rosskopf, E.N. Impact of anaerobic soil disinfestation combined with soil solarization on plant–parasitic nematodes and introduced inoculum of soilborne plant pathogens in raised-bed vegetable production. Crop Protect. 2012, 39, 33–40. [Google Scholar] [CrossRef]
- Livak, K.J.; Schmittgen, T.D. Analysis of relative gene expression data using real-time quantitative PCR and the 2(-Delta Delta C(T)) Method. Methods 2001, 25, 402–408. [Google Scholar] [CrossRef]
- Benjamini, Y.; Yekutieli, D. The control of the false discovery rate in multiple testing under dependency. Ann. Statist. 2001, 29, 1165–1188. [Google Scholar]
- Gocal, G.F.W.; Sheldon, C.C.; Gubler, F.; Moritz, T.D.; Bagnall, D.J.; MacMillan, C.; Li, S.; Parish, R.W.; Dennis, E.S.; Weigel, D.; et al. GAMYB-like genes, flowering, and gibberellin signaling in Arabidopsis. Plant Physiol. 2001, 127, 1682–1693. [Google Scholar] [CrossRef] [PubMed]
- Ashburner, M.; Ball, C.A.; Blake, J.A.; Botstein, D.; Butler, H.; Cherry, J.M.; Davis, A.P.; Dolinski, K.; Dwight, S.S.; Eppig, J.T.; et al. Gene Ontology: Tool for the unification of biology. Nat. Genet. 2000, 25, 25–29. [Google Scholar] [CrossRef]


© 2019 by the authors. Licensee MDPI, Basel, Switzerland. This article is an open access article distributed under the terms and conditions of the Creative Commons Attribution (CC BY) license (http://creativecommons.org/licenses/by/4.0/).
Share and Cite
Chen, Q.; Wang, J.; Li, D.; Wang, Z.; Wang, F.; Zhang, R. Molecular Characterization of the Transcription Factors in Susceptible Poplar Infected with Virulent Melampsora larici-populina. Int. J. Mol. Sci. 2019, 20, 4806. https://doi.org/10.3390/ijms20194806
Chen Q, Wang J, Li D, Wang Z, Wang F, Zhang R. Molecular Characterization of the Transcription Factors in Susceptible Poplar Infected with Virulent Melampsora larici-populina. International Journal of Molecular Sciences. 2019; 20(19):4806. https://doi.org/10.3390/ijms20194806
Chicago/Turabian StyleChen, Qiaoli, Jianan Wang, Danlei Li, Zhiying Wang, Feng Wang, and Ruizhi Zhang. 2019. "Molecular Characterization of the Transcription Factors in Susceptible Poplar Infected with Virulent Melampsora larici-populina" International Journal of Molecular Sciences 20, no. 19: 4806. https://doi.org/10.3390/ijms20194806
APA StyleChen, Q., Wang, J., Li, D., Wang, Z., Wang, F., & Zhang, R. (2019). Molecular Characterization of the Transcription Factors in Susceptible Poplar Infected with Virulent Melampsora larici-populina. International Journal of Molecular Sciences, 20(19), 4806. https://doi.org/10.3390/ijms20194806