Article

Enhanced Function and Overexpression of Metabotropic Glutamate Receptors 1 and 5 in the Spinal Cord of the SOD1G93A Mouse Model of Amyotrophic Lateral Sclerosis during Disease Progression

1
Department of Pharmacy, Unit of Pharmacology and Toxicology, University of Genoa, 16148 Genova, Italy
2
Department of Pharmacy, Unit of Pharmacology and Toxicology and Center of Excellence for Biomedical Research (CEBR), University of Genoa, 16132 Genova, Italy
3
Institute of Biophysics, National Research Council (CNR), 16149 Genova, Italy
4
Istituto di Ricovero e Cura a Carattere Scientifico (IRCCS) Ospedale Policlinico San Martino, 16132 Genova, Italy
*
Author to whom correspondence should be addressed.
These authors contribute equally to this work.
Int. J. Mol. Sci. 2019, 20(18), 4552; https://doi.org/10.3390/ijms20184552
Submission received: 18 July 2019 / Revised: 26 August 2019 / Accepted: 12 September 2019 / Published: 13 September 2019
(This article belongs to the Special Issue Amyotrophic Lateral Sclerosis: Highlights of Its Complexity)

Abstract

:
Glutamate (Glu)-mediated excitotoxicity is a major cause of amyotrophic lateral sclerosis (ALS) and our previous work highlighted that abnormal Glu release may represent a leading mechanism for excessive synaptic Glu. We demonstrated that group I metabotropic Glu receptors (mGluR1, mGluR5) produced abnormal Glu release in SOD1G93A mouse spinal cord at a late disease stage (120 days). Here, we studied this phenomenon in pre-symptomatic (30 and 60 days) and early-symptomatic (90 days) SOD1G93A mice. The mGluR1/5 agonist (S)-3,5-Dihydroxyphenylglycine (3,5-DHPG) concentration dependently stimulated the release of [3H]d-Aspartate ([3H]d-Asp), which was comparable in 30- and 60-day-old wild type mice and SOD1G93A mice. At variance, [3H]d-Asp release was significantly augmented in 90-day-old SOD1G93A mice and both mGluR1 and mGluR5 were involved. The 3,5-DHPG-induced [3H]d-Asp release was exocytotic, being of vesicular origin and mediated by intra-terminal Ca2+ release. mGluR1 and mGluR5 expression was increased in Glu spinal cord axon terminals of 90-day-old SOD1G93A mice, but not in the whole axon terminal population. Interestingly, mGluR1 and mGluR5 were significantly augmented in total spinal cord tissue already at 60 days. Thus, function and expression of group I mGluRs are enhanced in the early-symptomatic SOD1G93A mouse spinal cord, possibly participating in excessive Glu transmission and supporting their implication in ALS. Please define all abbreviations the first time they appear in the abstract, the main text, and the first figure or table caption.

1. Introduction

Amyotrophic lateral sclerosis (ALS), originally described by Charcot in 1869, is a fatal progressive neurodegenerative disease characterized by damage and death of upper and lower motor neurons (MNs), leading to muscle wasting, weakness, and spasticity [1]. Although primary symptoms of ALS are associated with motor dysfunction, up to 50% of patients develop cognitive and/or behavioral impairment during the course of the disease and 13% present frontotemporal dementia [2,3,4]. The incidence of the disease is approximately 3 cases per 100,000 individuals per year, with a male:female ratio of almost 2 [5]. To date, no drug is available to effectively counteract ALS progression. Only two drugs have been approved for therapy: riluzole, which improves survival and quality of life only modestly [6], and, very recently, edaravone, which shows some efficacy only in patients at the early stage of the disease [7].
ALS can be sporadic (sALS), representing more than 90% of cases, or familial (fALS), which is genetically transmissible and accounts for about 10% of cases. More than 30 genes involved in fALS have been identified [8,9] and four of them, chromosome 9 open reading frame 72 (C9ORF72), superoxide dismutase 1 (SOD1), TAR DNA-binding protein 43 (TARDBP), and mutations in fused in sarcoma protein (FUS), are responsible for more than 70% of cases [10]. The pathogenesis of ALS is still unknown, although clinical symptoms and disease progression are similar in sALS and fALS, indicating that common mechanisms may be involved. Vulnerability of MNs has been ascribed to numerous causes, including protein misfolding, mitochondrial dysfunction, oxidative damage, defective axonal transport, glutamate-mediated excitotoxicity, insufficient growth factor signaling, and inflammation [11,12,13,14]. Moreover, the damage of MNs is enhanced by damage occurring in non-neuronal neighboring cells, such as astrocytes and microglia, thus accelerating disease progression [15,16,17].
High levels of extracellular glutamate (Glu) have been detected in an elevated percentage of sALS and fALS patients [18,19,20], suggesting that excitotoxicity plays an important role in motor neuron degeneration. Impaired glutamate clearance, due to a reduced expression of the astrocyte Glu transporters, has been proposed as the cause triggering excessive synaptic Glu [21,22,23,24]. However, Glu transport defects do not seem to be the only origin of excessive extracellular Glu, since it has been shown that the spontaneous release of Glu and that induced by depolarization [25], by group I metabotropic Glu receptors (mGluRs) [26] or GABA and glycine hetero-transporter [27,28,29] activation, is abnormal in the mouse model of human ALS expressing a high copy number of mutant human superoxide dismutase 1 (SOD1) with a Gly93Ala substitution (SOD1G93A) [30].
In particular, we have demonstrated that group I mGluRs (including mGluR1 and mGluR5) produced abnormal Glu release in the spinal cord of 120-day-old SOD1G93A mice, which represent the late stage of the disease. Concentrations of the mGluR1/5 agonist (S)-3,5-Dihydroxyphenylglycine (3,5-DHPG) > 0.3 μM stimulated the release of Glu to the same extent in the control and SOD1G93A mice. At variance, concentrations ≤ 0.3 μM of 3,5-DHPG increased Glu release in SOD1G93A mice only. Both mGluR1 and mGluR5 were involved, with mGluR5 being preferentially responsible for the high potency effects of 3,5-DHPG. The release of Glu induced by 3,5-DHPG was exocytotic in nature and it was sustained by intra-terminal Ca2+ release through inositol 1,4,5-triphosphate (IP3)-sensitive Ca2+ channels.
Interestingly, the abnormal Glu release induced by hetero-transporter activation or axon terminal membrane depolarization in SOD1G93A mice was also detectable before symptoms occur, as early as 30 days of life [31,32], suggesting that it can represent a cause rather than a consequence of disease progression. This precociousness has not been explored in the case of Glu release induced by activation of group I mGluRs. Therefore, in the present work, we investigated the modulation of Glu release by mGluR1 and mGluR5 and the expression of these receptors in the SOD1G93A spinal cord at the pre-symptomatic (30 and 60 days) and early-symptomatic (90 days) stages of the disease.

2. Results

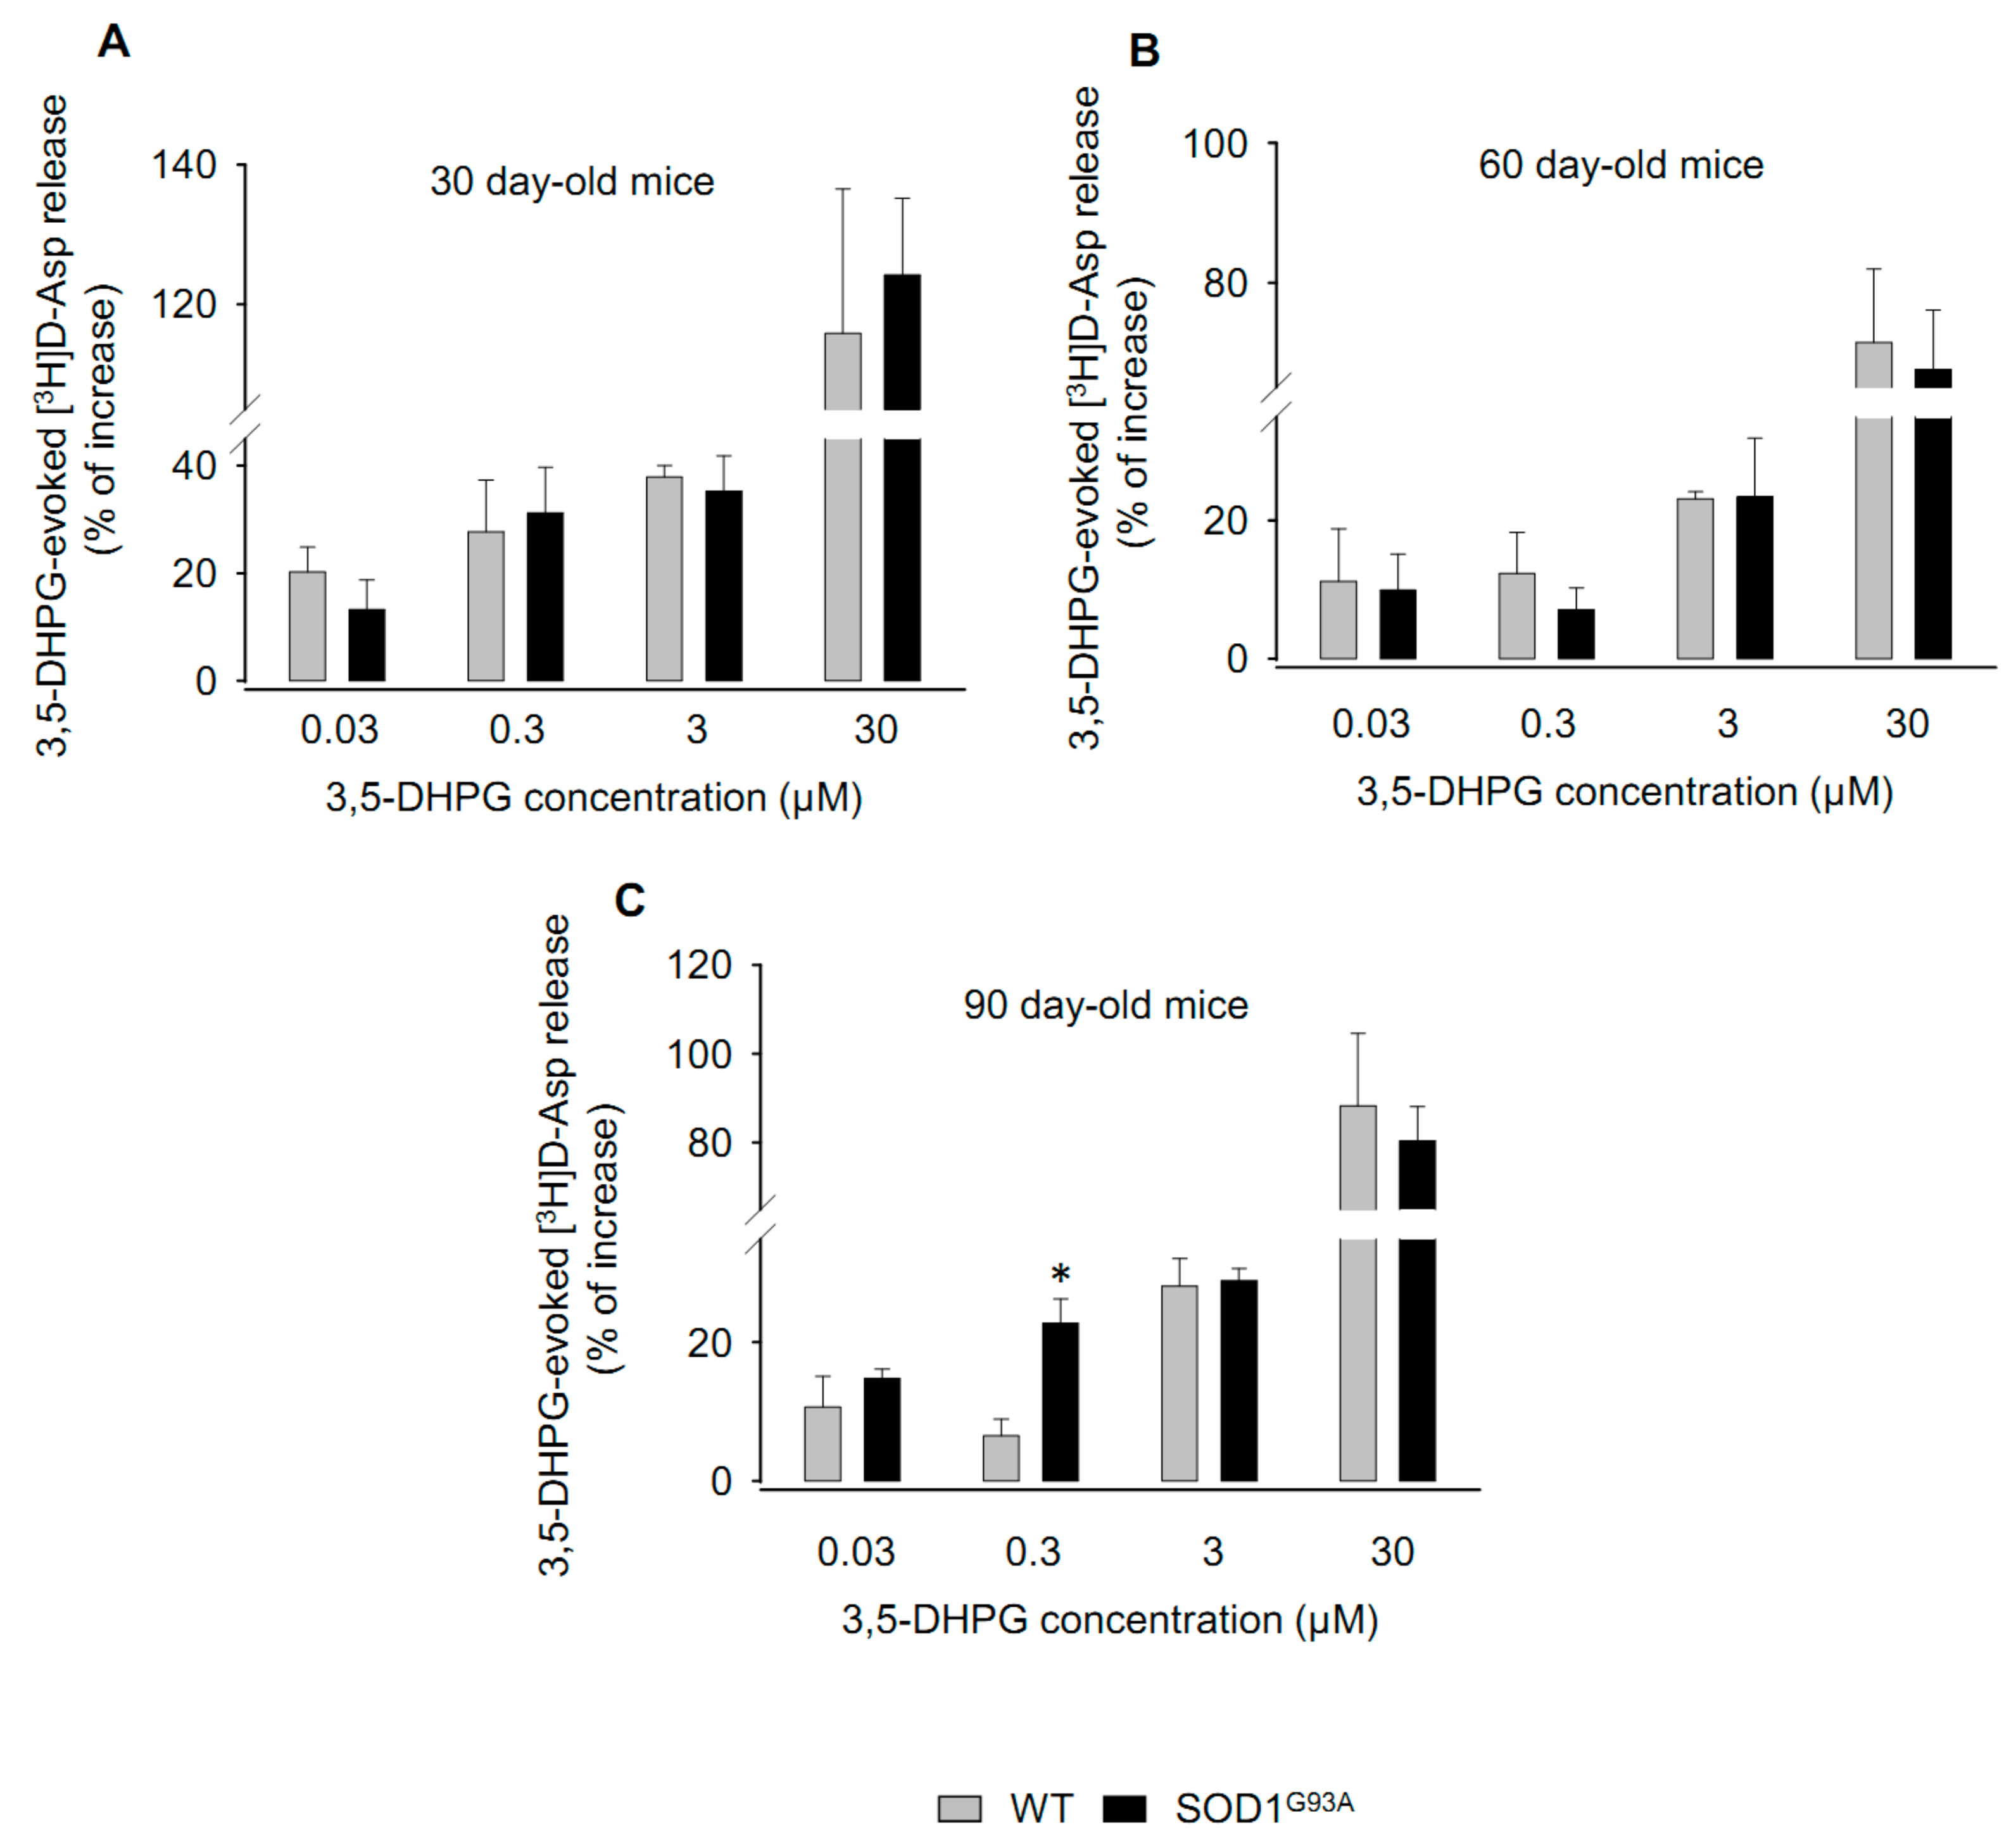
2.1. Effects of 3,5-DHPG on [3H]d-Aspartate Release during Disease Progression

Here, we studied the release of [3H]d-Aspartate ([3H]d-Asp) induced by the mixed mGluR1/5 agonist 3,5-DHPG [33] from 30-, 60-, and 90-day-old WT and SOD1G93A mouse synaptosomes in superfusion. The amount of tritium loaded into the preparation per mg of protein did not vary under the different conditions tested. The exposure of spinal cord synaptosomes to 3,5-DHPG (0.03–30 µM) concentrations dependently stimulated the release of [3H]d-Asp in wild type mice (WT) and SOD1G93A mice at the three disease stages (Figure 1A–C). No differences were observed between WT and SOD1G93A mice at 30 (Figure 1A; F(1,3,3,33) = 0.189) or 60 (Figure 1B; F(1,3,3,17) = 0.0423) days of age. Also, the exposure of 90-day-old spinal cord synaptosomes to increasing concentrations of 3,5-DHPG generated similar effects in WT and SOD1G93A mice, except at 0.3 µM 3,5-DHPG, which produced a significant increase of the release in SOD1G93A with respect to WT mice (Figure 1C; p < 0.05; F(1,3,3,48) = 1.502).
These data show that the 3,5-DHPG-induced [3H]d-Asp release is abnormally increased in 90-day-old SOD1G93A mice, but not at earlier disease stages.

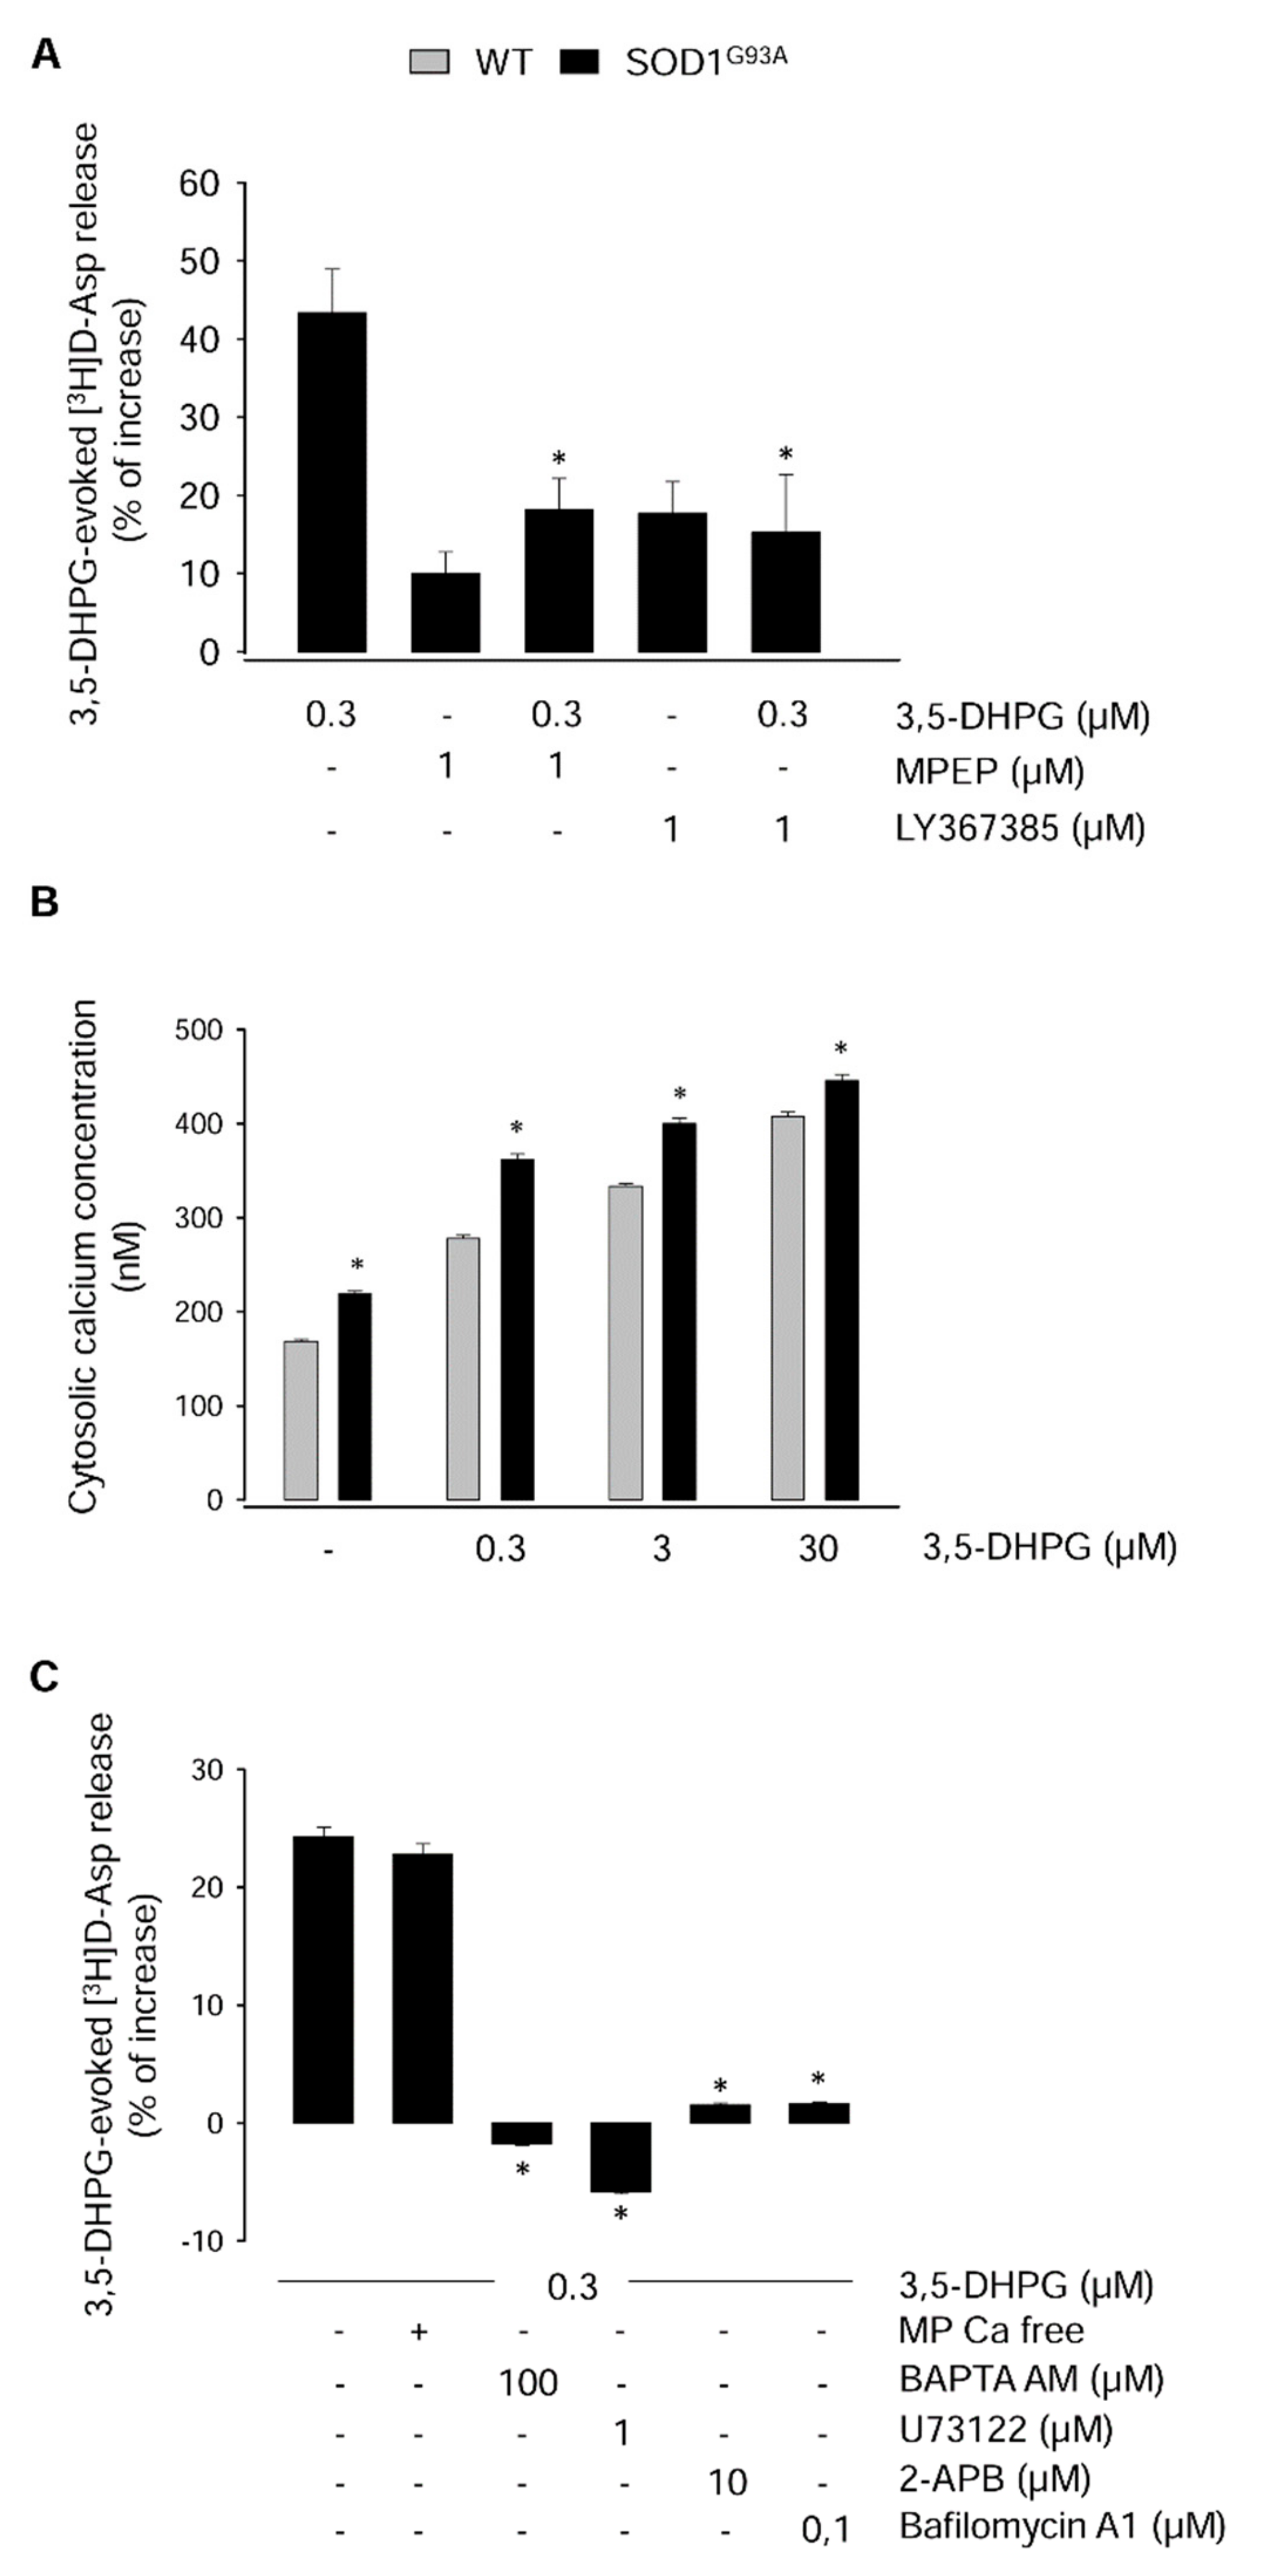
2.2. Mechanisms Underlying the Modulation of [3H]d-Aspartate Release by 3,5-DHPG in 90-Day-Old Mice

In order to define the mGlu receptor subtype involved in the abnormal [3H]d-Asp release induced by 0.3 µM 3,5-DHPG in 90-day-old SOD1G93A mice, we tested the competitive mGluR1 antagonist (S)-(+)-a-amino-4-carboxy-2-methylbenzeneacetic acid (LY367385) [34] and the non-competitive mGluR5 antagonist 2-methyl-6-(phenylethynyl)pyridine (MPEP) [35] on the 3,5-DHPG-releasing effect.
The 0.3 µM 3,5-DHPG-induced [3H]d-Asp release was strongly reduced by both antagonists, used at the concentration of 1 µM (Figure 2A; p < 0.05; F(4,9) = 8.422), thus indicating that both mGluR1 and mGluR5 contribute to the abnormal release of [3H]d-Asp observed at this disease stage.
Since mGluR1 and mGluR5 induce Ca2+ mobilization form intracellular stores [36], we studied the cytosolic calcium concentration ([Ca2+]C) in spinal cord synaptosomes from 90-day-old WT and SOD1G93A mice, under basal conditions and following exposure to 3,5-DHPG by labelling with the fura-2-acetoxymethyl ester (FURA 2-AM) fluorescent dye. As shown in Figure 2B, the [Ca2+]C in the absence of 3,5-DHPG was significantly more elevated in synaptosomes from SOD1G93A with respect to WT mice (p < 0.001; F(1,3,3,30) = 11.154). Exposure to 0.3, 3, or 30 µM 3,5-DHPG induced a concentration-dependent increase of [Ca2+]C in both mouse strains (p < 0.001; F(1,3,3,30) = 11.154). 3,5-DHPG produced a further [Ca2+]C increase, leading to a total [Ca2+]C that was significantly greater in SOD1G93A mice than that measured in WT mice (p < 0.001; F(1,3,3,30) = 11.154).
In order to verify the origin of Ca2+ producing the increase of [Ca2+]C, we analyzed the release of [3H]d-Asp in spinal cord synaptosomes from 90-day-old SOD1G93A mice exposed to 0.3 µM 3,5-DHPG in the absence of external Ca2+, as well as in Ca2+-containing standard medium but in synaptosomes incubated in the presence of 100 µM 1,2-bis(2-aminophenoxy)ethane-N,N,N′,N′-tetraacetic acid tetrakis acetoxymethyl ester (BAPTA-AM) prior to release experiments, to block intracellular Ca2+ [37], or exposed in superfusion to the phospholipase C inhibitor 1-[6-[((17β)-3-methoxyestra-1,3,5[10]-trien-17-yl)amino]hexyl]-1H-pyrrole-2,5-dione (U73122) (1 µM) [38] or to the IP3 receptor blocker 2-aminoethoxydiphenyl borate (2-APB) (10 µM) [39]. Figure 2C shows that omission of Ca2+ in the superfusion medium did not reduce the release of [3H]d-Asp evoked by 3,5-DHPG.
On the contrary, the effect of 3,5-DHPG on [3H]d-Asp release was abolished by BAPTA-AM in the presence of external Ca2+, by 2-APB (p < 0.001; F(5,28) = 567.116), or by U73122 (p < 0.001; F(5,28) = 567.116). Figure 2C also shows that the effect of 0.3 µM 3,5-DHPG was occluded by pre-incubation of synaptosomes with 0.1 µM bafilomycin A1, a drug that depletes the vesicular neurotransmitter content [40] (p < 0.001; F(5,28) = 567.116).
These data demonstrate that [Ca2+]C is abnormally augmented in spinal cord synaptosomes from 90-day-old SOD1G93A mice because of its release from endoplasmic reticulum stores through IP3 receptor channels and that the increase of the release of [3H]d-Asp by 0.3 µM 3,5-DHPG is exocytotic in nature.

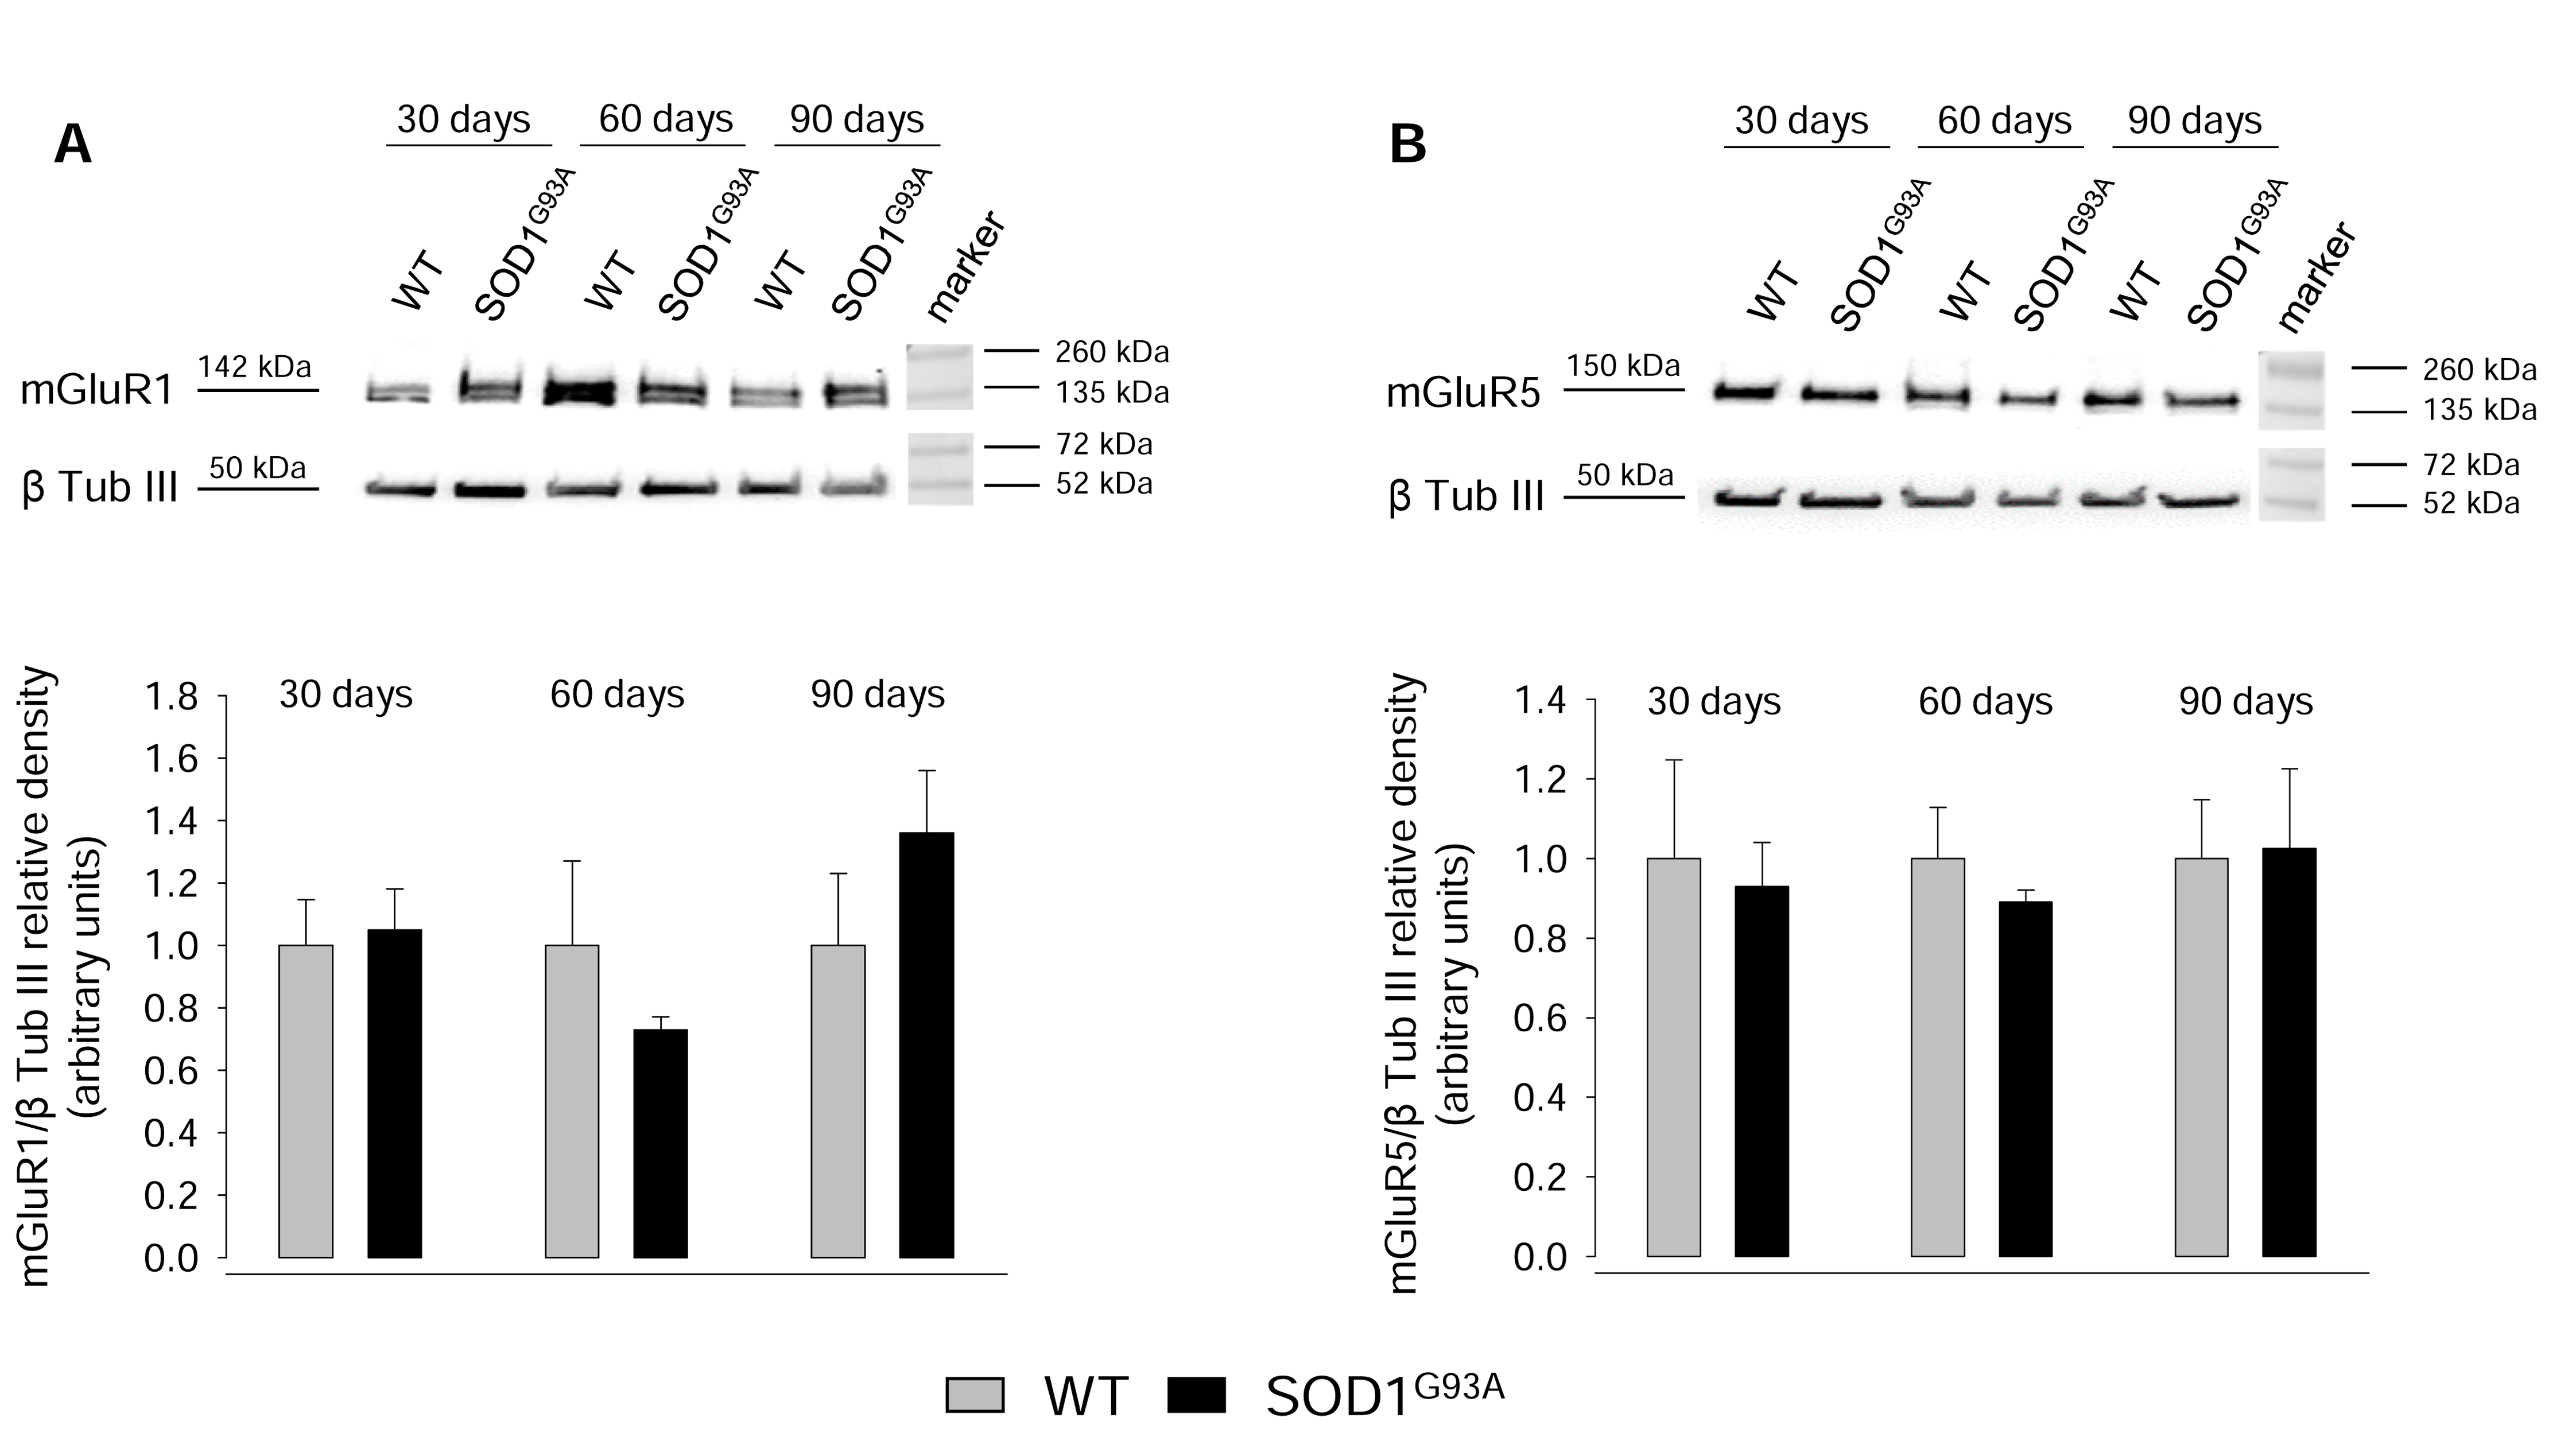
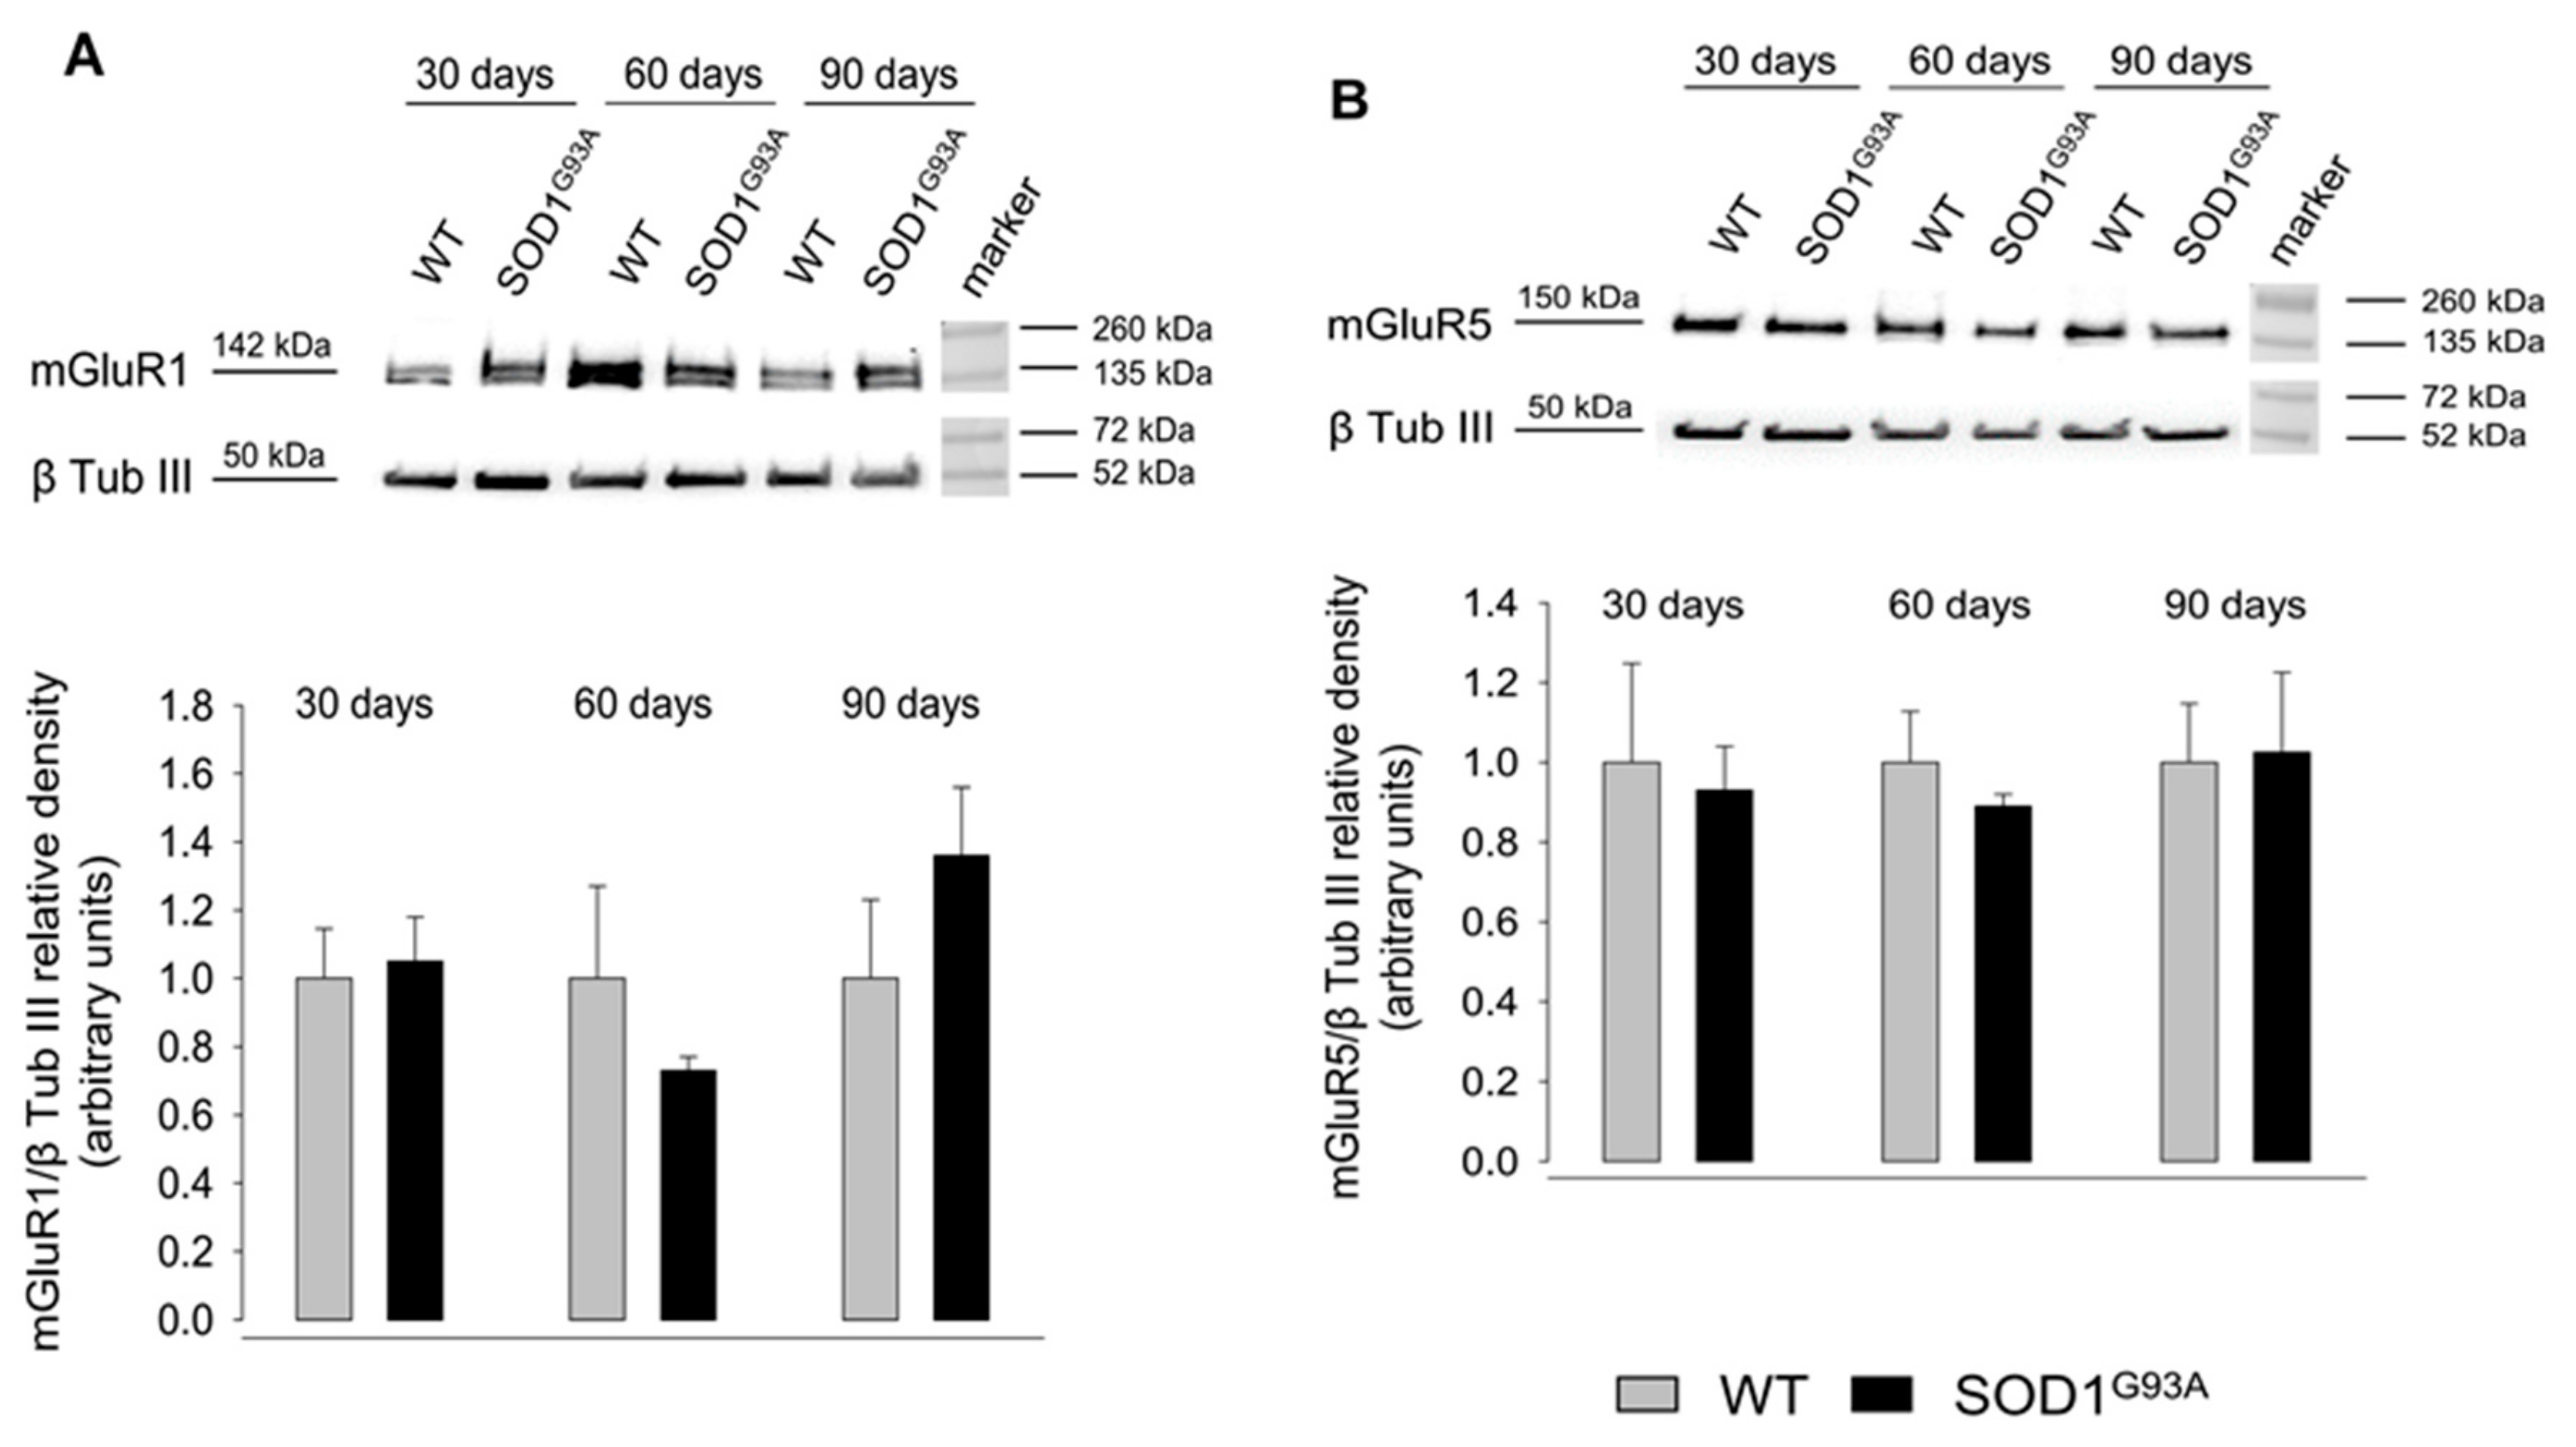
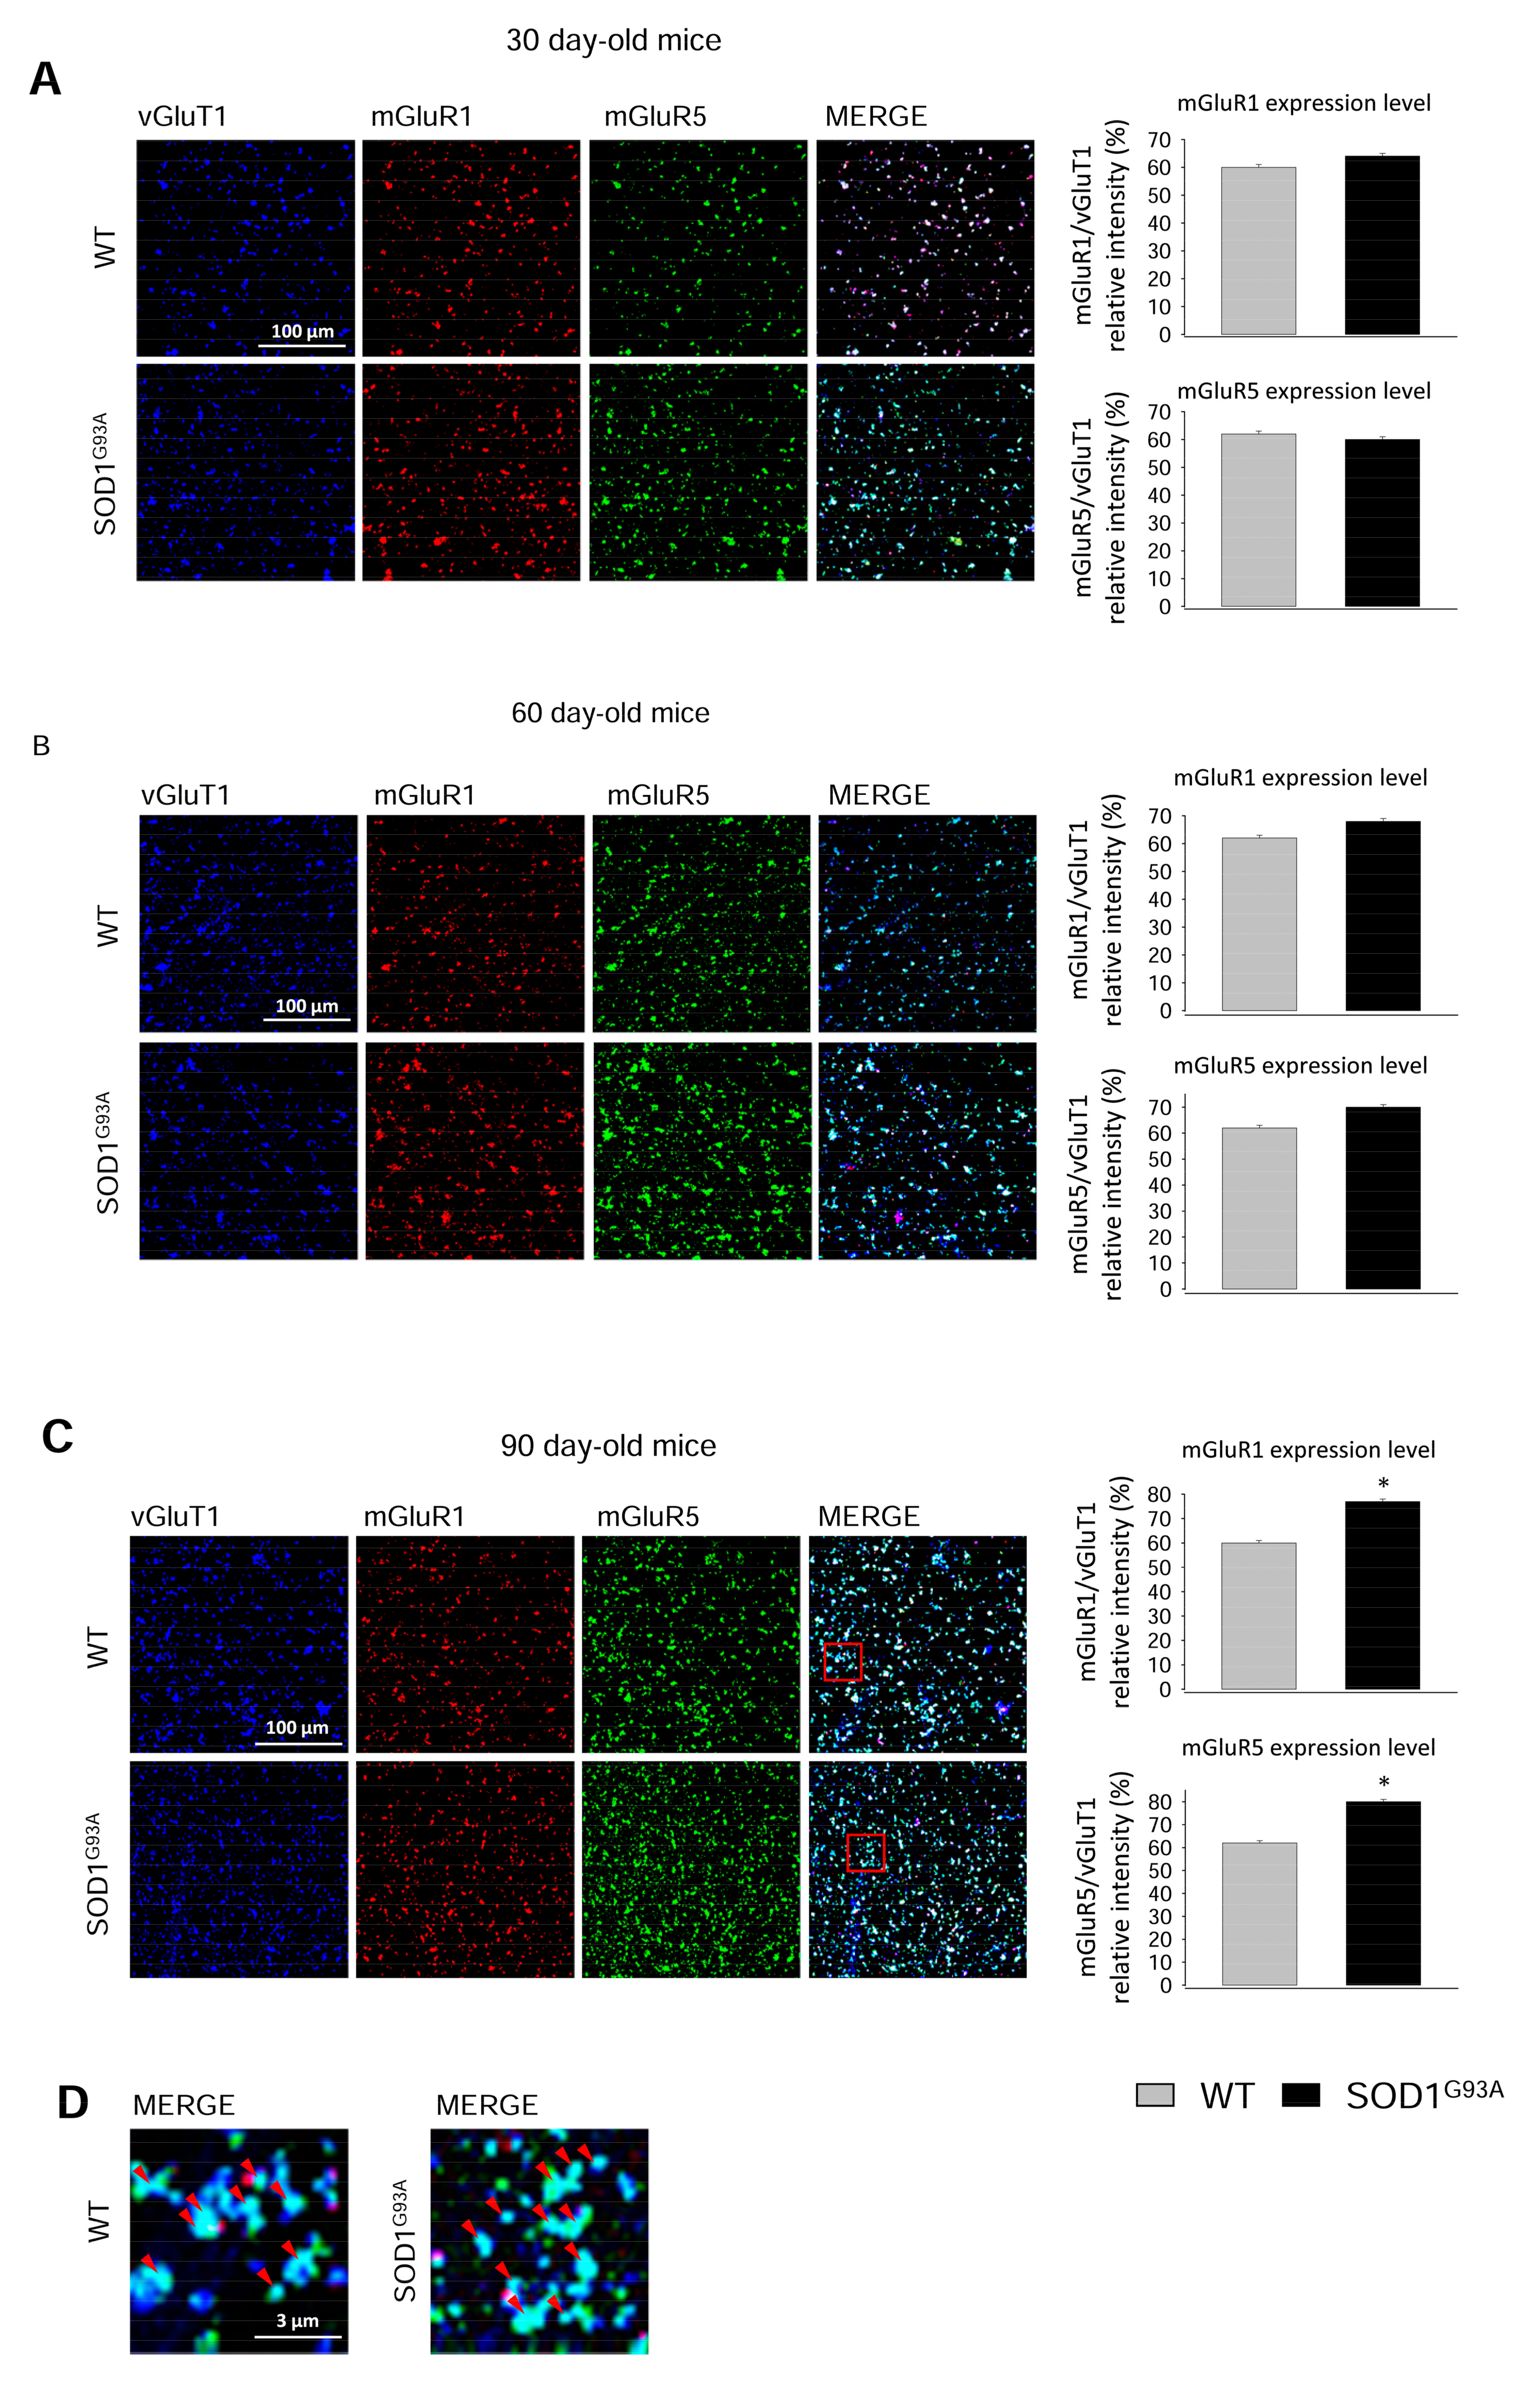
2.3. Expression of mGluR1 and mGluR5 in Spinal Cord Glutamatergic Synaptosomes during Disease Progression

In order to evaluate possible changes in the expression of mGluR1 and mGluR5 during disease progression, we carried out western blot (WB) experiments using protein extracts of spinal cord synaptosomes from 30-, 60-, 90-day-old WT and SOD1G93A mice. Figure 3A shows that mGluR1 expression did not change significantly in SOD1G93A mice with respect to age-matched WT mice at any age tested. Similar results were obtained with regard to mGluR5 expression (Figure 3B).
Since total synaptosomal lysates may include heterogeneous populations of spinal cord synaptic terminals differently expressing the two metabotropic receptors, we carried out immunofluorescence studies to investigate the levels of mGluR1 and GluR5 selectively expressed at glutamatergic axon terminals during disease progression.
Confocal microscopy experiments were performed by staining spinal cord synaptosomes for the vesicular Glu transporter 1 (vGluT1), to label glutamatergic axon terminals, and for mGluR1 or mGluR5 (Figure 4). Synaptosomal preparations efficiently stained for all the antibodies tested, thus allowing the optimal analysis of the relative fluorescence intensity of mGluR1 or mGluR5 co-localizing with vGluT1. The expression of vGluT1 did not vary between WT and SOD1G93A mice and this allowed its use to calculate the relative intensity of mGluR1 or mGluR5 in glutamatergic synaptosomes. Figure 4A, B shows that the relative intensity of mGluR1 and mGluR5 was not significantly modified at 30 and 60 days, although a trend toward an increase can be observed at the latter stage of the disease. On the contrary, both mGluR1 and mGluR5 were significantly increased in SOD1G93A mice at 90 days of life compared to WT mice (Figure 4C; mGluR1, p < 0.001, t(4) = −12.021; mGluR5, p < 0.001, t(4) = −12.728).
Figure 4D report a magnification of the merge panels of Figure 4C (red frames), obtained using spinal cord synaptosomes purified from 90-day-old WT and SOD1G93A mice and shows that a large number of vGluT1-positive glutamatergic synaptosomes also co-express mGluR1 and mGluR5 (red arrows).
Therefore, mGluR1 and mGluR5 were over-expressed at glutamatergic axon terminals in 90-day-old SOD1G93A mice.

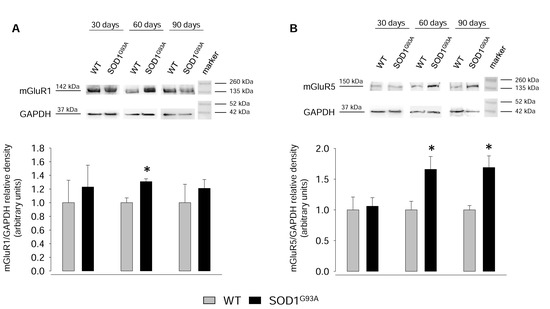
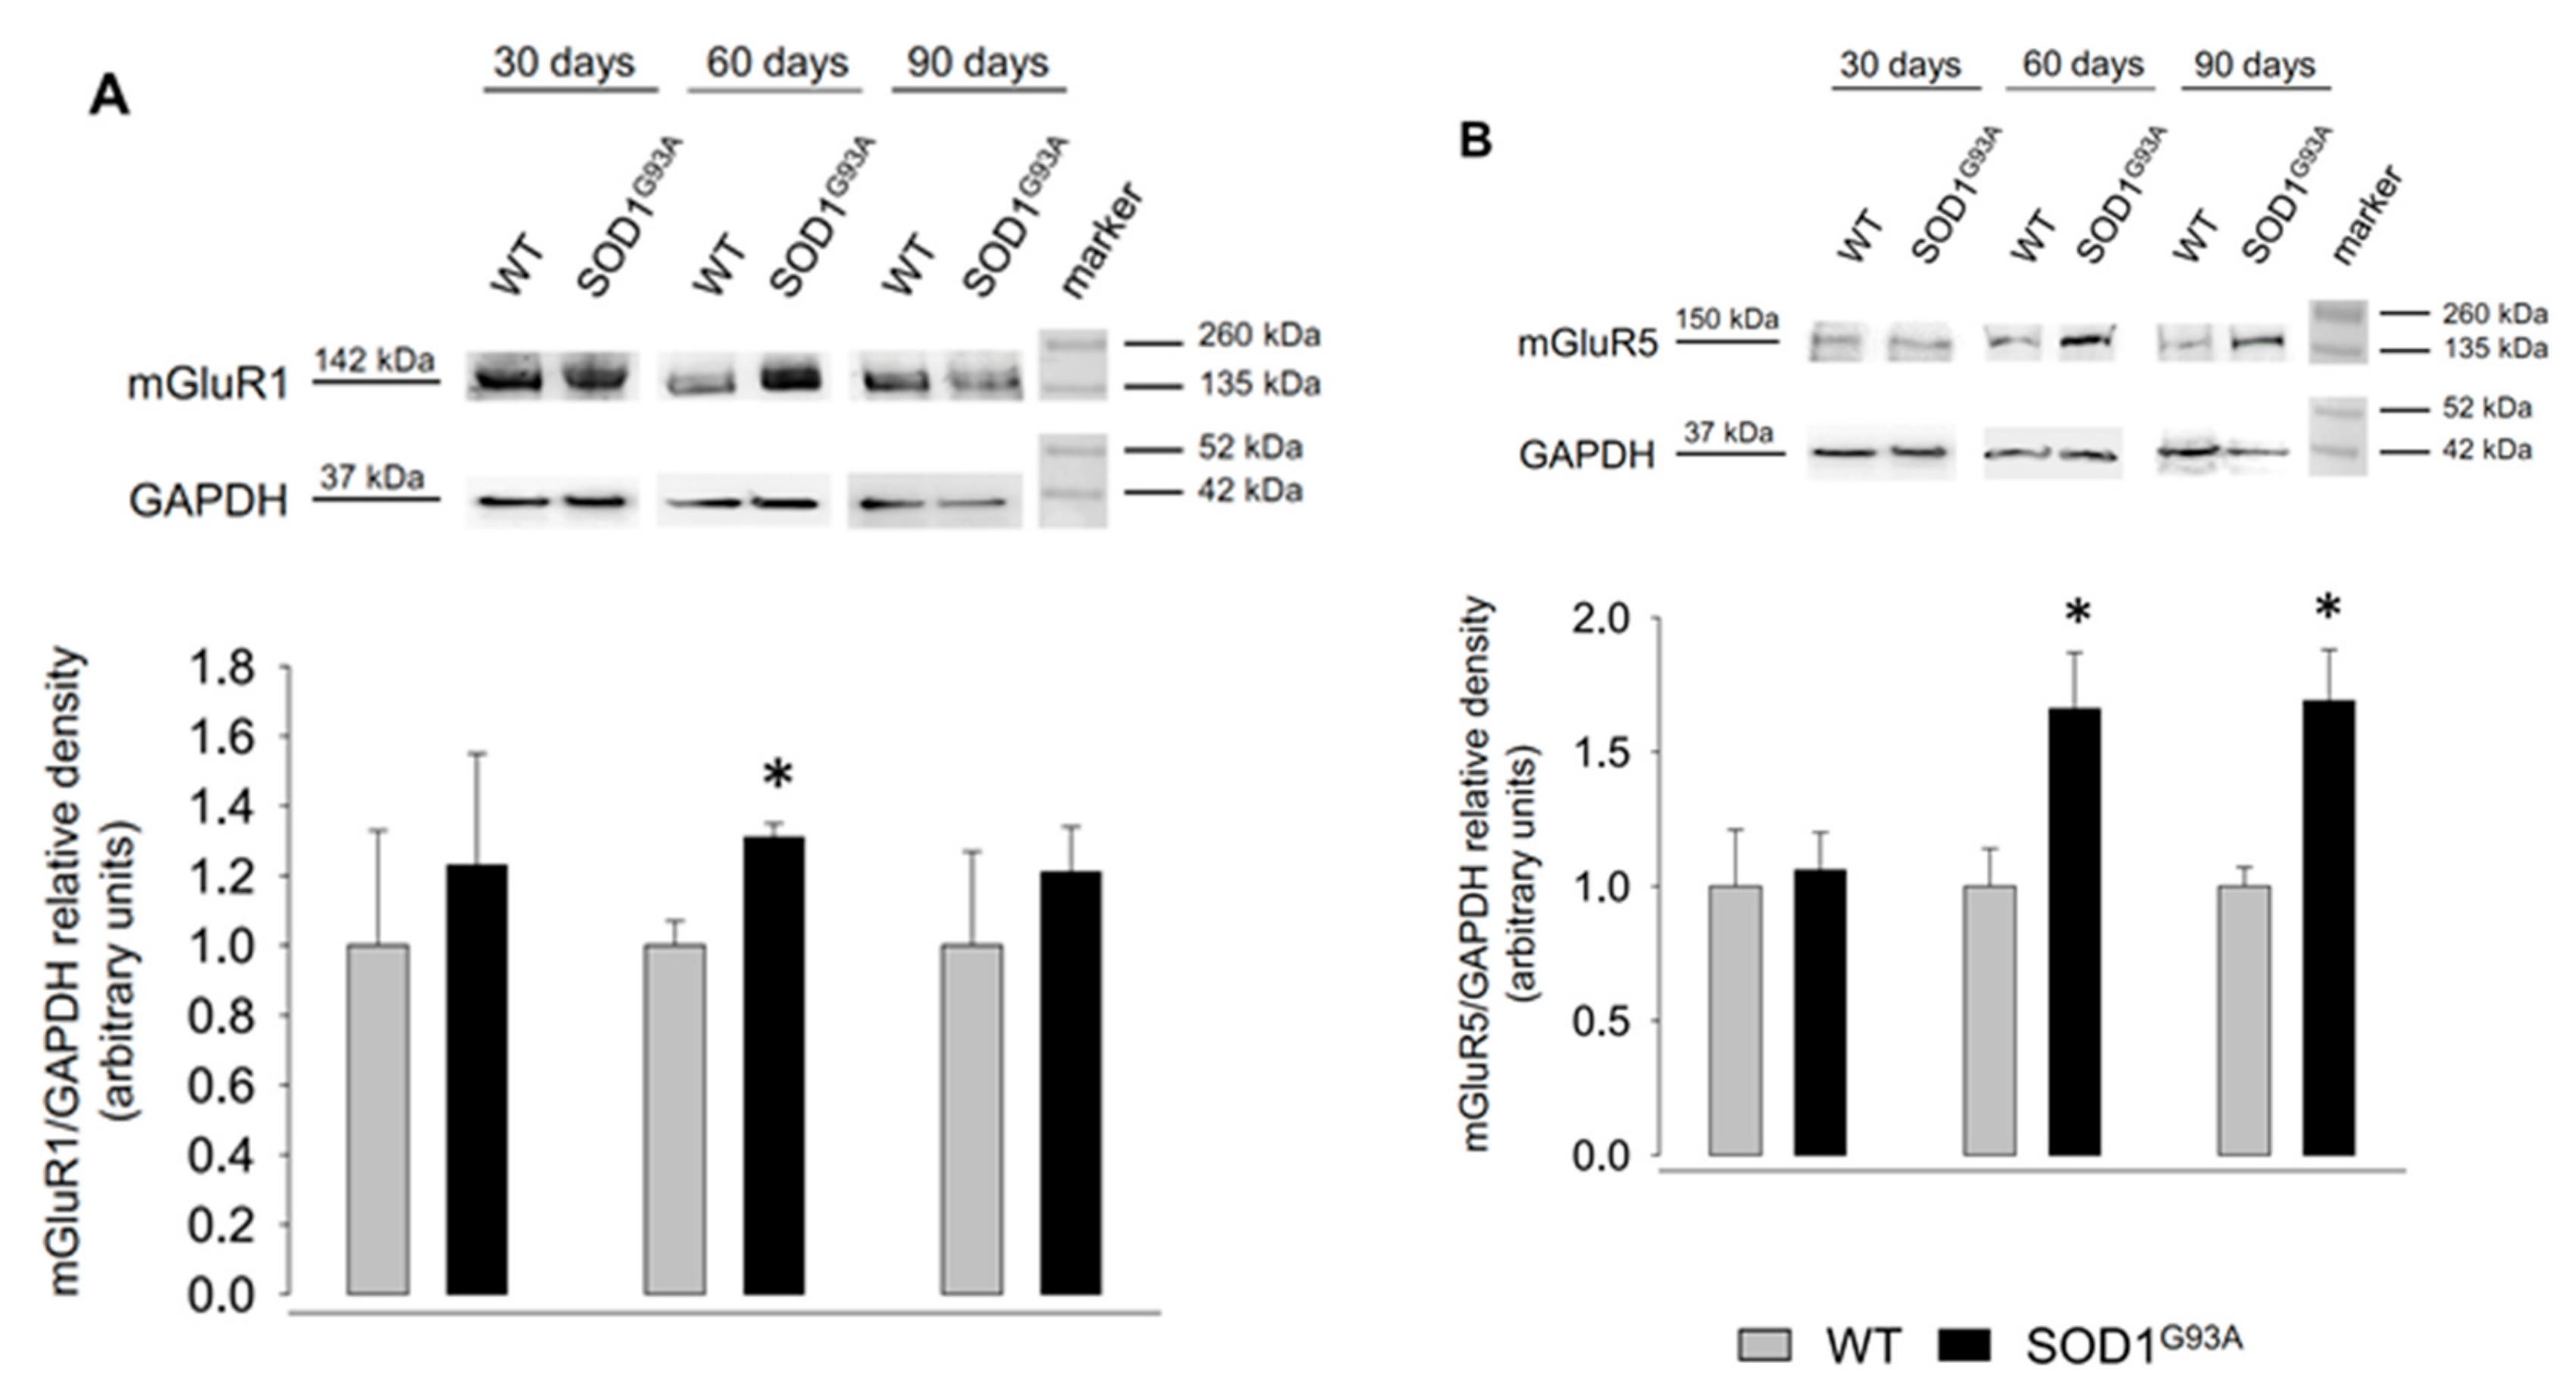
2.4. Expression of mGluR1 and mGluR5 in Spinal Cord Total Tissue during Disease Progression

Group I mGluRs are present in neurons at the pre- and post-synaptic level, as well as in non-neuronal cells, such as astrocytes, microglia and oligodendrocytes [41,42,43].
The data reported in the previous paragraph suggest that mGluR1 and mGluR5 expression does not change significantly in the total synaptosomal population of SOD1G93A mice, being upregulated, however, at the glutamatergic axon terminals. In order to ascertain whether these receptors are also overexpressed in SOD1G93A mice at non-presynaptic sites (i.e., post-synaptically and/or in non-neuronal cells), we conducted WB experiments on protein extracted from the whole spinal cord tissue of 30-, 60-, and 90-day-old WT and SOD1G93A mice. The results obtained overall show that group I mGluRs are overexpressed during the progression of the pathology compared to WT mice, with mGluR1 expression significantly increased at 60 days (Figure 5A; p < 0.05, t(4) = −3.148) and mGluR5 expression significantly augmented in SOD1G93A mice at 60 and 90 days of life (Figure 5B; p < 0.05, t(8) = −2.615 and p < 0.05, t(6) = −3.374, respectively).
These data suggest that mGluR1 and mGluR5 are overexpressed in the spinal cord of SOD1G93A mice during disease progression even at early stages, and that this overexpression can be attributed mainly to non-presynaptic structures.

3. Discussion

Group I metabotropic glutamate receptors (mGluR1 and mGluR5) are actively involved in the regulation of important cellular processes altered in ALS and play a key role in the complex ALS scenario [44,45,46,47,48,49,50]. Starting from our previous results showing that mGluR1 and mGluR5 abnormally increase the release of glutamate in the spinal cord of late symptomatic SOD1G93A mice [26], we here investigated the expression and function of these receptors during disease progression to unveil whether they can also modify glutamate transmission at more precocious stages of the disease.
Our functional results show that 3,5-DHPG induced Glu release in WT and SOD1G93A mice at 30, 60, and 90 days of life. Comparing the releasing effects observed in this work with previous results in 120-day-old mice [26], it appears that the mGluR1/5 agonist exhibited the same efficacy (maximal effect about 100% of potentiation at 30 µM), but lower potency, since the potentiation observed at concentrations below 30 µM were always lower at 30, 60, and 90 days than at 120 days. In this work, 3,5-DHPG effects were comparable in WT and SOD1G93A mice at 30 and 60 days at any concentration tested. On the contrary, 0.3 µM 3,5-DHPG was able to evoke a significant increase of Glu release (approximately 25%) in 90-day-old SOD1G93A mice whereas it was ineffective in age-matched WT mice. This difference may be consistent with that observed previously at 120 days since in that case, as in the present experiments, the effects of 10 and 30 µM 3,5-DHPG were comparable in WT and SOD1G93A mice and differences were observed at 1 µM and below, with 0.3 µM the highest concentration of 3,5-DHPG producing Glu release in SOD1G93A, but not in WT mice. On the basis of the previous results, we tested 0.03, 0.3, 3, and 30 µM 3,5-DHPG and, possibly due to the lower 3,5-DHPG potency observed here, concentrations below 0.3 µM 3,5-DHPG were unable to disclose any further difference. Alternatively, this may indicate that a sort of time-dependent iper-activation of mGluR1 and mGluR5 autoreceptors develops during the progression of the disease.
Our experiments with selective antagonists highlighted that both receptors are involved in the Glu release potentiation seen at 90 days, since either the mGluR1 antagonist LY367385 or the mGluR5 antagonist MPEP virtually abolished the release of glutamate induced by 3,5-DHPG, suggesting the existence of a functional interplay between the two receptors, as already proposed in late-symptomatic SOD1G93A mice [26]. The data from confocal microscopy experiments, indicating the coexistence of mGluR1 and mGluR5 on the same vGluT1-positive synaptosomes, support the results of release experiments. Interestingly, mGlu1 and mGlu5 receptor–receptor interaction has been proposed after measuring Glu release in mouse cerebral cortex synaptosomes by the same experimental set-up used here [51], and the existence of mGluR heterodimers, including mGluR1/mGluR5, has been directly demonstrated in different cell lines [52]. Thus, functional heterodimers might exist also in spinal cord synaptosomes and we would attempt to speculate that the different expression of mGluR1 and mGluR5 in 90-day-old SOD1G93A mice could lead to the assembly of active heterodimers with different stoichiometry, supporting a modified function, and thus explaining why 3,5-DHPG was able to stimulate Glu release with a high affinity in SOD1G93A mice only.
The excessive 3,5-DHPG-induced Glu release was of vesicular origin, being abolished by bafilomycin A1, which depletes the vesicle protonic gradient, hampering the storing of neurotransmitters [40]. Additionally, it is exocytotic in nature since it was triggered by an increase of [Ca2+]C and reduced by cytosolic Ca2+ buffering by BAPTA-AM, suggesting that Ca2+ originates by intra-terminal stores. Moreover, the results obtained with the PLC inhibitor, U73122 [38], and the IP3 channel blocker, 2-APB [39], demonstrate that the effect of 3,5-DHPG on Glu release is mediated by classical metabotropic receptors belonging to the group I mGluRs coupled to membrane phospholipid hydrolysis, IP3 formation, and Ca2+ mobilization from the endoplasmic reticulum. We also found a dysregulation of the synaptic Ca2+ homeostasis at the axon terminal level, characterized by resting overload and increased levels also after 3,5-DHPG exposure. Whether 3,5-DHPG can augment by itself the [Ca2+]C more efficiently in SOD1G93A mice is difficult to say on the basis of the present experiments, and the extent of [Ca2+]C increase produced by the agonist would suggest that the basal level plays a pivotal role. Whatever the case may be, the control of Ca2+ homeostasis is altered in SOD1G93A mice, leading to increased [Ca2+]C. If we assume that a minimal threshold of [Ca2+]C is needed to trigger Glu release, this condition would be more easily obtained in SOD1G93A mice that show a higher basal level. Moreover, increased [Ca2+]C can activate various Ca2+-dependent signaling cascades involved in presynaptic function and exocytosis processes, including the calpain-calpastatin protease system, that indeed we found profoundly altered in SOD1G93 mice [53,54] and that could, in turn, also affect release mechanisms [55].
Interestingly, abnormal exocytotic Glu release in the SOD1G93A mouse spinal cord does not seem to be a unique characteristic of mGluRs since it was also observed using high KCl, ionomycin, or hypertonic sucrose as releasing stimuli [25]. These stimuli exploit different mechanisms to produce Ca2+-dependent and Ca2+-independent neurotransmitter release and it was determined that their excessive effects are based on plastic changes of the Glu axon terminal biochemistry, leading to increased phosphorylation of synapsin I and other key release-regulating proteins, increased number of membrane-bound core complexes, and increased size of the readily releasable pool of vesicles [25,32]. It will be of interest to determine in future studies whether mGluR1 and mGluR5 adopt the same mechanisms to produce the augmented Glu release in SOD1G93A mice. Furthermore, at variance with the previously reported abnormal exocytotic release of Glu induced by depolarization of axon terminals, which was detectable as early as at 30 days of life in SOD1G93A mice [32], the present release modifications take place between 60 and 90 days. As a consequence, we can assume that the modification of the autoreceptor function at Glu synaptic terminals represents a consequence of disease progression rather than a cause of the disease itself.
The release of glutamate was studied using purified synaptosomes stratified as a thin layer on a support and up-down superfused with physiological medium in the presence or in the absence of 3,5-DHPG and of the other tested substances. According to the characteristics of this original technique [56,57], the mGluR1 and mGluR5 that modulate the release of Glu are localized onto Glu-releasing axon terminals in the spinal cord. In line with these functional data, confocal microscopy experiments in the mouse spinal cord revealed an increased expression of both mGluR1 and mGluR5 in vGluT1-stained (i.e., glutamatergic) synaptosomes obtained from early symptomatic 90-day-old SOD1G93A mice, when compared to WT mice. Differently, glutamatergic axon terminals derived from the spinal cord of pre-symptomatic 30- or 60-day-old SOD1G93A mice proved only a non-significant tendency to the increase of mGluR1 or mGluR5 expression, suggesting that the abnormal activity of Glu release-regulating group I mGluRs parallels the development of disease symptoms. Interestingly, no changes in the expression of the two receptors were detected in the spinal cord synaptosomal homogenate prepared from 30-, 60-, and 90-day-old SOD1G93A mice, indicating that the presynaptic overexpression of mGluR1 and mGluR5 preferentially or exclusively affects the glutamatergic subpopulation of spinal cord axon terminals. At variance, an increase of mGluR1 and mGluR5 expression was previously observed in WB experiments using synaptosomal homogenates obtained from 120-day-old SOD1G93A [26], suggesting that, at this disease stage, the overexpression at glutamatergic axon terminals is even more pronounced and/or that other synaptic terminals could be involved.
Noteworthy, an overexpression of mGluR1 and mGluR5 was registered in the total spinal cord tissue, but not in synaptosomes, between 30 and 60 days of life in SOD1G93A mice, suggesting that other non-presynaptic receptors may play a role at earlier stages. As to the possible anatomical location of these up-regulated non-presynaptic receptors, they might be located in spine and dendritic arborizations at the postsynaptic level, where they modulate Glu transmission and multiple related events [58], as well as in non-neuronal cells, such as astrocytes, microglia, and oligodendrocytes [59], which is attractive in view of the well-known non-cell autonomous characteristics of the disease [16]. In fact, it is now clear that astrocytes [17,60] and microglia [15,61] play a crucial role in MNs degeneration during disease progression. Recent studies have shown that oligodendrocytes are also involved in the non-cell autonomous nature of ALS [62,63]. Disclosing the role played by mGluR1 and mGluR5 in the different non neuronal cell populations would be of crucial importance for a better understanding of the neurodegenerative processes taking place in ALS and for the development of effective pharmacological approaches.
The abnormal activity of mGluR1 and mGluR5 demonstrated previously [26] and in the present work further support the rationale for the therapeutic exploitation of reducing mGluR1/5 activity. Indeed, we demonstrated that the genetic reduction [64,65] or ablation [66] of mGluR1 or mGluR5 in SOD1G93A mice positively affects the disease course in SOD1G93A mice, prolonging survival, ameliorating motor skills, and improving biochemical and cellular parameters that are altered during the progression of ALS. These in vivo data are supported by previous in vitro evidence indicating positive effects of group I mGluR activity inhibition on MNs degeneration [67,68,69]. The in vivo beneficial effects of down regulating group I mGluR expression in ALS indicate that the amelioration of the disease progression may additionally be due to down-regulation of receptors other than those expressed on Glu-releasing axon terminals. The present demonstration that in total spinal cord tissue, mGluR1 and mGluR5 are over expressed even earlier than those sited at Glu axon terminals supports the above idea. Thus, the group I mGluRs genetic down regulation should create a virtuous cycle, reducing both the number of receptors and their stimulation by released Glu.
To recapitulate, we demonstrated for the first time that the mGluR1- and mGluR5-releasing function is altered in SOD1G93A mice starting from an early-symptomatic stage of the disease and that these receptors are overexpressed in the spinal cord even at pre-symptomatic disease stages. This could have implication for ALS in vivo. It has been shown that chronic treatment with the prototypic mGluR5 antagonist MPEP attenuates cell death in vitro and delays the onset of motor symptoms and slightly prolongs survival in vivo in SOD1G93A mice [49]. Selective and more potent mGluR5 antagonists, with more favorable pharmacokinetics, are now available and have been tested in preclinical studies in rodents [70,71,72,73,74,75] and in clinical trials in patients [76,77,78] for pathologies different from ALS, showing a favorable safety profile and good efficacy. A positive outcome of in vivo pharmacological studies, in ALS mouse models, with mGluR5 antagonists, already tested in patients, would pave the way to rapid translational application to human ALS. Neuroprotective polytherapy with receptor antagonists aimed at blocking both mGluR1 and mGluR5 could be even more efficacious.
In conclusion, group I mGluRs promise to be helpful druggable targets for pharmacological interventions in ALS and further preclinical single- or multi-drug therapies in animal models of the disease could obtain encouraging results, paving the way for clinical interventions in patients.

4. Materials and Methods

4.1. Animals

Adult B6SJL-TgN SOD1/G93A(þ)1Gur mice expressing a high copy number of mutant human SOD1 with a Gly93Ala substitution [SOD1G93A] [30] were originally obtained from Jackson Laboratories (Bar Harbor, ME, USA). They were bred at the animal facility of the Pharmacology and Toxicology Unit of the Department of Pharmacy at the University of Genoa. Transgenic animals were crossed with background-matched B6SJL wild-type female, and selective breeding maintained each transgene in the hemizygous state. Non-transgenic littermates were used as controls (WT). Female and male mice were used, and they were equally distributed in each series of experiments. Typization was performed to analyze tissue extracts from tail tips (homogenized in phosphate-buffer saline, freeze/thawed twice, and centrifuged at 23,000× g for 15 min at 4 °C) by staining for SOD1 after polyacrylamide gel electrophoresis (10% resolving and 4% stacking) [49,79]. In SOD1G93A mice, death usually occurs between 120 and 140 days. For experimental use, animals were killed at 30, 60, and 90 days of life, corresponding to pre- (30 and 60 days) and early-symptomatic (90 days) stages of the disease. Animals were housed at a constant temperature (22 ± 1 °C) and relative humidity (50%) with a regular 12:12 h light cycle (light 7am and 7pm), throughout the experiments. Food and water were freely available. All experiments were carried out in accordance with the guidelines established by the European Communities Council (Directive 114 2010/63/EU of September 22nd, 2010) and with Italian D.L. n. 26/2014 and were approved by the local Ethical Committee and by the Italian Ministry of Health (Project No. 75f11.2, Authorization No.97/2017-PR). All efforts were made to minimize animal suffering and to use only the number of animals necessary to produce reliable results.

4.2. Synaptosomes Purification

Animals were euthanized and the whole spinal cord rapidly removed. Synaptosomes were prepared essentially as described previously [80,81]. The tissue was homogenized in 15 volumes of 0.32 M sucrose, buffered at pH 7.4 with Tris-HCl, and using a glass-Teflon tissue grinder (clearance 0.25 mm). The homogenate was centrifuged (5 min, 1000× g at 4 °C) to remove nuclei and debris and the supernatant was harvested and centrifuged at 12,000× g for 10 min. The pellet was suspended in Tris-buffered 0.32 M sucrose and gently layered on a discontinuous Percoll® (Sigma-Aldrich, St Louis, MO, USA) gradient (2%, 6%, 10%, and 20% v/v in Tris-buffered 0.32 M sucrose). After centrifugation at 33,500× g for 5 min, the layer between 10% and 20% Percoll®, corresponding to synaptosomal fraction, was collected and washed by centrifugation at 20,000× g for 15 min in physiological medium, having the following compositions (mM): NaCl, 140; KCl, 3; MgSO4, 1.2; NaH2PO4, 1.2; NaHCO3, 5; CaCl2, 1.2; 4-(2-hydroxyethyl)-1-piperazineethanesulfonic acid (HEPES), 10; glucose, 10; pH 7.4. The synaptosomal pellet was then resuspended in physiological medium for cytosolic calcium concentration ([Ca2+]c) determination, release and confocal microscopy experiments, or in lysis buffer for Western blotting. Protein content was measured according to Bradford [82] using bovine serum albumin (BSA; Sigma-Aldrich, St Louis, MO, USA) as standard. All the reagents were of laboratory grade.

4.3. Release Experiments

Synaptosomes from 30-, 60-, and 90-day-old WT and SOD1G93A mice were incubated at 37 °C for 15 min in the presence of 0.1 µM [3H]d-Aspartate ([3H]d-Asp), a non-metabolizable analogue of glutamate used to label the glutamate-releasing pools [83,84]. The synaptosomal suspension was equally distributed on microporous filters placed at the bottom of a set of 24 superfusion chambers maintained at 37 °C (Superfusion System, Ugo Basile, Comerio, Varese, Italy) [85,86]. Superfusion started with standard medium at a rate of 0.5 mL/min and continued for 48 min. After 36 min of superfusion to equilibrate the system, five 3-min samples were collected. (s)-3,5-Dihydroxyphenylglycine (3,5-DHPG; 0.03–30 µM) was introduced at the end of the first sample collected (t = 39 min) and maintained until the end of the experiment; the other drugs used were introduced at t = 30 min. When appropriate, Ca2+ was omitted from t = 20 min. In some experiments, synaptosomes were incubated for 30 min (15 min before and during [3H]d-Asp labelling) in the presence of 100 µM 1,2-bis-(2-aminophenoxy)-ethane-N,N,N0,N0-tetraacetic acid tetra acetoxymethyl ester (BAPTA-AM) or with 0.1 µM bafilomycin A1. Collected samples and superfused synaptosomes were counted for radioactivity. Tritium released in each sample was calculated as fractional rate × 100 (percentage of the total synaptosomal neurotransmitter content at the beginning of the respective collection period). Drug effects were evaluated by calculating the ratio between the efflux in the fourth sample collected, in which the maximum effect of 3,5-DHPG was generally reached, and the efflux in the first sample (basal efflux). This ratio was compared to the corresponding ratio obtained in appropriate controls that were always run in parallel.

4.4. Confocal Microscopy

Purified synaptosomes (40 µg protein) from 30-, 60-, and 90-day-old WT and SOD1G93A mice were stratified onto poly-l-lysine pre-treated coverslips and maintained for 45 min at room temperature to allow setting and sticking to the surface. The preparations were fixed with 2% para-formaldehyde (15 min), washed with PBS (3 × 5), and permeabilized (5 min) with 0.05% triton X-100. After washing (3 × 5) with PBS containing 0.5% BSA, the preparations were incubated overnight at 4 °C with the primary antibodies diluted in PBS containing 3% BSA. The following antibodies were used: Guinea pig anti-vesicular Glu transporter 1 (vGluT1, 1:1000, cat n. AB5905; Merk Millipore, Billerica, MA, USA), mouse anti-mGluR1 (1:1000, cat n. 610964; BD Biosciences, NJ, USA), and rabbit anti-mGluR5 (1:500, cat n. ab53090; Abcam, Cambridge, UK). After washing (3 × 5) with PBS containing 0.5% BSA, the preparations were incubated for 45 min with the secondary antibodies. The following antibodies were used: Goat anti-guinea pig Alexa Fluor A488-conjugated (cat n. A11073), donkey anti-mouse Alexa Fluor A647-conjugated (cat n. A31571), and goat anti-rabbit AlexaFluor A555-conjugated (cat n. A21428) (Molecular Probes Europe, Leiden, The Netherlands). Antibodies were diluted 1:2000 in PBS containing 3% albumin. Fluorescence image (512 × 512 × 8 bit) acquisition was performed by a three-channel Leica TCS SP2 laser-scanning confocal microscope, equipped with 458, 476, 488, 514, 543, and 633 nm excitation lines, through a plan-apochromatic oil immersion objective 63× (1.4 NA). Light collection configuration was optimized according to the combination of chosen fluorochromes and sequential channel acquisition was performed to avoid crosstalk. Leica “LAS AF” software package was used for image acquisition. The estimation of co-localized proteins was performed by calculating the co-localization coefficients [87].

4.5. Immunoblotting

Spinal cord synaptosomal or total tissue proteins from 30-, 60-, and 90-day-old WT and SOD1G93A mice were separated by means of SDS-polyacrylamide gel electrophoresis; 4% to 20% gradient gels were used. The concentration of proteins in each sample fell in the linear portion of the standard curve. Proteins were transferred to nitrocellulose membranes and electroblotted proteins were monitored using Naphthol blue black staining (Sigma Aldrich, MO, USA). Membranes were saturated in 5% skimmed-milk solution and incubated with the following antibodies: Mouse monoclonal anti-mGluR1 (1:500, cat n. 610964; BD Biosciences, San Jose, CA, USA); rabbit monoclonal anti-mGluR5 (1:500, cat n. ab53090; Abcam, Cambridge, UK); mouse monoclonal anti-glyceraldeide phosphate dehydrogenase, GAPDH (1:10000, cat. N. G8795; Sigma Aldrich, MO, USA); mouse monoclonal anti-β-tubulin III (1:1000; cat. N. T8578; Sigma-Aldrich, MO, USA). After incubation with peroxidase-coupled secondary antibodies, protein bands were detected and analyzed for optical density using an enhanced chemiluminescence substrate (ECL, LiteAblot PLUS, Euroclone, Milan, Italy) and a chemiluminescence system (Alliance 6.7 WL 20M, UVITEC, Cambridge, UK), and UV1D software (UVITEC). Bands of interest were normalized for β-tubulin III or GAPDH levels in the same membrane.

4.6. Cytosolic Ca2+ Concentration

[Ca2+]C was determined in spinal cord synaptosomes from 30-, 60-, and 90-day-old WT and SOD1G93A mice using the fluorescent dye fura 2-AM [79]. Synaptosomes were incubated for 40 min at 37 °C in physiological medium, in the presence of 20 mM CaCl2 and 5 mM fura 2-AM dissolved in 0.5% dimethyl sulfoxide (DMSO; Sigma-Aldrich, St Louis, MO, USA). Synaptosomes incubated in the presence of 0.5% DMSO only were used to measure auto-fluorescence. Extra-synaptosomal fura 2-AM was removed by centrifugation; pellets were re-suspended in ice-cold Ca2+-free physiological medium, divided into 200-µL aliquots (200 µg protein/sample), and stored on ice until use. All measurements were obtained within 2 h. Synaptosomes were diluted in a final volume of 2 mL of physiological medium containing 1.2 mM CaCl2 and equilibrated at 37 °C for 15 min. The measurements were made at 37 °C under continuous stirring using an RF-5301PC dual wavelength spectrofluorophotometer (Shimadzu Corporation, Milan, Italy) by alternating the excitation wavelengths of 340 and 380 nm. Fluorescent emission was monitored at 510 nm. Basal fluorescence was recorded for 1 min, then synaptosomes were exposed to 3,5-DHPG (0.3 or 30 µM) for an additional 8 min. Calibration of the fluorescent signals was performed at the end of each measurement by adding 10 mM ionomycin in the presence of CaCl2 to obtain Fmax, followed by 10 mM EDTA (pH 8.0, buffered with 3 mM Tris) to obtain Fmin. After correcting for extracellular dye, [Ca2+]C was calculated by the equation of Grynkiewicz et al. [88], using a KD of 224 nM for the Ca2+-fura 2-AM complex.

4.7. Statistics

Data are expressed as mean ± SEM. The Shapiro–Wilk normality test was performed to assess the normality of the data. Grubbs’ test for outliers was performed. Statistical comparison between two means was performed by two-tailed student’s t-test while multiple comparisons were performed by using the analysis of variance (one or two-way ANOVA, as appropriate), followed by the Bonferroni’s post hoc test or Dunnet’s test, and p-values lower than 0.05 were considered significant. Analyses were carried out using the SigmaStat software (Systat Software 3.5, Inc., San Jose, CA, USA).

Author Contributions

Conceptualization, G.B.; Data curation, T.B. and C.R.; Formal analysis, T.B. and C.U.; Funding acquisition, M.M. and G.B.; Investigation, T.B., C.R., F.P., C.T., M.B. and L.R.; Supervision, M.M.; Writing—original draft, G.B.; Writing—review and editing, E.F.

Funding

This work was supported by grants from the Fondazione Compagnia di San Paolo (project n. 2018.AAI629.U730/SD/pv) to G.B. and the Italian Ministry of Education, University and Research (SIR project n. RBSI14B1Z1) to M.M.).

Acknowledgments

The authors gratefully acknowledge the undergraduate students: Giulia Frumento and Anna Frea, for their very helpful technical support.

Conflicts of Interest

The authors have no conflict of interest.

References

  1. Brown, R.H., Jr. Amyotrophic lateral sclerosis: Recent insights from genetics and transgenic mice. Cell 1995, 80, 687–692. [Google Scholar] [CrossRef] [Green Version]
  2. Neumann, M.; Rademakers, R.; Roeber, S.; Baker, M.; Kretzschmar, H.A.; Mackenzie, I.R. A new subtype of frontotemporal lobar degeneration with FUS pathology. Brain 2009, 132, 2922–2931. [Google Scholar] [CrossRef] [PubMed] [Green Version]
  3. Elamin, M.; Bede, P.; Byrne, S.; Jordan, N.; Gallagher, L.; Wynne, B.; O’Brien, C.; Phukan, J.; Lynch, C.; Pender, N.; et al. Cognitive changes predict functional decline in ALS: A population-based longitudinal study. Neurology 2013, 80, 1590–1597. [Google Scholar] [CrossRef] [PubMed]
  4. Swinnen, B.; Robberecht, W. The phenotypic variability of amyotrophic lateral sclerosis. Nat. Rev. Neurol. 2014, 10, 661–670. [Google Scholar] [CrossRef] [PubMed] [Green Version]
  5. Hardiman, O.; Al-Chalabi, A.; Chio, A.; Corr, E.M.; Logroscino, G.; Robberecht, W.; Shaw, P.J.; Simmons, Z.; Van den Berg, L.H. Amyotrophic lateral sclerosis. Nat. Rev. Dis. Primers 2017, 3, 17071. [Google Scholar] [CrossRef] [PubMed]
  6. Lu, H.; Le, W.D.; Xie, Y.Y.; Wang, X.P. Current Therapy of Drugs in Amyotrophic Lateral Sclerosis. Curr. Neuropharmacol. 2016, 14, 314–321. [Google Scholar] [CrossRef] [Green Version]
  7. Abe, K.; Aoki, M.; Tsuji, S.; Itoyama, Y.; Sobue, G.; Togo, M.; Hamada, C.; Tanaka, M.; Akimoto, M.; Nakamura, K.; et al. Safety and efficacy of edaravone in well defined patients with amyotrophic lateral sclerosis. Lancet Neurol. 2017, 16, 505–512. [Google Scholar] [CrossRef]
  8. Renton, A.E.; Chiò, A.; Traynor, B.J. State of play in amyotrophic lateral sclerosis genetics. Nat. Neurosci. 2014, 17, 17–23. [Google Scholar] [CrossRef]
  9. Cirulli, E.T.; Lasseigne, B.N.; Petrovski, S.; Sapp, P.C.; Dion, P.A.; Leblond, C.S.; Couthouis, J.; Lu, Y.F.; Wang, Q.; Krueger, B.J.; et al. Exome sequencing in amyotrophic lateral sclerosis identifies risk genes and pathways. Science 2015, 347, 1436–1441. [Google Scholar] [CrossRef] [Green Version]
  10. Chiò, A.; Battistini, S.; Calvo, A.; Caponnetto, C.; Conforti, F.L.; Corbo, M.; Giannini, F.; Mandrioli, J.; Mora, G.; Sabatelli, M.; et al. Genetic counselling in ALS: Facts, uncertainties and clinical suggestions. J. Neurol. Neurosurg. Psychiatry 2014, 85, 478–485. [Google Scholar] [CrossRef]
  11. Cleveland, D.W.; Bruijn, L.I.; Wong, P.C.; Marszalek, J.R.; Vechio, J.D.; Lee, M.K.; Xu, X.S.; Borchelt, D.R.; Sisodia, S.S.; Price, D.L. Mechanisms of selective motorneuron death in transgenic mouse models of motorneuron disease. Neurology 1996, 47, S54–S61. [Google Scholar] [CrossRef]
  12. Morrison, B.M.; Morrison, J.H. Amyotrophic lateral sclerosis associated with mutations in superoxide dismutase: A putative mechanism of degeneration. Brain Res. Rev. 1999, 29, 121–135. [Google Scholar] [CrossRef]
  13. Ferraiuolo, L.; Kirby, J.; Grierson, A.J.; Sendtner, M.; Shaw, P.J. Molecular pathways of motorneuron injury in amyotrophic lateral sclerosis. Nat. Rev. Neurol. 2011, 7, 616–630. [Google Scholar] [CrossRef] [PubMed]
  14. Nijssen, J.; Comley, L.H.; Hedlund, E. Motor neuron vulnerability and resistance in amyotrophic lateral sclerosis. Acta Neuropathol. 2017, 133, 863–885. [Google Scholar] [CrossRef] [PubMed] [Green Version]
  15. Boillée, S.; Yamanaka, K.; Lobsiger, C.S.; Copeland, N.G.; Jenkins, N.A.; Kassiotis, G.; Kollias, G.; Cleveland, D.W. Onset and progression in inherited ALS determined by motorneurons and microglia. Science 2006, 312, 1389–1392. [Google Scholar] [CrossRef] [PubMed]
  16. Ilieva, H.; Polymenidou, M.; Cleveland, D.W. Non-cell autonomous toxicity in neurodegenerative disorders: ALS and beyond. J. Cell Biol. 2009, 187, 761–772. [Google Scholar] [CrossRef] [PubMed]
  17. Haidet-Phillips, A.M.; Hester, M.E.; Miranda, C.J.; Meyer, K.; Braun, L.; Frakes, A.; Song, S.; Likhite, S.; Murtha, M.J.; Foust, K.D.; et al. Astrocytes from familial and sporadic ALS patients are toxic to motor neurons. Nat. Biotechnol. 2011, 29, 824–828. [Google Scholar] [CrossRef] [Green Version]
  18. Shaw, P.J.; Forrest, V.; Ince, P.G.; Richardson, J.P.; Wastell, H.J. CSF and plasma amino acid levels in motorneuron disease: Elevation of CSF glutamate in a subset of patients. Neurodegeneration 1995, 4, 209–216. [Google Scholar] [CrossRef]
  19. Spreux-Varoquaux, O.; Bensimon, G.; Lacomblez, L.; Salachas, F.; Pradat, P.F.; Le Forestier, N.; Marouan, A.; Dib, M.; Meininger, V. Glutamate levels in cerebro spinal fluid in amyotrophic lateral sclerosis: A reppraisal using a new HPLC method with coulometric detection in a large cohort of patients. J. Neurol. Sci. 2002, 193, 73–78. [Google Scholar] [CrossRef]
  20. Wuolikainen, A.; Moritz, T.; Marklund, S.L.; Antti, H.; Andersen, P.M. Disease-related changes in the cerebro spinal fluid metabolome in amyotrophic lateral sclerosis detected by GC/TOFMS. PLoS ONE 2011, 6, e17947. [Google Scholar] [CrossRef]
  21. Rothstein, J.D.; Van Kammen, M.; Levey, A.I.; Martin, L.J.; Kuncl, R.W. Selective loss of glial glutamate transporter GLT-1 in amyotrophic lateral sclerosis. Ann. Neurol. 1995, 38, 73–84. [Google Scholar] [CrossRef] [PubMed]
  22. Maragakis, N.J.; Dykes-Hoberg, M.; Rothstein, J.D. Altered expression of the glutamate transporter EAAT2b in neurological disease. Ann. Neurol. 2004, 55, 469–477. [Google Scholar] [CrossRef] [PubMed]
  23. Foran, E.; Bogush, A.; Goffredo, M.; Roncaglia, P.; Gustincich, S.; Pasinelli, P.; Trotti, D. Motor neuron impairment mediated by a sumoylated fragment of the glial glutamate transporter EAAT2. Glia 2011, 59, 1719–1731. [Google Scholar] [CrossRef] [PubMed] [Green Version]
  24. Blasco, H.; Mavel, S.; Corcia, P.; Gordon, P.H. The glutamate hypothesis in ALS: Pathophysiology and drug development. Curr. Med. Chem. 2014, 21, 3551–3575. [Google Scholar] [CrossRef] [PubMed]
  25. Milanese, M.; Zappettini, S.; Onofri, F.; Musazzi, L.; Tardito, D.; Bonifacino, T.; Messa, M.; Racagni, G.; Usai, C.; Benfenati, F.; et al. Abnormal exocytotic release of glutamate in a mouse model of amyotrophic lateral sclerosis. J. Neurochem. 2011, 116, 1028–1042. [Google Scholar] [CrossRef] [PubMed]
  26. Giribaldi, F.; Milanese, M.; Bonifacino, T.; Rossi, P.I.A.; Di Prisco, S.; Pittaluga, A.; Tacchetti, C.; Puliti, A.; Usai, C.; Bonanno, G. Group I metabotropic glutamate autoreceptors induce abnormal glutamate exocytosis in a mouse model of amyotrophic lateral sclerosis. Neuropharmacology 2013, 66, 253–263. [Google Scholar] [CrossRef] [PubMed]
  27. Raiteri, L.; Paolucci, E.; Prisco, S.; Raiteri, M.; Bonanno, G. Activation of a glycine transporter on spinal cord neurons causes enhanced glutamate release in a mouse model of amyotrophic lateral sclerosis. Br. J. Pharmacol. 2003, 138, 1021–1025. [Google Scholar] [CrossRef]
  28. Milanese, M.; Zappettini, S.; Jacchetti, E.; Bonifacino, T.; Cervetto, C.; Usai, C.; Bonanno, G. In vitro activation of GAT1 transporters expressed in spinal cord gliosomes stimulates glutamate release that is abnormally elevated in the SOD1/G93A(+) mouse model of amyotrophic lateral sclerosis. J. Neurochem. 2010, 113, 489–501. [Google Scholar] [CrossRef]
  29. Milanese, M.; Bonifacino, T.; Fedele, E.; Rebosio, C.; Cattaneo, L.; Benfenati, F.; Usai, C.; Bonanno, G. Exocytosis regulates trafficking of GABA and glycine heterotransporters in spinal cord glutamatergic synapses: A mechanism for the excessive heterotransporter-induced release of glutamate in experimental amyotrophic lateral sclerosis. Neurobiol. Dis. 2015, 74, 314–324. [Google Scholar] [CrossRef]
  30. Gurney, M.E.; Pu, H.; Chiu, A.Y.; Dal Canto, M.C.; Polchow, C.Y.; Alexander, D.D.; Caliendo, J.; Hentati, A.; Kwon, Y.W.; Deng, H.X.; et al. Motor neuron degeneration in mice that express a human Cu,Zn superoxide dismutase mutation. Science 1994, 264, 1772–1775. [Google Scholar] [CrossRef]
  31. Raiteri, L.; Stigliani, S.; Zappettini, S.; Mercuri, N.B.; Raiteri, M.; Bonanno, G. Excessive and precocious glutamate release in a mouse model of amyotrophic lateral sclerosis. Neuropharmacology 2004, 46, 782–792. [Google Scholar] [CrossRef] [PubMed]
  32. Bonifacino, T.; Musazzi, L.; Milanese, M.; Seguini, M.; Marte, A.; Gallia, E.; Cattaneo, L.; Onofri, F.; Popoli, M.; Bonanno, G. Altered mechanisms underlying the abnormal glutamate release in amyotrophic lateral sclerosis at a pre-symptomatic stage of the disease. Neurobiol. Dis. 2016, 95, 122–133. [Google Scholar] [CrossRef] [PubMed]
  33. Wiśniewski, K.; Car, H. (S)-3,5-DHPG: A review. CNS Drug Rev. 2002, 8, 101–116. [Google Scholar] [CrossRef] [PubMed]
  34. Bruno, V.; Battaglia, G.; Kingston, A.; O’Neill, M.J.; Catania, M.V.; Di Grezia, R.; Nicoletti, F. Neuroprotective activity of the potent and selective mGlu1a metabotropic glutamate receptor antagonist, (+)-2-methyl-4 carboxyphenylglycine (LY367385): Comparison with LY357366, a broader spectrum antagonist with equal affinity for mGlu1a and mGlu5 receptors. Neuropharmacology 1999, 38, 199–207. [Google Scholar] [PubMed]
  35. Gasparini, F.; Lingenhöhl, K.; Stoehr, N.; Flor, P.J.; Heinrich, M.; Vranesic, I.; Biollaz, M.; Allgeier, H.; Heckendorn, R.; Urwyler, S.; et al. 2-Methyl-6-(phenylethynyl)-pyridine (MPEP), a potent, selective and systemically active mGlu5 receptor antagonist. Neuropharmacology 1999, 38, 1493–1503. [Google Scholar] [CrossRef]
  36. Pin, J.P.; Acher, F. The metabotropic glutamate receptors: Structure, activation mechanism and pharmacology. Curr. Drug Targets CNS Neurol. Disord. 2002, 1, 297–317. [Google Scholar] [CrossRef] [PubMed]
  37. Malgaroli, A.; Meldolesi, J. [Ca2+]i oscillations from internal stores sustain exocytic secretion from the chromaffin cells of the rat. FEBS Lett. 1991, 283, 169–172. [Google Scholar] [CrossRef]
  38. Bleasdale, J.E.; Thakur, N.R.; Gremban, R.S.; Bundy, G.L.; Fitzpatrick, F.A.; Smith, R.J.; Bunting, S. Selective inhibition of receptor-coupled phospholipase C-dependent processes in human platelets and polymorphonuclear neutrophils. J. Pharmacol. Exp. 1990, 255, 756–768. [Google Scholar]
  39. Maruyama, T.; Kanaji, T.; Nakade, S.; Kanno, T.; Mikoshiba, K. 2APB, 2-aminoethoxydiphenyl borate, a membrane-penetrable modulator of Ins (1,4,5)P3-induced Ca2+ release. J. Biochem. 1997, 122, 498–505. [Google Scholar] [CrossRef]
  40. Bowman, E.J.; Siebers, A.; Altendorf, K. Bafilomycins: A class of inhibitors of membrane ATPases from microorganisms, animal cells, and plant cells. Proc. Natl. Acad. Sci. USA 1988, 85, 7972–7976. [Google Scholar] [CrossRef]
  41. Biber, K.; Laurie, D.J.; Berthele, A.; Sommer, B.; Tölle, T.R.; Gebicke-Härter, P.J.; Van Calker, D.; Boddeke, H.W. Expression and signalling of group I metabotropic glutamate receptors in astrocytes and microglia. J. Neurochem. 1999, 72, 1671–1680. [Google Scholar] [CrossRef] [PubMed]
  42. Luyt, K.; Varadi, A.; Molnar, E. Functional metabotropic glutamate receptors are expressed in oligodendrocyte progenitor cells. J. Neurochem. 2003, 84, 1452–1464. [Google Scholar] [CrossRef] [PubMed] [Green Version]
  43. Panatier, A.; Robitaille, R. Astrocytic mGluR5 and the tripartite synapse. Neuroscience 2016, 323, 29–34. [Google Scholar] [CrossRef] [PubMed]
  44. Nicoletti, F.; Bockaert, J.; Collingridge, G.L.; Conn, P.J.; Ferraguti, F.; Schoepp, D.D.; Wroblewski, J.T.; Pin, J.P. Metabotropic glutamate receptors: From the work bench to the bedside. Neuropharmacology 2011, 60, 1017–1041. [Google Scholar] [CrossRef] [PubMed]
  45. Aronica, E.; Catania, M.V.; Geurts, J.; Yankaya, B.; Troost, D. Immuno-histochemical localization of group I and II metabotropic glutamate receptors in control and amyotrophic lateral sclerosis human spinal cord: Upregulation in reactive astrocytes. Neuroscience 2001, 105, 509–520. [Google Scholar] [CrossRef]
  46. Martorana, F.; Brambilla, L.; Valori, C.F.; Bergamaschi, C.; Roncoroni, C.; Aronica, E.; Volterra, A.; Bezzi, P.; Rossi, D. The BH4 domain of Bcl-X(L) rescues astrocyte degeneration in amyotrophic lateral sclerosis by modulating intracellular calcium signals. Hum. Mol. Genet. 2012, 21, 826–840. [Google Scholar] [CrossRef]
  47. Anneser, J.M.; Ince, P.G.; Shaw, P.J.; Borasio, G.D. Differential expression of mGluR5 in human lumbosacral motoneurons. Neuroreport 2004, 15, 271–273. [Google Scholar] [CrossRef]
  48. Anneser, J.M.; Chahli, C.; Ince, P.G.; Borasio, G.D.; Shaw, P.J. Glial proliferation and metabotropic glutamate receptor expression in amyotrophic lateral sclerosis. J. Neuropathol. Exp. Neurol. 2004, 63, 831–840. [Google Scholar] [CrossRef]
  49. Rossi, D.; Brambilla, L.; Valori, C.F.; Roncoroni, C.; Crugnola, A.; Yokota, T.; Bredesen, D.E.; Volterra, A. Focal degeneration of astrocytes in amyotrophic lateral sclerosis. Cell Death Differ. 2008, 15, 1691–1700. [Google Scholar] [CrossRef] [Green Version]
  50. Vergouts, M.; Doyen, P.J.; Peeters, M.; Opsomer, R.; Hermans, E. Constitutive downregulation protein kinase C epsilon in hSOD1G93A astrocytes influences mGluR5 signaling and the regulation of glutamate uptake. Glia 2018, 66, 749–761. [Google Scholar] [CrossRef]
  51. Musante, V.; Neri, E.; Feligioni, M.; Puliti, A.; Pedrazzi, M.; Conti, V.; Usai, C.; Diaspro, A.; Ravazzolo, R.; Henley, J.M.; et al. Presynaptic mGlu1 and mGlu5 autoreceptors facilitate glutamate exocytosis from mouse cortical nerve endings. Neuropharmacology 2008, 55, 474–482. [Google Scholar] [CrossRef] [PubMed] [Green Version]
  52. Doumazane, E.; Scholler, P.; Zwier, J.M.; Trinquet, E.; Rondard, P.; Pin, J.P. A new approach to analyze cell surface protein complexes reveals specific heterodimeric metabotropic glutamate receptors. FASEB J. 2011, 25, 66–77. [Google Scholar] [CrossRef] [PubMed]
  53. Stifanese, R.; Averna, M.; De Tullio, R.; Pedrazzi, M.; Beccaria, F.; Salamino, F.; Milanese, M.; Bonanno, G.; Pontremoli, S.; Melloni, E. Adaptive modifications in the calpain/calpastatin system in brain cells after persistent alteration in Ca2+ homeostasis. J. Biol. Chem. 2010, 285, 631–643. [Google Scholar] [CrossRef] [PubMed]
  54. Stifanese, R.; Averna, M.; De Tullio, R.; Pedrazzi, M.; Milanese, M.; Bonifacino, T.; Bonanno, G.; Salamino, F.; Pontremoli, S.; Melloni, E. Role of calpain-1 in the early phase of experimental ALS. Arch. Biochem. Biophys. 2014, 562, 1–8. [Google Scholar] [CrossRef] [PubMed]
  55. Evans, J.S.; Turner, M.D. Emerging functions of the calpain superfamily of cysteine proteases in neuroendocrine secretory pathways. J. Neurochem. 2007, 103, 849–859. [Google Scholar] [CrossRef] [PubMed] [Green Version]
  56. Bonanno, G.; Raiteri, M. Release-regulating presynaptic heterocarriers. Prog. Neurobiol. 1994, 44, 451–462. [Google Scholar] [CrossRef]
  57. Di Prisco, S.; Merega, E.; Milanese, M.; Summa, M.; Casazza, S.; Raffaghello, L.; Pistoia, V.; Uccelli, A.; Pittaluga, A. CCL5-glutamate interaction in central nervous system: Early and acute presynaptic defects in EAE mice. Neuropharmacology 2013, 75, 337–346. [Google Scholar] [CrossRef] [PubMed]
  58. Scheefhals, N.; MacGillavry, H.D. Functional organization of postsynaptic glutamate receptors. Mol. Cell. Neurosci. 2018, 91, 82–94. [Google Scholar] [CrossRef]
  59. D’Antoni, S.; Berretta, A.; Bonaccorso, C.M.; Bruno, V.; Aronica, E.; Nicoletti, F.; Catania, M.V. Metabotropic glutamate receptors in glial cells. Neurochem. Res. 2008, 33, 2436–2443. [Google Scholar] [CrossRef]
  60. Yamanaka, K.; Chun, S.J.; Boillee, S.; Fujimori-Tonou, N.; Yamashita, H.; Gutmann, D.H.; Takahashi, R.; Misawa, H.; Cleveland, D.W. Astrocytes as determinants of disease progression in inherited amyotrophic lateral sclerosis. Nat. Neurosci. 2008, 11, 251–253. [Google Scholar] [CrossRef] [Green Version]
  61. Frakes, A.E.; Ferraiuolo, L.; Haidet-Phillips, A.M.; Schmelzer, L.; Braun, L.; Miranda, C.J.; Ladner, K.J.; Bevan, A.K.; Foust, K.D.; Godbout, J.P.; et al. Microglia induce motor neuron death via the classical NF-κB pathway in amyotrophic lateral sclerosis. Neuron 2014, 81, 1009–1023. [Google Scholar] [CrossRef] [PubMed]
  62. Nonneman, A.; Robberecht, W.; Van Den Bosch, L. The role of oligodendroglial dysfunction in amyotrophic lateral sclerosis. Neurodegener Dis. Manag. 2014, 4, 223–239. [Google Scholar] [CrossRef] [PubMed] [Green Version]
  63. Ferraiuolo, L.; Meyer, K.; Sherwood, T.W.; Vick, J.; Likhite, S.; Frakes, A.; Miranda, C.J.; Braun, L.; Heath, P.R.; Pineda, R.; et al. Oligodendrocytes contribute to motor neuron death in ALS via SOD1-dependent mechanism. Proc. Natl. Acad. Sci. USA 2016, 113, E6496–E6505. [Google Scholar] [CrossRef] [PubMed] [Green Version]
  64. Milanese, M.; Giribaldi, F.; Melone, M.; Bonifacino, T.; Musante, I.; Carminati, E.; Rossi, P.I.; Vergani, L.; Voci, A.; Conti, F.; et al. Knocking down metabotropic glutamate receptor 1 improves survival and disease progression in the SOD1(G93A) mouse model of amyotrophic lateral sclerosis. Neurobiol. Dis. 2014, 64, 48–59. [Google Scholar] [CrossRef] [PubMed]
  65. Bonifacino, T.; Cattaneo, L.; Gallia, E.; Puliti, A.; Melone, M.; Provenzano, F.; Bossi, S.; Musante, I.; Usai, C.; Conti, F.; et al. In-vivo effects of knocking-down metabotropic glutamate receptor 5 in the SOD1G93A mouse model of amyotrophic lateral sclerosis. Neuropharmacology 2017, 123, 433–445. [Google Scholar] [CrossRef] [PubMed]
  66. Bonifacino, T.; Provenzano, F.; Gallia, E.; Ravera, S.; Torazza, C.; Bossi, S.; Ferrando, S.; Puliti, A.; Van den Bosch, L.; Bonanno, G.; et al. In-vivo genetic ablation of metabotropic glutamate receptor type 5 slows down disease progression in the SOD1G93A mouse model of amyotrophic lateral sclerosis. Neurobiol. Dis. 2019, 129, 79–92. [Google Scholar] [CrossRef]
  67. Pizzi, M.; Benarese, M.; Boroni, F.; Goffi, F.; Valerio, A.; Spano, P.F. Neuroprotection by metabotropic glutamate receptor agonists on kainate-induced degeneration of motor neurons in spinal cord slices from adult rat. Neuropharmacology 2000, 39, 903–910. [Google Scholar] [CrossRef]
  68. Anneser, J.M.; Chahli, C.; Borasio, G.D. Protective effect of metabotropic glutamate receptor inhibition on amyotrophic lateral sclerosis-cerebrospinal fluid toxicity in vitro. Neuroscience 2006, 141, 1879–1886. [Google Scholar] [CrossRef]
  69. D’Antoni, S.; Berretta, A.; Seminara, G.; Longone, P.; Giuffrida-Stella, A.M.; Battaglia, G.; Sortino, M.A.; Nicoletti, F.; Catania, M.V. A prolonged pharmacological blockade of type-5 metabotropic glutamate receptors protects cultured spinal cord motorneurons against excitotoxic death. Neurobiol. Dis. 2011, 42, 252–264. [Google Scholar] [CrossRef]
  70. Montana, M.C.; Cavallone, L.F.; Stubbert, K.K.; Stefanescu, A.D.; Kharasch, E.D.; Gereau, R.W. The metabotropic glutamate receptor subtype 5 antagonist fenobam is analgesic and has improved in vivo selectivity compared with the prototypical antagonist 2-methyl-6-(phenylethynyl)-pyridine. J. Pharmacol. Exp. Ther. 2009, 330, 834–843. [Google Scholar] [CrossRef]
  71. Lindemann, L.; Jaeschke, G.; Michalon, A.; Vieira, E.; Honer, M.; Spooren, W.; Porter, R.; Hartung, T.; Kolczewski, S.; Büttelmann, B.; et al. CTEP: A novel, potent, long-acting, and orally bioavailable metabotropic glutamate receptor 5 inhibitor. J. Pharmacol. Exp. Ther. 2011, 339, 474–486. [Google Scholar] [CrossRef] [PubMed]
  72. Levenga, J.; Hayashi, S.; De Vrij, F.M.; Koekkoek, S.K.; Van der Linde, H.C.; Nieuwenhuizen, I.; Song, C.; Buijsen, R.A.; Pop, A.S.; Gomezmancilla, B.; et al. AFQ056, a new mGluR5 antagonist for treatment of fragile X syndrome. Neurobiol. Dis. 2011, 42, 311–317. [Google Scholar] [CrossRef] [PubMed]
  73. Michalon, A.; Bruns, A.; Risterucci, C.; Honer, M.; Ballard, T.M.; Ozmen, L.; Jaeschke, G.; Wettstein, J.G.; Von Kienlin, M.; Künnecke, B.; et al. Chronic metabotropic glutamate receptor 5 inhibition corrects local alterations of brain activity and improves cognitive performance in fragile X mice. Biol. Psychiatry 2014, 75, 189–197. [Google Scholar] [CrossRef] [PubMed]
  74. Peterlik, D.; Stangl, C.; Bauer, A.; Bludau, A.; Keller, J.; Grabski, D.; Killian, T.; Schmidt, D.; Zajicek, F.; Jaeschke, G.; et al. Blocking metabotropic glutamate receptor subtype 5 relieves maladaptive chronic stress consequences. Brain Behav. Immun. 2017, 59, 79–92. [Google Scholar] [CrossRef] [PubMed]
  75. Abd-Elrahman, K.S.; Hamilton, A.; Vasefi, M.; Ferguson, S.S.G. Autophagy is increased following either pharmacological or genetic silencing of mGluR5 signaling in Alzheimer’s disease mouse models. Mol. Brain 2018, 11, 19. [Google Scholar] [CrossRef] [PubMed]
  76. Porter, R.H.; Jaeschke, G.; Spooren, W.; Ballard, T.M.; Büttelmann, B.; Kolczewski, S.; Peters, J.U.; Prinssen, E.; Wichmann, J.; Vieira, E.; et al. Fenobam: A clinically validated non-benzodiazepine anxiolytic is a potent, selective, and noncompetitive mGlu5 receptor antagonist with inverse agonist activity. J. Pharmacol. Exp. Ther. 2005, 315, 711–721. [Google Scholar] [CrossRef]
  77. Berry-Kravis, E.; Hessl, D.; Coffey, S.; Hervey, C.; Schneider, A.; Yuhas, J.; Hutchison, J.; Snape, M.; Tranfaglia, M.; Nguyen, D.V.; et al. A pilot open label, single dose trial of fenobam in adults with fragile X syndrome. J. Med. Genet. 2009, 46, 266–271. [Google Scholar] [CrossRef] [PubMed] [Green Version]
  78. Lindemann, L.; Porter, R.H.; Scharf, S.H.; Kuennecke, B.; Bruns, A.; Von Kienlin, M.; Harrison, A.C.; Paehler, A.; Funk, C.; Gloge, A.; et al. Pharmacology of basimglurant (RO4917523, RG7090), a unique metabotropic glutamate receptor 5 negative allosteric modulator in clinical development for depression. J. Pharmacol. Exp. Ther. 2015, 353, 213–233. [Google Scholar] [CrossRef]
  79. Laemmli, U.K. Cleavage of structural proteins during the assembly of the head of bacteriophage T4. Nature 1970, 227, 680–685. [Google Scholar] [CrossRef]
  80. Raiteri, L.; Stigliani, S.; Usai, C.; Diaspro, A.; Paluzzi, S.; Milanese, M.; Raiteri, M.; Bonanno, G. Functional expression of release-regulating glycine transporters GLYT1 on GABAergic neurons and GLYT2 on astrocytes in mouse spinal cord. Neurochem. Int. 2008, 52, 103–112. [Google Scholar] [CrossRef]
  81. Carney, K.E.; Milanese, M.; Van Nierop, P.; Li, K.W.; Oliet, S.H.R.; Smit, A.B.; Bonanno, G.; Verheijen, M.H.G. Proteomic analysis of gliosomes from mouse brain: Identification and investigation of glial membrane proteins. J. Proteome Res. 2014, 13, 5918–5927. [Google Scholar] [CrossRef] [PubMed]
  82. Bradford, M.M. A rapid and sensitive method for the quantitation of microgram quantities of protein utilizing the principle of protein-dyebinding. Anal. Biochem. 1976, 72, 248–254. [Google Scholar] [CrossRef]
  83. Fleck, M.W.; Barrionuevo, G.; Palmer, A.M. Synaptosomal and vesicular accumulation of L-glutamate, L-aspartate and D-aspartate. Neurochem. Int. 2001, 39, 217–225. [Google Scholar] [CrossRef]
  84. Raiteri, L.; Zappettini, S.; Milanese, M.; Fedele, E.; Raiteri, M.; Bonanno, G. Mechanisms of glutamate release elicited in rat cerebrocortical nerve endings by ‘pathologically’ elevated extraterminal K+ concentrations. J. Neurochem. 2007, 103, 952–961. [Google Scholar] [CrossRef] [PubMed]
  85. Raiteri, M.; Bonanno, G.; Marchi, M.; Maura, G. Is there a functional linkage between neurotransmitter uptake mechanisms and presynaptic receptors? J. Pharmacol. Exp. Ther. 1984, 231, 671–677. [Google Scholar] [PubMed]
  86. Bossi, S.; Musante, I.; Bonfiglio, T.; Bonifacino, T.; Emionite, L.; Cerminara, M.; Cervetto, C.; Marcoli, M.; Bonanno, G.; Ravazzolo, R.; et al. Genetic inactivation of mGlu5 receptor improves motor coordination in the Grm1crv4 mouse model of SCAR13 ataxia. Neurobiol. Dis. 2018, 109, 44–53. [Google Scholar] [CrossRef]
  87. Manders, E.M.; Stap, J.; Brakenhoff, G.J.; Van Driel, R.; Aten, J.A. Dynamics of three-dimensional replication patterns during the S-phase, analysed by double labelling of DNA and confocal microscopy. J. Cell Sci. 1992, 103, 857–862. [Google Scholar]
  88. Grynkiewicz, G.; Poenie, M.; Tsien, R.Y. A new generation of Ca2+ indicators with greatly improved fluorescence properties. J. Biol. Chem. 1985, 260, 3440–3450. [Google Scholar]
Figure 1. Release of [3H]d-Aspartate ([3H]d-Asp) in spinal cord synaptosomes purified from wild type mice (WT) and SOD1G93A mice. The effect of (S)-3,5-dihydroxyphenylglycine (3,5-DHPG) on the spontaneous release of [3H]d-Asp was measured in spinal cord synaptosomes prepared from SOD1G93A mice at different stages of the disease: (A) 30 days of life, (B) 60 days of life, and (C) 90 days of life, corresponding to pre-symptomatic (30 and 60 days) and early-symptomatic (90 days) phases of the disease. Age-matched WT animals were used as controls. Synaptosomes were loaded with [3H]d-Asp, in order to label the intra-terminal releasing pools of Glu, and exposed in superfusion to increasing concentrations (0.03, 0.3, 3, and 30 µM) of 3,5-DHPG. Labelling by [3H]d-Asp did not differ significantly between WT and SOD1G93A mice when normalized for synaptosomal protein. Superfusion samples collected were counted for radioactivity. Results are expressed as the percent increase respect to the basal control release. The data reported are the means ± SEM of five independent experiments (five WT and five SOD1G93A mice) run in triplicate (three superfusion chambers for each experimental condition). No significance was detected in 30- and 60-day-old mice, while a significant difference was found in 90-day-old SOD1G93A mice versus WT mice. * p < 0.001 vs. WT (two-way ANOVA followed by Bonferroni’s post-hoc test).
Ijms 20 04552 g001
Figure 2. Mechanisms underlying the 3,5-DHPG-evoked [3H]d-Asp release in spinal cord synaptosomes from 90-day-old WT and SOD1G93A mice. (A) The effects of mGluR1 and mGluR5 selective antagonists were tested on the 0.3 µM 3,5-DHPG-evoked [3H]d-Asp release. Spinal cord synaptosomes were exposed in superfusion to 1 µM LY367385 or MPEP, 8 min before and concomitantly with 0.3 µM 3,5-DHPG. See the legend of Figure 1 for other technical details. The data reported are the means ± SEM of five independent experiments (five WT and five SOD1G93A mice) run in triplicate (three superfusion chambers for each experimental condition). * p < 0.05 vs. 3,5-DHPG (one-way ANOVA followed by Bonferroni’s post-hoc test). (B) Resting and 3,5-DHPG-evoked [Ca2+]C were measured in spinal cord synaptosomes purified from 90-day-old SOD1G93A and age-matched WT control mice. Synaptosomes were labelled with fura-2-acetoxymethyl ester (fura 2-AM) and exposed to standard medium or to 0.3, 3, and 30 µM 3,5-DHPG. [Ca2+]C was determined fluorometrically as described in the Methods section. Data are means ± SEM of three independent experiments (three WT and three SOD1G93A mice) run in triplicate (three experimental replicates). * p < 0.001 vs. WT mice (two-way ANOVA followed by Bonferroni’s post-hoc test). (C) The effects of external calcium absence (Ca-free medium), cytosolic calcium chelation by 1,2-bis(2-aminophenoxy)ethane-N,N,N′,N′-tetraacetic acid tetrakis acetoxymethyl ester (BAPTA-AM) (100 µM), phospholipase C inhibition by 1-[6-[((17β)-3-methoxyestra-1,3,5[10]-trien-17-yl)amino]hexyl]-1H-pyrrole-2,5-dione (U73122) (1 µM), IP3 receptor blockade by 2-aminoethoxydiphenyl borate (2-APB) (10 µM), or vesicular neurotransmitter deprivation by bafilomycin A1 (0.1 µM) were tested on the 0.3 µM 3,5-DHPG-evoked [3H]d-Asp release in spinal cord synaptosomes purified from 90-day-old SOD1G93A and age-matched WT mice. Spinal cord synaptosomes were labelled with [3H]d-Asp and exposed in superfusion to 0.3 µM 3,5-DHPG and to the above mentioned experimental conditions, as described under the Methods section. The presence of BAPTA-AM or bafilomycin A1 did not significantly affect synaptosomal labelling by [3H]d-Asp. Results are expressed as the percent increase with respect to the basal control release. The data reported are the means ± SEM of four independent experiments (four WT and four SOD1G93A mice) run in triplicate (three superfusion chambers for each experimental condition). * p < 0.001 vs. the effect of 3,5-DHPG (one-way ANOVA followed by Dunnett’s post-hoc test).
Ijms 20 04552 g002
Figure 3. mGluR1 and mGluR5 expression in spinal cord synaptosomes from WT and SOD1G93A mice. SOD1G93A mice were sacrificed at postnatal day 30, 60, and 90 days. Age-matched WT mice were used as controls. (A) mGluR1 and (B) mGluR5 expression were measured by SDS 4–20% polyacrylamide gel electrophoresis (PAGE) and western blot (WB) onto nitrocellulose membranes, using 20 µg of detergent soluble protein extracts from the homogenate of spinal cord synaptosomes. Mouse monoclonal antibodies anti-mGlu1 receptor, rabbit monoclonal antibody anti-mGluR5, and mouse monoclonal antibody anti-β-tubulin III were used. Representative immunoreactive bands are shown. mGlu1 and mGlu5 receptor expression levels were normalized for β-tubulin III in the same blotted membrane and the quantization is reported in the bar plots. Results are expressed as the relative density and the expression of mGluR1 or mGluR5 in WT synaptosomes is referred to as 1.00. Means ± SEM of three independent experiments (three WT and three SOD1G93A mice) are presented. No significant differences were detected (two-tailed student’s t-test).
Ijms 20 04552 g003
Figure 4. mGluR1 and mGluR5 expression in glutamatergic spinal cord synaptosomes from WT and SOD1G93A mice. SOD1G93A mice were sacrificed at different stages of the disease: (A) 30 days of life, (B) 60 days of life, and (C) 90 days of life, corresponding to pre-symptomatic (30 and 60 days) and early-symptomatic (90 days) phases of the disease. Age-matched WT mice were used as controls. Spinal cord synaptosomes were layered onto coverslips, fixed with paraformaldehyde, permeabilized with triton X-100, and incubated with the specific primary and secondary antibodies, as described in the Methods section. Samples were analyzed by laser confocal microscopy. The acquired images show the triple-stained immune-positivity for Alexa Fluor 488-tagged anti-vGluT1 (blue; glutamatergic synaptosomes), Alexa Fluor 647-tagged anti-mGluR1 (red), and Alexa Fluor 555-tagged anti-mGluR5 (green). The merge panels show the co-expression of vGluT1, mGluR1, and mGluR5. Bar plots indicate the quantitative relative florescence intensity of mGluR1 or mGluR5 in vGluT1-positive spinal cord synaptosomes. Representative images are shown (scale bar = 100 µm). mGluR1 and mGluR5 expression levels in vGluT1-positive synaptosomes were calculated. Means ± SEM of three independent experiments (three WT and three SOD1G93A mice) run in triplicate (three experimental replicates) are presented. No significant differences were detectable in spinal cord glutamatergic synaptosomes from 30- and 60-day-old WT and SOD1G93A mice. On the contrary, the expression of mGluR1 and mGluR5 was significantly higher in synaptosomes purified from 90-day-old SOD1G93A mice. * p < 0.001 vs. WT mice (two-tailed student’s t-test). (D) shows a magnification of the red frames in merge panels (reported in Figure 4C) of spinal cord synaptosomes purified from 90-day-old WT and SOD1G93A mice. Red arrows indicate axon terminals triple stained for vGluT1, mGluR1, and mGluR5 (scale bar = 3 µm).
Ijms 20 04552 g004
Figure 5. mGluR1 and mGluR5 expression in spinal cord total tissue from WT and SOD1G93A mice. SOD1G93A mice were sacrificed at postnatal day 30, 60, and 90. Age-matched WT mice were used as controls. (A) mGluR1 and (B) mGluR5 expression were measured by SDS 4–20% PAGE and WB onto nitrocellulose membranes, using 20 µg of detergent soluble protein extracts from the homogenate of the whole spinal cord. Mouse monoclonal antibody anti-mGluR1, rabbit monoclonal antibody anti-mGluR5, and mouse monoclonal antibody anti-glyceraldehyde 3-phosphate dehydrogenase (GAPDH) were used. mGluR1 and mGluR5 expression levels were normalized for GAPDH in the same membrane. Representative immunoreactive bands and quantization (bar plots) are shown. mGluR1 and mGluR5 levels are expressed as the relative density of SOD1G93A with respect to WT mouse bands, which is referred to as 1.00. Bars report mean ± SEM of five independent experiments (five WT and five SOD1G93A mice) run in triplicate (three experimental replicates) are presented. No significant differences were detected in 30-day-old mice, while significant differences were found in 60- and 90-day-old mice. * p < 0.05 vs. WT mice (two-tailed student’s t-test).
Ijms 20 04552 g005

