Communication

Long and Very-Long-Chain Ceramides Correlate with A More Aggressive Behavior in Skull Base Chordoma Patients

1
PhD School in Molecular and Translational Medicine, Department of Health Sciences, University of Milan, 20142 Milan, Italy
2
Department of Neurosurgery, Fondazione IRCCS Istituto Neurologico “Carlo Besta”, 20133 Milan, Italy
3
Clinical Biochemistry and Mass Spectrometry Laboratory, Department of Health Sciences, University of Milan, 20142 Milan, Italy
4
Neurology, Public Health and Disability Unit, Fondazione IRCCS Istituto Neurologico “Carlo Besta”, 20133 Milan, Italy
5
Neuropathology Unit, Fondazione IRCCS Istituto Neurologico “Carlo Besta”, 20133 Milan, Italy
6
Otolaryngology Unit, ASST Santi Paolo e Carlo, Department of Health Sciences, University of Milan, 20142 Milan, Italy
7
Neuroradiology Department, Fondazione IRCCS Istituto Neurologico “Carlo Besta”, 20133 Milan, Italy
*
Author to whom correspondence should be addressed.
Both first co-authors equally contributed.
Both last co-authors equally contributed.
Int. J. Mol. Sci. 2019, 20(18), 4480; https://doi.org/10.3390/ijms20184480
Submission received: 9 August 2019 / Revised: 7 September 2019 / Accepted: 9 September 2019 / Published: 11 September 2019
(This article belongs to the Special Issue Lipid as a Cancer Therapeutic Target)

Abstract

:
Background: Skull base chordomas are rare tumors arising from notochord. Sphingolipids analysis is a promising approach in molecular oncology, and it has never been applied in chordomas. Our aim is to investigate chordoma behavior and the role of ceramides. Methods: Ceramides were extracted and evaluated by liquid chromatography and mass spectrometry in a cohort of patients with a skull base chordoma. Clinical data were also collected and correlated with ceramide levels. Linear regression and correlation analyses were conducted. Results: Analyzing the association between ceramides level and MIB-1, total ceramides and dihydroceramides showed a strong association (r = 0.7257 and r = 0.6733, respectively) with MIB-1 staining (p = 0.0033 and p = 0.0083, respectively). Among the single ceramide species, Cer C24:1 (r = 0.8814, p ≤ 0.0001), DHCer C24:1 (r = 0.8429, p = 0.0002) and DHCer C18:0 (r = 0.9426, p ≤ 0.0001) showed a significant correlation with MIB-1. Conclusion: Our lipid analysis showed ceramides to be promising tumoral biomarkers in skull base chordomas. Long- and very-long-chain ceramides, such as Cer C24:1 and DHCer C24:1, may be related to a prolonged tumor survival and aggressiveness, and the understanding of their effective biological role will hopefully shed light on the mechanisms of chordoma radio-resistance, tendency to recur, and use of agents targeting ceramide metabolism.

1. Introduction

Chordoma is a rare tumor that derives from notochordal cells remnants. Although it can potentially occurs at any point along the vertebral column, the sacro-coccygeal and the skull base areas represent the most common locations [1,2,3]. Gross total tumor resection and post-operative high-dose radiation therapy actually represent the best standard of care [4,5,6]. The morbidity of skull base chordomas (SBC) is largely due to their tendency to recur and locally progress, although systemic metastases have been reported in around 10% of cases [1,4]. Their local aggressive growth pattern is characterized by encasement of neurovascular structures, dural penetration, bone infiltration, and brainstem adhesions which make chordoma a malignant tumor [1,3,5,7]. Large retrospective studies highlighted a trend towards the improvement of the survival time mainly due to the advancement of technology and surgical techniques [5,8,9,10,11,12]. Although these are great improvements, chordoma still impacts patients’ quality of life with 5-year overall survival (OS) and 5-year progression free-survival (PFS) rates of 78.4% and 50.8%, respectively [4]. Previous studies have highlighted that tumor morbidity and mortality seem to be affected not only by clinical variables, such as extent of resection, tumor location and post-operative radiation therapy, but also by biological features that are still not fully understood [2,3,13,14]. To date, no chemotherapeutic agent has showed its role as first-line therapy for chordomas. Precision medicine with molecular target therapies is emerging as a promising and innovative approach to directly inhibit specific molecules and their pathways known to be involved in SBC [2,15,16,17,18,19].
Sphingolipids act as bio-active molecular mediators in different cellular functions such as stress-response and downstream-signaling pathways, tumor proliferation, and resistance to treatment [20,21]. In particular, ceramides can drive programmed cell death, such as autophagy and apoptosis, in response to several stress and stimuli such as oxidative stress, ionizing radiation and chemotherapeutic agents but also be involved into cell proliferation [22,23]. Many studies have demonstrated the ceramides involvement in many types of cancers, such as breast, prostate cancers and gliomas, but nothing is known about their possible implication in chordomas [24,25,26].
The main goal of the present work is to analyze the role of ceramides (Cer) and dihydroceramides (DHCer) as prognostic biomarkers and their correlation with clinical variables to better elucidate chordoma behavior.

2. Results

2.1. Clinical and Radiological Features

Thirteen patients underwent 16 surgeries and have been included in the present study. There were seven males (53.8%) and six females (46.2%). Six tumors were primary (37.5%), eight were recurrent after radiation therapy (50%), and two were recurrent without radiation therapy (12.5%). These last two samples were gathered from the same patient who underwent a two-stage surgery; to avoid any misinterpretation of biochemical values due to surgery-induced cellular stress, only the first specimen has been included in the analysis. The mean age at the time of surgery was 53.3 ± 14.4 years (36–82). The mean follow-up period calculated from the first treatment performed at our Institution was 13.7 months (1–51). Among the recurrent chordomas, five (50%) had only one recurrence before, three (30%) had two previous recurrences, and two (20%) had three previous recurrences. The recurrent patients already treated with post-operative radiation therapy were as follows: five with carbon ions (62.5%) and three with proton beam therapy (37.5%). Preoperative radiological information was available in 14/15 of patients. One patient did not undergo contrast administration due to high serum creatinine. There were nine (64.3%) chordomas exhibiting an intense post-gadolinium MR enhancement, four (28.6%) with mild post-gadolinium MR enhancement, and one (7.1%) with no MR enhancement (Figure 1). For statistical purposes, we have identified and selected two groups: SBC exhibiting an intense post-gadolinium MR enhancement (nine chordomas) and with no/mild post-gadolinium MR enhancement (five chordomas).

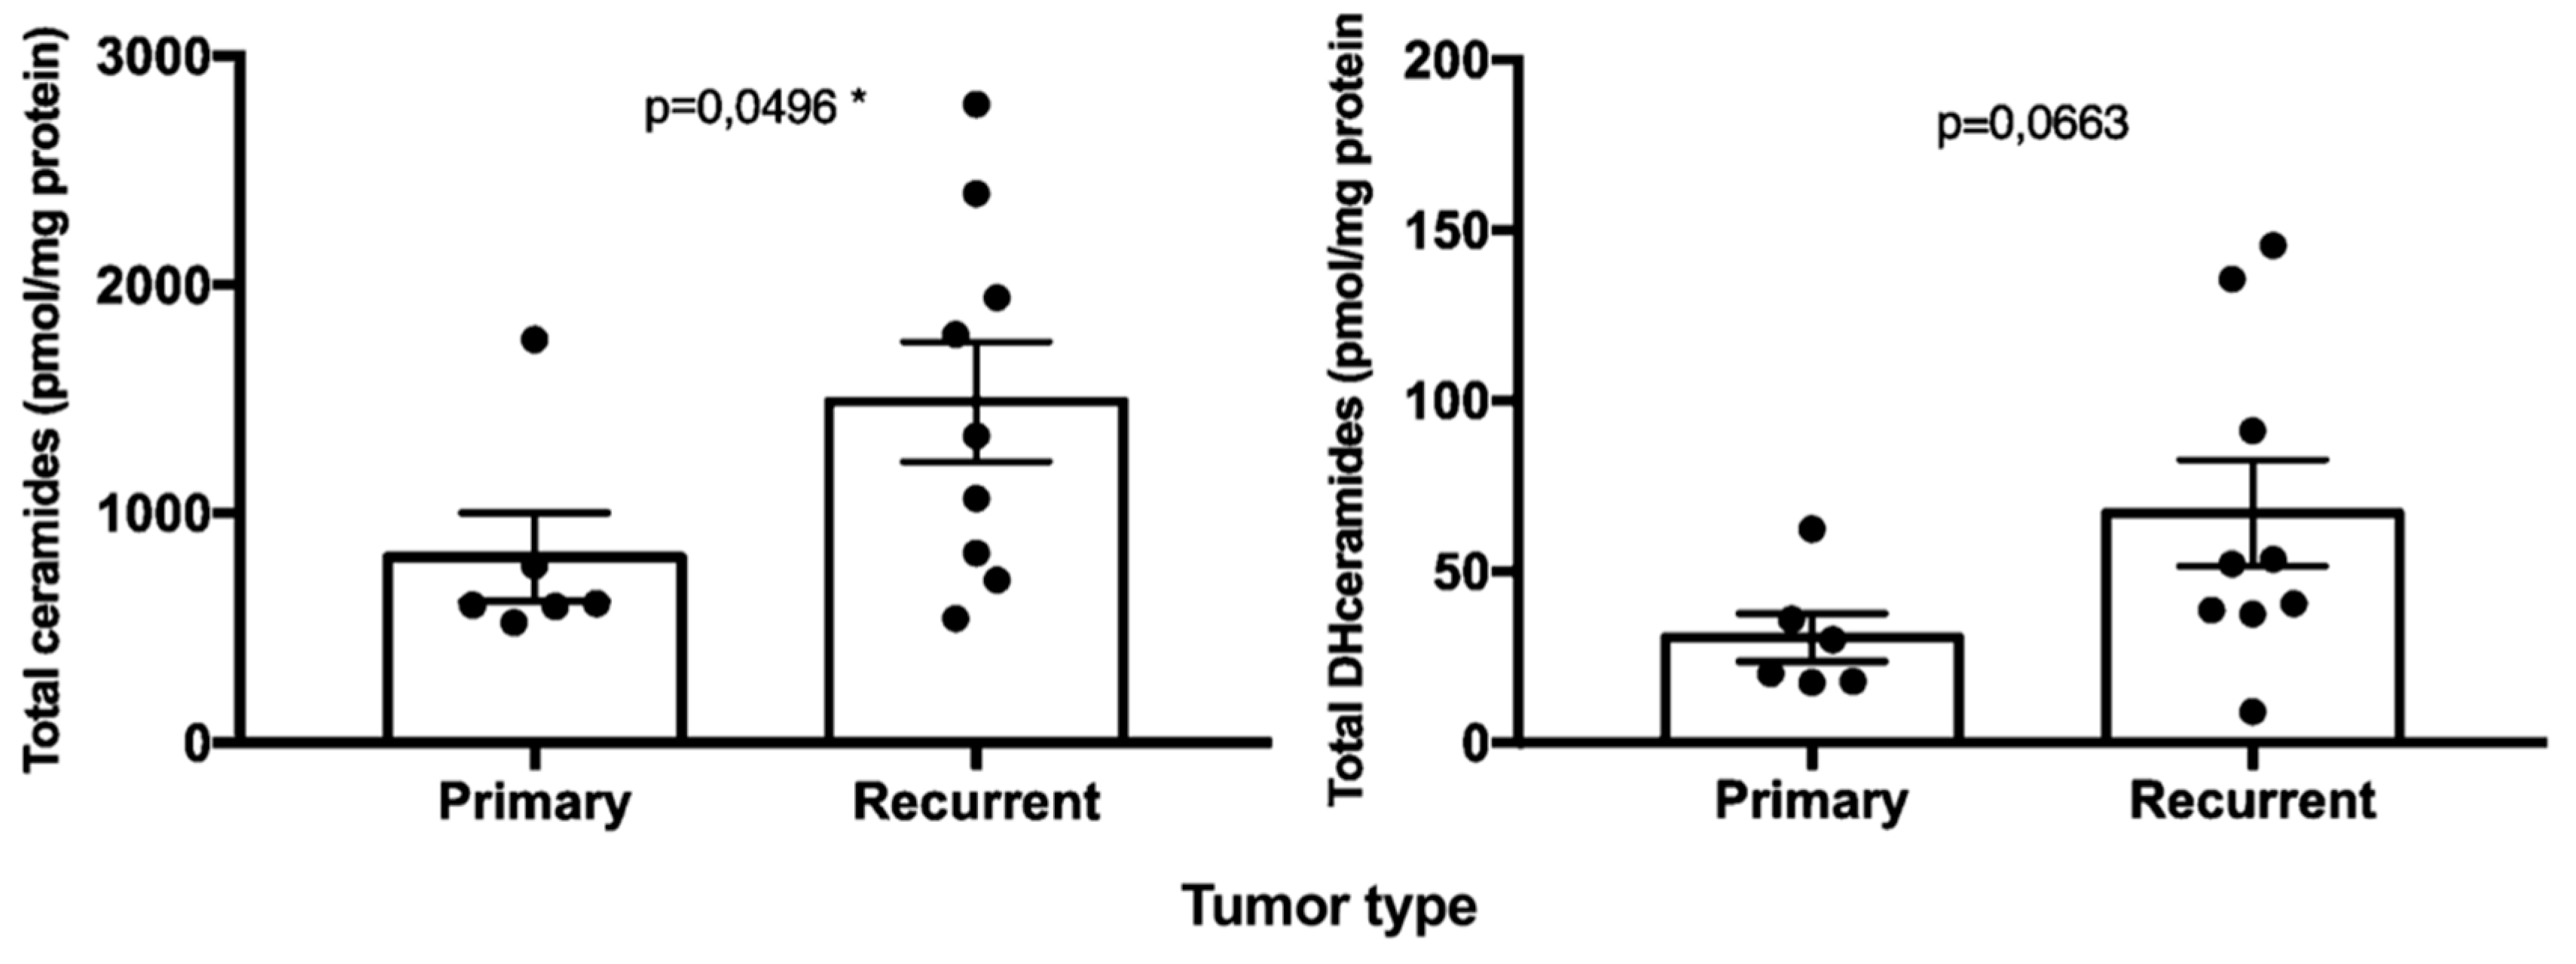
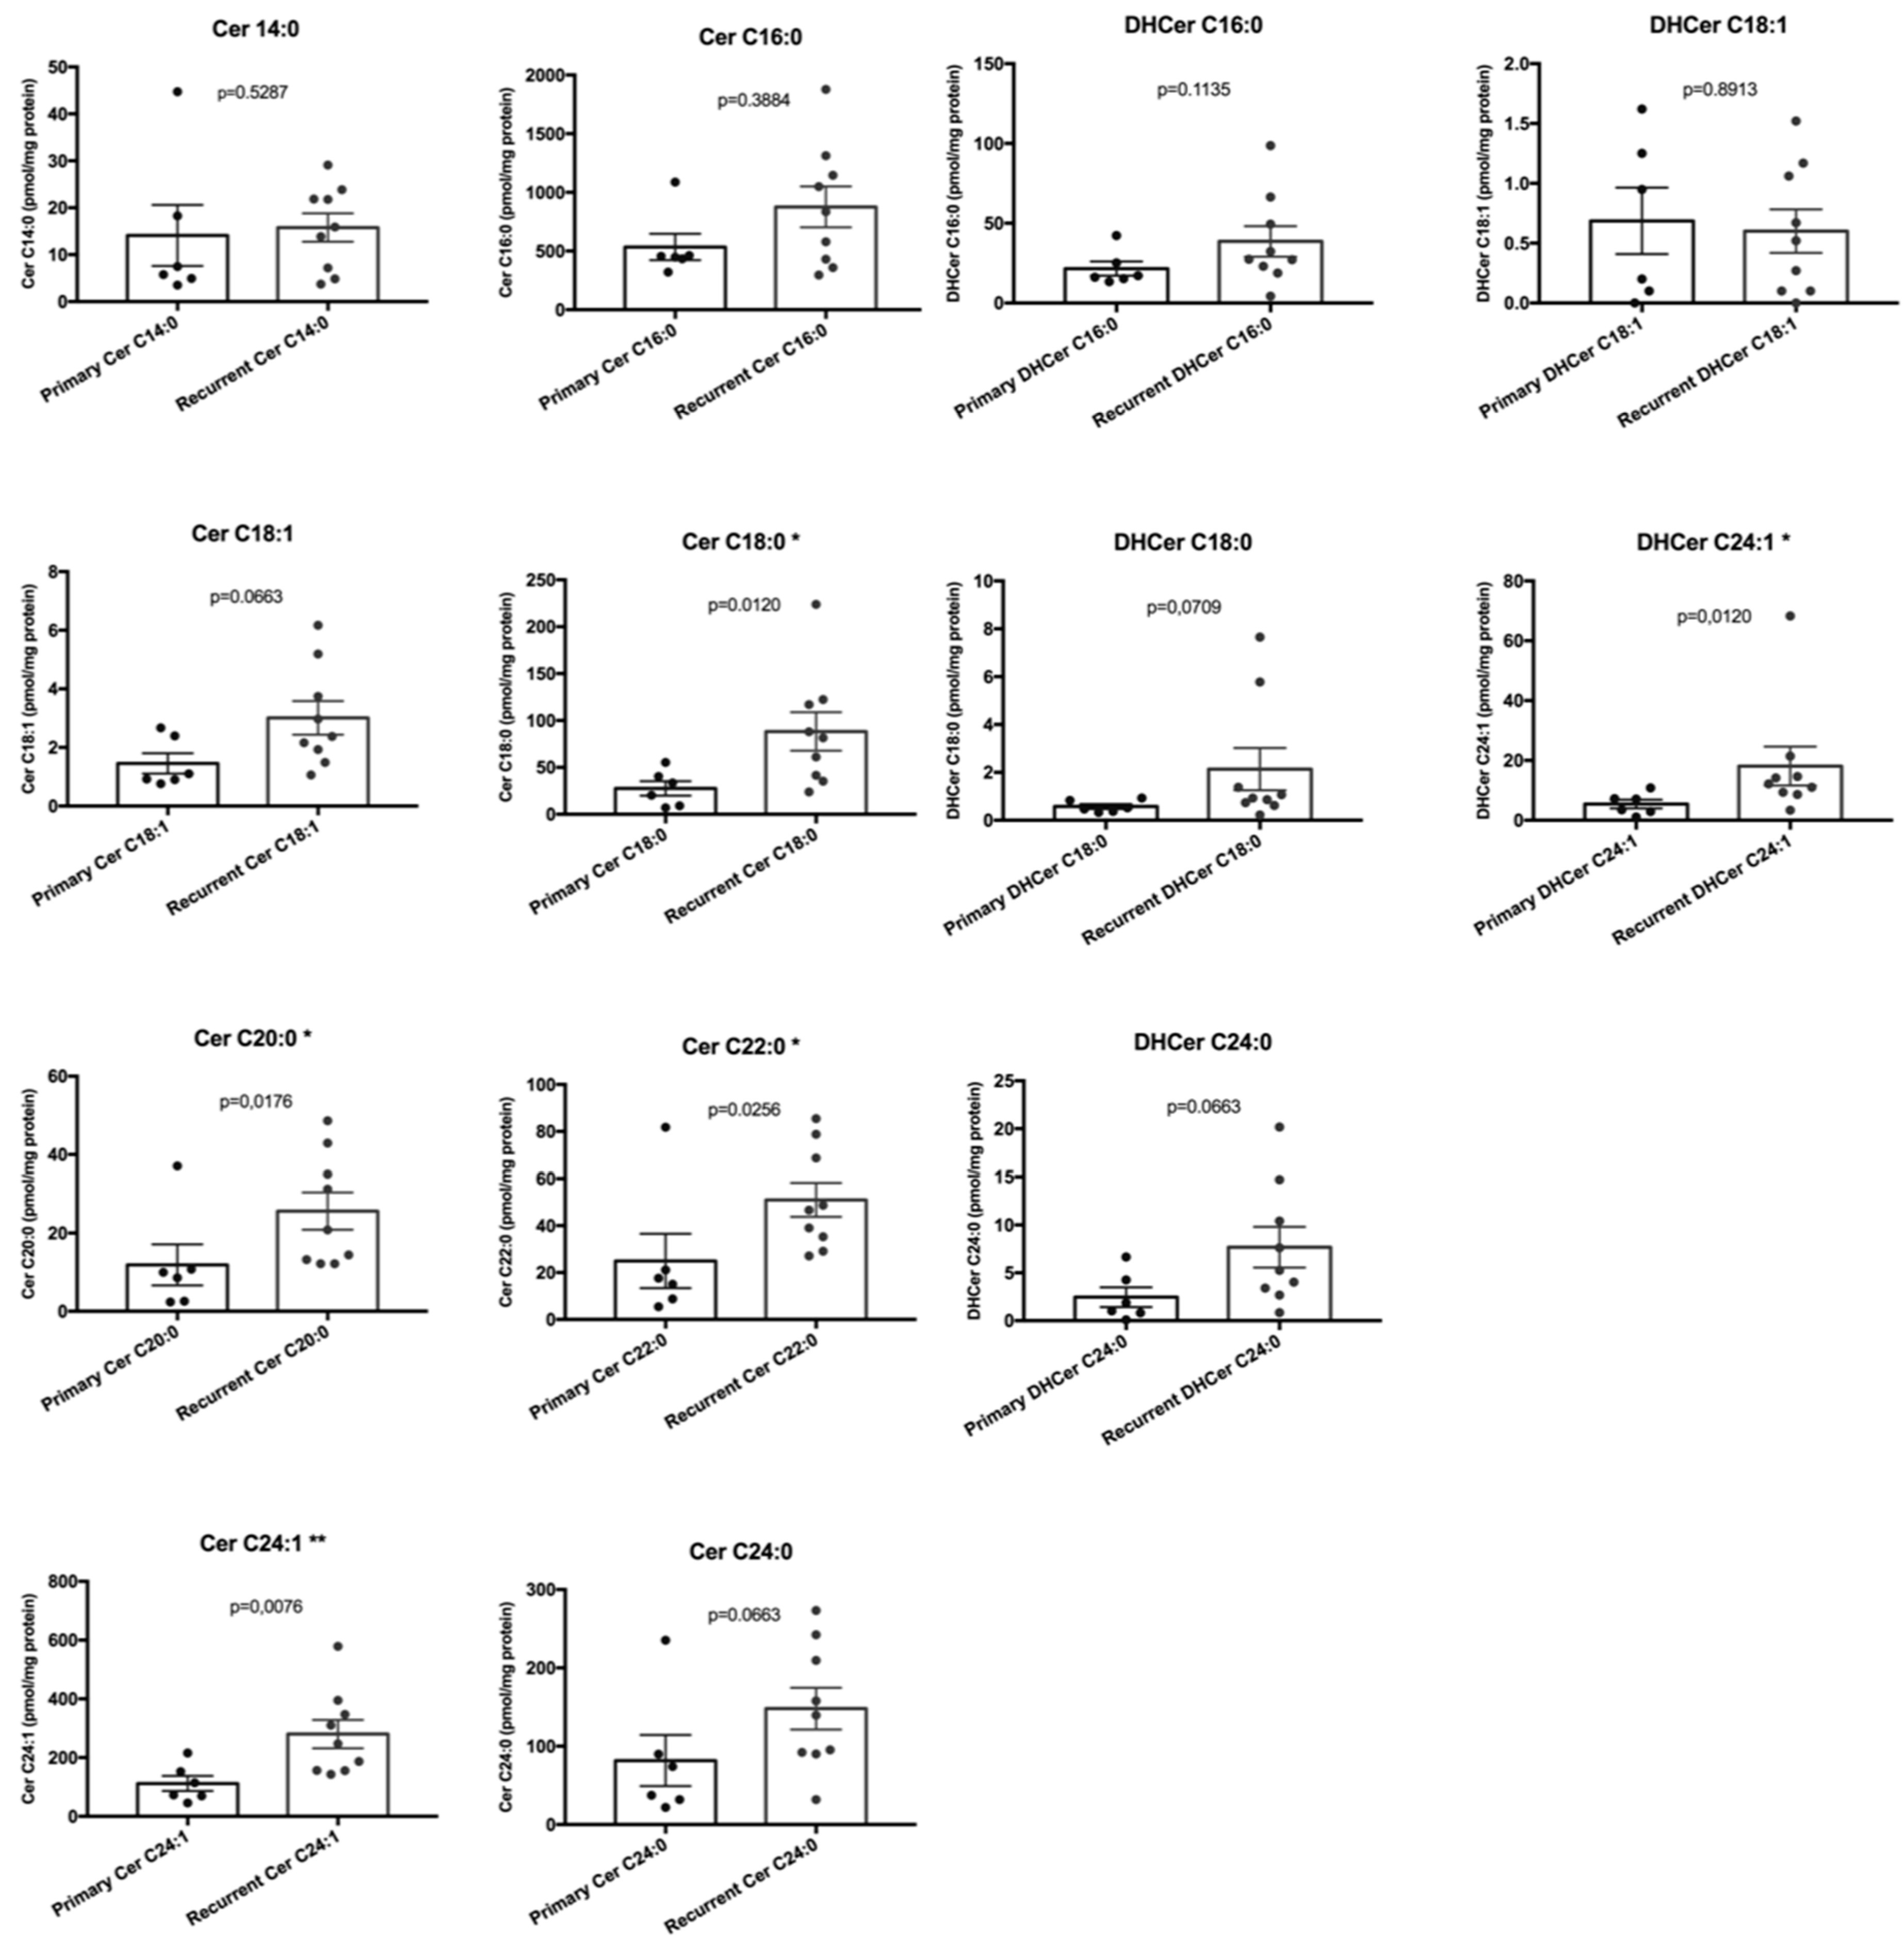
2.2. Sphingolipids Characterization and Tumor Type

Total and single ceramides and dihydroceramides species production have been evaluated on 15 chordomas: primary chordomas (n = 6), recurrent without radiotherapy (n = 1) and recurrences after radiotherapy (n = 8). The mean total ceramides and dihydroceramides species in chordomas were 1216.2 ± 730.7 pmol/mg protein (522.5–2787.5) and 52.6 ± 40.6 pmol/mg protein (9.0–145.6), respectively. The mean total ceramides and dihydroceramides species in primary chordomas were 808.4 ± 451.4 pmol/mg (522.5–1760.2) and 30.7 ± 16.4 pmol/mg (17.6–62.4), respectively. The mean total ceramides and dihydroceramides species in recurrent chordomas were 1488.1 ± 763.8 pmol/mg (540.7–2787.5) and 67.2 ± 45.5 pmol/mg (9.0–145.6), respectively. Eight ceramides subspecies were analyzed and Cer C16:0 (60.8%), Cer C24:1 (17.5%), and Cer C24:0 (10.0%) were the most abundant single ceramides in SBC. In the primary chordoma group, the most abundant were Cer C16:0 (66.1%), Cer C24:1 (13.8%), and Cer C24:0 (10.1%). In the recurrent chordoma group, the most abundant were Cer C16:0 (58.9%), Cer C24:1 (18.8%), and Cer C24:0 (9.9%). Five dihydroceramides were analyzed and DHCer C16:0 (60.5%), DHCer C24:1 (24.8%), and DHCer C24:0 (11.4%) were the most abundant single ceramides in SBCs. In the primary chordoma group, the most abundant were DHCer C16:0 (70.4%), DHCer C24:1 (17.7%), and DHCer C24:0 (9.5%). In the recurrent chordoma group, the most abundant were DHCer C16:0 (57.5%), DHCer C24:1 (27.0%), and DHCer C24:0 (11.4%).
Total ceramides species (Figure 2) were significantly higher in recurrent chordomas that underwent previous surgical resection and radiation therapy in comparison to the primary chordomas (p = 0.0496). When analyzing the effect of radiation therapy, the ceramides in the group of chordomas with previous radiation therapy were not significantly different from the ceramides in the group of chordomas with no previous radiation therapy (p = 0.0541). DHCer levels (Figure 2) were not significantly different between primary and recurrent chordomas (p = 0.0663) and between chordoma with previous radiation therapy and chordoma without radiation therapy (p = 0.1520).
Among the single ceramides species (Figure 3), Cer C18:0 (p = 0.0120), Cer C20:0 (p = 0.0176), Cer C22:0 (p = 0.0256), and Cer C24:1 (p = 0.0076) were significantly different between primary and recurrent SBCs, whereas Cer C14:0 (p = 0.5287), Cer C16:0 (p = 0.3884), Cer C18:1 (p = 0.0663), and Cer C24:0 (p = 0.0663) did not reach any statistical significance. Among the single DHCer species (Figure 3), DHCer C24:1 (p = 0,0120) was the only one significantly different between primary and recurrent SBCs, whereas DHCer C16:0 (p = 0.1135), DHCer C18:1 (p = 0.8913), DHCer C18:0 (p = 0.0709), and DHCer C24:0 (p = 0.0663) did not reach any statistical significance.

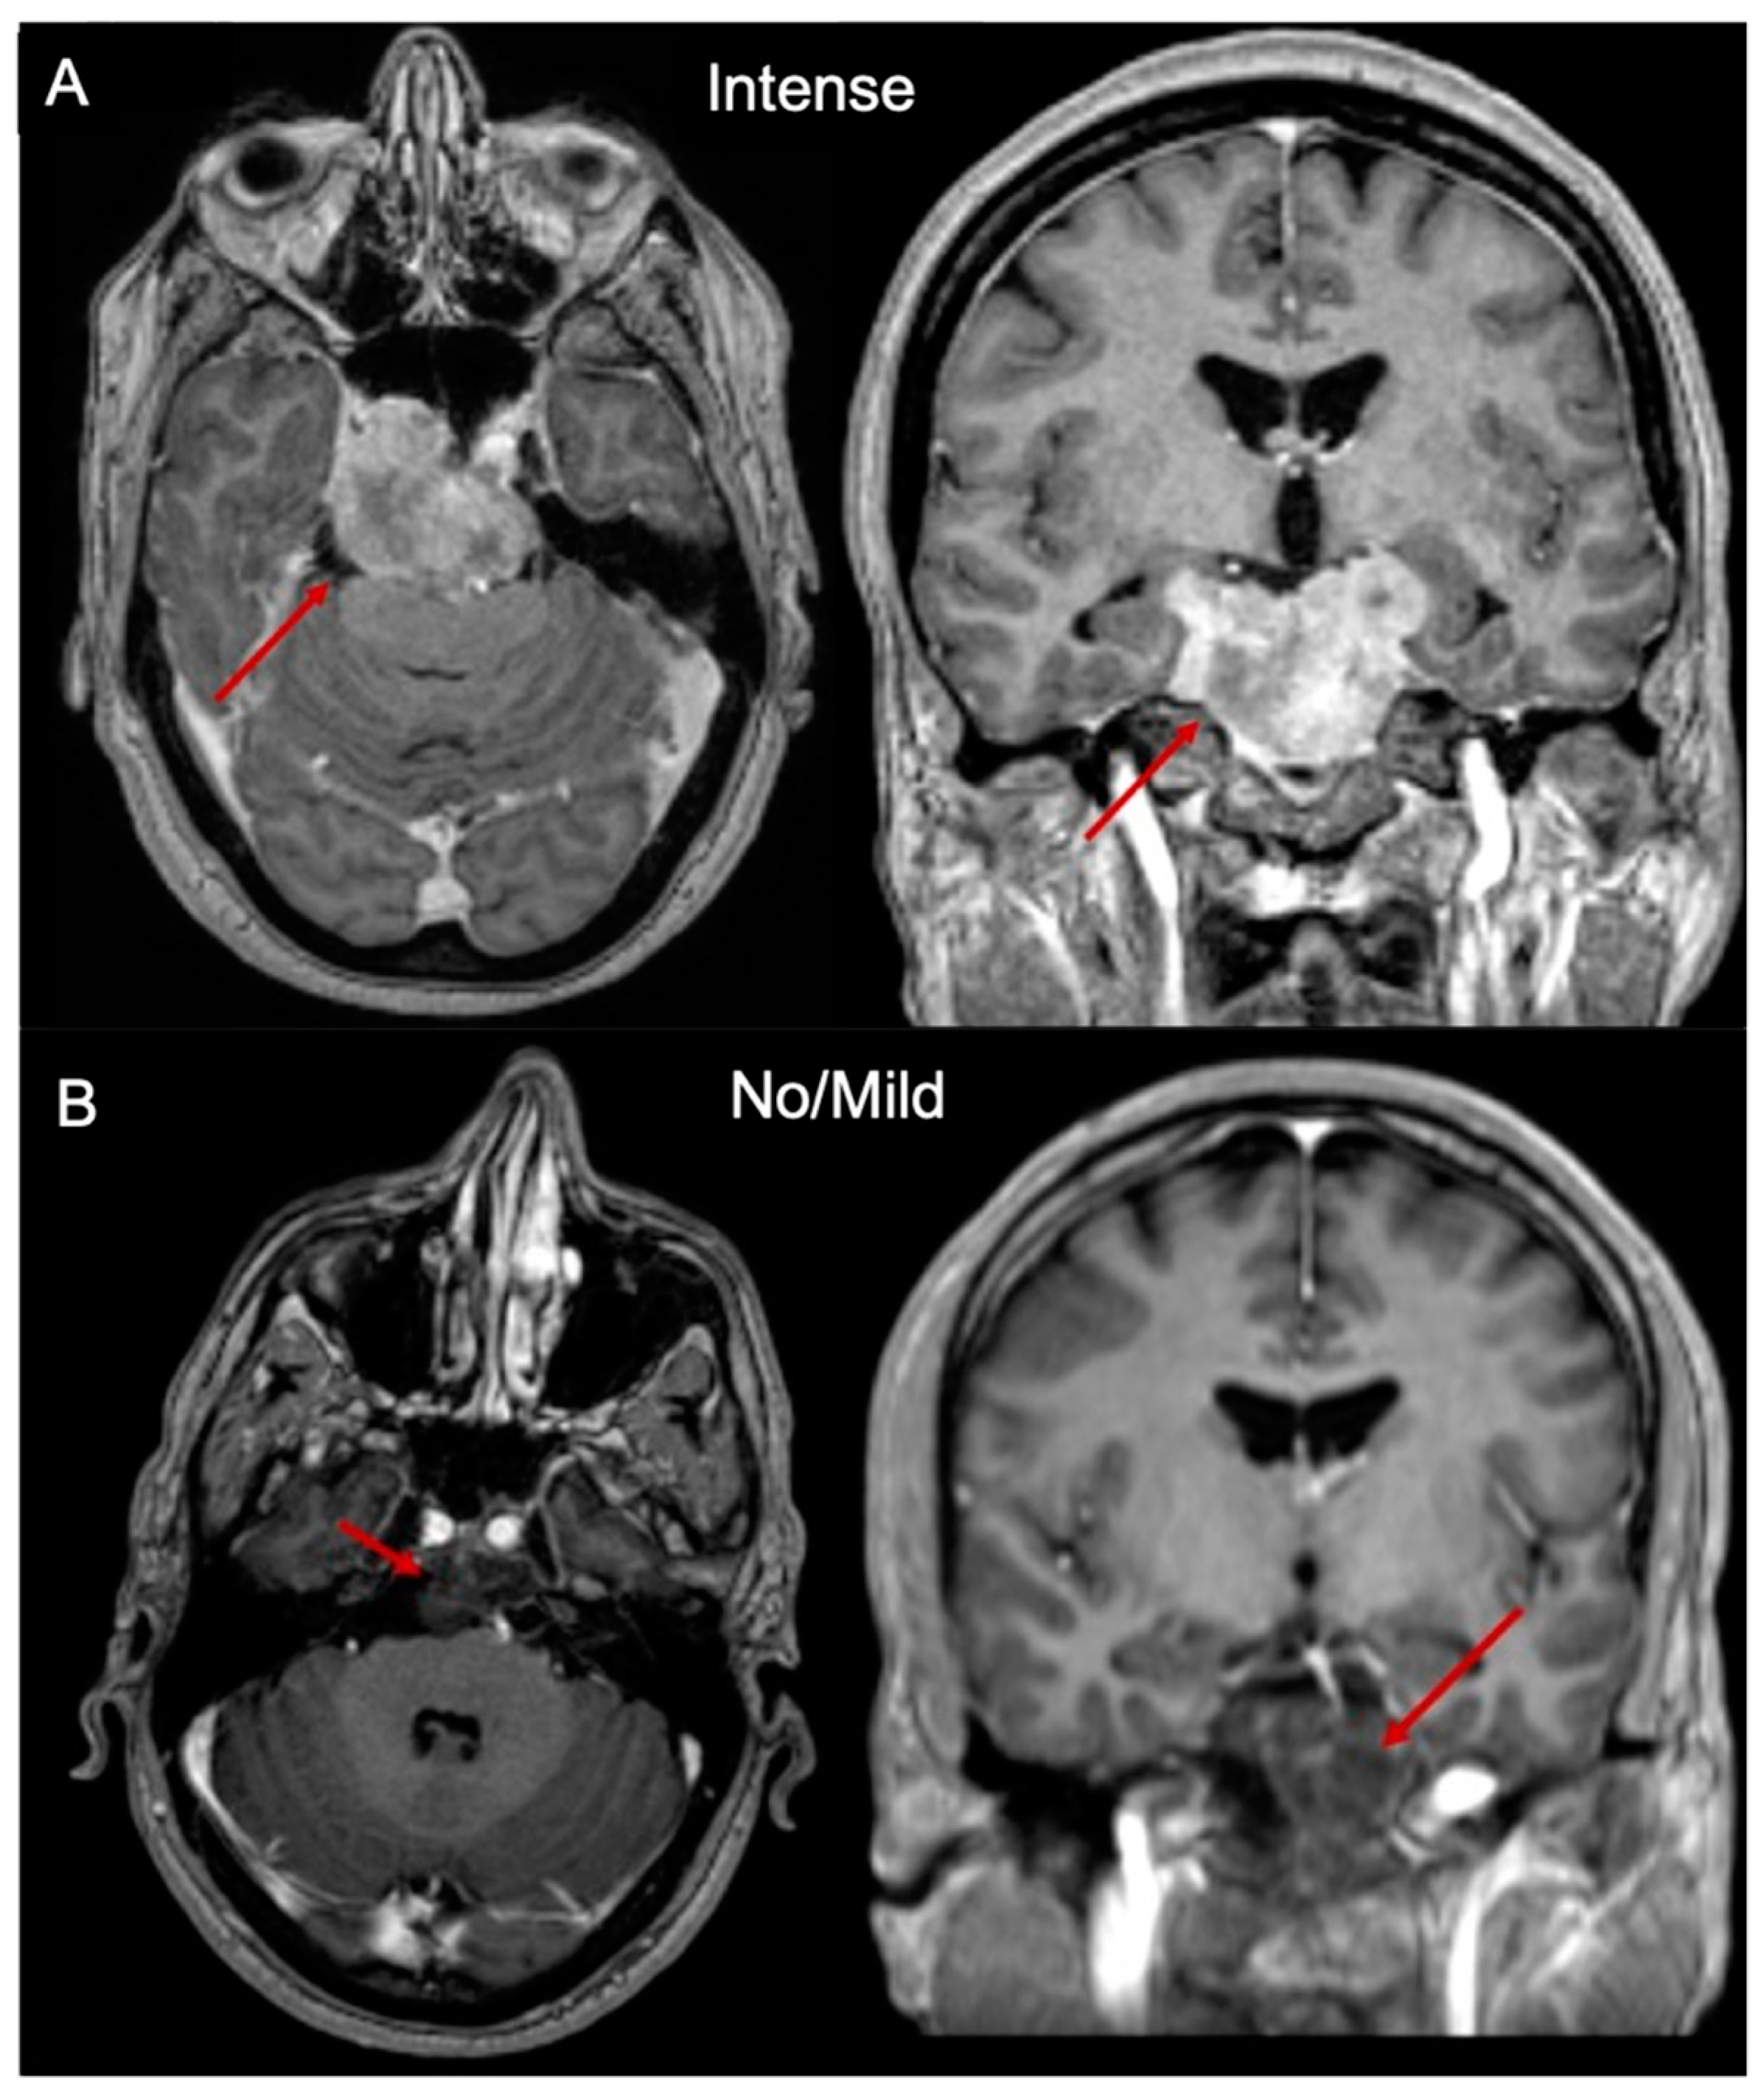
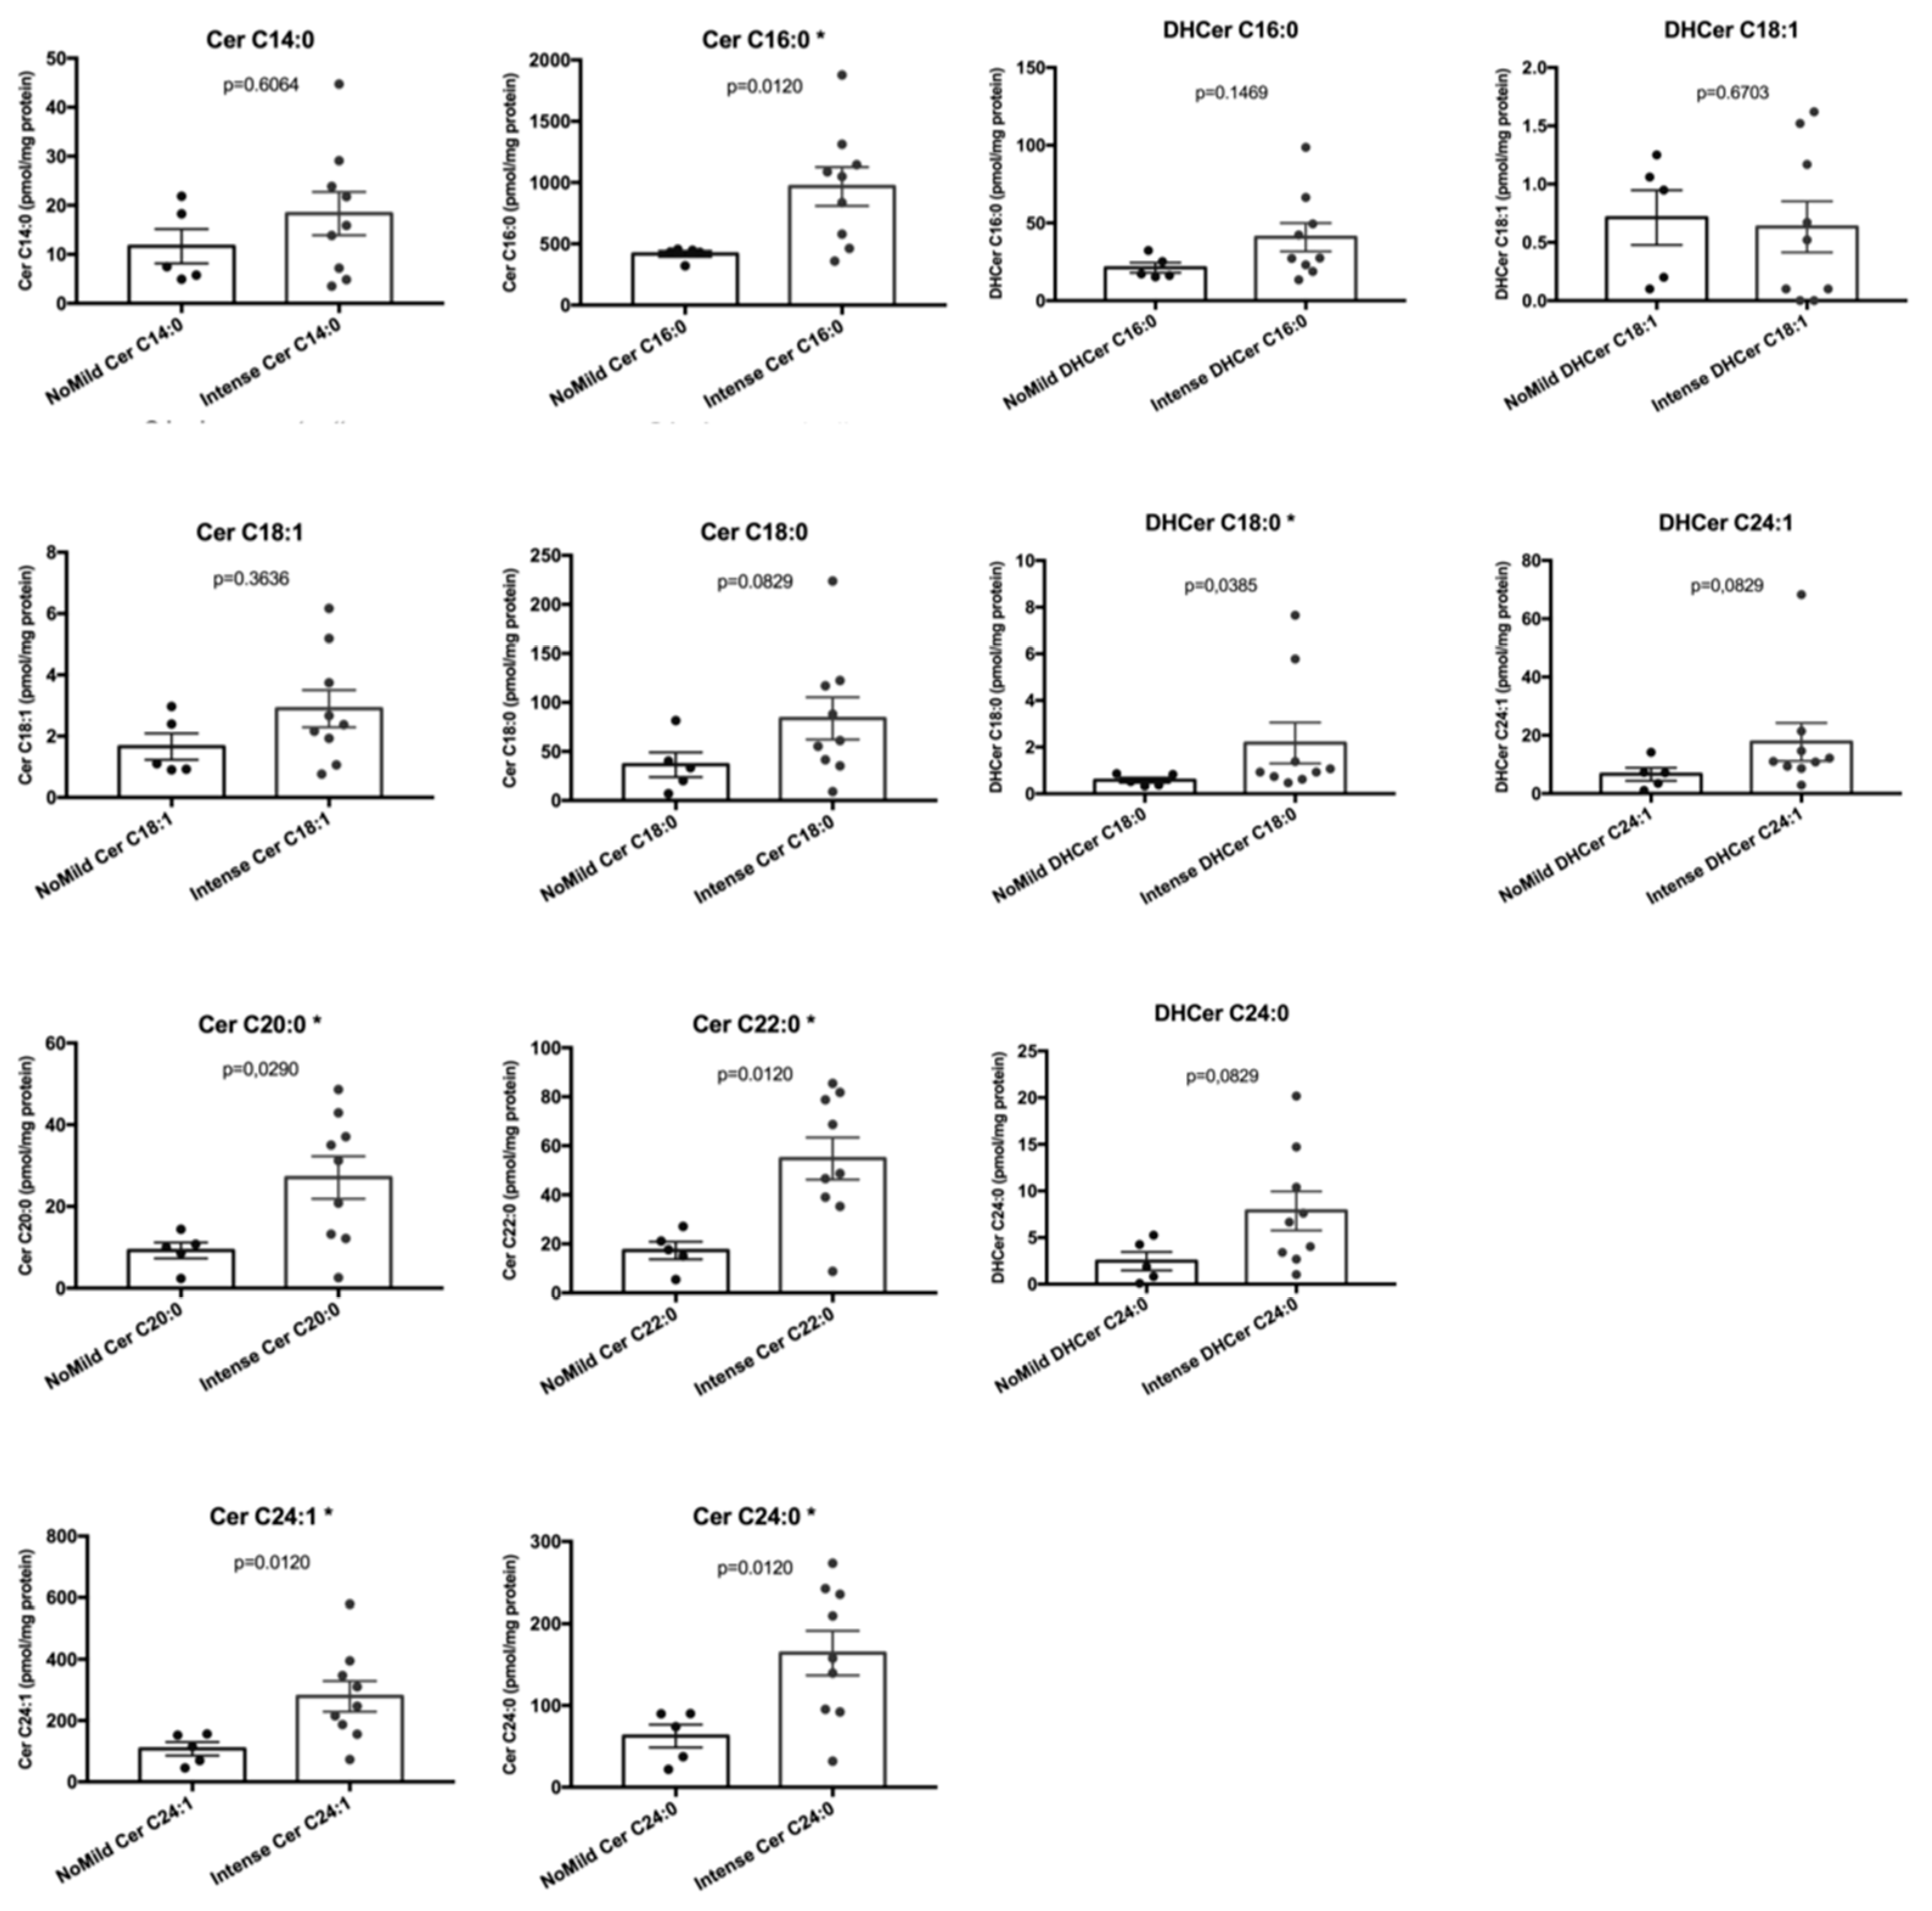
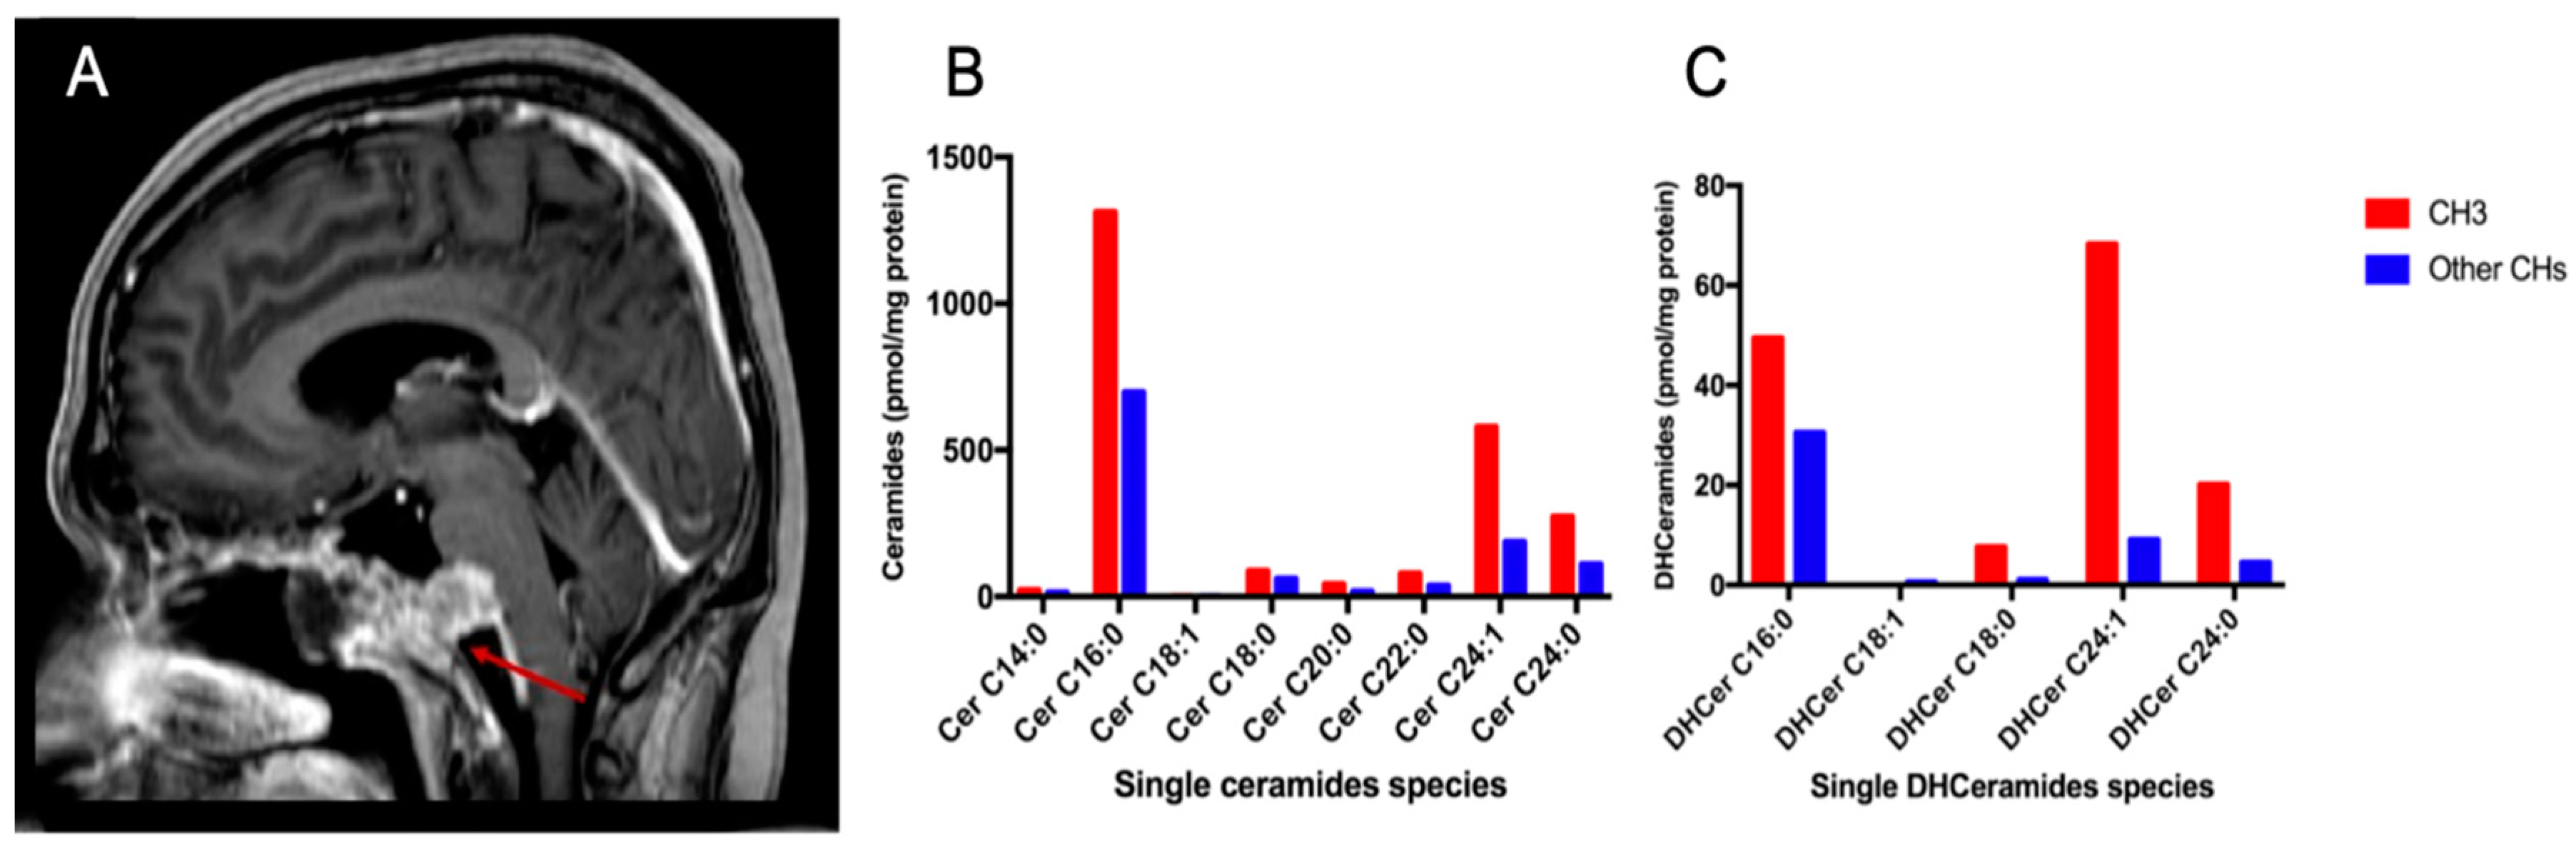
2.3. Sphingolipids Characterization and MR Contrast Enhancement Pattern

The mean total ceramides and dihydroceramides species in the “intense enhancement” group were 1597.6 ± 737.8 pmol/mg (592.7–2787.5) and 69.1 ± 45.0 pmol/mg (17.8–145.6), respectively. The mean total ceramides and dihydroceramides species in the “no/mild enhancement” group were 664.7 ± 120.4pmol/mg (522.5–826.0) and 31.5 ± 13.6 pmol/mg (17.6–53.6), respectively. Total Cer and DHCer levels (Figure 4) were significantly higher in “intense enhancement” chordomas in comparison to the “no/mild enhancement” chordomas (p = 0.0290 and p = 0.0186, respectively).
Among the single ceramides species (Figure 5), Cer C16:0 (p = 0.0120), Cer C20:0 (p = 0.0290), Cer C22:0 (p = 0.0120), Cer C24:1 (p = 0.0120), and Cer C24:0 (p = 0.0120) were significantly different between “intense enhancement” chordomas and “no/mild enhancement” chordomas, whereas Cer C14:0 (p = 0.6064), Cer C18:1 (p = 0.3636), and Cer C18:0 (p = 0.0829) did not reach any statistical significance. Among the single DHCer species (Figure 5), DHCer C18:0 (p = 0.0385) was the only one significantly different between “intense enhancement” chordomas and “no/mild enhancement” chordomas, whereas DHCer C16:0 (p = 0.1469), DHCer C18:1 (p = 0.6703), DHCer C24:1 (p = 0.0829), and DHCer C24:0 (p = 0.0829) did not reach any statistical significance.

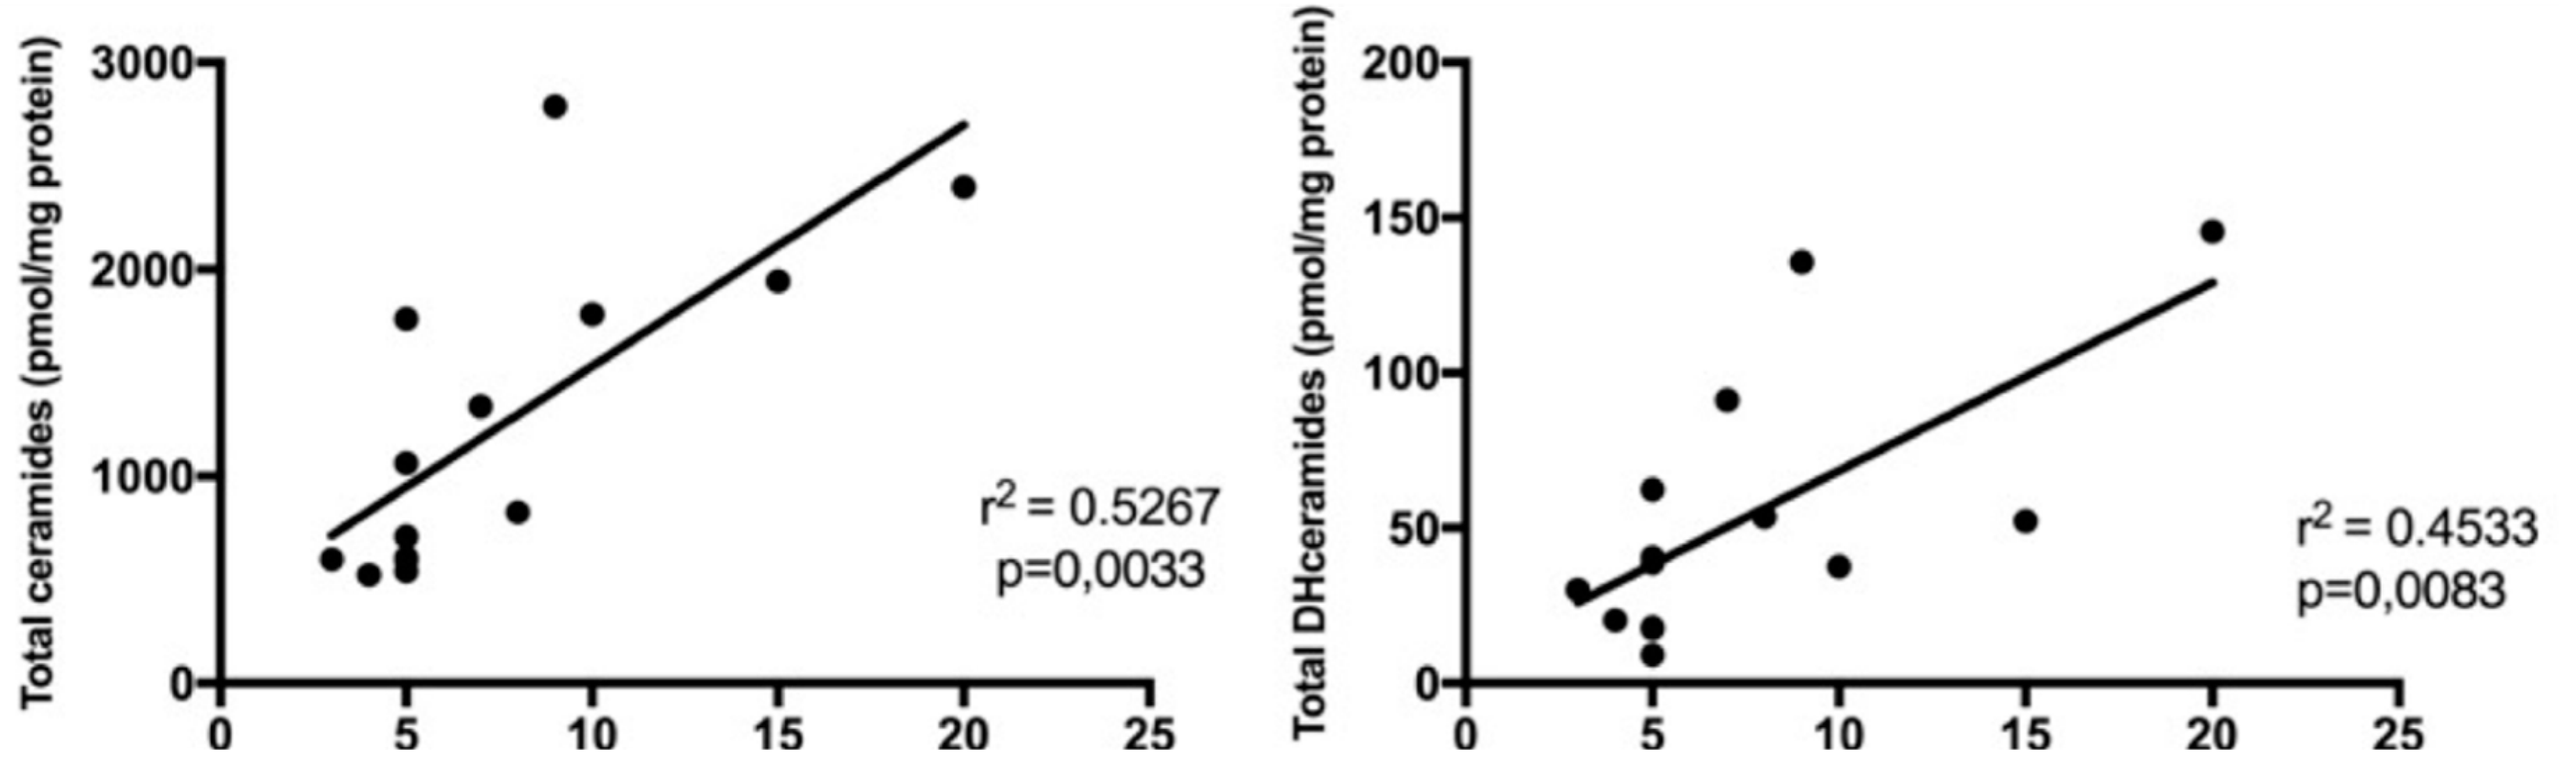
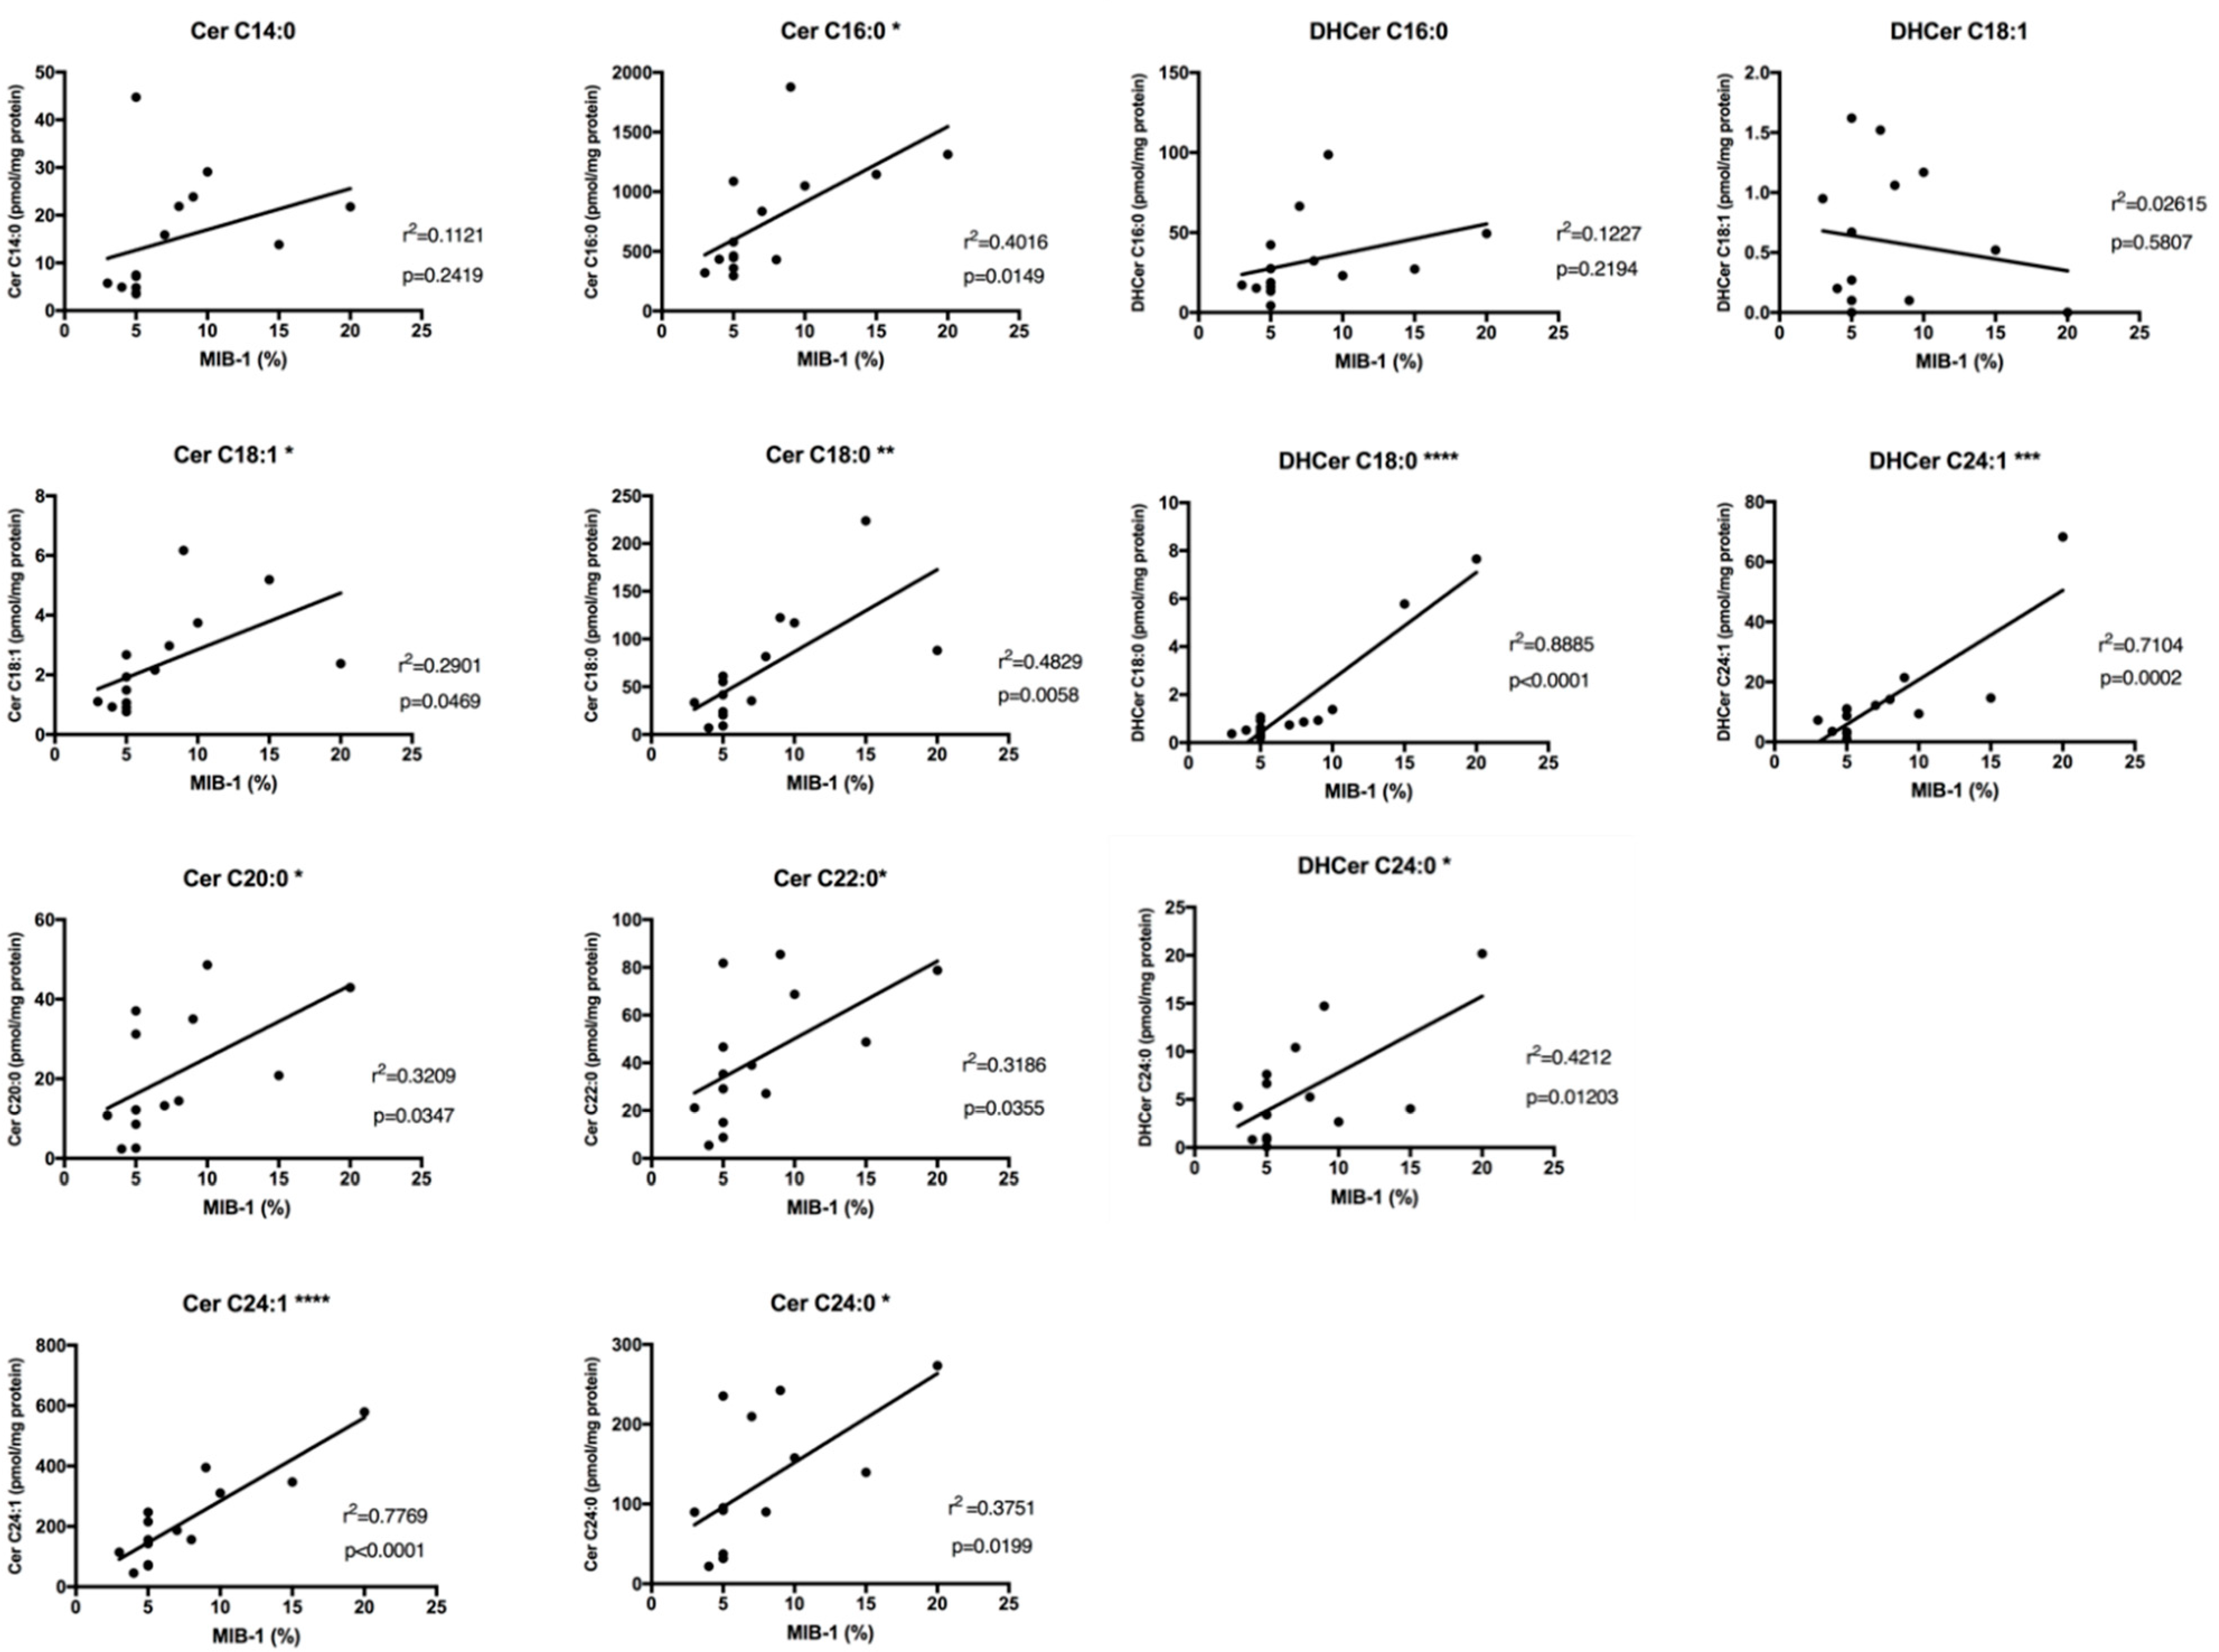
2.4. Sphingolipids Characterization and Proliferative Index

Following the hypothesis of ceramides as aggressive behavior biomarkers of SBC, we, therefore, investigated the relationships between Cer and DHCer levels with the tumor proliferation rate, evaluated by MIB-1 staining on IHC slices. MIB-1 staining information was available in 14/15 of patients. Analyzing the association between Cer levels and MIB-1 within each SBC patient (Figure 6), total ceramides levels showed a strong association (r = 0.7257, r2 = 0.5267) with MIB-1 staining (p = 0.0033). Analyzing the association between DHCer levels and MIB-1 within each SBC patient (Figure 6), total DHCer levels showed also a moderate association (r = 0.6733, r2= 0.4533) with MIB-1 staining (p = 0.0083).
In particular, we have analyzed any possible association between every single ceramide species and MIB-1 (Figure 7) and found that Cer C16:0 (r = 0.6338, r2 = 0.4016, p = 0.0149), Cer C18:1 (r = 0.5386, r2 = 0.2901, p = 0.0469), Cer C18:0 (r = 0.6949, r2 = 0.4829, p = 0.0058), Cer C20:0 (r = 0.5665, r2 = 0.3209, p = 0.0347), Cer C22:0 (r = 0.5645, r2 = 0.3186, p = 0.0355), Cer C24:1 (r = 0.8814, r2 = 0.7769, p ≤ 0.0001), and Cer C24:0 (r = 0.6125, r2 = 0.375, p = 0.0199) levels showed a significant correlation with MIB-1 staining. Moreover, we have also analyzed an association between every single dihydroceramides species and MIB-1 (Figure 7) and found that DHCer C18:0 (r = 0.9426, r2 = 0.8885, p ≤ 0.0001), DHCer C24:1 (r = 0.8429, r2 = 0.7104, p = 0.0002) and DHCer C24:0 (r = 0.649, r2 = 0.4212, p = 0.0120) levels showed a significant correlation with MIB-1 staining. The results of correlation analysis are shown in Table 1.
A regression model has been developed to evaluate the role of ceramides and dihydroceramides as independent predictors of MIB-1 (Table 2). The level of significance was set to 0.05/15 = 0.0033, according to Bonferroni’s correction. All the independent variables were entered into the equation first and each one was deleted one at a time if they did not contribute to the regression equation by the backward elimination method. A multi-collinearity test has been used to assess the Variance Inflation Factor (VIF) and tolerance. Final candidate predictive factors that well fitted the model were: Cer C24:1 (r = 0.824, p ≤ 0.001) and DHCer C18:0 (r = 0.748, p = 0.002).

3. Discussion

This study represents the first sphingolipid analysis in SBCs surgical specimens. Previous studies have demonstrated that a delicate equilibrium exists between long-chain (i.e. Cer C16:0, Cer C18:0, Cer C20:0) and very-long-chain (Cer C24:1, Cer C24:0) ceramides to determine their specific biological role in regulating apoptosis and proliferation pathways [23,27]. The specific ultrastructural structure of chordomas consists of many vacuoles and lipid raft-like regions of endoplasmic reticulum tightly linked with mitochondrial membranes, called MAM mitochondria-associated ER membrane [28]. These structures have been found to be involved in lipid synthesis, apoptosis and cell proliferation [28,29,30]. Based on such observations, we decided to perform a ceramide analysis in chordoma samples.
Our preliminary targeted analysis showed that recurrent skull base tumors presented a higher level of total ceramides than the primary ones (p ≤ 0.05). Moreover, single ceramides species have never been correlated with clinical variables and no definitive biological role could be hypothesized in chordomas. The regression and correlation analyses showed that very-long-chain ceramides (such as Cer C24:1) were significantly different between primary and recurrent chordomas (p = 0.0076). Also, the very-long-chain DHCer C24:1 (p = 0.0120) was the only species that was significantly different related to tumor type. Recurrent patients have undergone previous combined treatments such as surgery and RT and both factors may explain why ceramides are significantly different in the two groups [25,31,32,33]. Since the recurrent tumor type and previous treatments represented a significant negative prognostic factor relating to worse OS and PFS in previous studies, a raising in ceramides content in SBCs could act as a negative prognostic factor [16,34,35,36]. We showed that there is also a concomitant rise in both ceramides and dihydroceramides and such a finding could be related to an activation of the de-novo pathway, but further analyses are needed. De novo pathway represents a strong autophagy inducer [21,37,38,39]. In vitro, autophagy could trigger both a cytoprotective action promoting radio-resistance and a cytotoxic function [40,41,42,43]. Autophagy induces the activation of many cellular pathways, and damaged organelles and proteins are conveyed to degradation to maintain cellular homeostasis [42,44,45,46]. For example, ionizing radiation induces mitochondrial damage, which triggers autophagy mediated by E3-ubiquitin ligase p62 [31]. Different molecules have been developed as inhibitors of serine palmitoyltransferase (SPT), the first enzyme involved in the de-novo synthesis pathway. Some potent and selective inhibitors have been isolated from microorganisms, such as sphingofungins, lipoxamycins, viridiofungins, and myriocin (Myr) [47,48]. Several studies showed the efficacy of Myr treatment, the only commercially available product, either in in-vivo or in-vitro models and its capacity to irreversibly inhibit SPT [47,49]. Myr showed to also have a potential role in reducing tumor cell proliferation through SPT inhibition [47,50]. The involvement of de-novo ceramide synthesis has been shown in different immunometabolic diseases clusters such as obesity, diabetes and neurodegeneration, cystic fibrosis, and retinitis pigmentosa [51,52,53,54,55]. Several recent studies showed that intra-tracheal administration of Myr in CF mouse model infected with Pseudomonas aeruginosa or Aspergillus fumigatus showed an anti-inflammatory role due to the inhibition of de-novo sphingolipid synthesis [54,56,57,58]. Therefore, Myr may have a significant role in the future therapeutic innovation and application in chordoma patients where a de-novo ceramide synthesis seems to be over activated. More studies are needed to firstly confirm the deregulation of such ceramide biosynthesis pathways in chordoma and to assess the pharmacokinetics and pharmacodynamics of Myr.
The radiological appearance of SBC is very heterogeneous and has been scarcely described and correlated with prognosis in the literature [59,60]. The degree of contrast enhancement in chordoma is not systematically described and is not considered in the modern clinical and radiological patient management as a prognostic factor in SBC [60,61]. On the ground of previous confirmatory quantitative radiomics results, we adopted the following classification of MR enhancement pattern: intense enhancement, mild enhancement and no enhancement that revealed to be very simple to use, fast-forward, and reliable [60]. Of note, the degree of Gd enhancement in our cohort of SBC showed to strongly correlate with both OS and PFS and correlate with a more aggressive behavior [19]. It could, therefore, represent a radiological bio-marker of a more aggressive behavior (Figure 8). To further support ceramides as a bio-marker of aggressive behavior of chordomas, we tried to perform a correlation analysis in relation to the gadolinium enhancement pattern. Firstly, total ceramides and dihydroceramides levels were significantly higher in the intense gadolinium enhancement group than in the no/mild enhancement group (p = 0.0290). Moreover, very-long-chain single ceramides species were significantly different between the two radiological categories (p = 0.0120). Such results confirmed that very-long-chain ceramides and dihydroceramides may represent an intrinsic biological feature of more aggressive chordomas.
We, then, correlated the Cer and DHCer levels with tumor proliferation rate MIB-1 marker and found that they were strongly correlated (r = 0.7257, p = 0.0033 and r = 0.6733, p = 0.0083, respectively). Higher levels of sphingolipids were associated with higher MIB-1 values and, therefore, to high proliferating tumors. The single ceramides and dihydroceramides species that were more correlated to high proliferative tumors were Cer C24:1 and its respective DHCer C24:1 (r = 0.8814, p ≤ 0.0001 and r = 0.8429, p = 0.0002, respectively). Moreover, the final candidate predictive factors that well fitted the regression model were Cer C24:1 (beta = 0.348, p = 0.025) and DHCer C18:0 (beta = 0.663, p ≤ 0.001).
There is a delicate balance between different CerS isoforms and the different ceramide species production within the stress-induced response and, moreover, tumoral cells can activate pro-survival mechanisms that could relate to chordoma radio-resistance [62]. A paper showed, in an in-vitro HeLa cells model, that ceramides produced by CerS5 (mainly Cer C16:0) following radiation have a pro-apoptotic role, whereas ceramides produced by CerS2 (mainly very-long-chain, Cer C24:1 and C24:0) have a pro-survival role [62]. Interestingly, Kolb et al. also showed through a lipid-targeted analysis, that a chordoma cell line presented a massive upregulation of glucosylceramides GlyCer C24:0 and GlyCer C24:1 compared with other health and pathological cell lines and postulated that these species could be related to chordoma radio-resistance [28].
Based on our results, Cer C24:1 and DHCer C18:0 may represent aggressiveness biomarkers of SBCs. The concomitant rise of DHCer C24:1 may also be explained by an exaggerated upregulation of the de-novo pathway that, in turn, may be the inducer of cytoprotective autophagy concurring to cell survival and resistance to different treatments [19,63].
Since it is a preliminary study, numerous samples are needed to confirm and externally validate our results. Chordoma is a very rare tumor, and multi-institutional studies are, therefore, important to achieve a larger sample size. Another limitation is represented by a short follow-up of chordomas patients and, therefore, longer follow-ups are needed to further correlate ceramides levels with outcome prognostic factors such as OS and PFS. Moreover, to better asses if the de-novo pathway is actually activated, the specific involved enzyme should be ad hoc analyzed. Specifically, the expression and activity of the following enzymes could be assessed: i) de-novo sphingolipid synthesis (serine palmitoyl transferase, DH Cer synthase, Cer desaturase); ii) recycling of sphingosine to generate Cer (different Cer Synthases, from CerS1 to CerS6); iii) Cer metabolism (ceramidases, neutral and acid sphingomyelinases, glucosylceramide synthase, and glucocerebrosidase) [23,64].

4. Materials and Methods

4.1. Study Design and Population

A retrospective review of all consecutive patients diagnosed, accordingly to the 4th Edition of WHO Classification of Tumours of Soft Tissue and Bone, and treated for a SBC at the Fondazione IRCCS Istituto Neurologico “Carlo Besta” between October 2015 and December 2017, was performed [1]. All the relevant clinical data were retrieved from the Institutional Registry of Neurosurgical Complications. The exclusion criteria were the following: incomplete clinical data and different location. All subjects gave their written informed consent for inclusion before they participated in the study and for using their clinical and molecular data for research purposes. All the procedures involving human subjects were done in accordance with the Helsinki Declaration of 1975. The protocol was approved by the Ethics Committee of Fondazione IRCCS Istituto Neurologico “Carlo Besta” (Project identification code: Prot. CQ-NCH). All radiological features were evaluated by two independent reviewers blinded to the clinical outcome and ceramide level. The degree (absent, mild, intense) of contrast enhancement on MR images was also evaluated [60]. Tumor specimens were prospectively collected from the operating room and verified by the pathologist. One part was fixed in Carnoy’s solution, de-hydrated in absolute ethanol and paraffin-embedded, and then sectioned at 2 μm. The second one was directly snap-frozen in liquid nitrogen and stored at −80 °C for the sphingolipid analysis. For the histological analysis, slides were re-hydrated and stained with hematoxylin-eosin (H&E) according to the standard methods. The chordoma tissue samples were also routinely investigated by immunohistochemistry (IHC) for the expression of proliferative markers MIB1/ki67 (mouse monoclonal anti-Ki67 clone MIB1 1:100, DAKO, Denmark).

4.2. Sphingolipids Analysis with LC-MS/MS

Ceramides and dihydroceramides species were extracted from frozen samples and assessed using liquid chromatography–mass spectrometry (LC-MS/MS) [65,66]. Tumor samples were added with 100 µL of PBS + 0.1% protease inhibitor and homogenized in TissueLyser (Qiagen, Hilden, Germany) for 3 min at 50 oscillations/s. Total protein concentration was measured by Bradford dye-binding method. Samples were added with 10 µL of IS (Cer C12 20 mM) and 850 µL of a methanol/chloroform mixture (2:1, v/v), then sonicated for 30 min. Afterwards, they were incubated overnight in an oscillator bath at 48 °C. Once at room temperature, samples were added with 75 µl of KOH 1 M in methanol and incubated at 37 °C for 2 h. To bring the pH to a neutral level, 75 µl of acetic acid 1 M was added in methanol. The phase was evaporated under a stream of nitrogen. The residuals were dissolved in 150 µl of methanol and then centrifuged for 10 min at 13,000 rpm. Ten microliters were directly injected in LC-MS/MS. The analytical system consisted of a HPLC coupled to a tandem mass spectrometer. The LC system was a Dionex 3000 UltiMate instrument with autosampler, binary pump and column oven (Thermo Fisher Scientific, USA). Separation was attained on a reversed-phase BEH C-8 100 × 2.1 mm × 1.7 µm analytical column preceded by a security guard cartridge. Linear gradients were obtained between eluent A (water + 2 mM ammonium formate + 0.2% formic acid) and eluent B (methanol + 1 mM ammonium formate + 0.2% formic acid). The column was equilibrated with 80% (B), increased to 90% (B) in 3 min, held for 3 min, increased to 99% (B) in 9 min, held for 3 min, back to the initial conditions in 2 min, and kept for 2 min at 80% (B). The flow rate was 0.3 mL/min, the autosampler and the column oven were kept at 15 °C and 30 °C, respectively. The tandem mass spectrometer was an AB Sciex 3200 QTRAP instrument with electrospray ionization TurboIonSpray™ source (AB Sciex S.r.l., Milano, Italy). Instruments were managed with the proprietary manufacturer’s software and according to the manufacturer’s instructions. The analytical data were processed using Analyst software (version 1.2). The ion spray voltage was set at 5.5 kV, and the source temperature was set at 300 °C. Nitrogen was used as a nebulizing gas (GS 1, 45 psi), turbo spray gas (GS 2, 50 psi) and curtain gas (25 psi). The collision-activated dissociation (CAD) was set to a low level. The dwell time was set at 0.1 s, and the MS scan was performed in positive ion modes (ESI +). MS/MS experiment were conducted using nitrogen as collision gas. Compound-dependent parameters (CE, DP) were optimized via direct infusion. Multiple reaction monitoring (MRM) mode was used. Quantitative analysis was performed interpolating each peak area of the analyte/area IS with the calibration curve of each sphingolipid. The sphingolipid amount was normalized by total protein content, expressed in milligrams, in each sample. Six-point calibration curve was evaluated by spiking increasing amounts of the analytes in water in the concentration range of 0–40 pmol/vial. Linearity was observed for each analyte in the whole range (R2 > 0.99).

4.3. Statistical Analysis

Descriptive statistics were used to analyze sociodemographic and clinical data. Categorical variables were described with frequencies and percentages, continuous variables with means, standard deviations, and ranges. Univariate comparisons were conducted using Chi-square and exact Fisher tests. Ceramides and dihydroceramides total and single species were subjected to multiple linear regression analysis using a Pearson correlation model with MIB-1 as a regression model target to evaluate their role as independent prognostic factors. Statistical analyses were run on SPSS v.18 (IBM Inc., Armonk, NY, USA) and GraphPad (GraphPad Software, Inc., San Diego, CA, USA).

5. Conclusions

Sphingolipid analysis represents a very new approach in chordomas, and future studies are needed. Our preliminary analysis showed ceramides to be promising tumoral biomarkers in chordomas. Long- and very-long-chain ceramides, such as Cer C24:1 and DHCer C18:0, may be related to a more prolonged tumor survival and aggressiveness, and the understanding of their effective biological role will hopefully shed light on the mechanisms of chordoma radio-resistance and tendency to recur. To better determine which pathway of ceramides synthesis is involved in chordoma biology, it will be useful to specifically evaluate different enzymes, such as ceramides synthases and desaturases. In-vitro studies would be useful to determine the direct relationship between hadron-therapy and ceramides formation and analysis of programmed cell-death mechanisms. In-vitro and in-vivo models could also be employed to evaluate the potential therapeutic effects of specific molecules, such as Myriocin, targeting sphingolipids’ metabolism in chordomas.

Author Contributions

Conceptualization, E.L.C., M.D.C., M.P., R.P., R.G. and P.F.; Data curation, E.L.C., M.D.C., A.R., M.P., M.B., S.S., C.C., B.P., C.P., M.G.B., G.C., R.P., R.G. and P.F.; Formal analysis, E.L.C., M.D.C., A.R., S.S., G.C. and R.P.; Funding acquisition, R.G. and P.F.; Investigation, E.L.C., M.D.C., A.R., M.P., M.B., S.S., C.C., C.P., M.G.B. and G.C.; Methodology, E.L.C., M.D.C., A.R., M.P., M.B., C.C., B.P., M.G.B., G.C., R.P., R.G. and P.F.; Project administration, R.G. and P.F.; Resources, M.B., B.P., R.P., R.G. and P.F.; Software, E.L.C., M.D.C., A.R.; Supervision, R.P., R.G. and P.F.; Validation, A.R., S.S., R.G. and P.F.; Visualization, S.S., B.P. and M.G.B.; Writing—original draft, E.L.C., M.D.C.; Writing—review & editing, E.L.C., M.D.C., A.R., M.P., M.B., B.P., C.P., M.G.B., R.P., R.G. and P.F.

Funding

This research received no external funding.

Acknowledgments

ELC and MDC are supported by the PhD Program in Molecular and Translational Medicine, Università degli Studi di Milano, Milan, Italy. AR and SS are supported by a grant from the Italian Ministry of Health (Ricerca Corrente, Fondazione Istituto Neurologico C. Besta, Linea 4—Outcome Research: dagli Indicatori alle Raccomandazioni Cliniche).

Conflicts of Interest

The authors declare no conflict of interest.

References

  1. WHO. WHO Classification Of Tumours Of Soft Tissue; World Health Organization: Geneva, Switzerland, 2013; Volume 46, pp. 10–12. [Google Scholar]
  2. Colia, V.; Stacchiotti, S. Medical treatment of advanced chordomas. Eur. J. Cancer 2017, 83, 220–228. [Google Scholar] [CrossRef]
  3. Casali, P.G.; Stacchiotti, S.; Sangalli, C.; Olmi, P.; Gronchi, A. Chordoma. Curr. Opin. Oncol. 2007, 19, 367–370. [Google Scholar] [CrossRef]
  4. Stacchiotti, S.; Sommer, J. Chordoma Global Consensus Group Building a global consensus approach to chordoma: A position paper from the medical and patient community. Lancet Oncol. 2015, 16, e71–e83. [Google Scholar] [CrossRef]
  5. Di Maio, S.; Rostomily, R.; Sekhar, L.N. Current surgical outcomes for cranial base chordomas: Cohort study of 95 patients. Neurosurgery 2012, 70, 1355–1360; discussion 1360. [Google Scholar] [CrossRef]
  6. Chibbaro, S.; Cornelius, J.F.; Froelich, S.; Tigan, L.; Kehrli, P.; Debry, C.; Romano, A.; Herman, P.; George, B.; Bresson, D. Endoscopic endonasal approach in the management of skull base chordomas—Clinical experience on a large series, technique, outcome, and pitfalls. Neurosurg. Rev. 2014, 37, 217–224. [Google Scholar] [CrossRef]
  7. Ferroli, P.; Broggi, M.; Schiavolin, S.; Acerbi, F.; Bettamio, V.; Caldiroli, D.; Cusin, A.; La Corte, E.; Leonardi, M.; Raggi, A.; et al. Predicting functional impairment in brain tumor surgery: The Big Five and the Milan Complexity Scale. Neurosurg. Focus 2015, 39, E14. [Google Scholar] [CrossRef]
  8. Jahangiri, A.; Chin, A.T.; Wagner, J.R.; Kunwar, S.; Ames, C.; Chou, D.; Barani, I.; Parsa, A.T.; McDermott, M.W.; Benet, A.; et al. Factors predicting recurrence after resection of clival chordoma using variable surgical approaches and radiation modalities. Neurosurgery 2015, 76, 179–185. [Google Scholar] [CrossRef]
  9. La Corte, E.; Aldana, P.R.; Ferroli, P.; Greenfield, J.P.; Härtl, R.; Anand, V.K.; Schwartz, T.H. The rhinopalatine line as a reliable predictor of the inferior extent of endonasal odontoidectomies. Neurosurg. Focus 2015, 38, E16. [Google Scholar] [CrossRef]
  10. La Corte, E.; Broggi, M.; Bosio, L.; Danesi, G.; Ferroli, P. Tailored surgical strategy in clival chordomas: An extraordinary selection bias that limits approach comparison. J. Neurosurg. Sci. 2018, 62, 519–521. [Google Scholar]
  11. La Corte, E.; Aldana, P.R.; Schiariti, M.; Maccari, A.; Ferroli, P. Endoscopic approaches to the craniovertebral junction. Acta Neurochir. (Wien) 2014, 156, 293–295. [Google Scholar] [CrossRef]
  12. La Corte, E.; Aldana, P.R. Endoscopic approach to the upper cervical spine and clivus: An anatomical study of the upper limits of the transoral corridor. Acta Neurochir. (Wien) 2017, 159, 633–639. [Google Scholar] [CrossRef]
  13. Tamborini, E.; Miselli, F.; Negri, T.; Lagonigro, M.S.; Staurengo, S.; Dagrada, G.P.; Stacchiotti, S.; Pastore, E.; Gronchi, A.; Perrone, F.; et al. Molecular and biochemical analyses of platelet-derived growth factor receptor (PDGFR) B, PDGFRA, and KIT receptors in chordomas. Clin. Cancer Res. 2006, 12, 6920–6928. [Google Scholar] [CrossRef]
  14. Di Maio, S.; Yip, S.; Al Zhrani, G.A.; Alotaibi, F.E.; Al Turki, A.; Kong, E.; Rostomily, R.C. Novel targeted therapies in chordoma: An update. Ther. Clin. Risk Manag. 2015, 11, 873–883. [Google Scholar] [CrossRef]
  15. Stacchiotti, S.; Tamborini, E.; Lo Vullo, S.; Bozzi, F.; Messina, A.; Morosi, C.; Casale, A.; Crippa, F.; Conca, E.; Negri, T.; et al. Phase II study on lapatinib in advanced EGFR-positive chordoma. Ann. Oncol. 2013, 24, 1931–1936. [Google Scholar] [CrossRef]
  16. Stacchiotti, S.; Marrari, A.; Tamborini, E.; Palassini, E.; Virdis, E.; Messina, A.; Crippa, F.; Morosi, C.; Gronchi, A.; Pilotti, S.; et al. Response to imatinib plus sirolimus in advanced chordoma. Ann. Oncol. 2009, 20, 1886–1894. [Google Scholar] [CrossRef]
  17. Stacchiotti, S.; Longhi, A.; Ferraresi, V.; Grignani, G.; Comandone, A.; Stupp, R.; Bertuzzi, A.; Tamborini, E.; Pilotti, S.; Messina, A.; et al. Phase II study of imatinib in advanced chordoma. J. Clin. Oncol. 2012, 30, 914–920. [Google Scholar] [CrossRef]
  18. Hindi, N.; Casali, P.G.; Morosi, C.; Messina, A.; Palassini, E.; Pilotti, S.; Tamborini, E.; Radaelli, S.; Gronchi, A.; Stacchiotti, S. Imatinib in advanced chordoma: A retrospective case series analysis. Eur. J. Cancer 2015, 51, 2609–2614. [Google Scholar] [CrossRef]
  19. La Corte, E. Clinical and Molecular Bio-Markers In Skull Base Chordomas. Ph.D. Thesis, University of Milan, Milano, Italy, January 2019. [Google Scholar]
  20. Truman, J.-P.; García-Barros, M.; Obeid, L.M.; Hannun, Y.A. Evolving concepts in cancer therapy through targeting sphingolipid metabolism. Biochim. Biophys. Acta Mol. Cell Biol. Lipids 2014, 1841, 1174–1188. [Google Scholar] [CrossRef]
  21. Henry, B.; Möller, C.; Dimanche-Boitrel, M.-T.; Gulbins, E.; Becker, K.A. Targeting the ceramide system in cancer. Cancer Lett. 2013, 332, 286–294. [Google Scholar] [CrossRef]
  22. Schenck, M.; Carpinteiro, A.; Grassmé, H.; Lang, F.; Gulbins, E. Ceramide: Physiological and pathophysiological aspects. Arch. Biochem. Biophys. 2007, 462, 171–175. [Google Scholar] [CrossRef]
  23. Hartmann, D.; Lucks, J.; Fuchs, S.; Schiffmann, S.; Schreiber, Y.; Ferreirós, N.; Merkens, J.; Marschalek, R.; Geisslinger, G.; Grösch, S. Long chain ceramides and very long chain ceramides have opposite effects on human breast and colon cancer cell growth. Int. J. Biochem. Cell Biol. 2012, 44, 620–628. [Google Scholar] [CrossRef]
  24. Yang, L.; Zheng, L.; Tian, Y.; Zhang, Z.; Dong, W.; Wang, X.; Zhang, X.; Cao, C. C6 ceramide dramatically enhances docetaxel-induced growth inhibition and apoptosis in cultured breast cancer cells: A mechanism study. Exp. Cell Res. 2015, 332, 47–59. [Google Scholar] [CrossRef]
  25. Scarlatti, F.; Sala, G.; Ricci, C.; Maioli, C.; Milani, F.; Minella, M.; Botturi, M.; Ghidoni, R. Resveratrol sensitization of DU145 prostate cancer cells to ionizing radiation is associated to ceramide increase. Cancer Lett. 2007, 253, 124–130. [Google Scholar] [CrossRef]
  26. Bernhart, E.; Damm, S.; Wintersperger, A.; Nusshold, C.; Brunner, A.M.; Plastira, I.; Rechberger, G.; Reicher, H.; Wadsack, C.; Zimmer, A.; et al. Interference with distinct steps of sphingolipid synthesis and signaling attenuates proliferation of U87MG glioma cells. Biochem. Pharmacol. 2015, 96, 119–130. [Google Scholar] [CrossRef] [Green Version]
  27. Hartmann, D.; Wegner, M.-S.; Wanger, R.A.; Ferreirós, N.; Schreiber, Y.; Lucks, J.; Schiffmann, S.; Geisslinger, G.; Grösch, S. The equilibrium between long and very long chain ceramides is important for the fate of the cell and can be influenced by co-expression of CerS. Int. J. Biochem. Cell Biol. 2013, 45, 1195–1203. [Google Scholar] [CrossRef]
  28. Kolb, D.; Pritz, E.; Steinecker-Frohnwieser, B.; Lohberger, B.; Deutsch, A.; Kroneis, T.; El-Heliebi, A.; Dohr, G.; Meditz, K.; Wagner, K.; et al. Extended Ultrastructural Characterization of Chordoma Cells: The Link to New Therapeutic Options. PLoS ONE 2014, 9, e114251. [Google Scholar] [CrossRef]
  29. Rizzuto, R.; Pinton, P.; Carrington, W.; Fay, F.S.; Fogarty, K.E.; Lifshitz, L.M.; Tuft, R.A.; Pozzan, T. Close contacts with the endoplasmic reticulum as determinants of mitochondrial Ca2+ responses. Science 1998, 280, 1763–1766. [Google Scholar] [CrossRef]
  30. Csordás, G.; Renken, C.; Várnai, P.; Walter, L.; Weaver, D.; Buttle, K.F.; Balla, T.; Mannella, C.A.; Hajnóczky, G. Structural and functional features and significance of the physical linkage between ER and mitochondria. J. Cell Biol. 2006, 174, 915–921. [Google Scholar] [CrossRef] [Green Version]
  31. Hu, L.; Wang, H.; Huang, L.; Zhao, Y.; Wang, J. Crosstalk between autophagy and intracellular radiation response (Review). Int. J. Oncol. 2016, 49, 2217–2226. [Google Scholar] [CrossRef]
  32. Aureli, M.; Bassi, R.; Prinetti, A.; Chiricozzi, E.; Pappalardi, B.; Chigorno, V.; Di Muzio, N.; Loberto, N.; Sonnino, S. Ionizing radiations increase the activity of the cell surface glycohydrolases and the plasma membrane ceramide content. Glycoconj. J. 2012, 29, 585–597. [Google Scholar] [CrossRef]
  33. Aureli, M.; Murdica, V.; Loberto, N.; Samarani, M.; Prinetti, A.; Bassi, R.; Sonnino, S. Exploring the link between ceramide and ionizing radiation. Glycoconj. J. 2014, 31, 449–459. [Google Scholar] [CrossRef]
  34. Ma, J.P.; Tian, K.B.; Wang, L.; Wang, K.; Li, D.; Yang, Y.; Du, J.; Ru, X.J.; Zhang, L.W.; Wu, Z.; et al. Proposal and Validation of a Basic Progression Scoring System for Patients with Skull Base Chordoma. World Neurosurg. 2016, 91, 409–418. [Google Scholar] [CrossRef]
  35. Zhai, Y.; Bai, J.; Wang, S.; Du, J.; Wang, J.; Li, C.; Gui, S.; Zhang, Y. Differences in Dural Penetration of Clival Chordomas Are Associated with Different Prognosis and Expression of Platelet-Derived Growth Factor Receptor-β. World Neurosurg. 2017, 98, 288–295. [Google Scholar] [CrossRef]
  36. Tian, K.; Wang, L.; Ma, J.; Wang, K.; Li, D.; Du, J.; Jia, G.; Wu, Z.; Zhang, J. MR Imaging Grading System for Skull Base Chordoma. AJNR. Am. J. Neuroradiol. 2017, 38, 1206–1211. [Google Scholar] [CrossRef] [Green Version]
  37. Sims, K.; Haynes, C.A.; Kelly, S.; Allegood, J.C.; Wang, E.; Momin, A.; Leipelt, M.; Reichart, D.; Glass, C.K.; Sullards, M.C.; et al. Kdo2-lipid A, a TLR4-specific agonist, induces de novo sphingolipid biosynthesis in RAW264.7 macrophages, which is essential for induction of autophagy. J. Biol. Chem. 2010, 285, 38568–38579. [Google Scholar] [CrossRef]
  38. Xu, Z.; Zhou, J.; McCoy, D.M.; Mallampalli, R.K. LASS5 is the predominant ceramide synthase isoform involved in de novo sphingolipid synthesis in lung epithelia. J. Lipid Res. 2005, 46, 1229–1238. [Google Scholar] [CrossRef] [Green Version]
  39. Devlin, C.M.; Lahm, T.; Hubbard, W.C.; Van Demark, M.; Wang, K.C.; Wu, X.; Bielawska, A.; Obeid, L.M.; Ivan, M.; Petrache, I. Dihydroceramide-based Response to Hypoxia. J. Biol. Chem. 2011, 286, 38069–38078. [Google Scholar] [CrossRef] [Green Version]
  40. Levine, B. Autophagy and cancer. Nature 2007, 446, 745–747. [Google Scholar] [CrossRef]
  41. Bedia, C.; Levade, T.; Codogno, P. Regulation of Autophagy by Sphingolipids. Anticancer Agents Med. Chem. 2011, 11, 844–853. [Google Scholar] [CrossRef]
  42. Li, Y.; Li, S.; Qin, X.; Hou, W.; Dong, H.; Yao, L.; Xiong, L. The pleiotropic roles of sphingolipid signaling in autophagy. Cell Death Dis. 2014, 5, e1245. [Google Scholar] [CrossRef]
  43. Morad, S.A.F.; Cabot, M.C. Ceramide-orchestrated signalling in cancer cells. Nat. Rev. Cancer 2013, 13, 51–65. [Google Scholar] [CrossRef] [PubMed]
  44. Yu, L.; Alva, A.; Su, H.; Dutt, P.; Freundt, E.; Welsh, S.; Baehrecke, E.H.; Lenardo, M.J. Regulation of an ATG7-beclin 1 Program of Autophagic Cell Death by Caspase-8. Science (80-). 2004, 304, 1500–1502. [Google Scholar] [CrossRef] [PubMed]
  45. Liu, W.J.; Ye, L.; Huang, W.F.; Guo, L.J.; Xu, Z.G.; Wu, H.L.; Yang, C.; Liu, H.F. P62 Links the Autophagy Pathway and the Ubiqutin-Proteasome System Upon Ubiquitinated Protein Degradation. Cell. Mol. Biol. Lett. 2016, 21, 1–14. [Google Scholar] [CrossRef] [PubMed]
  46. Mizushima, N.; Levine, B.; Cuervo, A.M.; Klionsky, D.J. Autophagy fights disease through cellular self-digestion. Nature 2008, 451, 1069–1075. [Google Scholar] [CrossRef] [PubMed] [Green Version]
  47. Miyake, Y.; Kozutsumi, Y.; Nakamura, S.; Fujita, T.; Kawasaki, T. Serine Palmitoyltransferase Is the Primary Target of a Sphingosine-like Immunosuppressant, ISP-1/Myriocin. Biochem. Biophys. Res. Commun. 1995, 211, 396–403. [Google Scholar] [CrossRef] [PubMed]
  48. Mandala, S.M.; Harris, G.H. [35] Isolation and characterization of novel inhibitors of sphingolipid synthesis: Australifungin, viridiofungins, rustmicin, and khafrefungin. Methods Enzymol. 2000, 311, 335–348. [Google Scholar] [PubMed]
  49. Ikushiro, H.; Hayashi, H.; Kagamiyama, H. Reactions of Serine Palmitoyltransferase with Serine and Molecular Mechanisms of the Actions of Serine Derivatives as Inhibitors. Biochemistry 2004, 43, 1082–1092. [Google Scholar] [CrossRef]
  50. Wadsworth, J.M.; Clarke, D.J.; McMahon, S.A.; Lowther, J.P.; Beattie, A.E.; Langridge-Smith, P.R.R.; Broughton, H.B.; Dunn, T.M.; Naismith, J.H.; Campopiano, D.J. The Chemical Basis of Serine Palmitoyltransferase Inhibition by Myriocin. J. Am. Chem. Soc. 2013, 135, 14276–14285. [Google Scholar] [CrossRef] [Green Version]
  51. Hotamisligil, G.S. Inflammation, metaflammation and immunometabolic disorders. Nature 2017, 542, 177–185. [Google Scholar] [CrossRef]
  52. Holland, W.L.; Bikman, B.T.; Wang, L.-P.; Yuguang, G.; Sargent, K.M.; Bulchand, S.; Knotts, T.A.; Shui, G.; Clegg, D.J.; Wenk, M.R.; et al. Lipid-induced insulin resistance mediated by the proinflammatory receptor TLR4 requires saturated fatty acid–induced ceramide biosynthesis in mice. J. Clin. Invest. 2011, 121, 1858–1870. [Google Scholar] [CrossRef]
  53. Posse de Chaves, E.I. Sphingolipids in apoptosis, survival and regeneration in the nervous system. Biochim. Biophys. Acta Biomembr. 2006, 1758, 1995–2015. [Google Scholar] [CrossRef] [PubMed] [Green Version]
  54. Caretti, A.; Bragonzi, A.; Facchini, M.; De Fino, I.; Riva, C.; Gasco, P.; Musicanti, C.; Casas, J.; Fabriàs, G.; Ghidoni, R.; et al. Anti-inflammatory action of lipid nanocarrier-delivered myriocin: Therapeutic potential in cystic fibrosis. Biochim. Biophys. Acta Gen. Subj. 2014, 1840, 586–594. [Google Scholar] [CrossRef] [PubMed]
  55. Tuson, M.; Marfany, G.; Gonzàlez-Duarte, R. Mutation of CERKL, a novel human ceramide kinase gene, causes autosomal recessive retinitis pigmentosa (RP26). Am. J. Hum. Genet. 2004, 74, 128–138. [Google Scholar] [CrossRef] [PubMed]
  56. Caretti, A.; Torelli, R.; Perdoni, F.; Falleni, M.; Tosi, D.; Zulueta, A.; Casas, J.; Sanguinetti, M.; Ghidoni, R.; Borghi, E.; et al. Inhibition of ceramide de novo synthesis by myriocin produces the double effect of reducing pathological inflammation and exerting antifungal activity against A. fumigatus airways infection. Biochim. Biophys. Acta Gen. Subj. 2016, 1860, 1089–1097. [Google Scholar] [CrossRef] [PubMed]
  57. Caretti, A.; Vasso, M.; Bonezzi, F.T.; Gallina, A.; Trinchera, M.; Rossi, A.; Adami, R.; Casas, J.; Falleni, M.; Tosi, D.; et al. Myriocin treatment of CF lung infection and inflammation: Complex analyses for enigmatic lipids. Naunyn. Schmiedebergs. Arch. Pharmacol. 2017, 390, 775–790. [Google Scholar] [CrossRef] [PubMed]
  58. Campisi, G.M.; Signorelli, P.; Rizzo, J.; Ghilardi, C.; Antognetti, J.; Caretti, A.; Lazarević, J.S.; Strettoi, E.; Novelli, E.; Ghidoni, R.; et al. Determination of the serine palmitoyl transferase inhibitor myriocin by electrospray and Q-trap mass spectrometry. Biomed. Chromatogr. 2017, 31, e4026. [Google Scholar] [CrossRef] [PubMed] [Green Version]
  59. George, B.; Bresson, D.; Bouazza, S.; Froelich, S.; Mandonnet, E.; Hamdi, S.; Orabi, M.; Polivka, M.; Cazorla, A.; Adle-Biassette, H.; et al. [Chordoma]. Neurochirurgie 2014, 60, 63–140. [Google Scholar] [CrossRef] [PubMed]
  60. Pamir, M.N.; Özduman, K. Analysis of radiological features relative to histopathology in 42 skull-base chordomas and chondrosarcomas. Eur. J. Radiol. 2006, 58, 461–470. [Google Scholar] [CrossRef]
  61. Santegoeds, R.G.C.; Temel, Y.; Beckervordersandforth, J.C.; Van Overbeeke, J.J.; Hoeberigs, C.M. State-of-the-Art Imaging in Human Chordoma of the Skull Base. Curr. Radiol. Rep. 2018, 6, 16. [Google Scholar] [CrossRef]
  62. Mesicek, J.; Lee, H.; Feldman, T.; Jiang, X.; Skobeleva, A.; Berdyshev, E.V.; Haimovitz-Friedman, A.; Fuks, Z.; Kolesnick, R. Ceramide synthases 2, 5, and 6 confer distinct roles in radiation-induced apoptosis in HeLa cells. Cell. Signal. 2010, 22, 1300–1307. [Google Scholar] [CrossRef] [Green Version]
  63. Jiang, W.; Ogretmen, B. Autophagy paradox and ceramide. Biochim. Biophys. Acta 2014, 1841, 783–792. [Google Scholar] [CrossRef] [PubMed]
  64. Moro, K.; Kawaguchi, T.; Tsuchida, J.; Gabriel, E.; Qi, Q.; Yan, L.; Wakai, T.; Takabe, K.; Nagahashi, M. Ceramide species are elevated in human breast cancer and are associated with less aggressiveness. Oncotarget 2018, 9, 19874–19890. [Google Scholar] [CrossRef] [PubMed]
  65. Merrill, A.H., Jr.; Sullards, M.C.; Allegood, J.C.; Kelly, S.; Wang, E. Sphingolipidomics: High-throughput, structure-specific, and quantitative analysis of sphingolipids by liquid chromatography tandem mass spectrometry. Methods 2005, 36, 207–224. [Google Scholar] [CrossRef] [PubMed]
  66. Platania, C.B.M.; Dei Cas, M.; Cianciolo, S.; Fidilio, A.; Lazzara, F.; Paroni, R.; Pignatello, R.; Strettoi, E.; Ghidoni, R.; Drago, F.; et al. Novel ophthalmic formulation of myriocin: Implications in retinitis pigmentosa. Drug Deliv. 2019, 26, 237–243. [Google Scholar] [CrossRef] [PubMed]
Figure 1. Axial and coronal T1-weighted post-contrast MR images showing SBC (red arrows) with intense (A) and no/mild (B) contrast enhancement.
Ijms 20 04480 g001
Figure 2. Bar graphs, with standard error mean (SEM), showing the content of total ceramides (*, left) and dihydroceramides (right) species according to tumor type (primary and recurrent chordoma groups). *, p ≤ 0.05.
Ijms 20 04480 g002
Figure 3. Bar graphs, with SEM, showing the content of single ceramides and dihydroceramides species according to tumor type (primary and recurrent chordoma groups). *, p ≤ 0.05; **, p ≤ 0.01.
Ijms 20 04480 g003
Figure 4. Bar graphs, with SEM, showing the content of total ceramides (*, left) and dihydroceramides (*, right) species according to MR contrast enhancement (no/mild and intense contrast enhancement chordoma groups). *, p ≤ 0.05.
Ijms 20 04480 g004
Figure 5. Bar graphs, with SEM, showing the content of single ceramides and dihydroceramides species according to MR contrast enhancement (no/mild and intense contrast enhancement chordoma groups). *, p ≤ 0.05.
Ijms 20 04480 g005
Figure 6. Linear regression graphs showing the correlation between the rate of MIB-1 staining and total ceramides.
Ijms 20 04480 g006
Figure 7. Linear regression graphs showing the correlation between the rate of MIB-1 staining and single ceramides and dihydroceramides species. *, p ≤ 0.05; **, p ≤ 0.01; ***, p ≤ 0.001, ****, p ≤ 0.0001.
Ijms 20 04480 g007
Figure 8. Exemplificative case of a SBC with an aggressive behavior. Sagittal (A) T1-weighted post-contrast MR image showing a chordoma (red arrows) with an intense contrast enhancement. Pathology showed a de-differentiated chordoma with a high rate of MIB-1 staining (20%). Sphingolipid analysis showed the highest content in ceramides (B) and dihydroceramides (C). Bar graphs showing the ceramide content of the present case (red) in comparison with the average of ceramide levels of other chordoma patients (blue).
Ijms 20 04480 g008
Table 1. Summary of the correlation analysis between ceramides and MIB-1. *, p ≤ 0.05; **, p ≤ 0.01; ***, p ≤ 0.001, ****, p ≤ 0.0001
Variable.rp-value
Cer14:00,33490,2419ns
Cer16:00,63380,0149*
Cer18:10,53860,0469*
Cer18:00,69490,0058**
Cer20:00,56650,0347*
Cer22:00,56450,0355*
Cer24:10,8814≤ 0,0001****
Cer24:00,61250,0199*
DHCer16:00,35030,2194ns
DHCer18:1−0,16170,5807ns
DHCer18:00,9426≤ 0,0001****
DHCer24:10,84290,0002***
DHCer24:00,64900,0120*
Table 2. Linear regression predicting outcome based on ceramide levels in SBC patients. *R2 = 0.931, Adj-R2 = 0.918; F = 74.0 (p ≤ 0.001).
VariableB Value (SE)Betap-valueToleranceVIF
Constant2.97 (0.73) 0.002
Cer C24:10.011 (0.004)0.3480.0250.3512.85
DHCer C18:01.40 (0.28)0.663≤ 0.00010.3512.85

