Association of Obesity with DNA Methylation Age Acceleration in African American Mothers from the InterGEN Study


Abstract
1. Introduction
2. Results
3. Discussion
4. Materials and Methods
4.1. Study Sample
4.2. Phenotypes
4.3. DNA Methylation Profiling and Data Processing
4.4. Statistical Analysis
5. Conclusions
Supplementary Materials
Author Contributions
Funding
Conflicts of Interest
Abbreviations
| BMI | Body mass index |
| DNAm | DNA methylation |
| AA | Age acceleration |
| CI | Confidence interval |
References
- Hales, C.M.; Carroll, M.D.; Fryar, C.D.; Ogden, C.L. Prevalence of Obesity Among Adults and Youth: United States, 2015–2016. NCHS Data Brief 2017, 288, 1–8. [Google Scholar]
- Haslam, D.W.; James, W.P. Obesity. Lancet 2005, 366, 1197–1209. [Google Scholar] [CrossRef]
- Arias, E.; Xu, J. United States Life Tables, 2015. Natl. Vital Stat. Rep. 2018, 67, 1–64. [Google Scholar] [PubMed]
- Johnson, N.E. The racial crossover in comorbidity, disability, and mortality. Demography 2000, 37, 267–283. [Google Scholar] [CrossRef] [PubMed]
- Manton, K.G.; Poss, S.S.; Wing, S. The black/white mortality crossover: Investigation from the perspective of the components of aging. Gerontologist 1979, 19, 291–300. [Google Scholar] [CrossRef] [PubMed]
- Geronimus, A.T.; Hicken, M.; Keene, D.; Bound, J. “Weathering” and age patterns of allostatic load scores among blacks and whites in the United States. Am. J. Public Health 2006, 96, 826–833. [Google Scholar] [CrossRef]
- Horvath, S. DNA methylation age of human tissues and cell types. Genome Biol. 2013, 14, R115. [Google Scholar] [CrossRef]
- Genetics Home. What is Epigenetics? Genetics Home Reference. Available online: https://ghr.nlm.nih.gov/primer/howgeneswork/epigenome (accessed on 7 April 2019).
- Fraga, M.F.; Esteller, M. Epigenetics and aging: The targets and the marks. Trends Genet. 2007, 23, 413–418. [Google Scholar] [CrossRef]
- Rakyan, V.K.; Down, T.A.; Maslau, S.; Andrew, T.; Yang, T.P.; Beyan, H.; Whittaker, P.; McCann, O.T.; Finer, S.; Valdes, A.M.; et al. Human aging-associated DNA hypermethylation occurs preferentially at bivalent chromatin domains. Genome Res. 2010, 20, 434–439. [Google Scholar] [CrossRef]
- Teschendorff, A.E.; Menon, U.; Gentry-Maharaj, A.; Ramus, S.J.; Weisenberger, D.J.; Shen, H.; Campan, M.; Noushmehr, H.; Bell, C.G.; Maxwell, A.P.; et al. Age-dependent DNA methylation of genes that are suppressed in stem cells is a hallmark of cancer. Genome Res. 2010, 20, 440–446. [Google Scholar] [CrossRef]
- Jung, M.; Pfeifer, G.P. Aging and DNA methylation. BMC Biol. 2015, 13, 7. [Google Scholar] [CrossRef] [PubMed]
- Johansson, A.; Enroth, S.; Gyllensten, U. Continuous Aging of the Human DNA Methylome Throughout the Human Lifespan. PLoS ONE 2013, 8, e67378. [Google Scholar] [CrossRef] [PubMed]
- Bocklandt, S.; Lin, W.; Sehl, M.E.; Sanchez, F.J.; Sinsheimer, J.S.; Horvath, S.; Vilain, E. Epigenetic predictor of age. PLoS ONE 2011, 6, e14821. [Google Scholar] [CrossRef] [PubMed]
- Hannum, G.; Guinney, J.; Zhao, L.; Zhang, L.; Hughes, G.; Sadda, S.; Klotzle, B.; Bibikova, M.; Fan, J.B.; Gao, Y.; et al. Genome-wide methylation profiles reveal quantitative views of human aging rates. Mol. Cell 2013, 49, 359–367. [Google Scholar] [CrossRef] [PubMed]
- Horvath, S.; Raj, K. DNA methylation-based biomarkers and the epigenetic clock theory of ageing. Nat. Rev. Genet. 2018, 19, 371–384. [Google Scholar] [CrossRef]
- Simpkin, A.J.; Cooper, R.; Howe, L.D.; Relton, C.L.; Davey Smith, G.; Teschendorff, A.; Widschwendter, M.; Wong, A.; Kuh, D.; Hardy, R. Are objective measures of physical capability related to accelerated epigenetic age? Findings from a British birth cohort. BMJ Open 2017, 7, e016708. [Google Scholar] [CrossRef] [PubMed]
- Nevalainen, T.; Kananen, L.; Marttila, S.; Jylhava, J.; Mononen, N.; Kahonen, M.; Raitakari, O.T.; Hervonen, A.; Jylha, M.; Lehtimaki, T.; et al. Obesity accelerates epigenetic aging in middle-aged but not in elderly individuals. Clin. Epigenetics 2017, 9, 20. [Google Scholar] [CrossRef]
- Dugue, P.A.; Bassett, J.K.; Joo, J.E.; Baglietto, L.; Jung, C.H.; Wong, E.M.; Fiorito, G.; Schmidt, D.; Makalic, E.; Li, S.; et al. Association of DNA Methylation-Based Biological Age with Health Risk Factors and Overall and Cause-Specific Mortality. Am. J. Epidemiol. 2018, 187, 529–538. [Google Scholar] [CrossRef]
- Horvath, S.; Erhart, W.; Brosch, M.; Ammerpohl, O.; von Schonfels, W.; Ahrens, M.; Heits, N.; Bell, J.T.; Tsai, P.C.; Spector, T.D.; et al. Obesity accelerates epigenetic aging of human liver. Proc. Natl. Acad. Sci. USA 2014, 111, 15538–15543. [Google Scholar] [CrossRef]
- Quach, A.; Levine, M.E.; Tanaka, T.; Lu, A.T.; Chen, B.H.; Ferrucci, L.; Ritz, B.; Bandinelli, S.; Neuhouser, M.L.; Beasley, J.M.; et al. Epigenetic clock analysis of diet, exercise, education, and lifestyle factors. Aging (Albany NY) 2017, 9, 419–446. [Google Scholar] [CrossRef]
- Taylor, J.Y.; Wright, M.L.; Crusto, C.A.; Sun, Y.V. The Intergenerational Impact of Genetic and Psychological Factors on Blood Pressure (InterGEN) Study: Design and Methods for Complex DNA Analysis. Biol. Res. Nurs. 2016, 18, 521–530. [Google Scholar] [CrossRef] [PubMed]
- Crusto, C.A.; Barcelona de Mendoza, V.; Connell, C.M.; Sun, Y.V.; Taylor, J.Y. The Intergenerational Impact of Genetic and Psychological Factors on Blood Pressure Study (InterGEN): Design and Methods for Recruitment and Psychological Measures. Nurs. Res. 2016, 65, 331–338. [Google Scholar] [CrossRef] [PubMed]
- Roetker, N.S.; Pankow, J.S.; Bressler, J.; Morrison, A.C.; Boerwinkle, E. Prospective Study of Epigenetic Age Acceleration and Incidence of Cardiovascular Disease Outcomes in the ARIC Study (Atherosclerosis Risk in Communities). Circ. Genom. Precis. Med. 2018, 11, e001937. [Google Scholar] [CrossRef] [PubMed]
- Levine, M.E.; Lu, A.T.; Bennett, D.A.; Horvath, S. Epigenetic age of the pre-frontal cortex is associated with neuritic plaques, amyloid load, and Alzheimer’s disease related cognitive functioning. Aging (Albany NY) 2015, 7, 1198–1211. [Google Scholar] [CrossRef] [PubMed]
- Tamman, A.J.F.; Montalvo-Ortiz, J.L.; Southwick, S.M.; Krystal, J.H.; Levy, B.R.; Pietrzak, R.H. Accelerated DNA Methylation Aging in U.S. Military Veterans: Results from the National Health and Resilience in Veterans Study. Am. J. Geriatr. Psychiatry 2019, 27, 528–532. [Google Scholar] [CrossRef] [PubMed]
- Horvath, S.; Ritz, B.R. Increased epigenetic age and granulocyte counts in the blood of Parkinson’s disease patients. Aging (Albany NY) 2015, 7, 1130–1142. [Google Scholar] [CrossRef] [PubMed]
- Gao, X.; Zhang, Y.; Breitling, L.P.; Brenner, H. Relationship of tobacco smoking and smoking-related DNA methylation with epigenetic age acceleration. Oncotarget 2016, 7, 46878–46889. [Google Scholar] [CrossRef]
- Gao, X.; Jia, M.; Zhang, Y.; Breitling, L.P.; Brenner, H. DNA methylation changes of whole blood cells in response to active smoking exposure in adults: A systematic review of DNA methylation studies. Clin. Epigenetics 2015, 7, 113. [Google Scholar] [CrossRef]
- Simons, R.L.; Lei, M.K.; Beach, S.R.; Philibert, R.A.; Cutrona, C.E.; Gibbons, F.X.; Barr, A. Economic hardship and biological weathering: The epigenetics of aging in a U.S. sample of black women. Soc. Sci. Med. 2016, 150, 192–200. [Google Scholar]
- Hughes, A.; Smart, M.; Gorrie-Stone, T.; Hannon, E.; Mill, J.; Bao, Y.; Burrage, J.; Schalkwyk, L.; Kumari, M. Socioeconomic Position and DNA Methylation Age Acceleration Across the Life Course. Am. J. Epidemiol. 2018, 187, 2346–2354. [Google Scholar] [CrossRef]
- Karlsson Linner, R.; Marioni, R.E.; Rietveld, C.A.; Simpkin, A.J.; Davies, N.M.; Watanabe, K.; Armstrong, N.J.; Auro, K.; Baumbach, C.; Bonder, M.J.; et al. An epigenome-wide association study meta-analysis of educational attainment. Mol. Psychiatry 2017, 22, 1680–1690. [Google Scholar] [CrossRef] [PubMed]
- Horvath, S.; Gurven, M.; Levine, M.E.; Trumble, B.C.; Kaplan, H.; Allayee, H.; Ritz, B.R.; Chen, B.; Lu, A.T.; Rickabaugh, T.M.; et al. An epigenetic clock analysis of race/ethnicity, sex, and coronary heart disease. Genome Biol. 2016, 17, 171. [Google Scholar] [CrossRef] [PubMed]
- Europe, W.H.O. Body Mass Index-BMI. Available online: http://www.euro.who.int/en/health-topics/disease-prevention/nutrition/a-healthy-lifestyle/body-mass-index-bmi (accessed on 16 April 2019).
- Barcelona, V.; Huang, Y.; Brown, K.; Liu, J.; Zhao, W.; Yu, M.; Kardia, S.L.R.; Smith, J.A.; Taylor, J.Y.; Sun, Y.V. Novel DNA methylation sites associated with cigarette smoking among African Americans. Epigenetics 2019, 14, 383–391. [Google Scholar] [CrossRef] [PubMed]
- Perna, L.; Zhang, Y.; Mons, U.; Holleczek, B.; Saum, K.U.; Brenner, H. Epigenetic age acceleration predicts cancer, cardiovascular, and all-cause mortality in a German case cohort. Clin. Epigenetics 2016, 8, 64. [Google Scholar] [CrossRef] [PubMed]
- Houseman, E.A.; Molitor, J.; Marsit, C.J. Reference-free cell mixture adjustments in analysis of DNA methylation data. Bioinformatics 2014, 30, 1431–1439. [Google Scholar] [CrossRef]


| Characteristics | Mean (SD)/Median (IQR)/N (%) | β (95% CI) | |
|---|---|---|---|
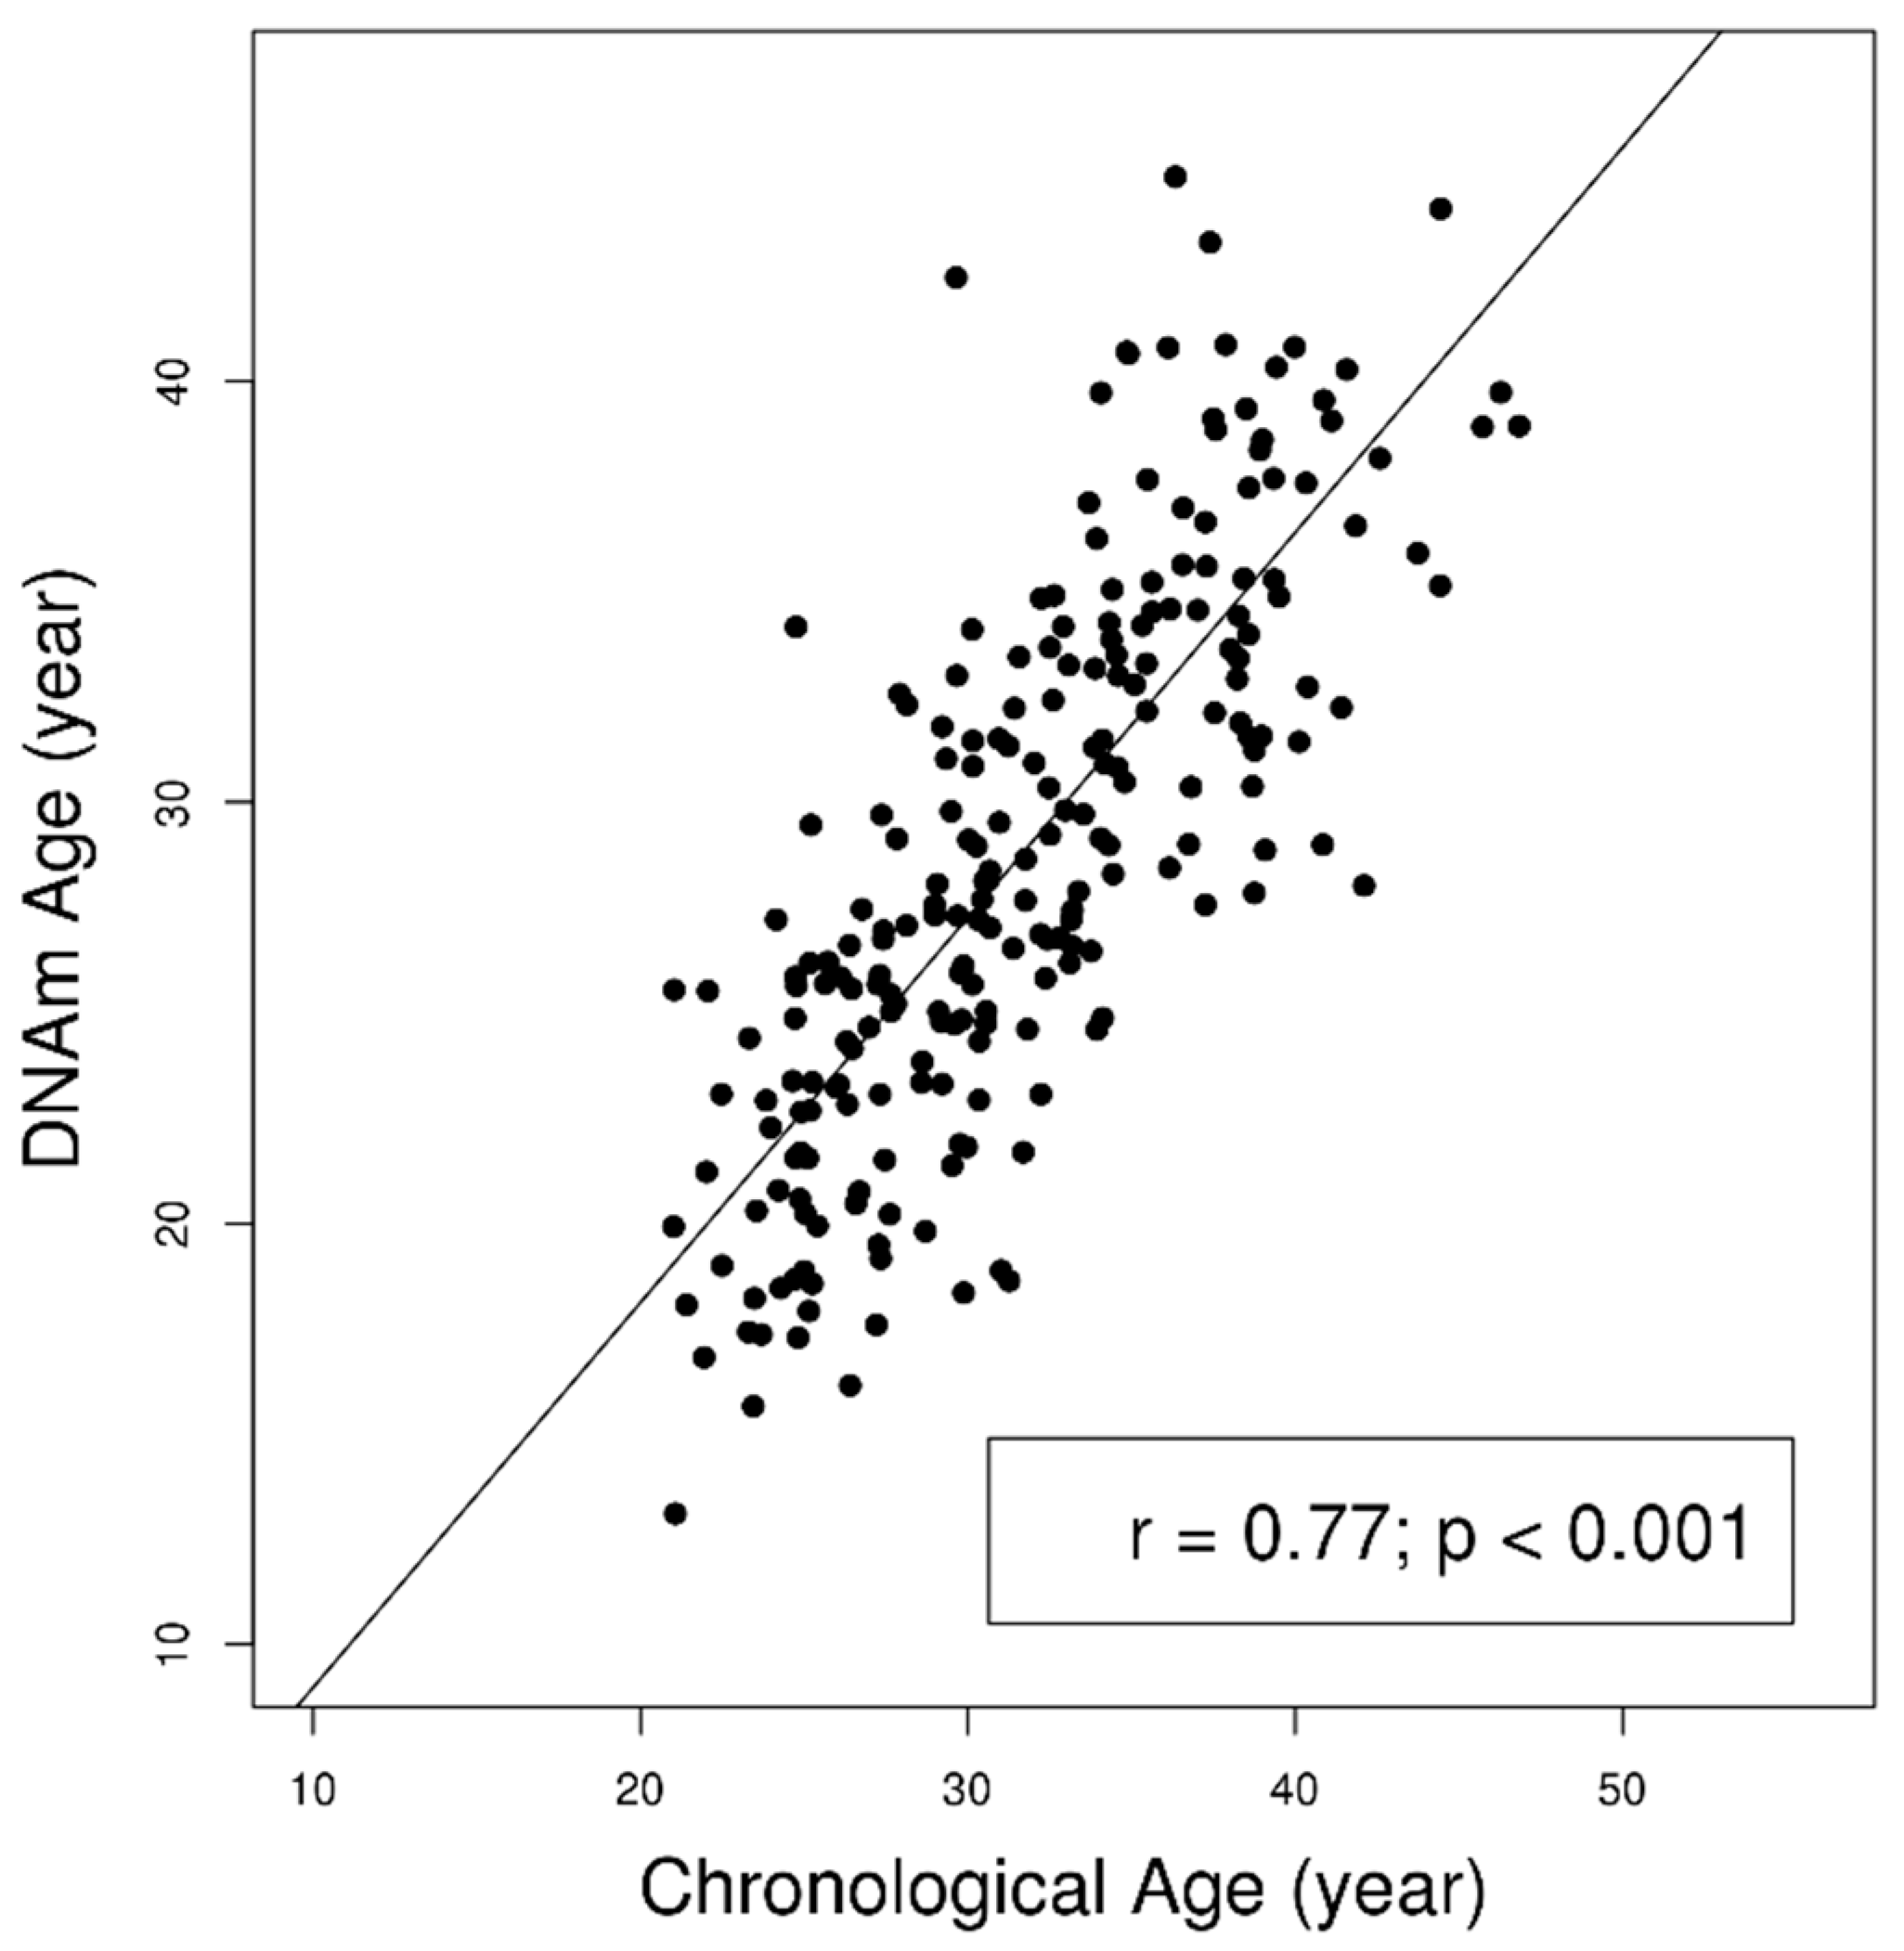
| Chronological age, years | 31.67 (5.70) | NA | |
| DNA methylation age, years | 28.79 (6.75) | NA | |
| DAge, years | −2.41 (4.33) | NA | |
| DNAm AA, years | −0.14 (−3.04–2.65) | NA | |
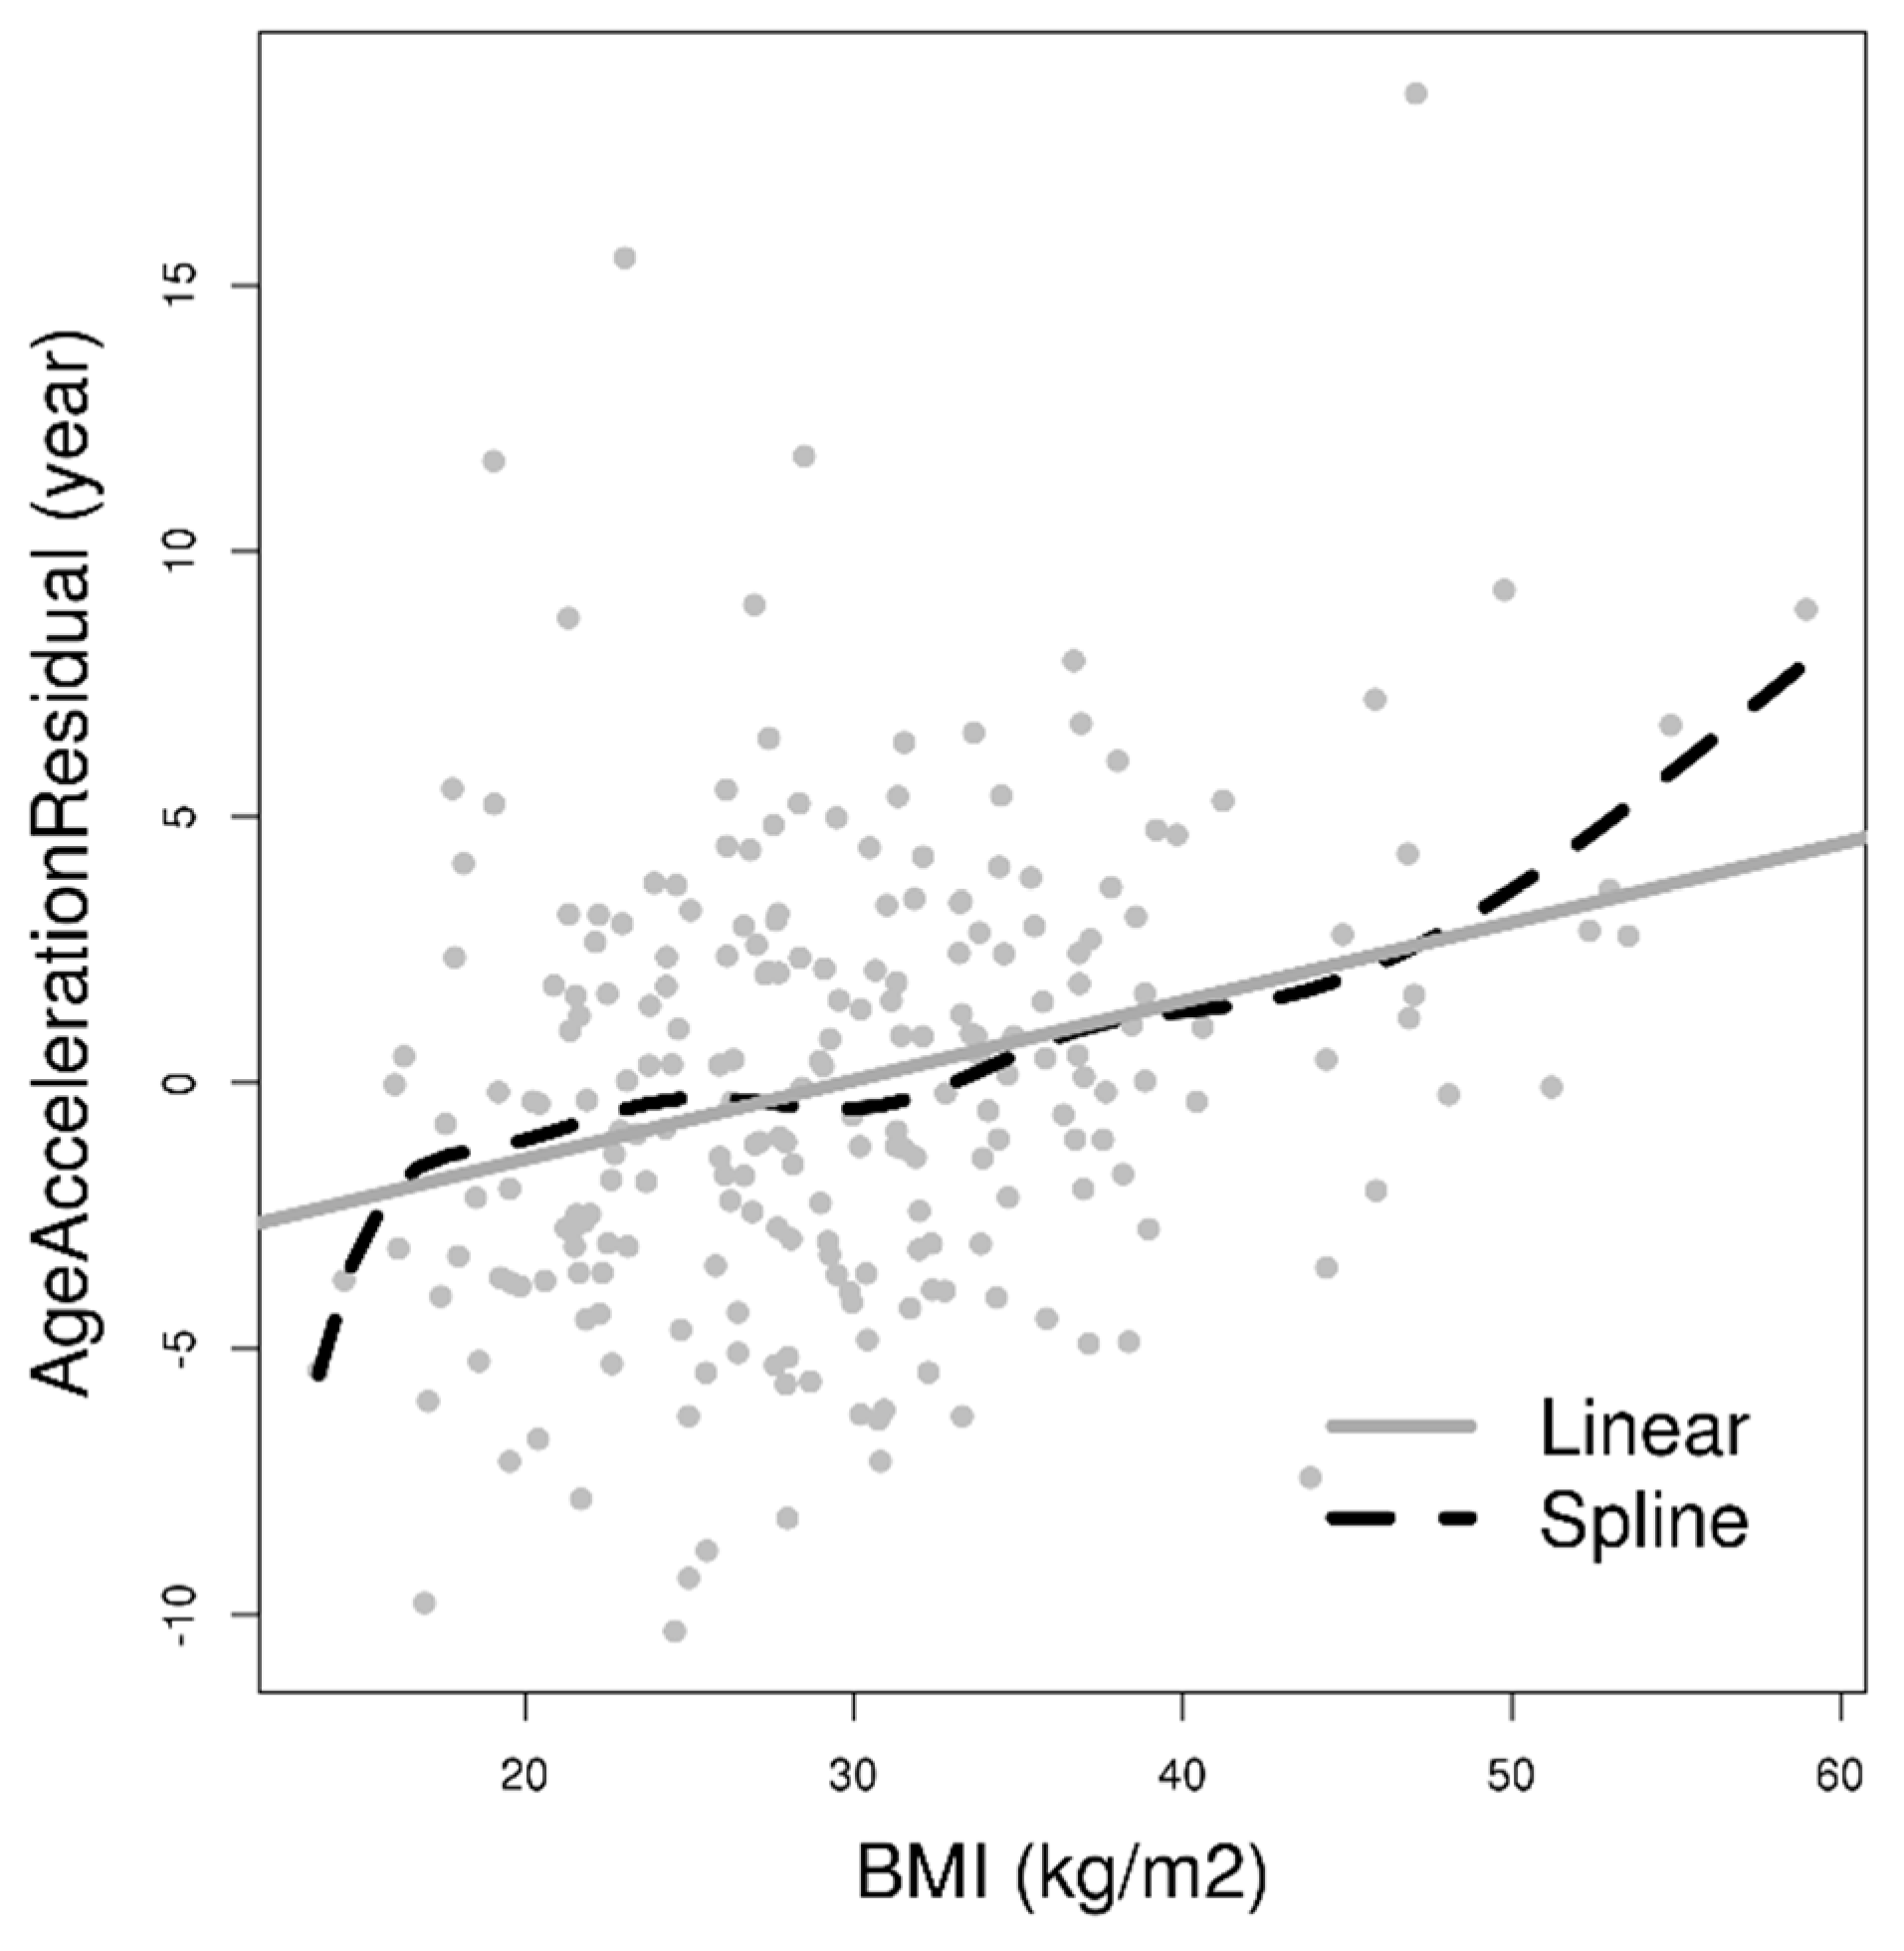
| Body Mass Index, kg/m2 | 29.69 (8.25) | 0.15 * (0.08, 0.21) | |
| Maternal cigarettes use | No | 179 (77.20) | (Ref) |
| Yes | 53 (22.80) | −0.73 (−2.05, 0.59) | |
| Education | <College | 94 (40.50) | (Ref) |
| College graduate or higher | 138 (59.50) | 0.77 (−0.36, 1.90) | |
| Annual household income, $ | <15,000 | 110 (47.41) | (Ref) |
| ≥15000 | 122 (52.59) | 0.19 (−0.93, 1.30) | |
| Marital Status | Married | 55 (23.70) | (Ref) |
| Single | 152 (65.50) | −0.28 (−1.62, 1.06) | |
| Others | 25 (10.80) | −0.41 (−2.46, 1.64) | |
| Ever diagnosed with hypertension | No | 185 (79.70) | (Ref) |
| Yes | 47(20.30) | 1.49 * (0.11, 2.86) | |
| BMI category | Normal and Underweight (<24.9 kg/m²) | 72 (31.00) | (Ref) |
| Overweight (25–29.9 kg/m²) | 58 (25.00) | 1.00 (−0.48, 2.47) | |
| Obese (≥30 kg/m²) | 102 (44.00) | 1.87 * (0.59, 3.16) | |
| Association between DNAm AA and Obesity-Related Traits | Model 1 | Model 2 | |
|---|---|---|---|
| β coefficient (95% CI) for continuous BMI | 0.15 *** | 0.14 *** | |
| (0.09, 0.22) | (0.08, 0.21) | ||
| β coefficient (95% CI) for BMI Category | Normal and Underweight a | (Ref) | (Ref) |
| Overweight b | 1.23 | 1.13 | |
| (−0.024, 2.48) | (−0.13, 2.39) | ||
| Obese c | 2.01 * | 1.92 * | |
| (0.92, 3.10) | (0.82, 3.02) | ||
| Covariates adjusted for in the model | Annual household income, Education, Marital Status, Smoking, 10 Principal Components, 8 Inferred Cell Types | Model 1 + Hypertension Status | |
© 2019 by the authors. Licensee MDPI, Basel, Switzerland. This article is an open access article distributed under the terms and conditions of the Creative Commons Attribution (CC BY) license (http://creativecommons.org/licenses/by/4.0/).
Share and Cite
Li, C.; Wang, Z.; Hardy, T.; Huang, Y.; Hui, Q.; Crusto, C.A.; Wright, M.L.; Taylor, J.Y.; Sun, Y.V. Association of Obesity with DNA Methylation Age Acceleration in African American Mothers from the InterGEN Study. Int. J. Mol. Sci. 2019, 20, 4273. https://doi.org/10.3390/ijms20174273
Li C, Wang Z, Hardy T, Huang Y, Hui Q, Crusto CA, Wright ML, Taylor JY, Sun YV. Association of Obesity with DNA Methylation Age Acceleration in African American Mothers from the InterGEN Study. International Journal of Molecular Sciences. 2019; 20(17):4273. https://doi.org/10.3390/ijms20174273
Chicago/Turabian StyleLi, Chengchen, Zeyuan Wang, Theresa Hardy, Yunfeng Huang, Qin Hui, Cindy A. Crusto, Michelle L. Wright, Jacquelyn Y. Taylor, and Yan V. Sun. 2019. "Association of Obesity with DNA Methylation Age Acceleration in African American Mothers from the InterGEN Study" International Journal of Molecular Sciences 20, no. 17: 4273. https://doi.org/10.3390/ijms20174273
APA StyleLi, C., Wang, Z., Hardy, T., Huang, Y., Hui, Q., Crusto, C. A., Wright, M. L., Taylor, J. Y., & Sun, Y. V. (2019). Association of Obesity with DNA Methylation Age Acceleration in African American Mothers from the InterGEN Study. International Journal of Molecular Sciences, 20(17), 4273. https://doi.org/10.3390/ijms20174273