Radiosensitivity Differences between EGFR Mutant and Wild-Type Lung Cancer Cells are Larger at Lower Doses

 ,
,
Abstract
1. Introduction
2. Results
3. Discussion
4. Materials and Methods
4.1. Cell Lines
4.2. Clonogenic Assays
4.3. Statistical Analysis
Author Contributions
Funding
Conflicts of Interest
Abbreviations
| NSCLC | non-small cell lung carcinoma |
| LQ model | linear quadratic model |
| MID | mean inactivation dose |
| DNA-PKcs | DNA-dependent protein kinase, catalytic subunit |
| NHEJ | non-homologous end joining |
References
- Okunieff, P.; Morgan, D.; Niemierko, A.; Suit, H.D. Radiation dose-response of human tumors. Int. J. Radiat. Oncol. Biol. Phys. 1995, 32, 1227–1237. [Google Scholar] [CrossRef]
- Hinkson, I.V.; Davidsen, T.M.; Klemm, J.D.; Kerlavage, A.R.; Kibbe, W.A. A Comprehensive Infrastructure for Big Data in Cancer Research: Accelerating Cancer Research and Precision Medicine. Front. Cell Dev. Biol. 2017, 2, 83. [Google Scholar] [CrossRef] [PubMed]
- Jordan, E.J.; Kim, H.R.; Arcila, M.E.; Barron, D.; Chakravarty, D.; Gao, J.; Chang, M.T.; Ni, A.; Kundra, R.; Jonsson, P.; et al. Prospective comprehensive molecular characterization of lung adenocarcinomas for efficient patient matching to approved and emerging therapies. Cancer Discov. 2017, 7, 596–609. [Google Scholar] [CrossRef] [PubMed]
- Robson, M.; Im, S.A.; Senkus, E.; Xu, B.; Domchek, S.M.; Masuda, N.; Delaloge, S.; Li, W.; Tung, N.; Armstrong, A.; et al. Olaparib for Metastatic Breast Cancer in Patients with a Germline BRCA Mutation. N. Engl. J. Med. 2017, 377, 523–533. [Google Scholar] [CrossRef] [PubMed]
- Lamba, J.K.; Chauhan, L.; Shin, M.; Loken, M.R.; Pollard, J.A.; Wang, Y.C.; Ries, R.E.; Aplenc, R.; Hirsch, B.A.; Raimondi, S.C.; et al. CD33 Splicing Polymorphism Determines Gemtuzumab Ozogamicin Response in De Novo Acute Myeloid Leukemia: Report from Randomized Phase III Children’s Oncology Group Trial AAML0531. J. Clin. Oncol. 2017, 35, 2674–2682. [Google Scholar] [CrossRef] [PubMed]
- Harris, M.H.; DuBois, S.G.; Glade Bender, J.L.; Kim, A.; Crompton, B.D.; Parker, E.; Dumont, I.P.; Hong, A.L.; Guo, D.; Church, A.; et al. Multicenter Feasibility Study of Tumor Molecular Profiling to Inform Therapeutic Decisions in Advanced Pediatric Solid Tumors: The Individualized Cancer Therapy (iCat) Study. JAMA Oncol. 2016, 2, 608–615. [Google Scholar] [CrossRef]
- Franken, N.A.; Rodermond, H.M.; Stap, J.; Haveman, J.; van Bree, C. Clonogenic assay of cells in vitro. Nat. Protoc. 2006, 2, 2315–2319. [Google Scholar] [CrossRef] [PubMed]
- Fertil, B.; Malaise, E.P. Inherent cellular radiosensitivity as a basic concept for human tumor radiotherapy. Int. J. Radiat. Oncol. Biol. Phys. 1981, 7, 621–629. [Google Scholar] [CrossRef]
- Deacon, J.; Peckham, M.J.; Steel, G.G. The radioresponsiveness of human tumours and the initial slope of the cell survival curve. Radiother. Oncol. 1984, 2, 317–323. [Google Scholar] [CrossRef]
- Fertil, B.; Dertinger, H.; Courdi, A.; Malaise, E.P. Mean inactivation dose: A useful concept for intercomparison of human cell survival curves. Radiat. Res. 1984, 99, 73–84. [Google Scholar] [CrossRef]
- Fertil, B.; Malaise, E.P. Intrinsic radiosensitivity of human cell lines is correlated with radioresponsiveness of human tumors: Analysis of 101 published survival curves. Int. J. Radiat. Oncol. Biol. Phys. 1985, 11, 1699–1707. [Google Scholar] [CrossRef]
- Steel, G.G. The radiobiology of tumours. In Basic Clinical Radiobiology, 3rd ed.; Steel, G.G., Ed.; CRC Press: Boca Raton, FL, USA, 2002; pp. 182–191. [Google Scholar]
- Yagishita, S.; Horinouchi, H.; Taniyama, K.T.; Nakamichi, S.; Kitazono, S.; Mizugaki, H.; Kanda, S.; Fujiwara, Y.; Nokihara, H.; Yamamoto, N.; et al. Epidermal growth factor receptor mutation is associated with longer local control after definitive chemoradiotherapy in patients with stage III nonsquamous non-small-cell lung cancer. Int. J. Radiat. Oncol. Biol. Phys. 2015, 91, 140–148. [Google Scholar] [CrossRef] [PubMed]
- Amornwichet, N.; Oike, T.; Shibata, A.; Nirodi, C.S.; Ogiwara, H.; Makino, H.; Kimura, Y.; Hirota, Y.; Isono, M.; Yoshida, Y.; et al. The EGFR mutation status affects the relative biological effectiveness of carbon-ion beams in non-small cell lung carcinoma cells. Sci. Rep. 2015, 5, 11305. [Google Scholar] [CrossRef] [PubMed]
- Das, A.K.; Chen, B.P.; Story, M.D.; Sato, M.; Minna, J.D.; Chen, D.J.; Nirodi, C.S. Somatic mutations in the tyrosine kinase domain of epidermal growth factor receptor (EGFR) abrogate EGFR-mediated radioprotection in non-small cell lung carcinoma. Cancer Res. 2007, 67, 5267–5274. [Google Scholar] [CrossRef] [PubMed]
- Dittmann, K.; Mayer, C.; Fehrenbacher, B.; Schaller, M.; Raju, U.; Milas, L.; Chen, D.J.; Kehlbach, R.; Rodemann, H.P. Radiation-induced epidermal growth factor receptor nuclear import is linked to activation of DNA-dependent protein kinase. J. Biol. Chem. 2005, 280, 31182–31189. [Google Scholar] [CrossRef] [PubMed]
- Huang, S.M.; Harari, P.M. Modulation of radiation response after epidermal growth factor receptor blockade in squamous cell carcinomas: Inhibition of damage repair, cell cycle kinetics, and tumor angiogenesis. Clin. Cancer Res. 2000, 6, 2166–2174. [Google Scholar]
- Strom, T.; Harrison, L.B.; Giuliano, A.R.; Schell, M.J.; Eschrich, S.A.; Berglund, A.; Fulp, W.; Thapa, R.; Coppola, D.; Kim, S.; et al. Tumour radiosensitivity is associated with immune activation in solid tumours. Eur. J. Cancer 2017, 84, 304–314. [Google Scholar] [CrossRef]
- Torres-Roca, J.F.; Fulp, W.J.; Caudell, J.J.; Servant, N.; Bollet, M.A.; van de Vijver, M.; Naghavi, A.O.; Harris, E.E.; Eschrich, S.A. Integration of a radiosensitivity molecular signature into the assessment of local recurrence risk in breast cancer. Int. J. Radiat. Oncol. Biol. Phys. 2015, 93, 631–638. [Google Scholar] [CrossRef]
- Ahmed, K.A.; Chinnaiyan, P.; Fulp, W.J.; Eschrich, S.; Torres-Roca, J.F.; Caudell, J.J. The radiosensitivity index predicts for overall survival in glioblastoma. Oncotarget 2015, 6, 34414–34422. [Google Scholar] [CrossRef]
- Strom, T.; Hoffe, S.E.; Fulp, W.; Frakes, J.; Coppola, D.; Springett, G.M.; Malafa, M.P.; Harris, C.L.; Eschrich, S.A.; Torres-Roca, J.F.; et al. Radiosensitivity index predicts for survival with adjuvant radiation in resectable pancreatic cancer. Radiother. Oncol. 2015, 117, 159–164. [Google Scholar] [CrossRef]
- Nuryadi, E.; Permata, T.B.M.; Komatsu, S.; Oike, T.; Nakano, T. Inter-assay presicion of clonogenic assay for radiosensitivity in cancer cell line A549. Oncotarget 2018, 9, 13706–13712. [Google Scholar] [CrossRef] [PubMed]
- Blanco, R.; Iwakawa, R.; Tang, M.; Kohno, T.; Angulo, B.; Pio, R.; Montuenga, L.M.; Minna, J.D.; Yokota, J.; Sanchez-Cespedes, M. A gene-alteration profile of human lung cancer cell lines. Hum. Mutat. 2009, 30, 1199–1206. [Google Scholar] [CrossRef] [PubMed]
- Helfrich, B.A.; Raben, D.; Varella-Garcia, M.; Gustafson, D.; Chan, D.C.; Bemis, L.; Coldren, C.; Barón, A.; Zeng, C.; Franklin, W.A.; et al. Antitumor activity of the epidermal growth factor receptor (EGFR) tyrosine kinase inhibitor gefitinib (ZD1839, Iressa) in non-small cell lung cancer cell lines correlates with gene copy number and EGFR mutations but not EGFR protein levels. Clin. Cancer Res. 2006, 12, 7117–7125. [Google Scholar] [CrossRef] [PubMed]
- Sakai, K.; Yokote, H.; Murakami-Murofushi, K.; Tamura, T.; Saijo, N.; Nishio, K. Pertuzumab, a novel HER dimerization inhibitor.; inhibits the growth of human lung cancer cells mediated by the HER3 signaling pathway. Cancer Sci. 2007, 98, 1498–1503. [Google Scholar] [CrossRef] [PubMed]
- Kawahara, A.; Yamamoto, C.; Nakashima, K.; Azuma, K.; Hattori, S.; Kashihara, M.; Aizawa, H.; Basaki, Y.; Kuwano, M.; Kage, M.; et al. Molecular diagnosis of activating EGFR mutations in non-small cell lung cancer using mutation-specific antibodies for immunohistochemical analysis. Clin. Cancer Res. 2010, 16, 3163–3170. [Google Scholar] [CrossRef] [PubMed]
- Spoerke, J.M.; O’Brien, C.; Huw, L.; Koeppen, H.; Fridlyand, J.; Brachmann, R.K.; Haverty, P.M.; Pandita, A.; Mohan, S.; Sampath, D.; et al. Phosphoinositide 3-kinase (PI3K) pathway alterations are associated with histologic subtypes and are predictive of sensitivity to PI3K inhibitors in lung cancer preclinical models. Clin. Cancer Res. 2012, 18, 6771–6783. [Google Scholar] [CrossRef] [PubMed]
- Oike, T.; Ogiwara, H.; Tominaga, Y.; Ito, K.; Ando, O.; Tsuta, K.; Mizukami, T.; Shimada, Y.; Isomura, H.; Komachi, M.; et al. A synthetic lethality-based strategy to treat cancers harboring a genetic deficiency in the chromatin remodeling factor BRG1. Cancer Res. 2013, 73, 5508–5518. [Google Scholar] [CrossRef] [PubMed]
- Oike, T.; Ogiwara, H.; Torikai, K.; Nakano, T.; Yokota, J.; Kohno, T. Garcinol, a histone acetyltransferase inhibitor, radiosensitizes cancer cells by inhibiting non-homologous end joining. Int. J. Radiat. Oncol. Biol. Phys. 2012, 84, 815–821. [Google Scholar] [CrossRef]


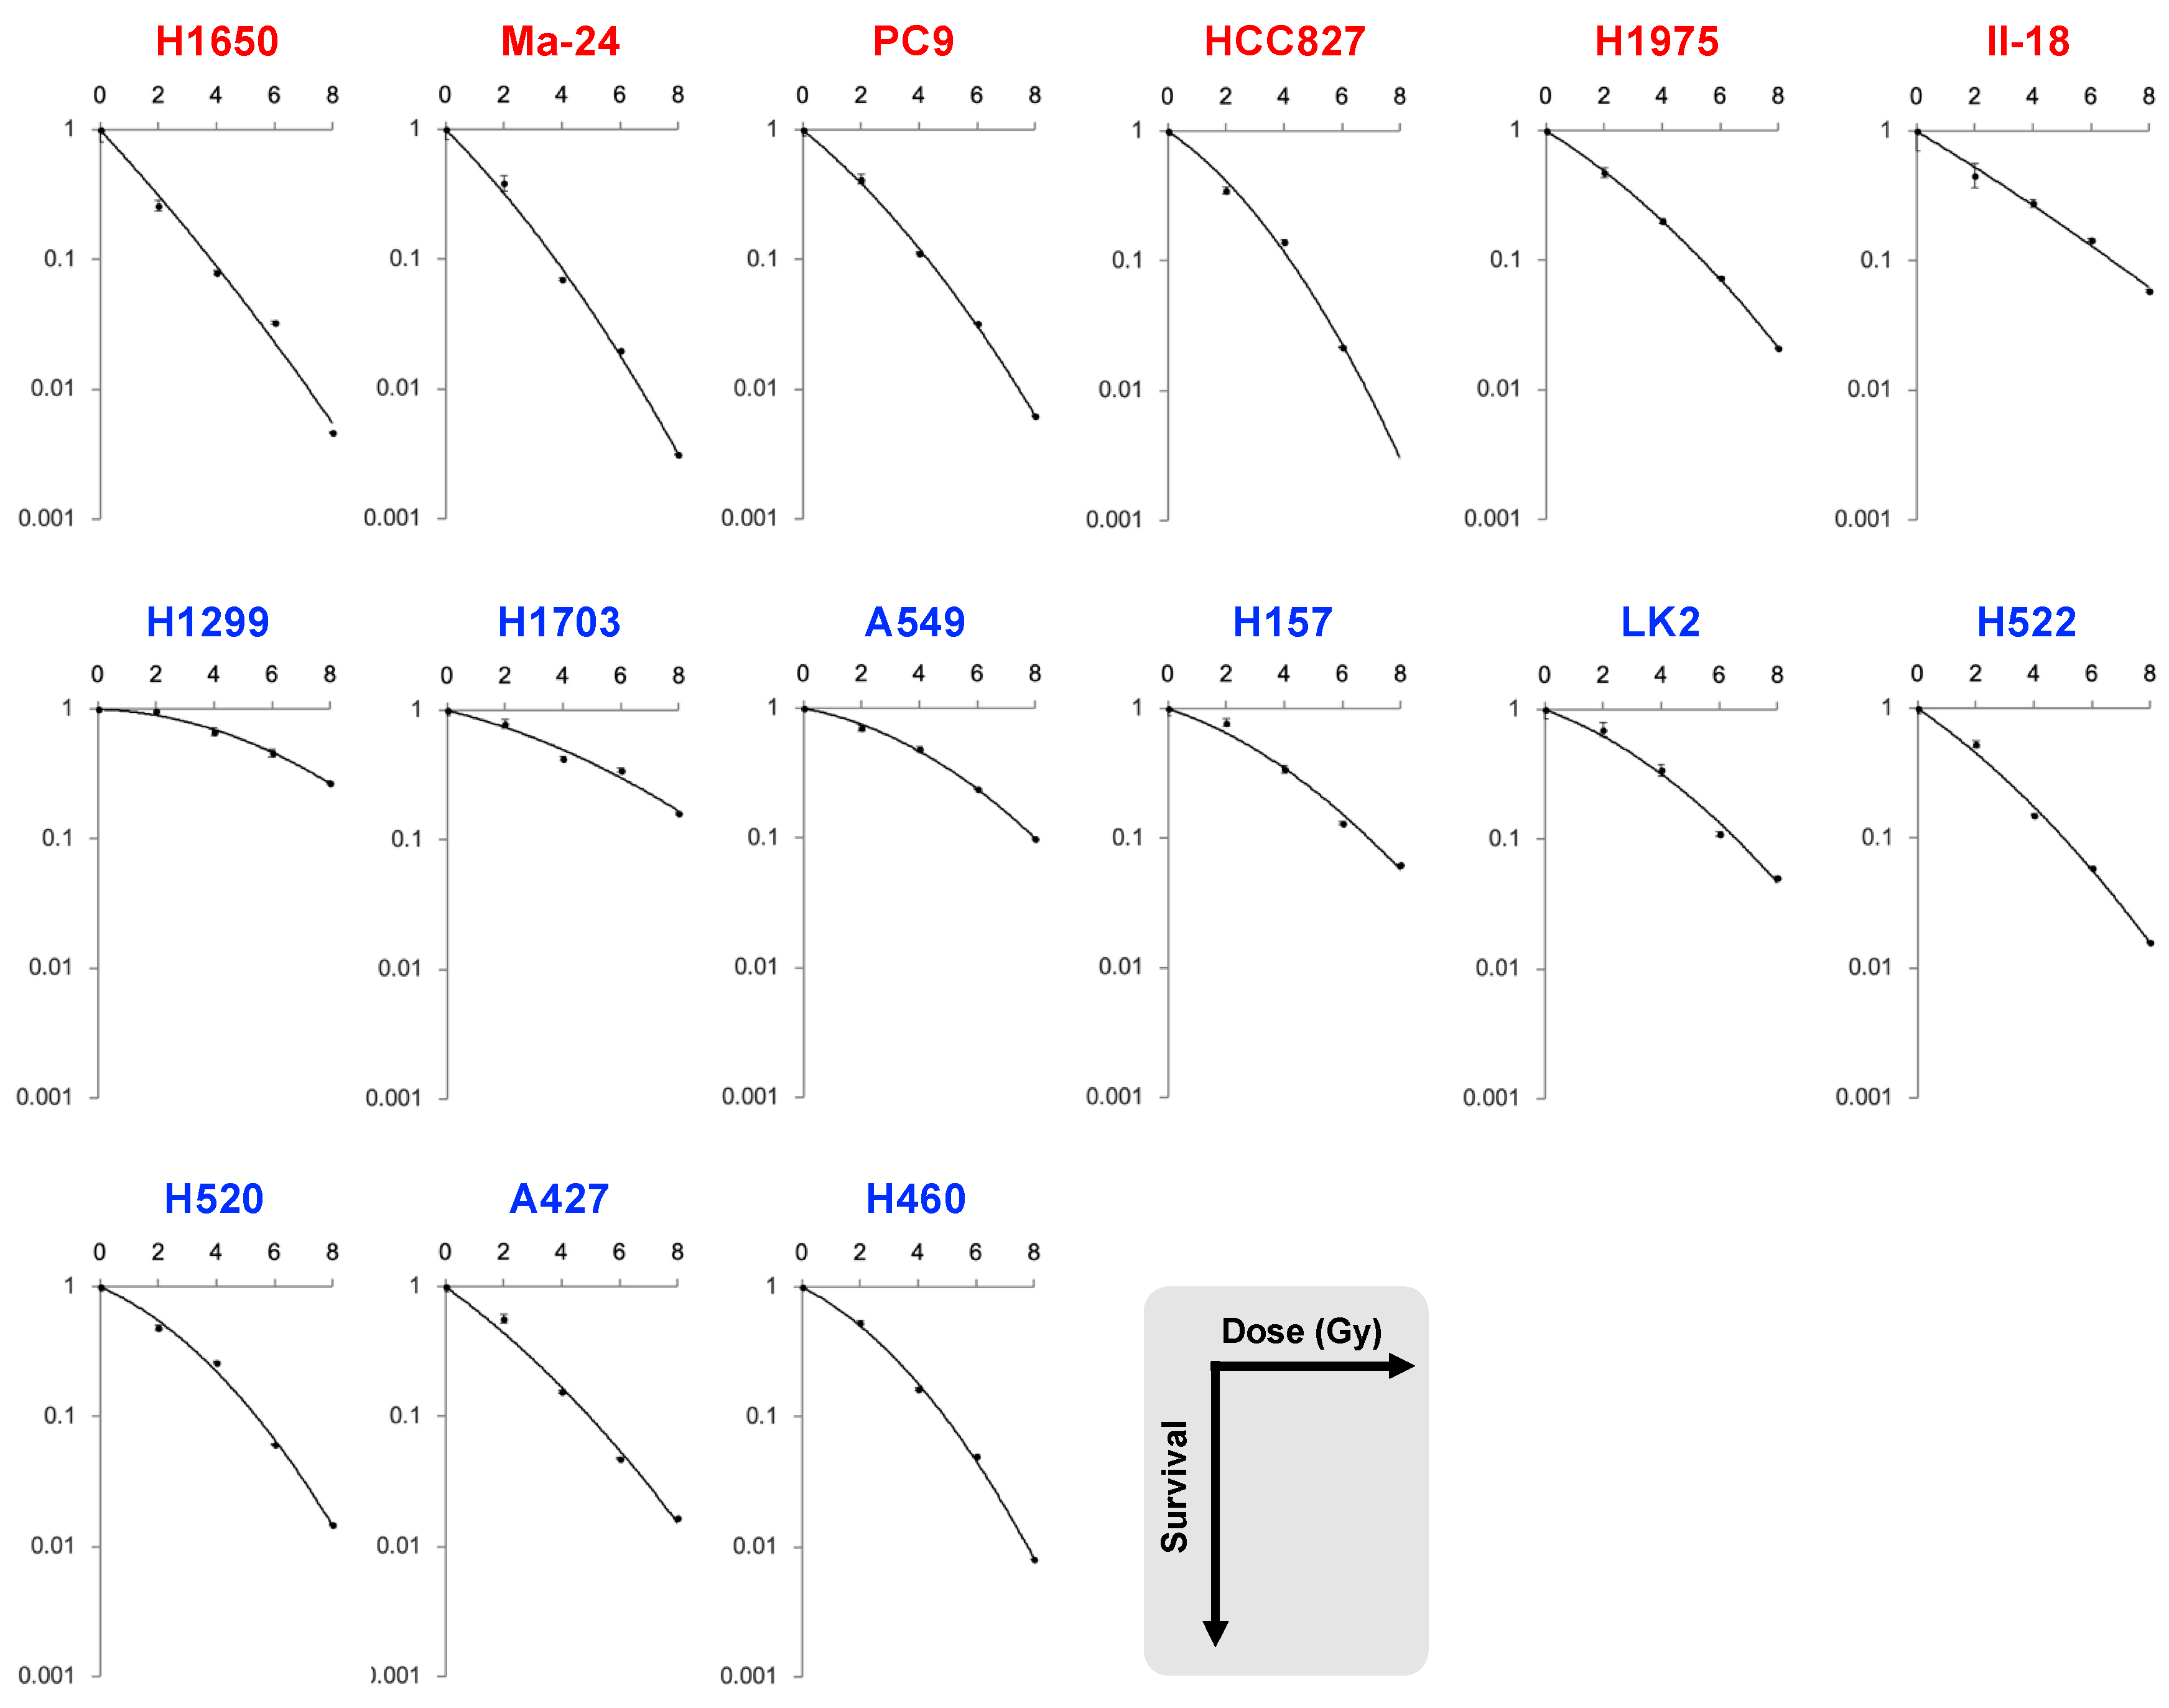
| Dataset | Cell Line | EGFR | SF2 | SF4 | SF6 | SF8 | MID | D10 | D50 | α | β | α/β |
|---|---|---|---|---|---|---|---|---|---|---|---|---|
| A | H1650 | mutant | 0.26 | 0.079 | 0.033 | 0.0047 | 1.7 | 3.8 | 1.2 | 0.56 | 0.012 | 46.4 |
| Ma-24 | 0.39 | 0.070 | 0.020 | 0.0031 | 1.7 | 3.8 | 1.3 | 0.51 | 0.026 | 19.7 | ||
| PC9 | 0.42 | 0.11 | 0.032 | 0.0063 | 2.0 | 4.3 | 1.5 | 0.42 | 0.027 | 15.4 | ||
| HCC827 | 0.35 | 0.14 | 0.022 | NA | 2.0 | 4.2 | 1.6 | 0.34 | 0.048 | 7.2 | ||
| H1975 | 0.47 | 0.20 | 0.073 | 0.021 | 2.5 | 5.4 | 1.9 | 0.32 | 0.021 | 15.5 | ||
| II-18 | 0.45 | 0.28 | 0.15 | 0.058 | 3.0 | 6.7 | 2.2 | 0.31 | 0.0047 | 65.9 | ||
| H1299 | wild-type | 0.97 | 0.67 | 0.46 | 0.27 | 6.1 | 10.7 | 5.7 | 0.015 | 0.019 | 0.82 | |
| H1703 | 0.79 | 0.43 | 0.35 | 0.16 | 4.7 | 9.5 | 4.0 | 0.13 | 0.012 | 10.3 | ||
| A549 | 0.71 | 0.49 | 0.24 | 0.098 | 4.2 | 8.0 | 3.8 | 0.092 | 0.025 | 3.7 | ||
| H157 | 0.78 | 0.34 | 0.13 | 0.062 | 3.4 | 6.9 | 2.9 | 0.17 | 0.024 | 7.2 | ||
| LK2 | 0.70 | 0.34 | 0.11 | 0.051 | 3.2 | 6.6 | 2.7 | 0.19 | 0.025 | 7.5 | ||
| H522 | 0.53 | 0.15 | 0.059 | 0.016 | 2.3 | 5.0 | 1.8 | 0.35 | 0.021 | 17.0 | ||
| H520 | 0.49 | 0.26 | 0.061 | 0.015 | 2.6 | 5.4 | 2.3 | 0.22 | 0.038 | 5.8 | ||
| A427 | 0.57 | 0.15 | 0.047 | 0.017 | 2.2 | 5.0 | 1.7 | 0.37 | 0.019 | 19.3 | ||
| H460 | 0.53 | 0.16 | 0.050 | 0.0081 | 2.4 | 4.9 | 2.0 | 0.26 | 0.043 | 6.0 | ||
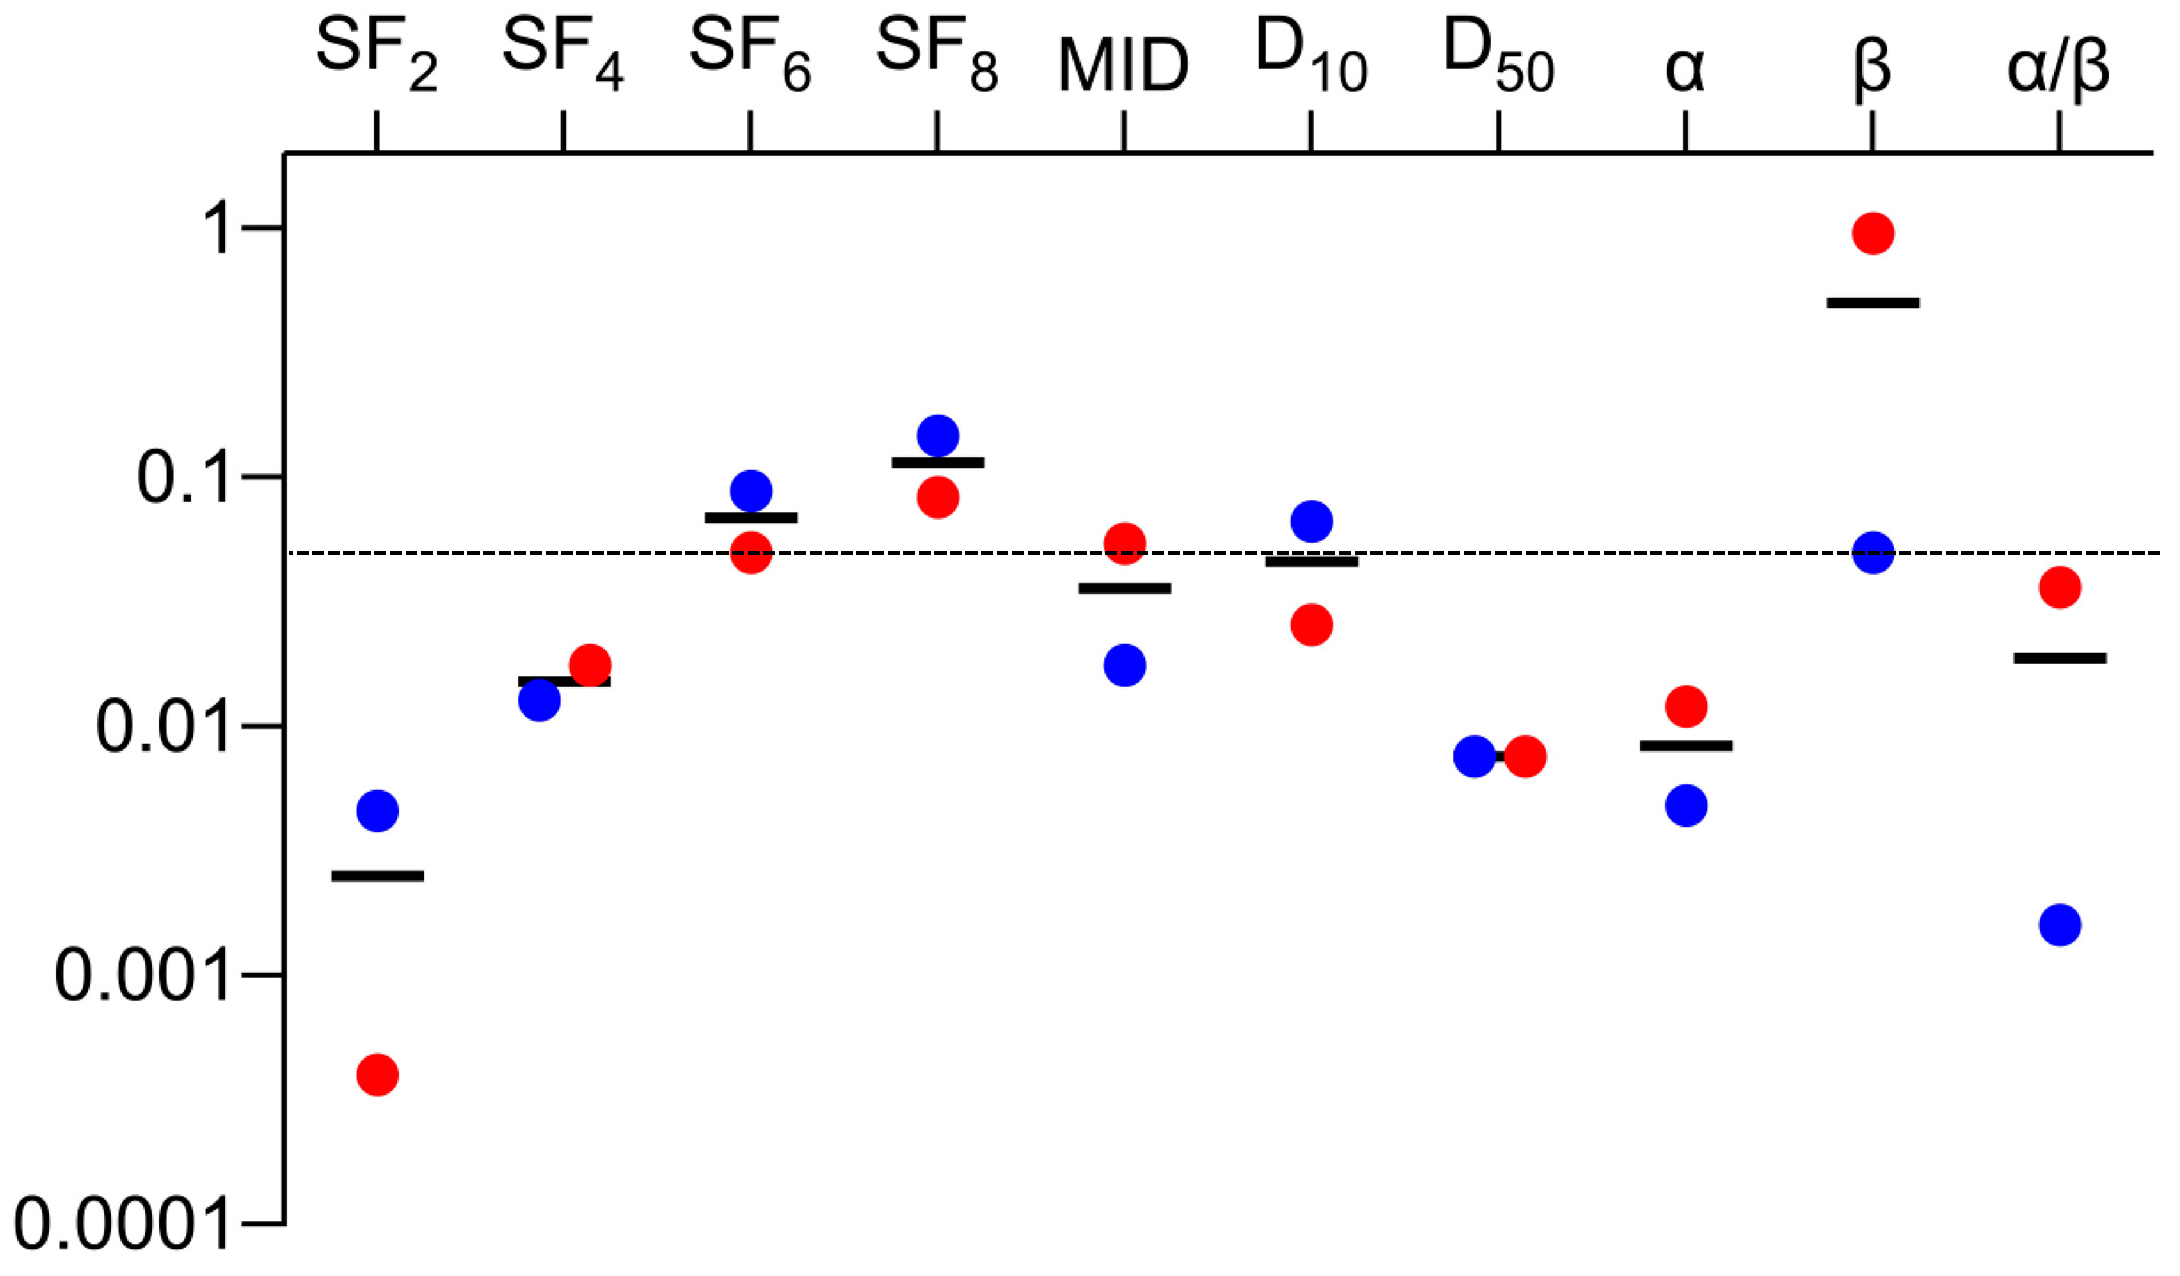
| p value | <0.001 | 0.018 | 0.049 | 0.082 | 0.054 | 0.025 | 0.0076 | 0.012 | 0.95 | 0.036 | ||
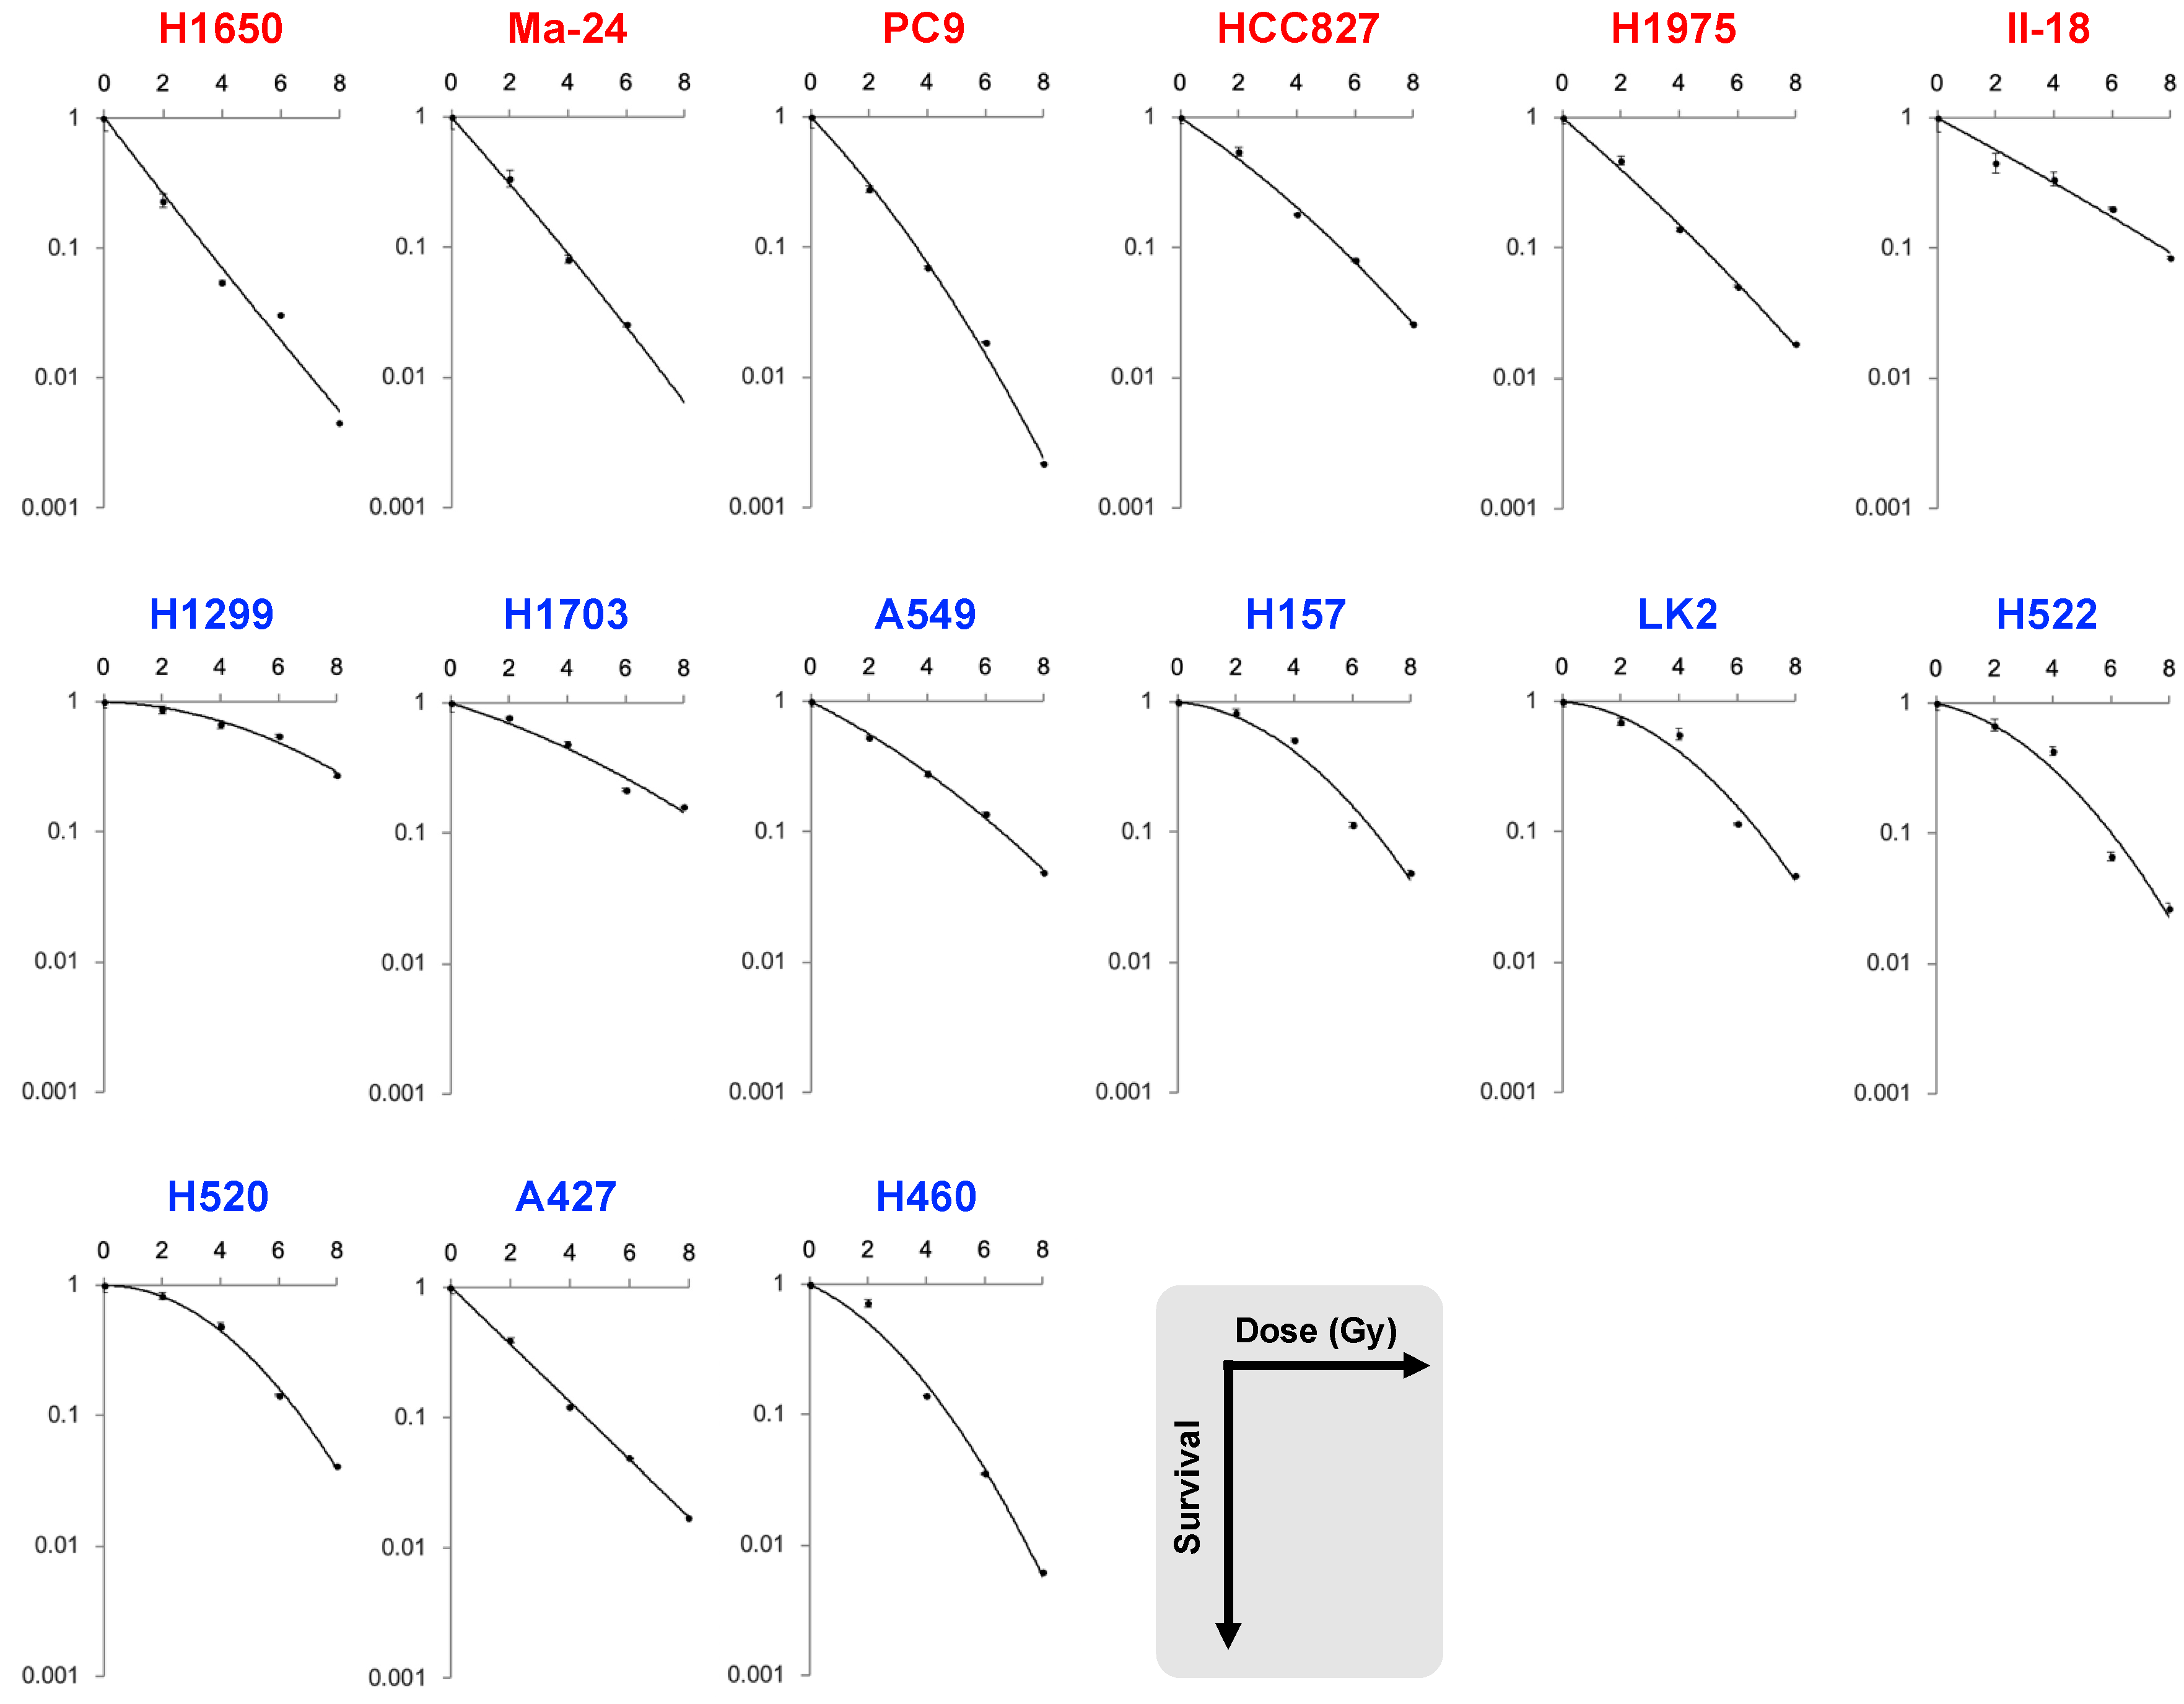
| B | H1650 | mutant | 0.23 | 0.054 | 0.031 | 0.0072 | 1.3 | 3.4 | 0.95 | 0.75 | −0.018 | NA |
| Ma-24 | 0.34 | 0.081 | 0.026 | NA | 1.7 | 3.8 | 1.2 | 0.58 | 0.0068 | 84.4 | ||
| PC9 | 0.28 | 0.070 | 0.019 | 0.0022 | 1.6 | 3.6 | 1.2 | 0.53 | 0.028 | 19.2 | ||
| HCC827 | 0.55 | 0.18 | 0.081 | 0.026 | 2.5 | 5.5 | 1.9 | 0.34 | 0.015 | 22.8 | ||
| H1975 | 0.47 | 0.14 | 0.051 | 0.018 | 2.1 | 4.8 | 1.5 | 0.44 | 0.0082 | 53.8 | ||
| II-18 | 0.45 | 0.34 | 0.20 | 0.085 | 3.4 | 7.8 | 2.5 | 0.27 | 0.0029 | 93.3 | ||
| H1299 | wild-type | 0.87 | 0.67 | 0.55 | 0.28 | 6.3 | 11.1 | 5.9 | 0.015 | 0.017 | 0.85 | |
| H1703 | 0.77 | 0.49 | 0.22 | 0.16 | 4.3 | 9.1 | 3.6 | 0.16 | 0.010 | 15.5 | ||
| A549 | 0.53 | 0.28 | 0.14 | 0.049 | 3.0 | 6.6 | 2.4 | 0.26 | 0.014 | 17.9 | ||
| H157 | 0.83 | 0.51 | 0.11 | 0.049 | 3.8 | 6.8 | 3.5 | 0.042 | 0.044 | 1.0 | ||
| LK2 | 0.70 | 0.56 | 0.12 | 0.046 | 3.8 | 6.7 | 3.5 | 0.044 | 0.044 | 1.0 | ||
| H522 | 0.68 | 0.43 | 0.066 | 0.027 | 3.2 | 6.0 | 2.9 | 0.11 | 0.046 | 2.3 | ||
| H520 | 0.83 | 0.49 | 0.14 | 0.041 | 3.9 | 6.8 | 3.7 | −0.005 | 0.051 | NA | ||
| A427 | 0.39 | 0.12 | 0.049 | 0.021 | 1.9 | 4.5 | 1.3 | 0.54 | −0.0068 | NA | ||
| H460 | 0.72 | 0.14 | 0.036 | 0.0062 | 2.4 | 4.8 | 2.0 | 0.24 | 0.051 | 4.7 | ||
| p value | 0.005 | 0.012 | 0.087 | 0.14 | 0.017 | 0.0660 | 0.0076 | 0.0048 | 0.049 | 0.0016 |
| Parameters | R Values | p Values |
|---|---|---|
| SF2 | 0.73 | 0.003 |
| SF4 | 0.81 | <0.001 |
| SF6 | 0.86 | <0.001 |
| SF8 | 0.91 | <0.001 |
| MID | 0.87 | <0.001 |
| D10 | 0.90 | <0.001 |
| D50 | 0.88 | <0.001 |
| α | 0.79 | <0.001 |
| β | 0.63 | 0.014 |
| α/β | 0.62 | 0.037 |
| Cell Line | Histopathology | EGFR Status | Reference |
|---|---|---|---|
| H1650 | Adenocarcinoma | ΔE746_A750 | [23,24] |
| Ma-24 | Adenocarcinoma | L858R, E709G | [23,25] |
| PC9 | Adenocarcinoma | ΔE746_A750 | [23,26] |
| HCC827 | Adenocarcinoma | ΔE746_A750 | [24,27] |
| H1975 | Adenocarcinoma | L858R, T790M | [24,26,27] |
| II-18 | Adenocarcinoma | L858R | [23,26,28] |
| H1299 | Large cell carcinoma | Wild-type | [23] |
| H1703 | Adenocarcinoma | Wild-type | [23,24] |
| A549 | Adenocarcinoma | Wild-type | [23,24,27,28] |
| H157 | Squamous cell carcinoma | Wild-type | [23,24,28] |
| LK2 | Squamous cell carcinoma | Wild-type | [23,26] |
| H522 | Adenocarcinoma | Wild-type | [23] |
| H520 | Squamous cell carcinoma | Wild-type | [23,24,27] |
| A427 | Adenocarcinoma | Wild-type | [23,28] |
| H460 | Large cell carcinoma | Wild-type | [23,24,27,28] |
| Cell Line | PE (%) | 0 Gy | 2 Gy | 4 Gy | 6 Gy | 8 Gy |
|---|---|---|---|---|---|---|
| H1650 | 12 | 500 | 500 | 1000 | 2000 | 3000 |
| Ma-24 | 24 | 500 | 500 | 1000 | 2000 | 3000 |
| PC9 | 25 | 500 | 500 | 1000 | 2000 | 3000 |
| HCC827 | 39 | 300 | 300 | 500 | 1000 | 2000 |
| H1975 | 35 | 300 | 300 | 500 | 1000 | 2000 |
| II-18 | 21 | 500 | 500 | 1000 | 2000 | 3000 |
| H1299 | 71 | 200 | 200 | 300 | 500 | 500 |
| H1703 | 34 | 300 | 300 | 500 | 1000 | 2000 |
| A549 | 72 | 200 | 200 | 300 | 500 | 500 |
| H157 | 65 | 200 | 200 | 300 | 500 | 500 |
| LK2 | 40 | 300 | 300 | 500 | 1000 | 2000 |
| H522 | 43 | 300 | 300 | 500 | 1000 | 2000 |
| H520 | 28 | 500 | 500 | 1000 | 2000 | 3000 |
| A427 | 32 | 300 | 300 | 500 | 1000 | 2000 |
| H460 | 58 | 300 | 300 | 500 | 1000 | 2000 |
© 2019 by the authors. Licensee MDPI, Basel, Switzerland. This article is an open access article distributed under the terms and conditions of the Creative Commons Attribution (CC BY) license (http://creativecommons.org/licenses/by/4.0/).
Share and Cite
Anakura, M.; Nachankar, A.; Kobayashi, D.; Amornwichet, N.; Hirota, Y.; Shibata, A.; Oike, T.; Nakano, T. Radiosensitivity Differences between EGFR Mutant and Wild-Type Lung Cancer Cells are Larger at Lower Doses. Int. J. Mol. Sci. 2019, 20, 3635. https://doi.org/10.3390/ijms20153635
Anakura M, Nachankar A, Kobayashi D, Amornwichet N, Hirota Y, Shibata A, Oike T, Nakano T. Radiosensitivity Differences between EGFR Mutant and Wild-Type Lung Cancer Cells are Larger at Lower Doses. International Journal of Molecular Sciences. 2019; 20(15):3635. https://doi.org/10.3390/ijms20153635
Chicago/Turabian StyleAnakura, Mai, Ankita Nachankar, Daijiro Kobayashi, Napapat Amornwichet, Yuka Hirota, Atsushi Shibata, Takahiro Oike, and Takashi Nakano. 2019. "Radiosensitivity Differences between EGFR Mutant and Wild-Type Lung Cancer Cells are Larger at Lower Doses" International Journal of Molecular Sciences 20, no. 15: 3635. https://doi.org/10.3390/ijms20153635
APA StyleAnakura, M., Nachankar, A., Kobayashi, D., Amornwichet, N., Hirota, Y., Shibata, A., Oike, T., & Nakano, T. (2019). Radiosensitivity Differences between EGFR Mutant and Wild-Type Lung Cancer Cells are Larger at Lower Doses. International Journal of Molecular Sciences, 20(15), 3635. https://doi.org/10.3390/ijms20153635