Green Tea Polyphenols Coupled with a Bioactive Titanium Alloy Surface: In Vitro Characterization of Osteoinductive Behavior through a KUSA A1 Cell Study

 ,
,  ,
, 
 and
and 
Abstract
1. Introduction
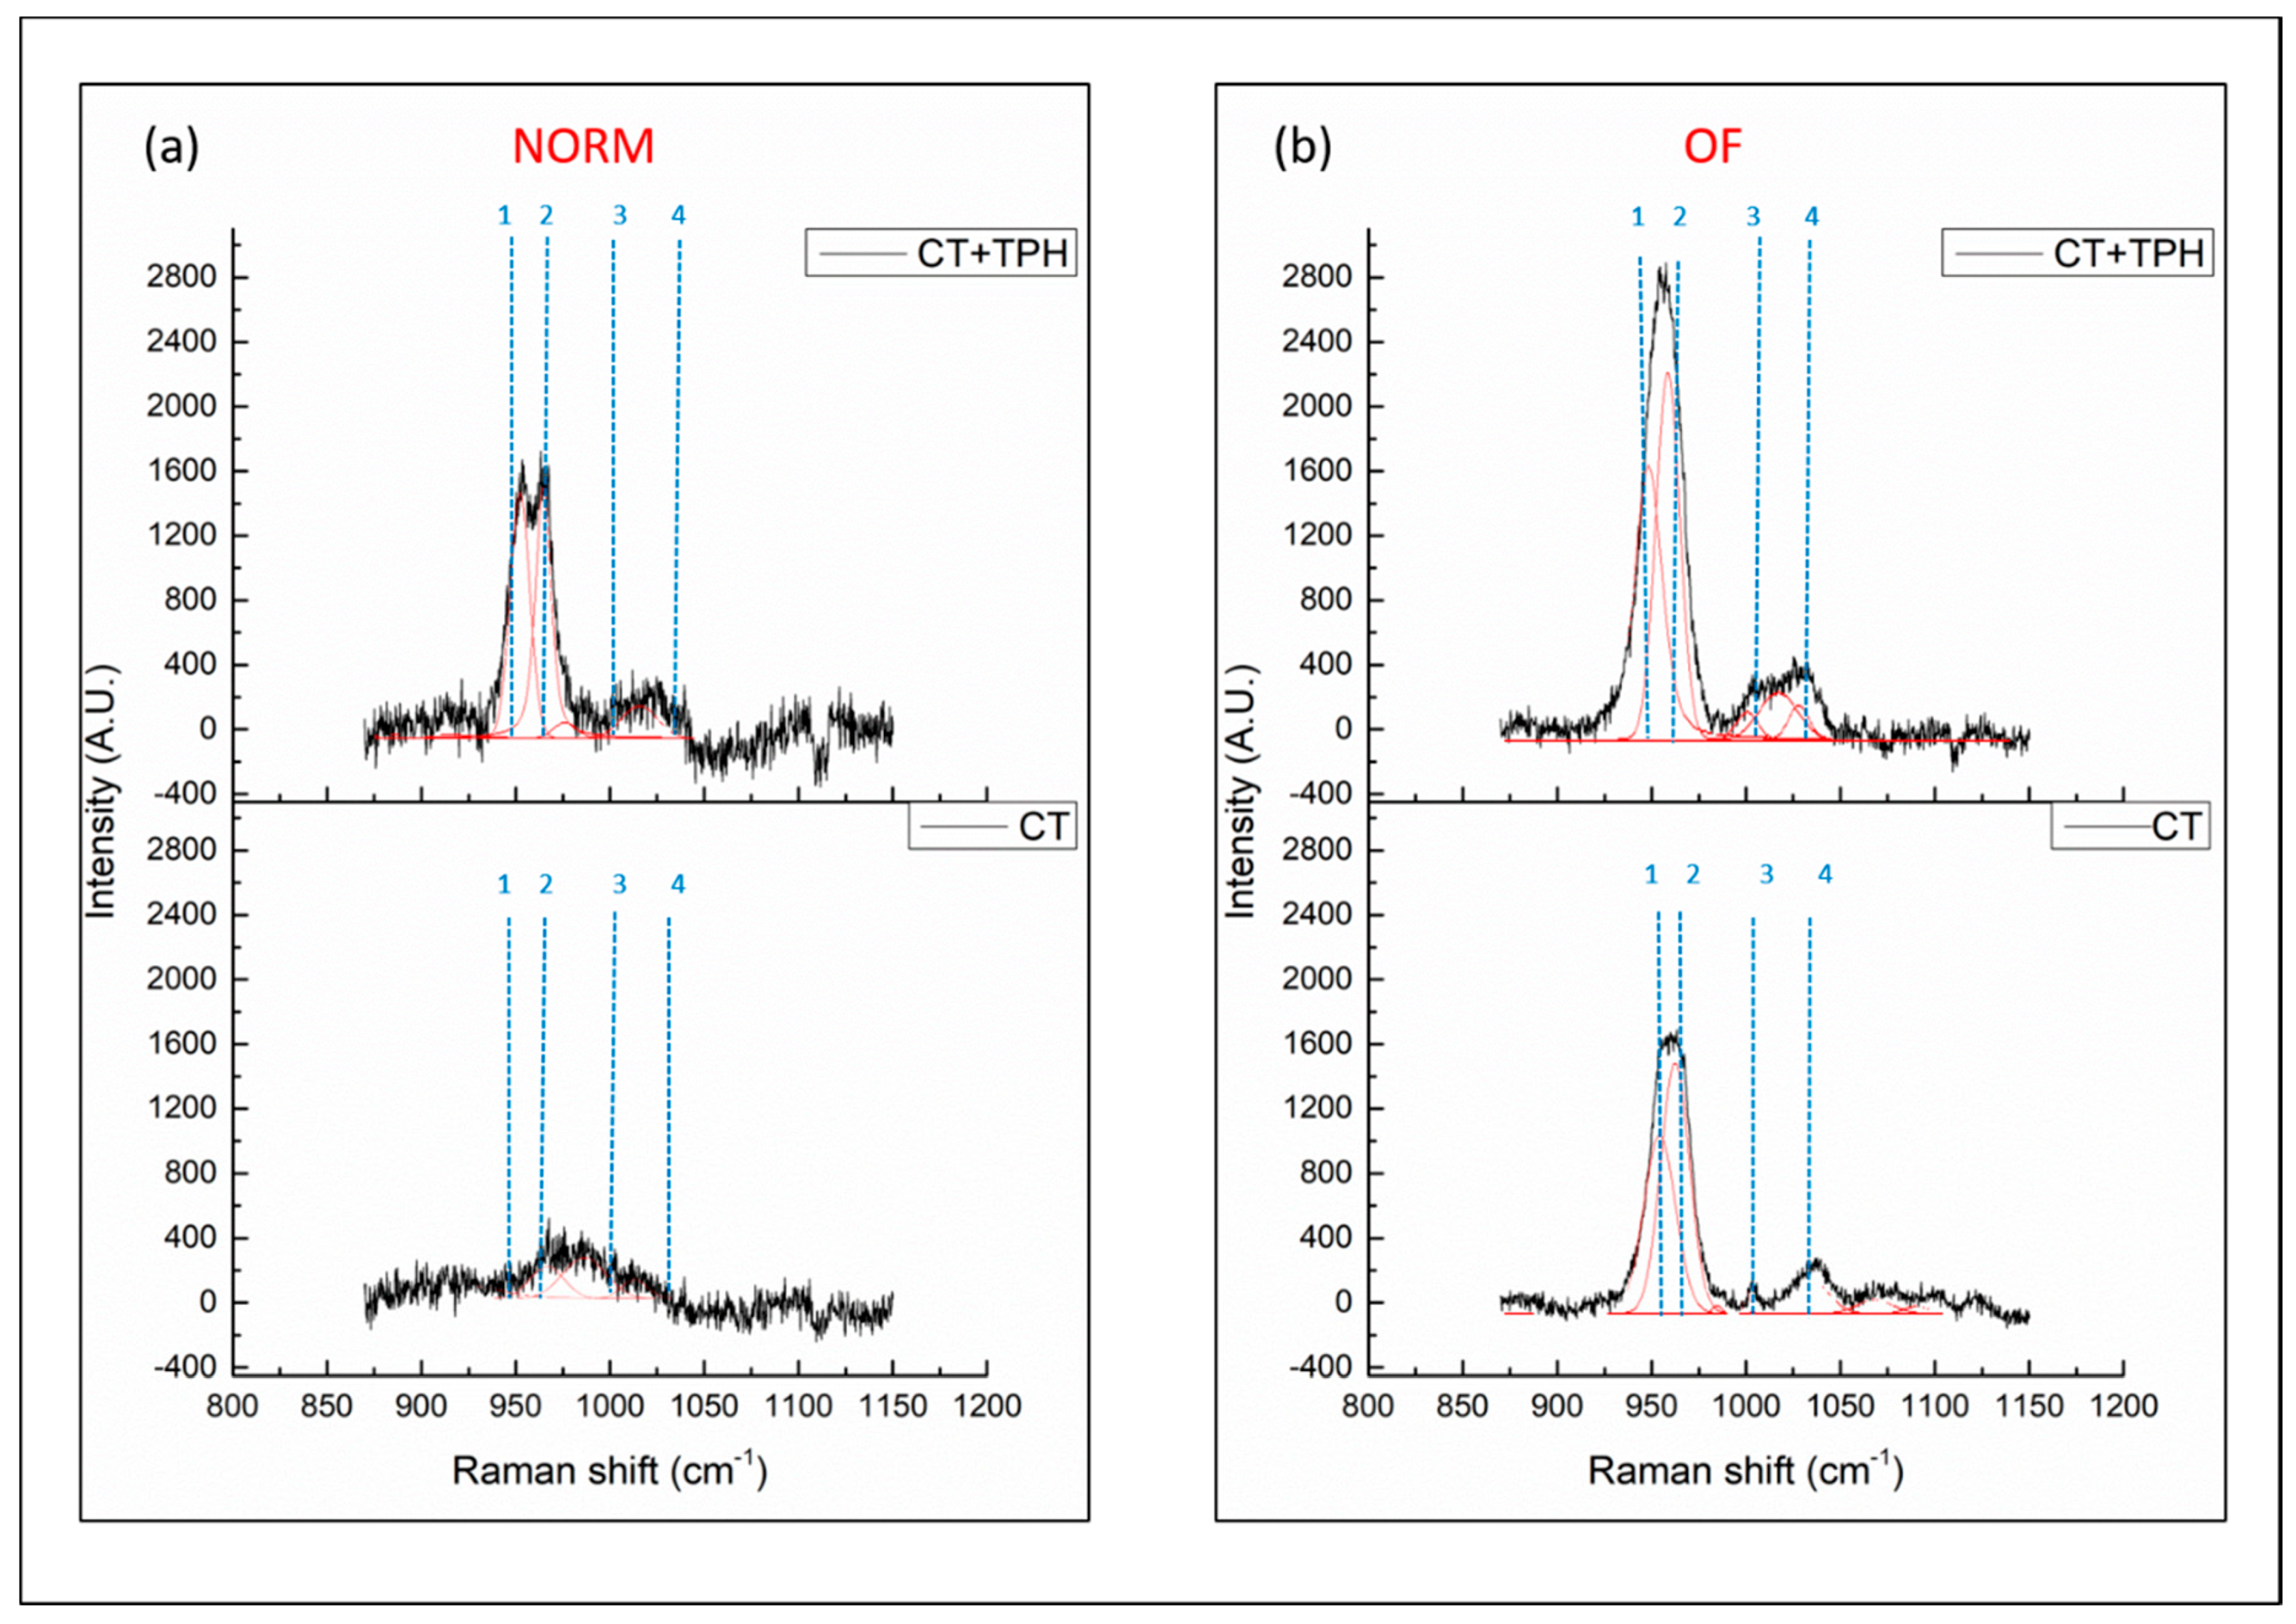
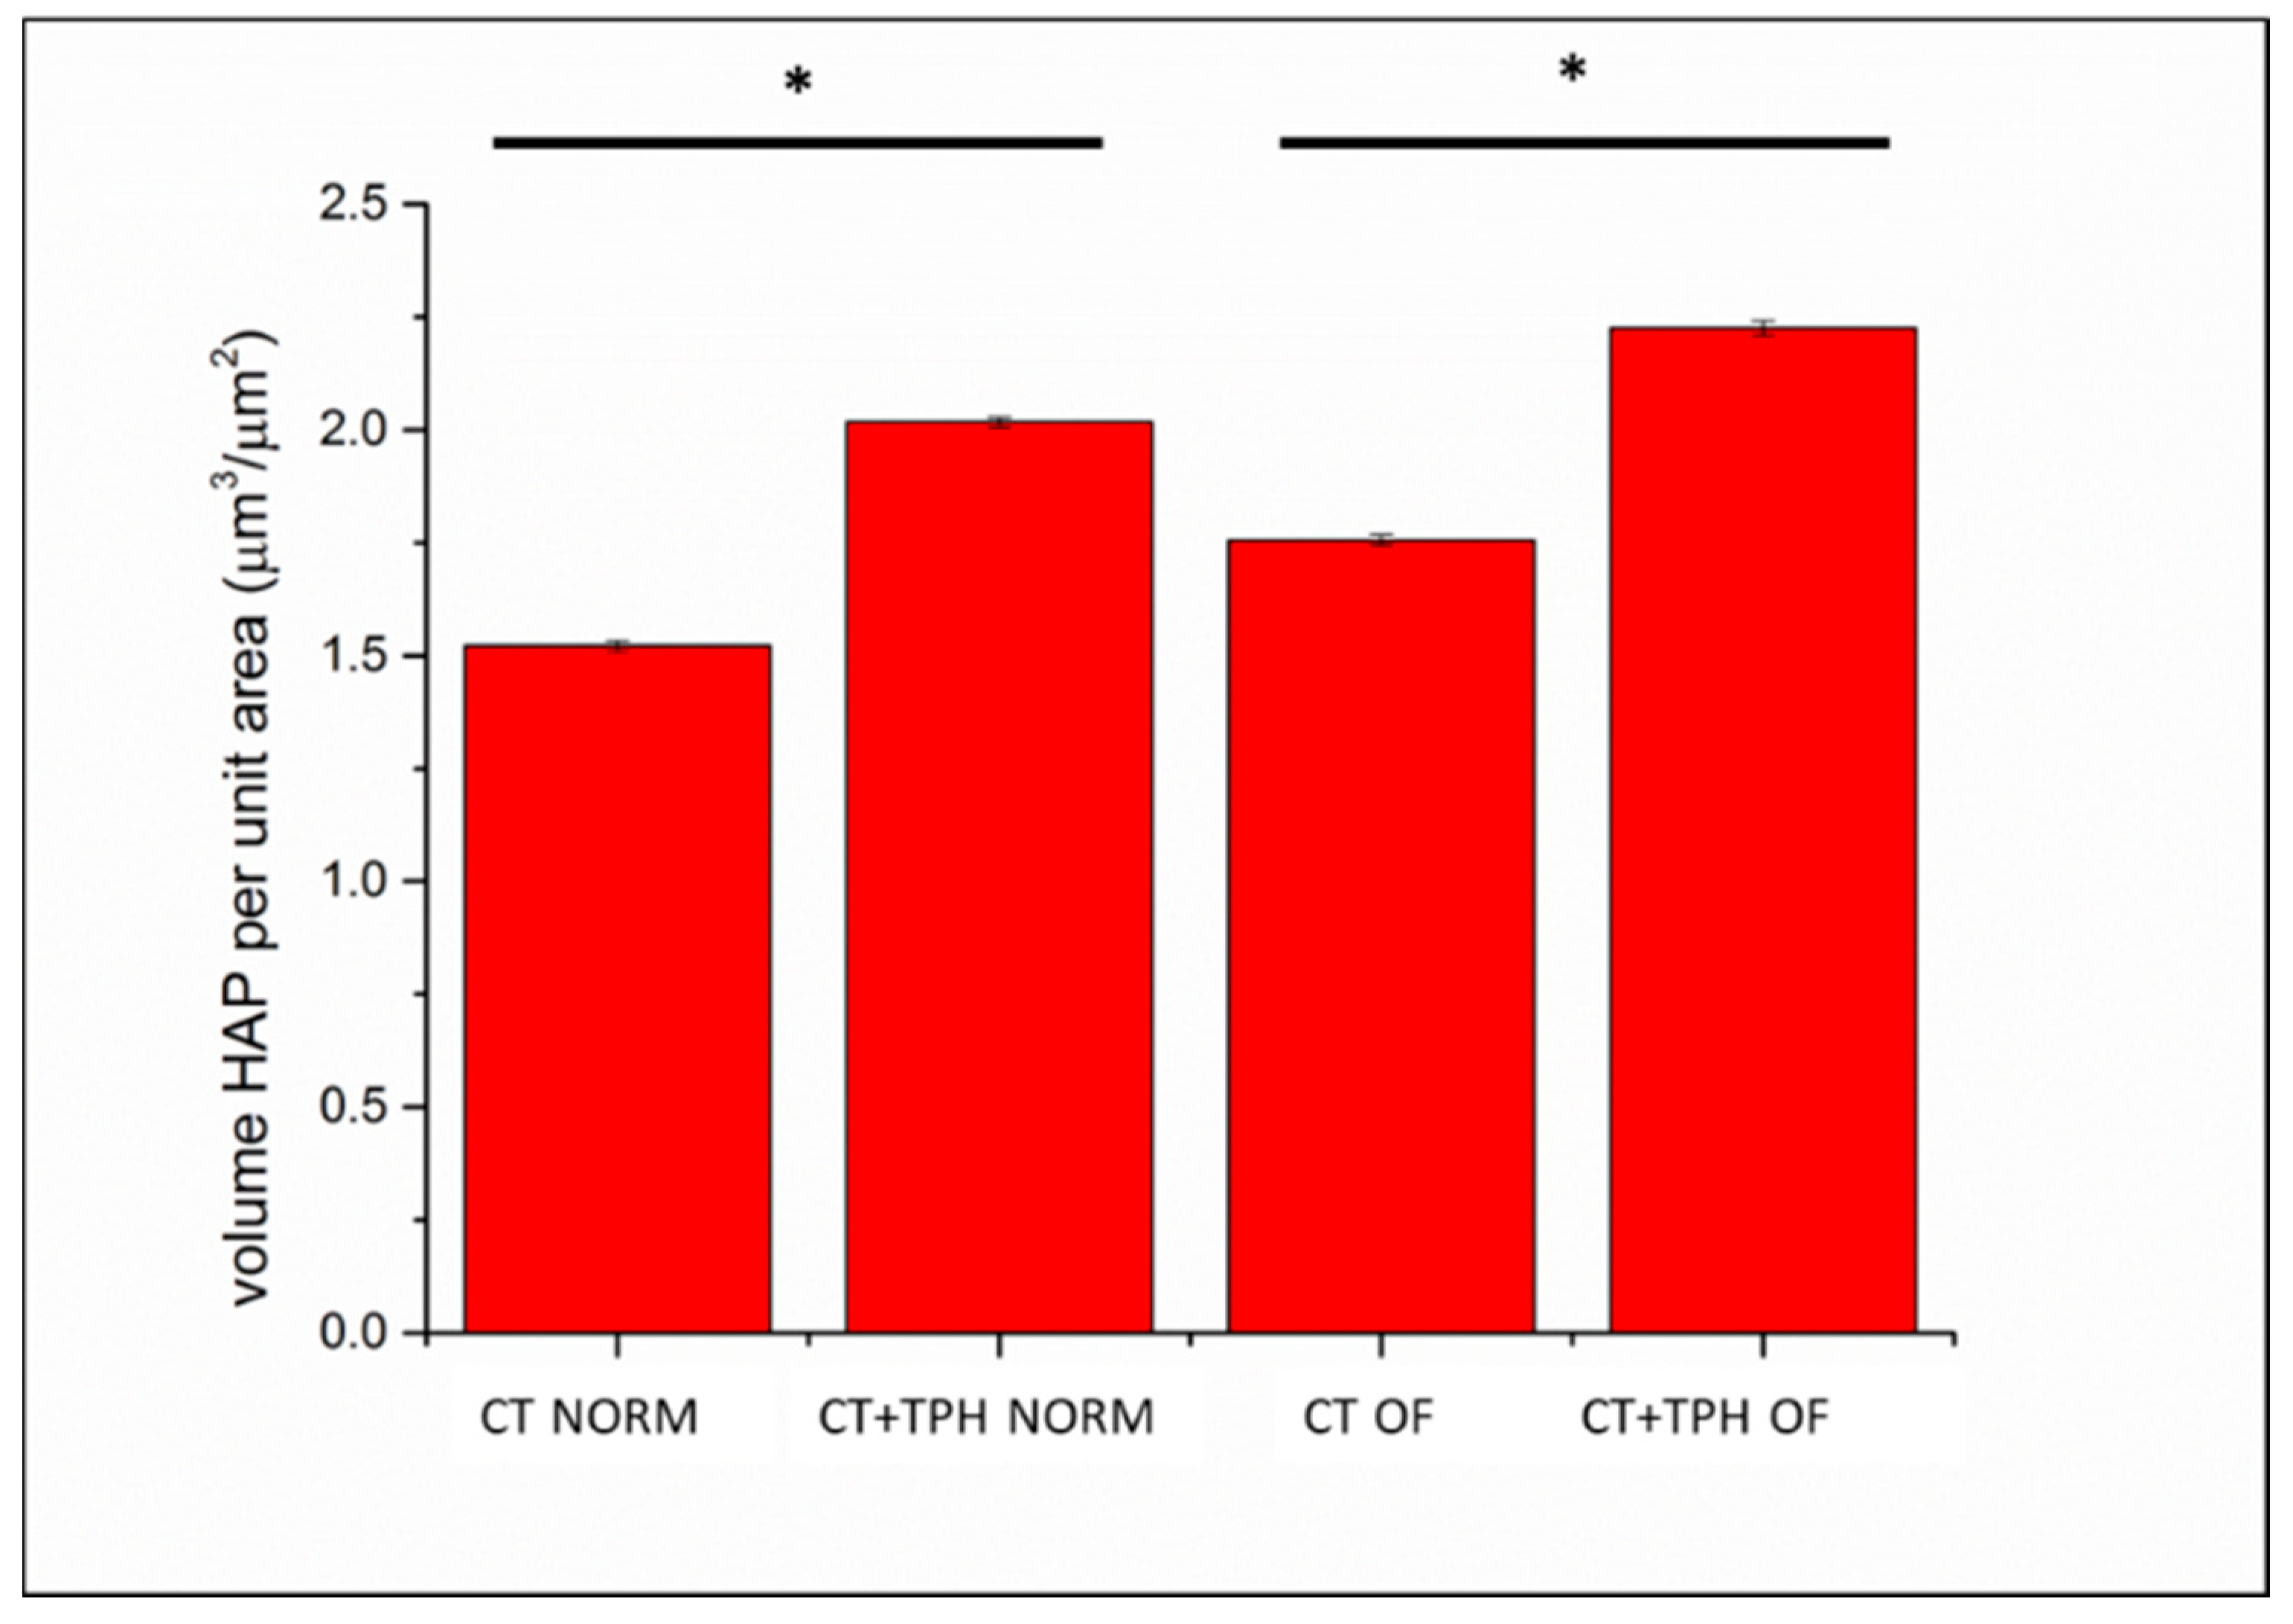
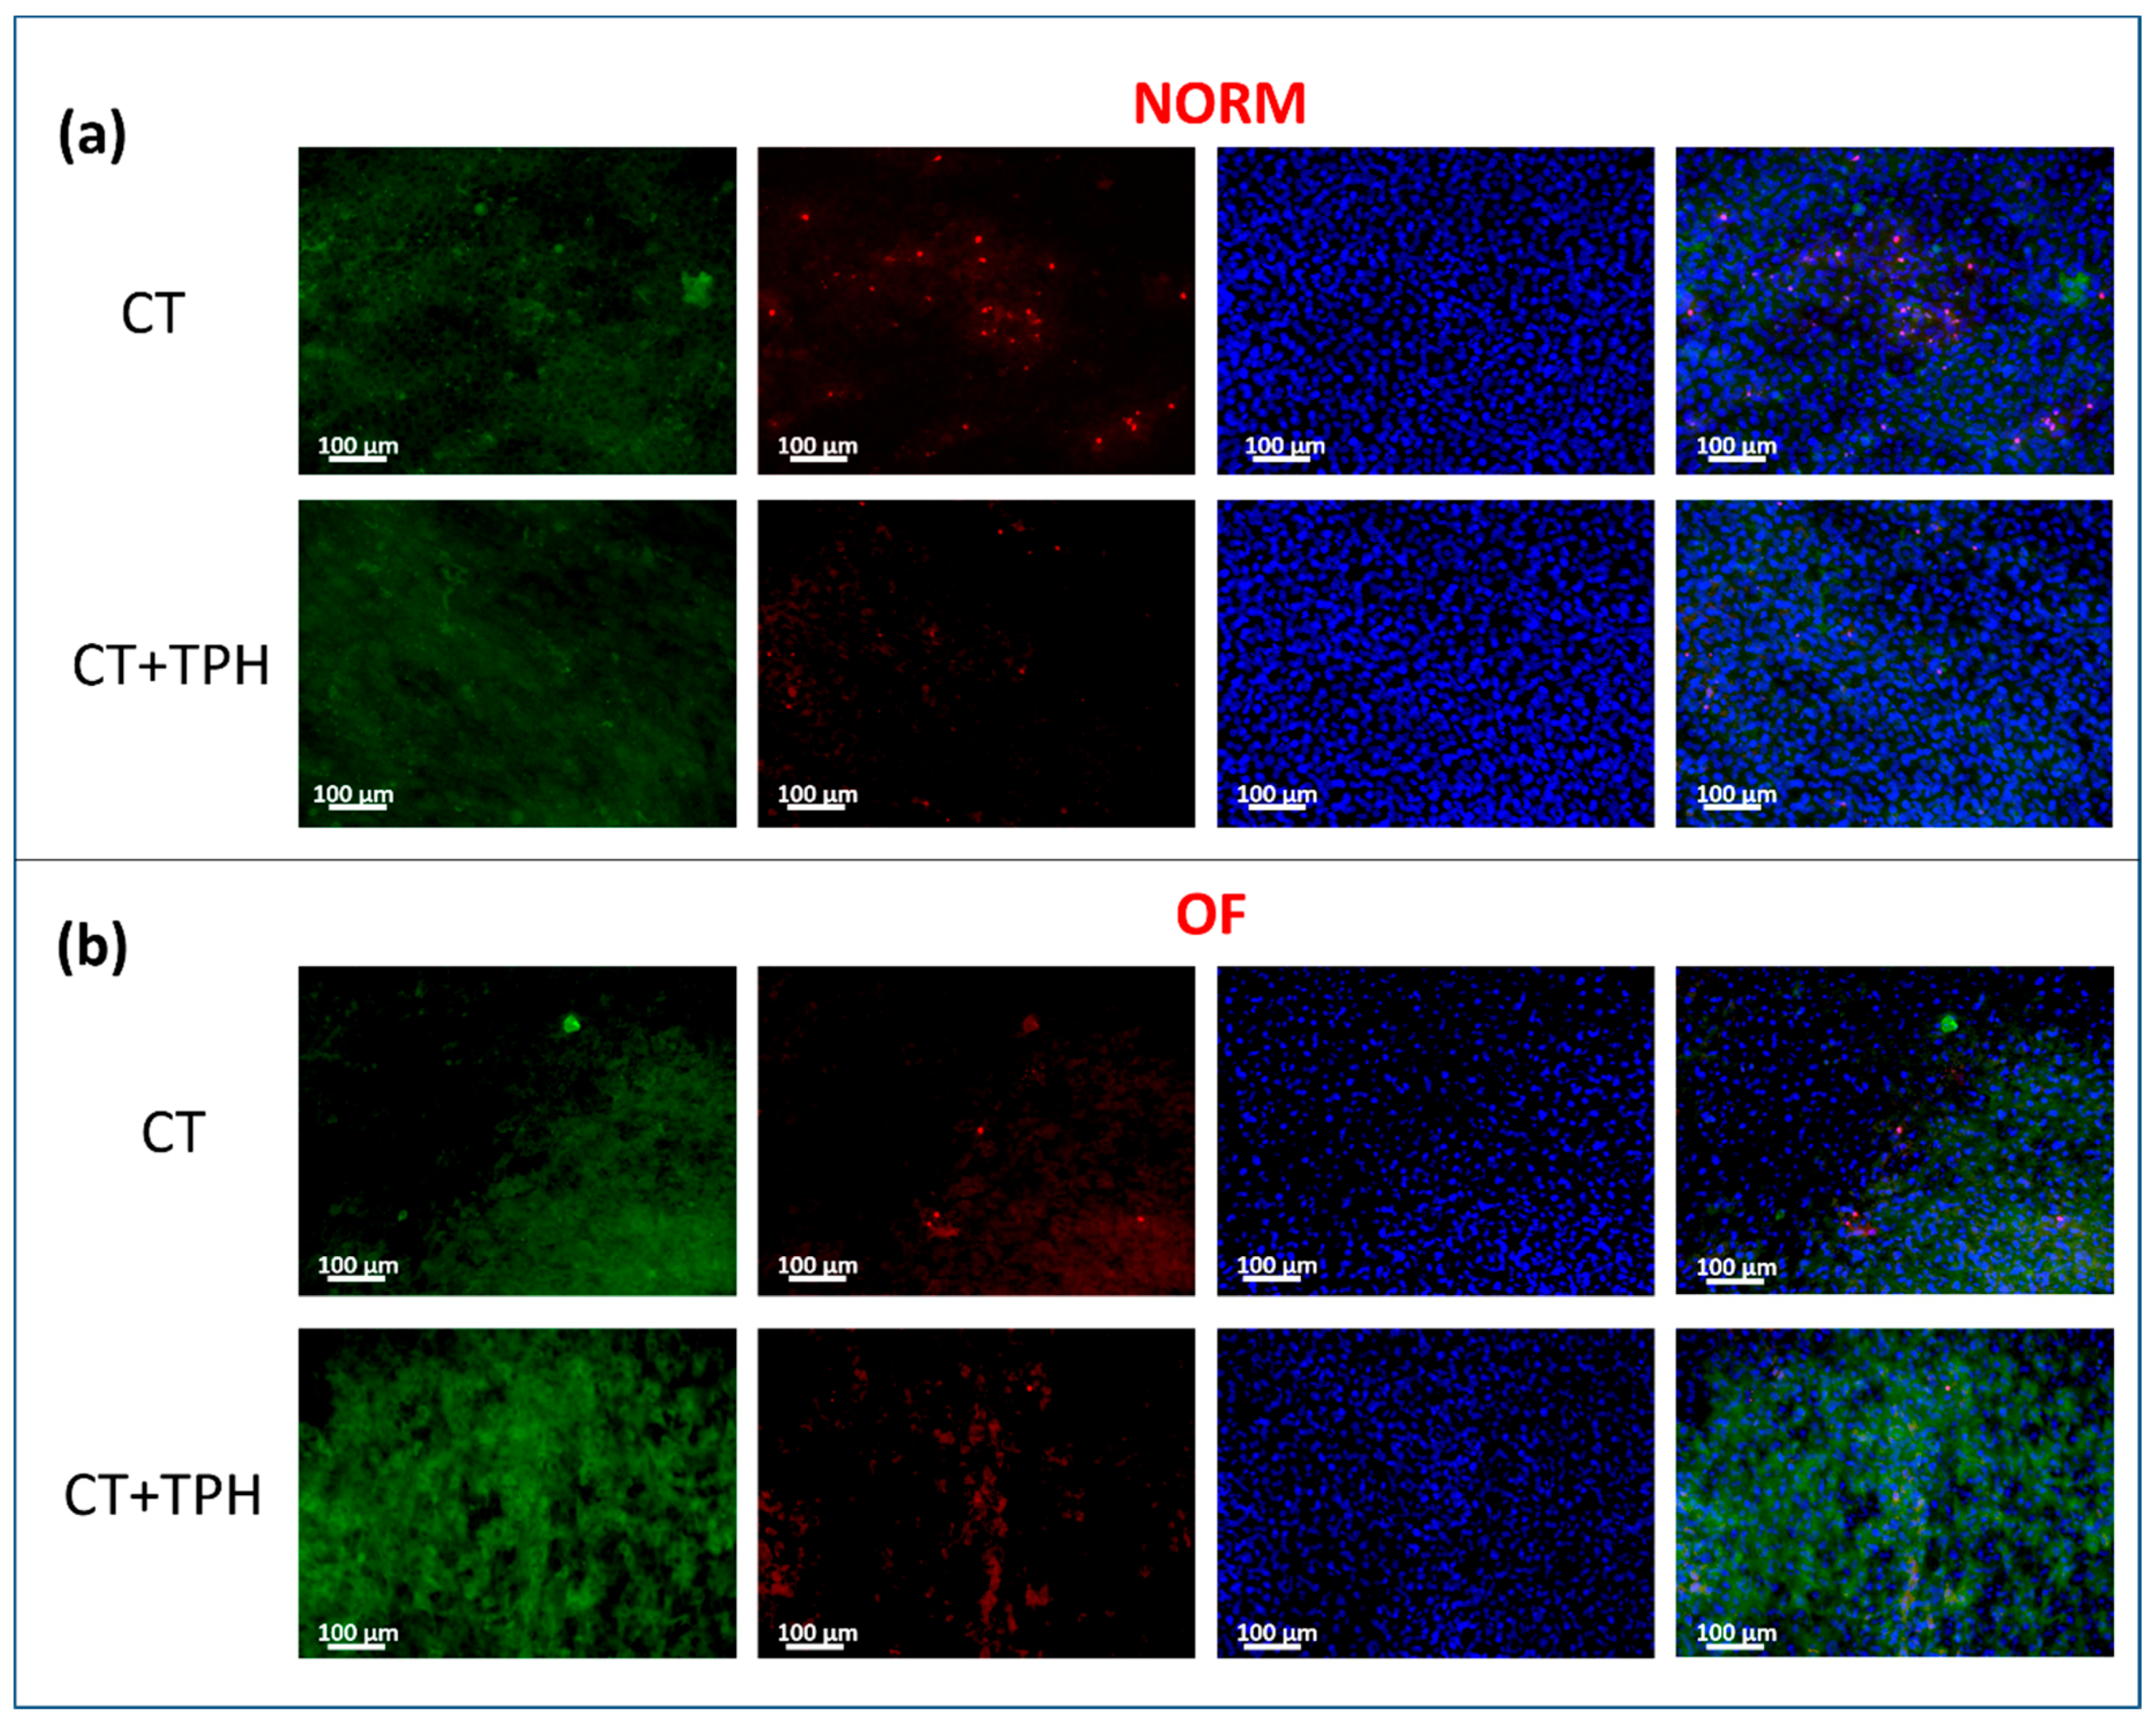
2. Results
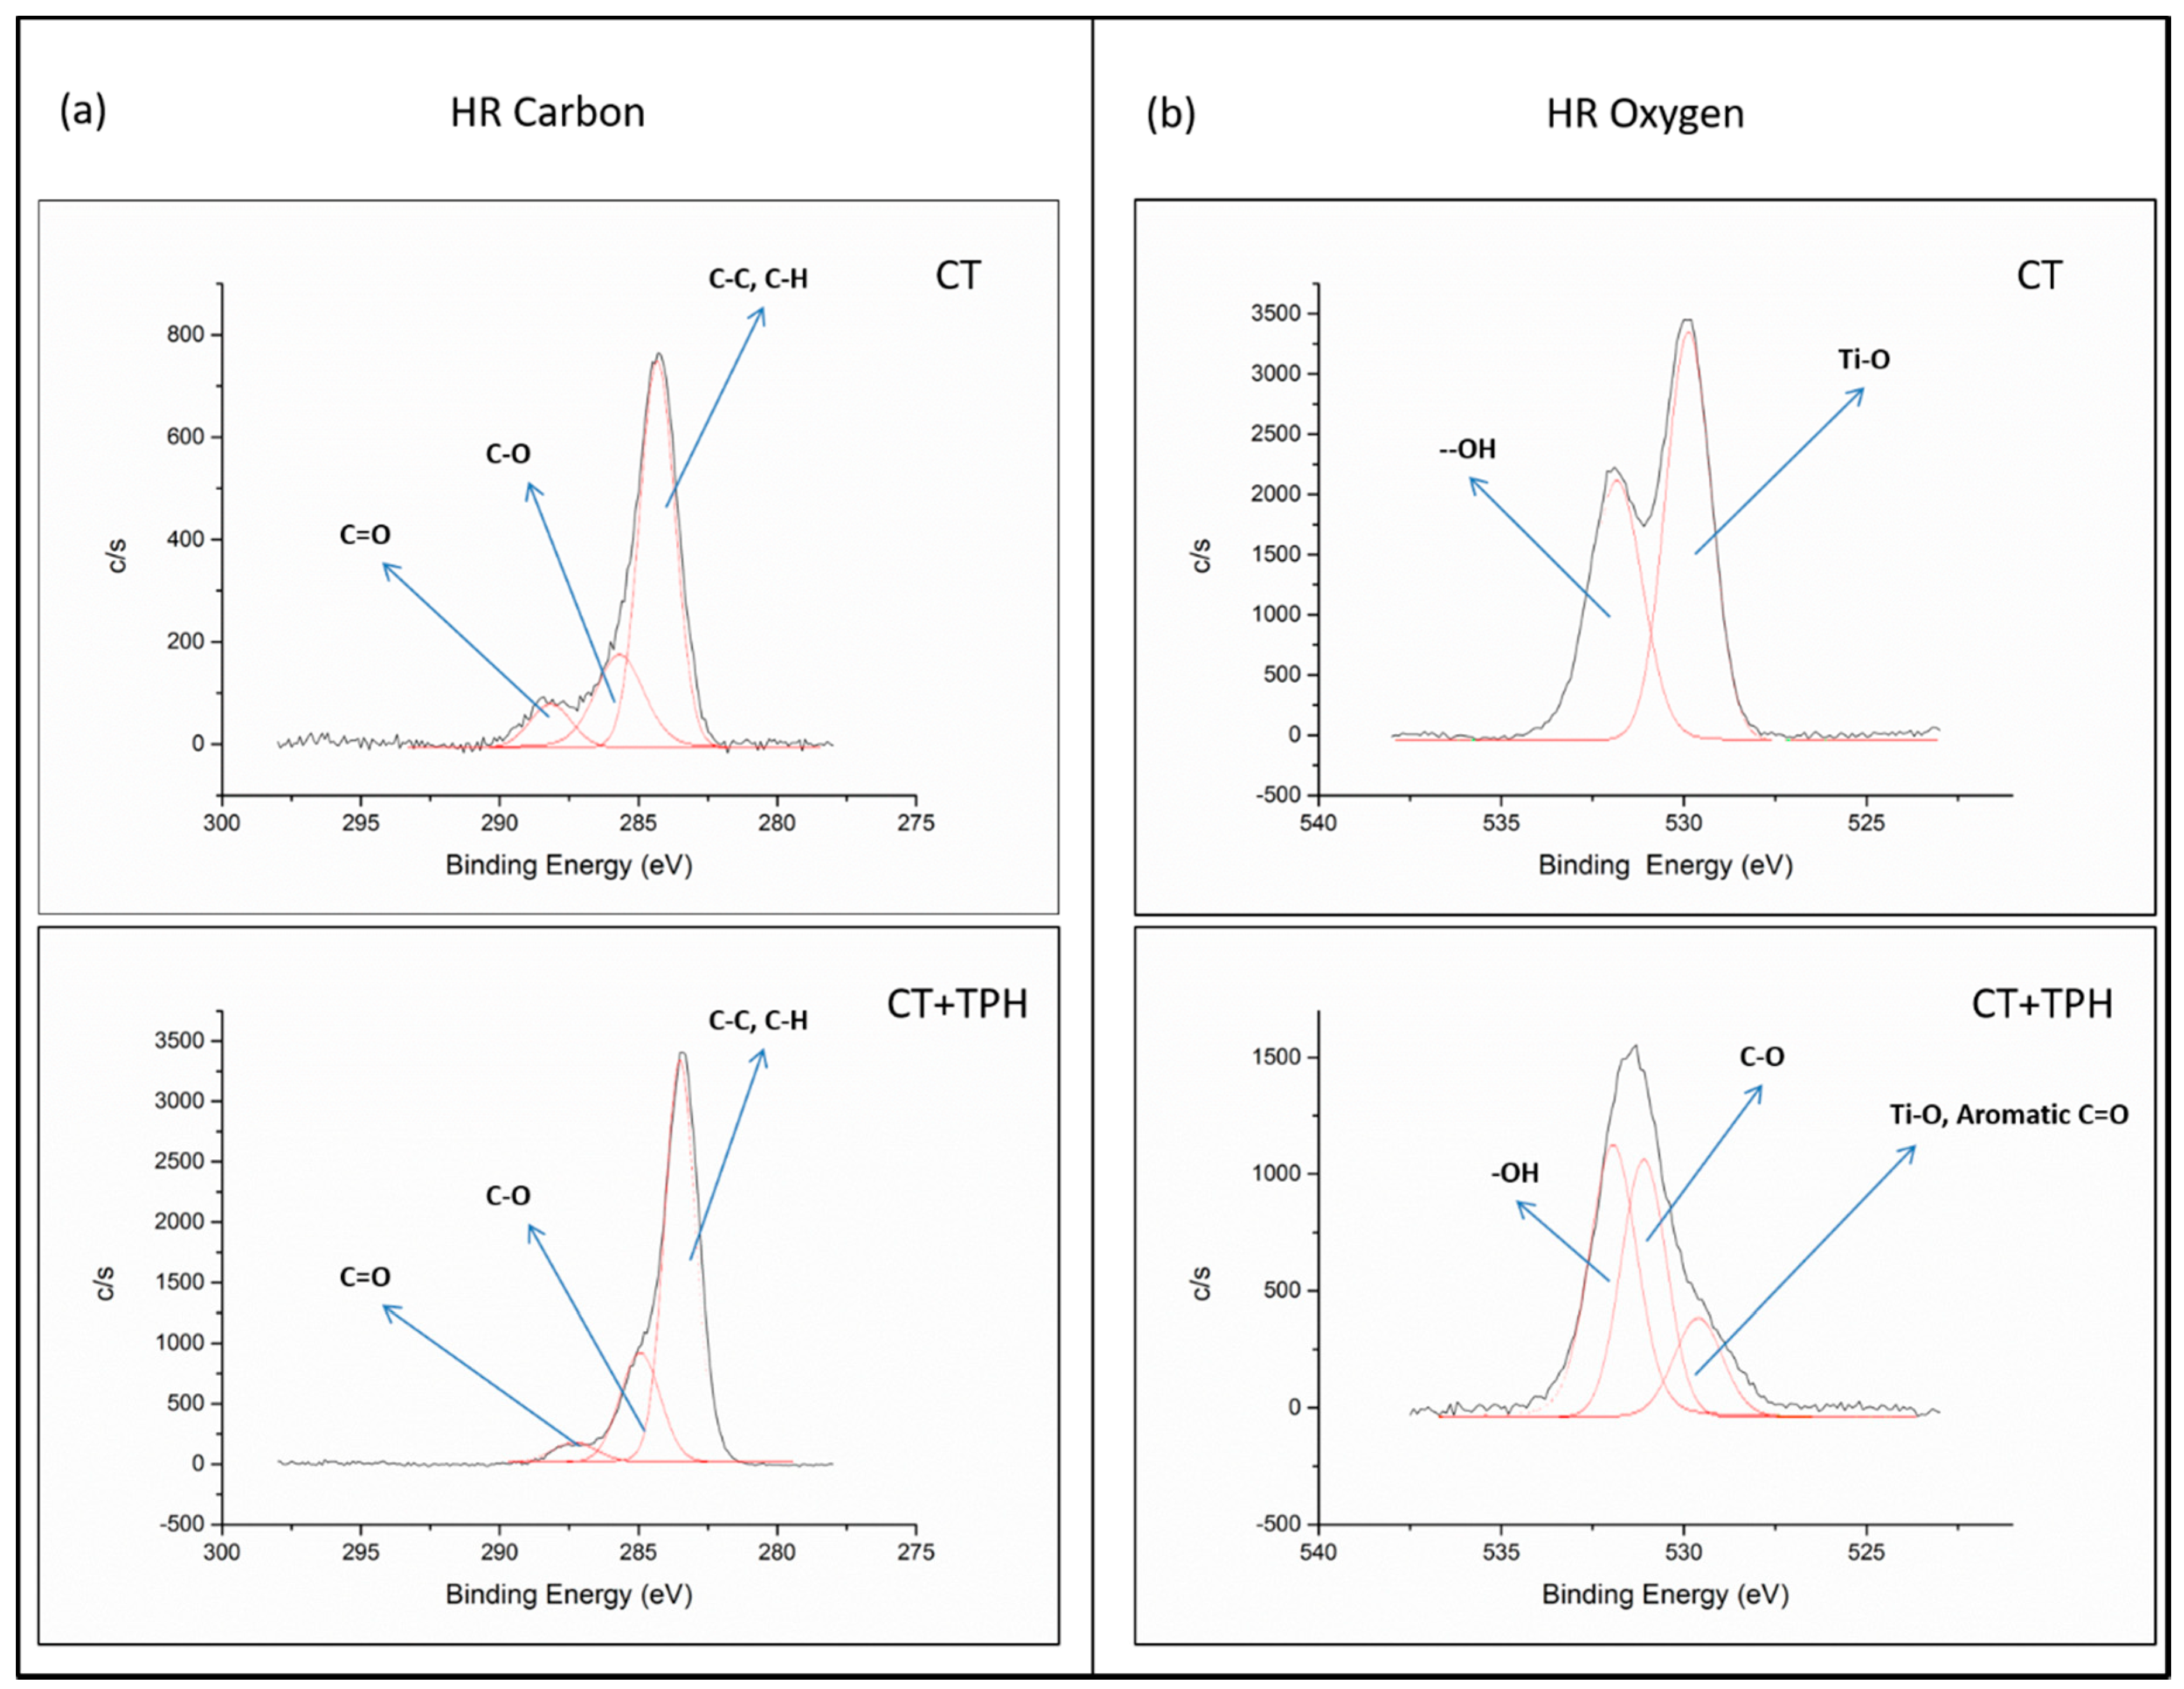
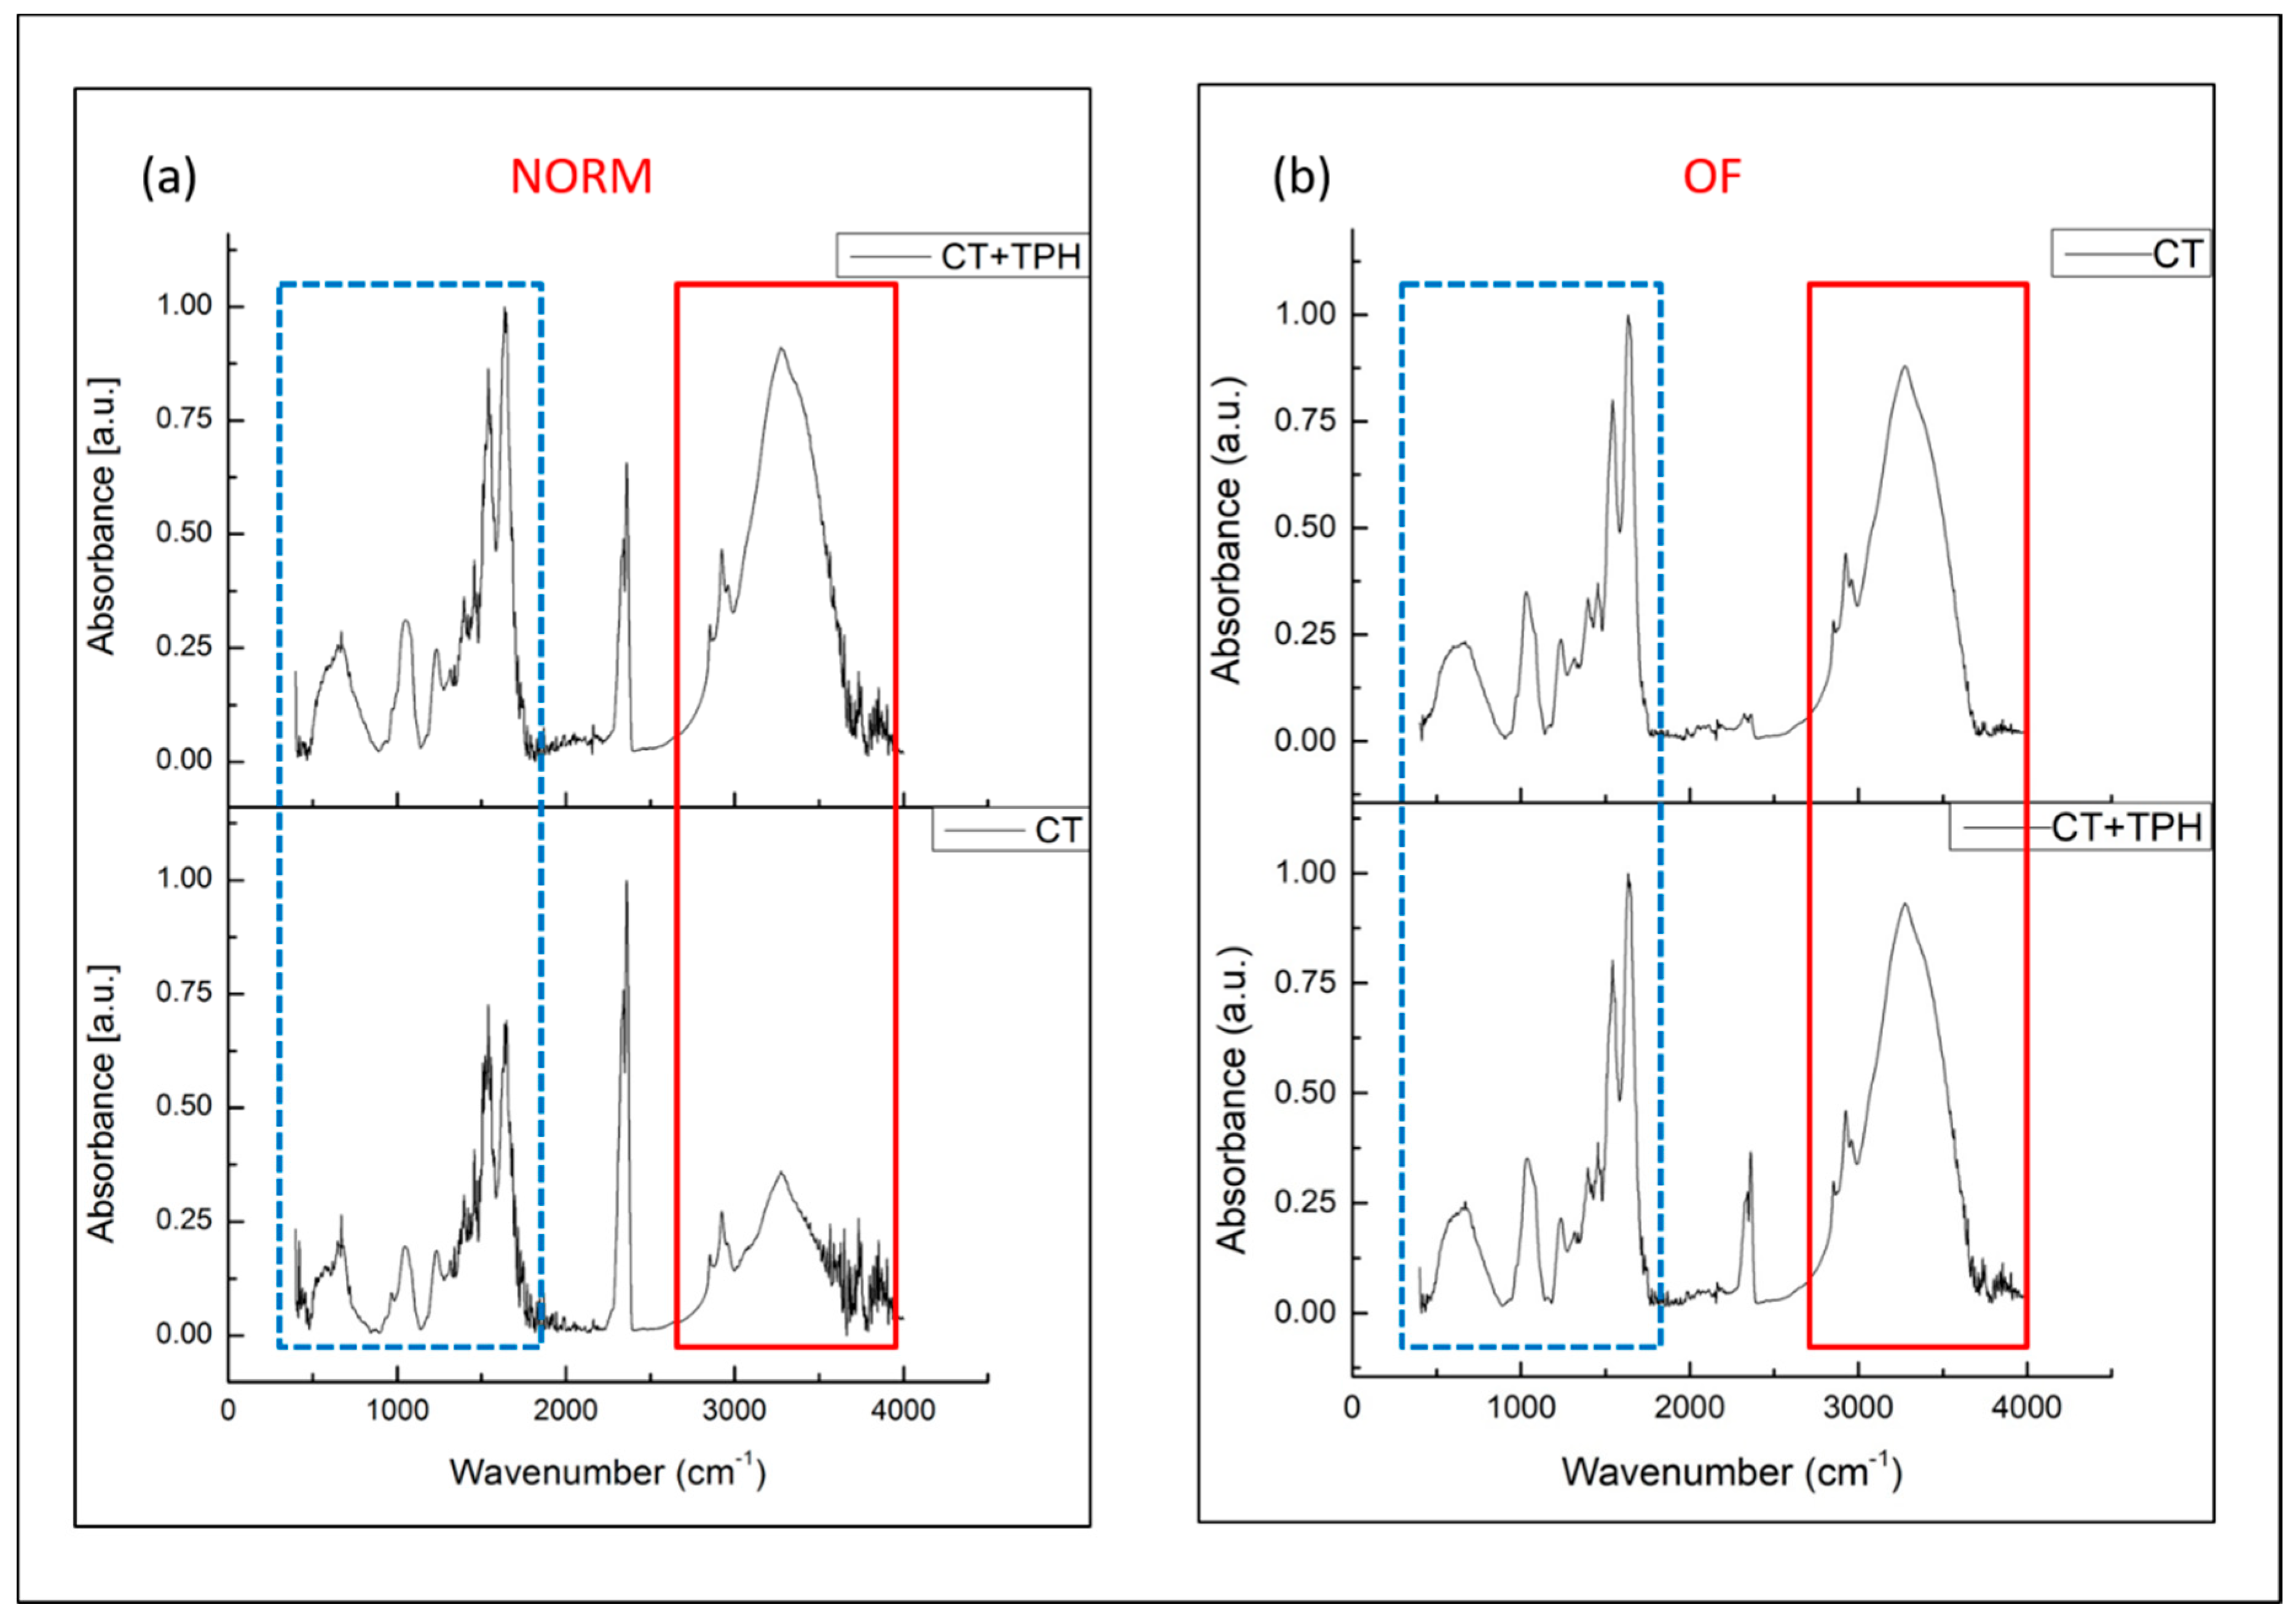
2.1. Detection of Polyphenols
2.2. Cell Culture Characterization
3. Discussion
3.1. Detection of Polyphenols
3.2. Cell Culture Characterization
4. Materials and Methods
4.1. Polyphenols Extraction
4.2. Surface Functionalization
4.3. Detection of the Polyphenols
4.4. Cell Culture
4.5. Cell Culture Characterization
5. Conclusions
Author Contributions
Funding
Conflicts of Interest
References
- Chen, D.I.; Dou, Q.P. Tea polyphenols and their roles in cancer prevention and chemotherapy. Int. J. Mol. Sci. 2008, 9, 1196–1206. [Google Scholar] [CrossRef] [PubMed]
- Ferruzzi, M.G. The influence of beverage composition on delivery of phenolic compounds from coffee and tea. Physiol. Behav. 2010, 100, 33–41. [Google Scholar] [CrossRef] [PubMed]
- Rusak, G.; Komes, D.; Likić, S.; Horžić, D.; Kovač, M. Phenolic content and antioxidative capacity of green and white tea extracts depending on extraction conditions and the solvent used. Food Chem. 2008, 110, 852–858. [Google Scholar] [CrossRef] [PubMed]
- Carloni, P.; Tiano, L.; Padella, L.; Bacchetti, T.; Customu, C.; Kay, A.; Damiani, E. Antioxidant activity of white, green and black tea obtained from the same tea cultivar. Food Res. Int. 2013, 53, 900–908. [Google Scholar] [CrossRef]
- Bancirova, M. Comparison of the antioxidant capacity and the antimicrobial activity of black and green tea. Food Res. Int. 2010, 43, 1379–1382. [Google Scholar] [CrossRef]
- Srivastava, S.; Bankar, R.; Roy, P. Assessment of the role of flavonoids for inducing osteoblast differentiation in isolated mouse bone marrow derived mesenchymal stem cells. Phytomedicine 2013, 20, 683–690. [Google Scholar] [CrossRef] [PubMed]
- Vester, H.; Holzer, N.; Neumaier, M.; Lilianna, S.; Nüssler, A.K.; Seeliger, C. Green Tea Extract (GTE) improves differentiation in human osteoblasts during oxidative stress. J. Inflamm. 2014, 11, 15–20. [Google Scholar] [CrossRef] [PubMed]
- Scalbert, A.; Morand, C.; Manach, C.; Rémésy, C. Absorption and metabolism of polyphenols in the gut and impact on health. Biomed. Pharmacother. 2002, 56, 276–282. [Google Scholar] [CrossRef]
- Correa-Betanzo, J.; Allen-Vercoe, E.; McDonald, J.; Schroeter, K.; Corredig, M.; Paliyath, G. Stability and biological activity of wild blueberry (Vaccinium angustifolium) polyphenols during simulated in vitro gastrointestinal digestion. Food Chem. 2014, 165, 522–531. [Google Scholar] [CrossRef] [PubMed]
- Galić, A.; Dragović-Uzelac, V.; Levaj, B.; Bursać Kovačević, D.; Pliestić, S.; Arnautović, S. The polyphenols stability, enzyme activity and physico-chemical parameters during producing wild elderberry concentrated juice. Agric. Conspec. Sci. 2009, 74, 181–186. [Google Scholar]
- Kuhnle, A.R.; Bremner, G.; Hubbard, P.; Moore, G.P.; Rice-Evans, C.A. The metabolic fate of dietary polyphenols in humans. Free Radic. Biolog. Med. 2002, 33, 220–235. [Google Scholar]
- Sileika, T.S.; Barrett, D.G.; Zhang, R.; Lau, K.H.A.; Messersmith, P.B. Colorless multifunctional coatings inspired by polyphenols found in tea, chocolate, and wine. Angew. Chem. Int. Ed. Engl. 2013, 125, 10966–10970. [Google Scholar] [CrossRef]
- Berlier, G.; Gastaldi, L.; Sapino, S.; Miletto, I.; Bottinelli, E.; Chirio, D.; Ugazio, E. MCM-41 as a useful vector for rutin topical formulations: Synthesis, characterization and testing. Int. J. Pharm. 2013, 457, 177–186. [Google Scholar] [CrossRef] [PubMed]
- Wang, K.; Wu, Y.; Li, H.; Li, M.; Zhang, D.; Feng, H.; Fan, H. Dual-functionalization based on combination of quercetin compound and rare earth nanoparticle. J. Rare Earths 2013, 31, 709–714. [Google Scholar] [CrossRef]
- Mohanty, R.; Thennarasu, S.; Mandal, A.B. Resveratrol stabilized gold nanoparticles enable surface loading of doxorubicin and anticancer activity. Colloids. Sur. B Biointerfaces 2014, 114, 138–143. [Google Scholar] [CrossRef] [PubMed]
- Saikia, J.P.; Konwarh, R.; Konwar, B.K.; Karak, N. Isolation and immobilization of Aroid polyphenol on magnetic nanoparticles: Enhancement of potency on surface immobilization. Colloids. Sur. B Biointerfaces 2013, 102, 450–456. [Google Scholar] [CrossRef] [PubMed]
- Džunuzović, E.S.; Džunuzović, J.V.; Marinković, A.D.; Marinović-Cincović, M.T.; Jeremić, K.B.; Nedeljković, J.M. Influence of surface modified TiO2 nanoparticles by gallates on the properties of PMMA/TiO2 nanocomposites. Eur. Polym. J. 2012, 48, 1385–1393. [Google Scholar] [CrossRef]
- Gurzawska, K.; Svava, R.; Yihua, Y.; Haugshøj, K.B.; Dirscherl, K.; Levery, S.B.; Jørgensen, N.R. Osteoblastic response to pectin nanocoating on titanium surfaces. Mater. Sci. Eng. C Mater. Biol. Appl. 2014, 43, 117–125. [Google Scholar] [CrossRef] [PubMed]
- Mohan, L.; Anandan, C.; Rajendran, N. Drug release characteristics of quercetin-loaded TiO2 nanotubes coated with chitosan. Int. J. Biol. Macromol. 2016, 93, 1633–1638. [Google Scholar] [CrossRef] [PubMed]
- Erakovic, S.; Jankovic, A.; Tsui, G.C.; Tang, C.Y.; Miskovic-Stankovic, V.; Stevanovic, T. Novel bioactive antimicrobial lignin containing coatings on titanium obtained by electrophoretic deposition. Int. J. Mol. Sci. 2014, 15, 12294–12322. [Google Scholar] [CrossRef] [PubMed]
- Córdoba, A.; Satué, M.; Gómez-Florit, M.; Monjo, M.; Morey, J.M.R. Flavonoid coated Titanium surfaces for Bioactive Bone implants. Stem Cell Transl. Investig. 2015, 2. [Google Scholar] [CrossRef]
- Cazzola, M.; Vernè, E.; Cochis, A.; Sorrentino, R.; Azzimonti, B.; Prenesti, E.; Ferraris, S. Bioactive glasses functionalized with polyphenols: In vitro interactions with healthy and cancerous osteoblast cells. J. Mater. Sci. 2017, 52, 9211–9223. [Google Scholar] [CrossRef]
- Cazzola, M.; Corazzari, I.; Prenesti, E.; Bertone, E.; Vernè, E.; Ferraris, S. Bioactive glass coupling with natural polyphenols: Surface modification, bioactivity and anti-oxidant ability. Appl. Sur. Sci. 2016, 367, 237–248. [Google Scholar] [CrossRef]
- Zhang, X.; Ferraris, S.; Prenesti, E.; Verné, E. Surface functionalization of bioactive glasses with natural molecules of biological significance, part II: Grafting of polyphenols extracted from grape skin. Appl. Sur. Sci. 2013, 287, 341–348. [Google Scholar] [CrossRef]
- Zhang, X.; Ferraris, S.; Prenesti, E.; Verné, E. Surface functionalization of bioactive glasses with natural molecules of biological significance, Part I: Gallic acid as model molecule. Appl. Surf. Sci. 2013, 287, 329–340. [Google Scholar] [CrossRef]
- Ferraris, S.; Zhang, X.; Prenesti, E.; Corazzari, I.; Turci, F.; Tomatis, M.; Vernè, E. Gallic acid grafting to a ferrimagnetic bioactive glass-ceramic. J. Non. Cryst. Solids 2016, 432, 167–175. [Google Scholar] [CrossRef]
- Tolga Suer, T.B.; Yaman, Z.; Buyuksarac, B. Correlation of Fractal Dimension Values with Implant Insertion Torque and Resonance Frequency Values at Implant Recipient Sites. Int. J. Oral. Maxillofac. Implants 2016, 31, 55–62. [Google Scholar] [CrossRef] [PubMed]
- Suer, B.T.; Kocyigit, I.D.; Kaman, S.; Tuz, H.H.; Tekin, U.; Atil, F. Biomechanical evaluation of a new design titanium miniplate for the treatment of mandibular angle fractures. Int. J. Oral. Maxillofac. Surg. 2014, 43, 841–845. [Google Scholar] [CrossRef] [PubMed]
- Scribante, A.; Montasser, M.A.; Radwan, E.S.; Bernardinelli, L.; Alcozer, R.; Gandini, P.; Sfondrini, M.F. Reliability of Orthodontic Miniscrews: Bending and Maximum Load of Different Ti-6Al-4V Titanium and Stainless Steel Temporary Anchorage Devices (TADs). Materials 2018, 11, 1138. [Google Scholar] [CrossRef] [PubMed]
- Oldani, C.; Dominguez, A. Titanium as a Biomaterial for Implants. In Recent Advances in Arthroplasty; InTech: Vienna, Austria, 2012; Volume 23, pp. 2–5. [Google Scholar]
- Long, M.; Rac, H.J. Titanium alloys in total joint replacement—A materials science perspective. Biomaterials 1998, 19, 1621–1639. [Google Scholar] [CrossRef]
- Ferraris, S.; Spriano, S.; Bianchi, C.L.; Cassinelli, C.; Vernè, E. Surface modification of Ti-6Al-4 V alloy for biomineralization and specific biological response: Part II, alkaline phosphatase grafting. J. Mater. Sci. Mater. Med. 2011, 22, 1835–1842. [Google Scholar] [CrossRef] [PubMed]
- Ferraris, S.; Spriano, S.; Pan, G.; Venturello, A.; Bianchi, C.L.; Chiesa, R.; Faga, M.G.; Maina, G.; Verne, E. Surface modification of Ti–6Al–4V alloy for biomineralization and specific biological response: Part, I., inorganic modification. J. Mater. Sci. Mater. Med. 2011, 22, 533–545. [Google Scholar] [CrossRef] [PubMed]
- Textor, M.; Sittig, C.; Frauchiger, V.; Tosatti, S.; Brunette, D.M. Properties and biological significance of natural oxide films on titanium and its alloys. In Titanium in Medicine; Springer: Berlin/Heidelberg, Germany, 2001; Volume 30, pp. 171–230. [Google Scholar]
- Morra, M.; Cassinelli, C.; Bruzzone, G.; Carpi, A.; Santi, G.D.; Giardino, R.; Fini, M. Surface chemistry effects of topographic modification of titanium dental implant surfaces: 1. Surface analysis. Int. J. Oral. Maxillofac. Implants 2003, 18, 40–45. [Google Scholar] [PubMed]
- Qiao, G.; Su, J.; He, M. Effect of (−)-epigallocatechin gallate on electrochemical behavior and surface fi lm composition of Co-Cr alloy used in dental restorations. Dent. Mater. J. 2012, 31, 564–574. [Google Scholar] [CrossRef] [PubMed]
- Moulder, J.F.; Stickle, W.F.; Sobol, P.E.; Bomben, K.D. Handbook of X-ray Photoelectron Spectroscopy: A reference Book of Standard Spectra for Identification and Interpretation of XPS Data; Physical Electronics: Eden Prairie, MN, USA, 1992; pp. 261–265. [Google Scholar]
- NIST X-ray Photoelectron Spectroscopy Database, NIST Standard Reference Database Number 20; National Institute of Standards and Technology: Gaithersburg, MD, USA, 2000.
- Oxygen 1s for Organic Compounds. Available online: http://www.xpsfitting.com/2013/08/oxygen-1s-for-organic-compounds.html (accessed on 23 July 2017).
- Lee, H.P.; Lin, D.J.; Yeh, M.L. Phenolic modified ceramic coating on biodegradable Mg alloy: The improved corrosion resistance and osteoblast-like cell activity. Materials 2017, 10, 696. [Google Scholar] [CrossRef] [PubMed]
- Movasaghi, Z.; Rehman, S.; ur Rehman, D.I. Fourier transform infrared (FTIR) spectroscopy of biological tissues. Appl. Spectrosc. Rev. 2008, 43, 134–179. [Google Scholar] [CrossRef]
- ur Rehman, I.; Movasaghi, Z.; Rehman, S. Vibrational Spectroscopy for Tissue Analysis; CRC Press: Boca Raton, FL, USA, 2012. [Google Scholar]
- Movasaghi, Z.; Rehman, S.; Rehman, I.U. Raman spectroscopy of biological tissues. Appl. Spectrosc. Rev. 2007, 42, 493–541. [Google Scholar] [CrossRef]
- Pully, V.V. From cells to bone: Raman microspectroscopy of the mineralization of stromal cells. Anal. Chem. 2010, 82, 1844–1850. [Google Scholar] [CrossRef] [PubMed]
- Hashimoto, A.; Chiu, L.D.; Sawada, K.; Ikeuchi, T.; Fujita, K.; Takedachi, M.; Yamagouchi, Y.; Kawata, S.; Murakami, S.; Tamiya, E. In situ Raman imaging of osteoblastic mineralization. J. Raman Spectrosc. 2014, 45, 157–161. [Google Scholar] [CrossRef]
- Pezzotti, G.; Zhu, W.; Boffelli, M.; Adachi, T.; Ichioka, H.; Yamamoto, T.; Marunaka, Y.; Kanamura, N. Vibrational algorithms for quantitative crystallographic analyses of hydroxyapatite-based biomaterials: I., theoretical foundations. Anal. Bioanal. Chem. 2015, 407, 3325–3342. [Google Scholar] [CrossRef] [PubMed]
- Cazzola, M. Multifunctional surfaces for implants in bone contact applications. Ph.D. Thesis, Politecnico di Torino, Torino, Italy, March 2018. Available online: https://iris.polito.it/handle/11583/2704549#.W19xQFAzbIU (accessed on 30 July 2018).
- Ejima, H.; Richardson, J.J.; Liang, K.; Best, J.P.; van Koeverden, M.P.; Such, G.K.; Cui, J.; Caruso, F. One-step assembly of coordination complexes for versatile film and particle engineering. Science 2013, 341, 154–157. [Google Scholar] [CrossRef] [PubMed]
- Boskey, A.; Camacho, N.P. FT-IR imaging of native and tissue-engineered bone and cartilage. Biomaterials 2007, 28, 2465–2478. [Google Scholar] [CrossRef] [PubMed]
- Woess, C.; Unterberger, S.H.; Roider, C.; Ritsch-Marte, M.; Pemberger, N.; Cemper-Kiesslich, J.; Pallua, J.D. Assessing various Infrared (IR) microscopic imaging techniques for post-mortem interval evaluation of human skeletal remains. PLoS ONE 2017, 12, e0174552. [Google Scholar] [CrossRef] [PubMed]
- Koutsopoulos, S. Synthesis and characterization of hydroxyapatite crystals: A review study on the analytical methods. J. Biomed. Mater. Res. 2002, 624, 600–612. [Google Scholar]
- Berzina-Cimdina, L.; Borodajenko, N. Research of calcium phosphates using Fourier transform infrared spectroscopy. In Infrared Spectroscopy-Materials Science Engineering and Technology; InTech: Vienna, Austria, 2012. [Google Scholar]
- Al Mamun, M.A.; Hosen, M.J.; Islam, K.; Khatun, A.; Alam, M.M.; Al-Bari, M.A.A. Tridax procumbens flavonoids promote osteoblast differentiation and bone formation. Biol. Res. 2015, 48, 65. [Google Scholar] [CrossRef] [PubMed]
- Léotoing, L.; Davicco, M.J.; Lebecque, P.; Wittrant, Y.; Coxam, V. The flavonoid fisetin promotes osteoblasts differentiation through Runx2 transcriptional activity. Mol. Nutr. Food Res. 2014, 58, 1239–1248. [Google Scholar] [CrossRef] [PubMed]
- James, A.W.; LaChaud, G.; Shen, J.; Asatrian, G.; Nguyen, V.; Zhang, X.; Soo, C. A review of the clinical side effects of bone morphogenetic protein-2. Tissue Eng. Part. B Rev. 2016, 22, 284–297. [Google Scholar] [CrossRef] [PubMed]
- Spriano, S.; Vernè, E.; Ferraris, S. Multifunctional Titanium Surfaces for Bone Integration. European Patent 2214732, 11 August 2010. [Google Scholar]
- Kokubo, T. Bioactive glass ceramics: Properties and applications. Biomaterials 1991, 12, 155–163. [Google Scholar] [CrossRef]
- Singleton, V.L.; Orthofer, R.; Lamuela-Raventós, R.M. Analysis of total phenols and other oxidation substrates and antioxidants by means of folin-ciocalteu reagent. In Methods in Enzymology; Academic Press: Cambridge, UK, 1999; Volume 299, pp. 152–178. [Google Scholar]
- Singh, S.R. Somatic Stem Cells: Methods and Protocols; Humana Press: Clifton, NJ, USA, 2012. [Google Scholar]
- Köck, E.M.; Kogler, M.; Bielz, T.; Klötzer, B.; Penner, S. In situ FT-IR spectroscopic study of CO2 and CO adsorption on Y2O3, ZrO2, and yttria-stabilized ZrO2. J. Phys. Chem. C Nanomater. Interfaces 2013, 117, 17666–17673. [Google Scholar] [CrossRef] [PubMed]


| Elements [% at] | Samples | |
|---|---|---|
| CT | CT+TPH | |
| C | 20.7 | 76.6 |
| O | 60.7 | 20.3 |
| P | - | 0.9 |
| Ca | - | 0.5 |
| N | 2.3 | 0.8 |
| F | - | 0.5 |
| Ti | 16.3 | 0.4 |
© 2018 by the authors. Licensee MDPI, Basel, Switzerland. This article is an open access article distributed under the terms and conditions of the Creative Commons Attribution (CC BY) license (http://creativecommons.org/licenses/by/4.0/).
Share and Cite
Cazzola, M.; Ferraris, S.; Boschetto, F.; Rondinella, A.; Marin, E.; Zhu, W.; Pezzotti, G.; Vernè, E.; Spriano, S. Green Tea Polyphenols Coupled with a Bioactive Titanium Alloy Surface: In Vitro Characterization of Osteoinductive Behavior through a KUSA A1 Cell Study. Int. J. Mol. Sci. 2018, 19, 2255. https://doi.org/10.3390/ijms19082255
Cazzola M, Ferraris S, Boschetto F, Rondinella A, Marin E, Zhu W, Pezzotti G, Vernè E, Spriano S. Green Tea Polyphenols Coupled with a Bioactive Titanium Alloy Surface: In Vitro Characterization of Osteoinductive Behavior through a KUSA A1 Cell Study. International Journal of Molecular Sciences. 2018; 19(8):2255. https://doi.org/10.3390/ijms19082255
Chicago/Turabian StyleCazzola, Martina, Sara Ferraris, Francesco Boschetto, Alfredo Rondinella, Elia Marin, Wenliang Zhu, Giuseppe Pezzotti, Enrica Vernè, and Silvia Spriano. 2018. "Green Tea Polyphenols Coupled with a Bioactive Titanium Alloy Surface: In Vitro Characterization of Osteoinductive Behavior through a KUSA A1 Cell Study" International Journal of Molecular Sciences 19, no. 8: 2255. https://doi.org/10.3390/ijms19082255
APA StyleCazzola, M., Ferraris, S., Boschetto, F., Rondinella, A., Marin, E., Zhu, W., Pezzotti, G., Vernè, E., & Spriano, S. (2018). Green Tea Polyphenols Coupled with a Bioactive Titanium Alloy Surface: In Vitro Characterization of Osteoinductive Behavior through a KUSA A1 Cell Study. International Journal of Molecular Sciences, 19(8), 2255. https://doi.org/10.3390/ijms19082255