Article

Comparative Proteomic Analysis of Coregulation of CIPK14 and WHIRLY1/3 Mediated Pale Yellowing of Leaves in Arabidopsis

Center for Molecular Cell and Systems Biology, Fujian Provincial Key Laboratory of Haixia Applied Plant Systems Biology, College of Life Sciences, Fujian Agriculture and Forestry University, Fuzhou 350002, China
*
Author to whom correspondence should be addressed.
Int. J. Mol. Sci. 2018, 19(8), 2231; https://doi.org/10.3390/ijms19082231
Submission received: 5 July 2018 / Revised: 27 July 2018 / Accepted: 27 July 2018 / Published: 31 July 2018
(This article belongs to the Special Issue Molecular Research in Arabidopsis)

Abstract

:
Pale yellowing of leaf variegation is observed in the mutant Arabidopsis lines Calcineurin B-Like-Interacting Protein Kinase14 (CIPK14) overexpression (oeCIPK14) and double-knockout WHIRLY1/WHIRLY3 (why1/3). Further, the relative distribution of WHIRLY1 (WHY1) protein between plastids and the nucleus is affected by the phosphorylation of WHY1 by CIPK14. To elucidate the coregulation of CIPK14 and WHIRLY1/WHIRLY3-mediated pale yellowing of leaves, a differential proteomic analysis was conducted between the oeCIPK14 variegated (oeCIPK14-var) line, why1/3 variegated (why1/3-var) line, and wild type (WT). More than 800 protein spots were resolved on each gel, and 67 differentially abundant proteins (DAPs) were identified by matrix-assisted laser desorption ionization-time of flight/time of flight mass spectrometry (MALDI-TOF/TOF-MS). Of these 67 proteins, 34 DAPs were in the oeCIPK14-var line and 33 DAPs were in the why1/3-var line compared to the WT. Five overlapping proteins were differentially expressed in both the oeCIPK14-var and why1/3-var lines: ATP-dependent Clp protease proteolytic subunit-related protein 3 (ClpR3), Ribulose bisphosphate carboxylase large chain (RBCL), Beta-amylase 3 (BAM3), Ribosome-recycling factor (RRF), and Ribulose bisphosphate carboxylase small chain (RBCS). Bioinformatics analysis showed that most of the DAPs are involved in photosynthesis, defense and antioxidation pathways, protein metabolism, amino acid metabolism, energy metabolism, malate biosynthesis, lipid metabolism, and transcription. Thus, in the why1/3-var and oeCIPK14-var lines, there was a decrease in the photosystem parameters, including the content of chlorophyll, the photochemical efficiency of photosystem (PS II) (Fv/Fm), and electron transport rates (ETRs), but there was an increase in non-photochemical quenching (NPQ). Both mutants showed high sensitivity to intense light. Based on the annotation of the DAPs from both why1/3-var and oeCIPK14-var lines, we conclude that the CIPK14 phosphorylation-mediated WHY1 deficiency in plastids is related to the impairment of protein metabolism, leading to chloroplast dysfunction.

Graphical Abstract

1. Introduction

Leaf senescence is a complex process that is highly regulated by genetic material, and is induced by internal (such as age and hormones) and external (including multiple biotic and abiotic stresses) factors [1]. Leaf senescence results from the degradation of chlorophyll and various biomacromolecules in plant cells [1] for the remobilization of nutrients to seeds and fruits during the reproductive growth stage [2]. It has been reported that more than 20 transcription factor families are associated with senescence regulation, such as the NAC, WRKY, MYB, C2H2-type zinc finger, and AP2/EREBP protein families. Many members of the NAC and WRKY families have been reported to play a central role in the regulatory network that controls leaf senescence [3,4,5,6,7]. Among the WRKY family, WRKY53 has been shown to act as a key regulator at an early stage of leaf senescence in Arabidopsis [8], and WHIRLY1 has been reported to repress the expression of WRKY53 by binding to the promoter of WRKY53, thus delaying leaf senescence [9].
WHIRLY (WHY) family proteins are located in both the nucleus and organelles, and they perform numerous cellular functions at both sites [10,11]. There are two WHY members (WHY1 and WHY2) in monocotyledonous plants, and three members (WHY1, WHY2, and WHY3) in dicotyledonous plants [12]. A WHY–GFP fusion protein fluorescence assay showed that, in Arabidopsis, WHY1 and WHY3 localized to chloroplasts, and WHY2 localized to mitochondria [10]. An intriguing feature of WHY1’s dual location in plastids and the nucleus of the same cell was demonstrated by an immunogold-labeling assay in barley (Hordeum vulgare) [11]. Plastidial WHY1 translocated from chloroplasts to the nucleus in transplastomic tobacco plants, which synthesized an HA-tagged version of WHY1 in plastids. In the nucleus, the WHY1 protein changes the expression of its target genes [13]. Its dual location and ability to regulate nuclear gene transcription make WHY1 an ideal candidate for studying plastid-to-nucleus retrograde signaling.
WHY proteins were first discovered as nuclear transcriptional activators binding at the elicitor response element in the promoter regions of pathogenesis-related genes in potato (Solanum tuberosum) and Arabidopsis [14,15]. It was later found that these proteins bind to various DNA sequences, including: telomeres [16], a distal element upstream of a kinesin gene [17], the promoter region of the early senescence marker gene WRKY53 (in a development-dependent manner) in Arabidopsis [9], and the promoter region of the senescence-associated gene HvS40, which was induced during natural and stress-related senescence in barley [18]. It has further been proposed that WHY1 binds to both single stranded DNA (ssDNA) and RNA in maize (Zea mays) chloroplasts, where it plays a role in intron splicing [19], and WHY1 is associated with intron-containing RNA in barley chloroplasts [20].
Additionally, in Arabidopsis, plastid-located WHY1 and WHY3 were identified as two novel plastid transcriptionally active chromosome proteins (pTACs) by mass spectrometry (MS) in the transcriptionally active chromosomes of nucleoids [21]. Moreover, both WHY3 and WHY1 were found in a protein complex bound to the promoter of kinesin in Arabidopsis by a pull-down-MS assay [17]. While WHY3 was discovered as a redox-affected protein in the thiol–disulfide redox proteome of the chloroplast [22], WHY1 was proposed to be involved in the perception of redox changes in the photosynthetic apparatus. Thus, the relocation of WHY1 from the chloroplasts to the nucleus may be initiated by the redox state of the photosynthetic electron transport chain [23]. A recent study indicated that WHY1 interacts with light-harvesting protein complex I (LHCA1) and affects the expression of genes encoding photosystem I (PS I) and light-harvesting complexes (LHCIs) [24]. Although most double-knockout WHY1 and WHY3 (why1/3) plants have no apparent phenotype, about 5% of the plants show a variegated phenotype, which is associated with the instability of the plastid genome [25]. Furthermore, triple-mutant why1why3polIb-1 (defective WHY1, WHY3, and chloroplast DNA polymerase 1B (POLIB)) exhibits a significant variegated phenotype and higher plastid genome instability [26]. The why1why3polIb-1 mutant shows lower photosynthetic efficiency and produces more reactive oxygen species (ROS) in the chloroplast, and the elevated ROS level is correlated with an elevated expression of oxidation-related nuclear genes [26]. In barley, WHY1 RNAi knockdown mutants were shown to have more chlorophyll and less sucrose than the wild type [27]. A large number of gene-encoding proteins involved in photosynthesis and protein synthesis are upregulated in Hvwhy1 mutants [27]. These results suggest that plastid-located WHY proteins participate in plastid-to-nucleus retrograde signaling to maintain plastid function in response to environmental fluctuations. Their dual location and dual function suggest that WHY proteins have special traits for communicating between the two compartments in one cell.
The latest study illuminated that Calcineurin B-like-Interacting Protein Kinase14 (CIPK14) interacts with and phosphorylates WHY1, and phosphorylated WHY1 is imported to the nucleus with an enhanced binding affinity for the promoter of WRKY53 [28]. CIPK14 overexpression (oeCIPK14) transgenic plants show an increased nuclear isoform and decreased plastid isoform of WHY1. Fascinatingly, about 5% of CIPK14 overexpression transgenic plants show a variegated pale-green phenotype, which is similar to the why1/3 and why1why3polIb-1 mutants [28]. Even more intriguing, the variegated phenotype can be partially recovered by the overexpression of plastid-located WHY1 [28].
This study focuses on the comparable analysis of the phenotypic and proteomic alterations between the why1/3 variegated (why1/3-var) lines and oeCIPK14 variegated (oeCIPK14-var) lines to evaluate the relationship between CIPK14 and WHY1/WHY3, and to determine their role in producing pale yellow leaves. Total protein in rosette leaves from wild type (WT), why1/3-var, and oeCIPK14-var was separated by two-dimensional gel electrophoresis analysis (2-DE), and the differentially expressed proteins were identified by matrix-assisted laser desorption ionization-time of flight/time of flight mass spectrometry (MALDI-TOF/TOF-MS). The selected proteins were identified at the transcriptional level by quantitative real-time PCR (qRT-PCR) and at the protein level by Western blot. The chlorophyll content and chlorophyll fluorescence kinetic curve were used to determine the photosynthetic performance related to the phenotypes of different mutants.

2. Results

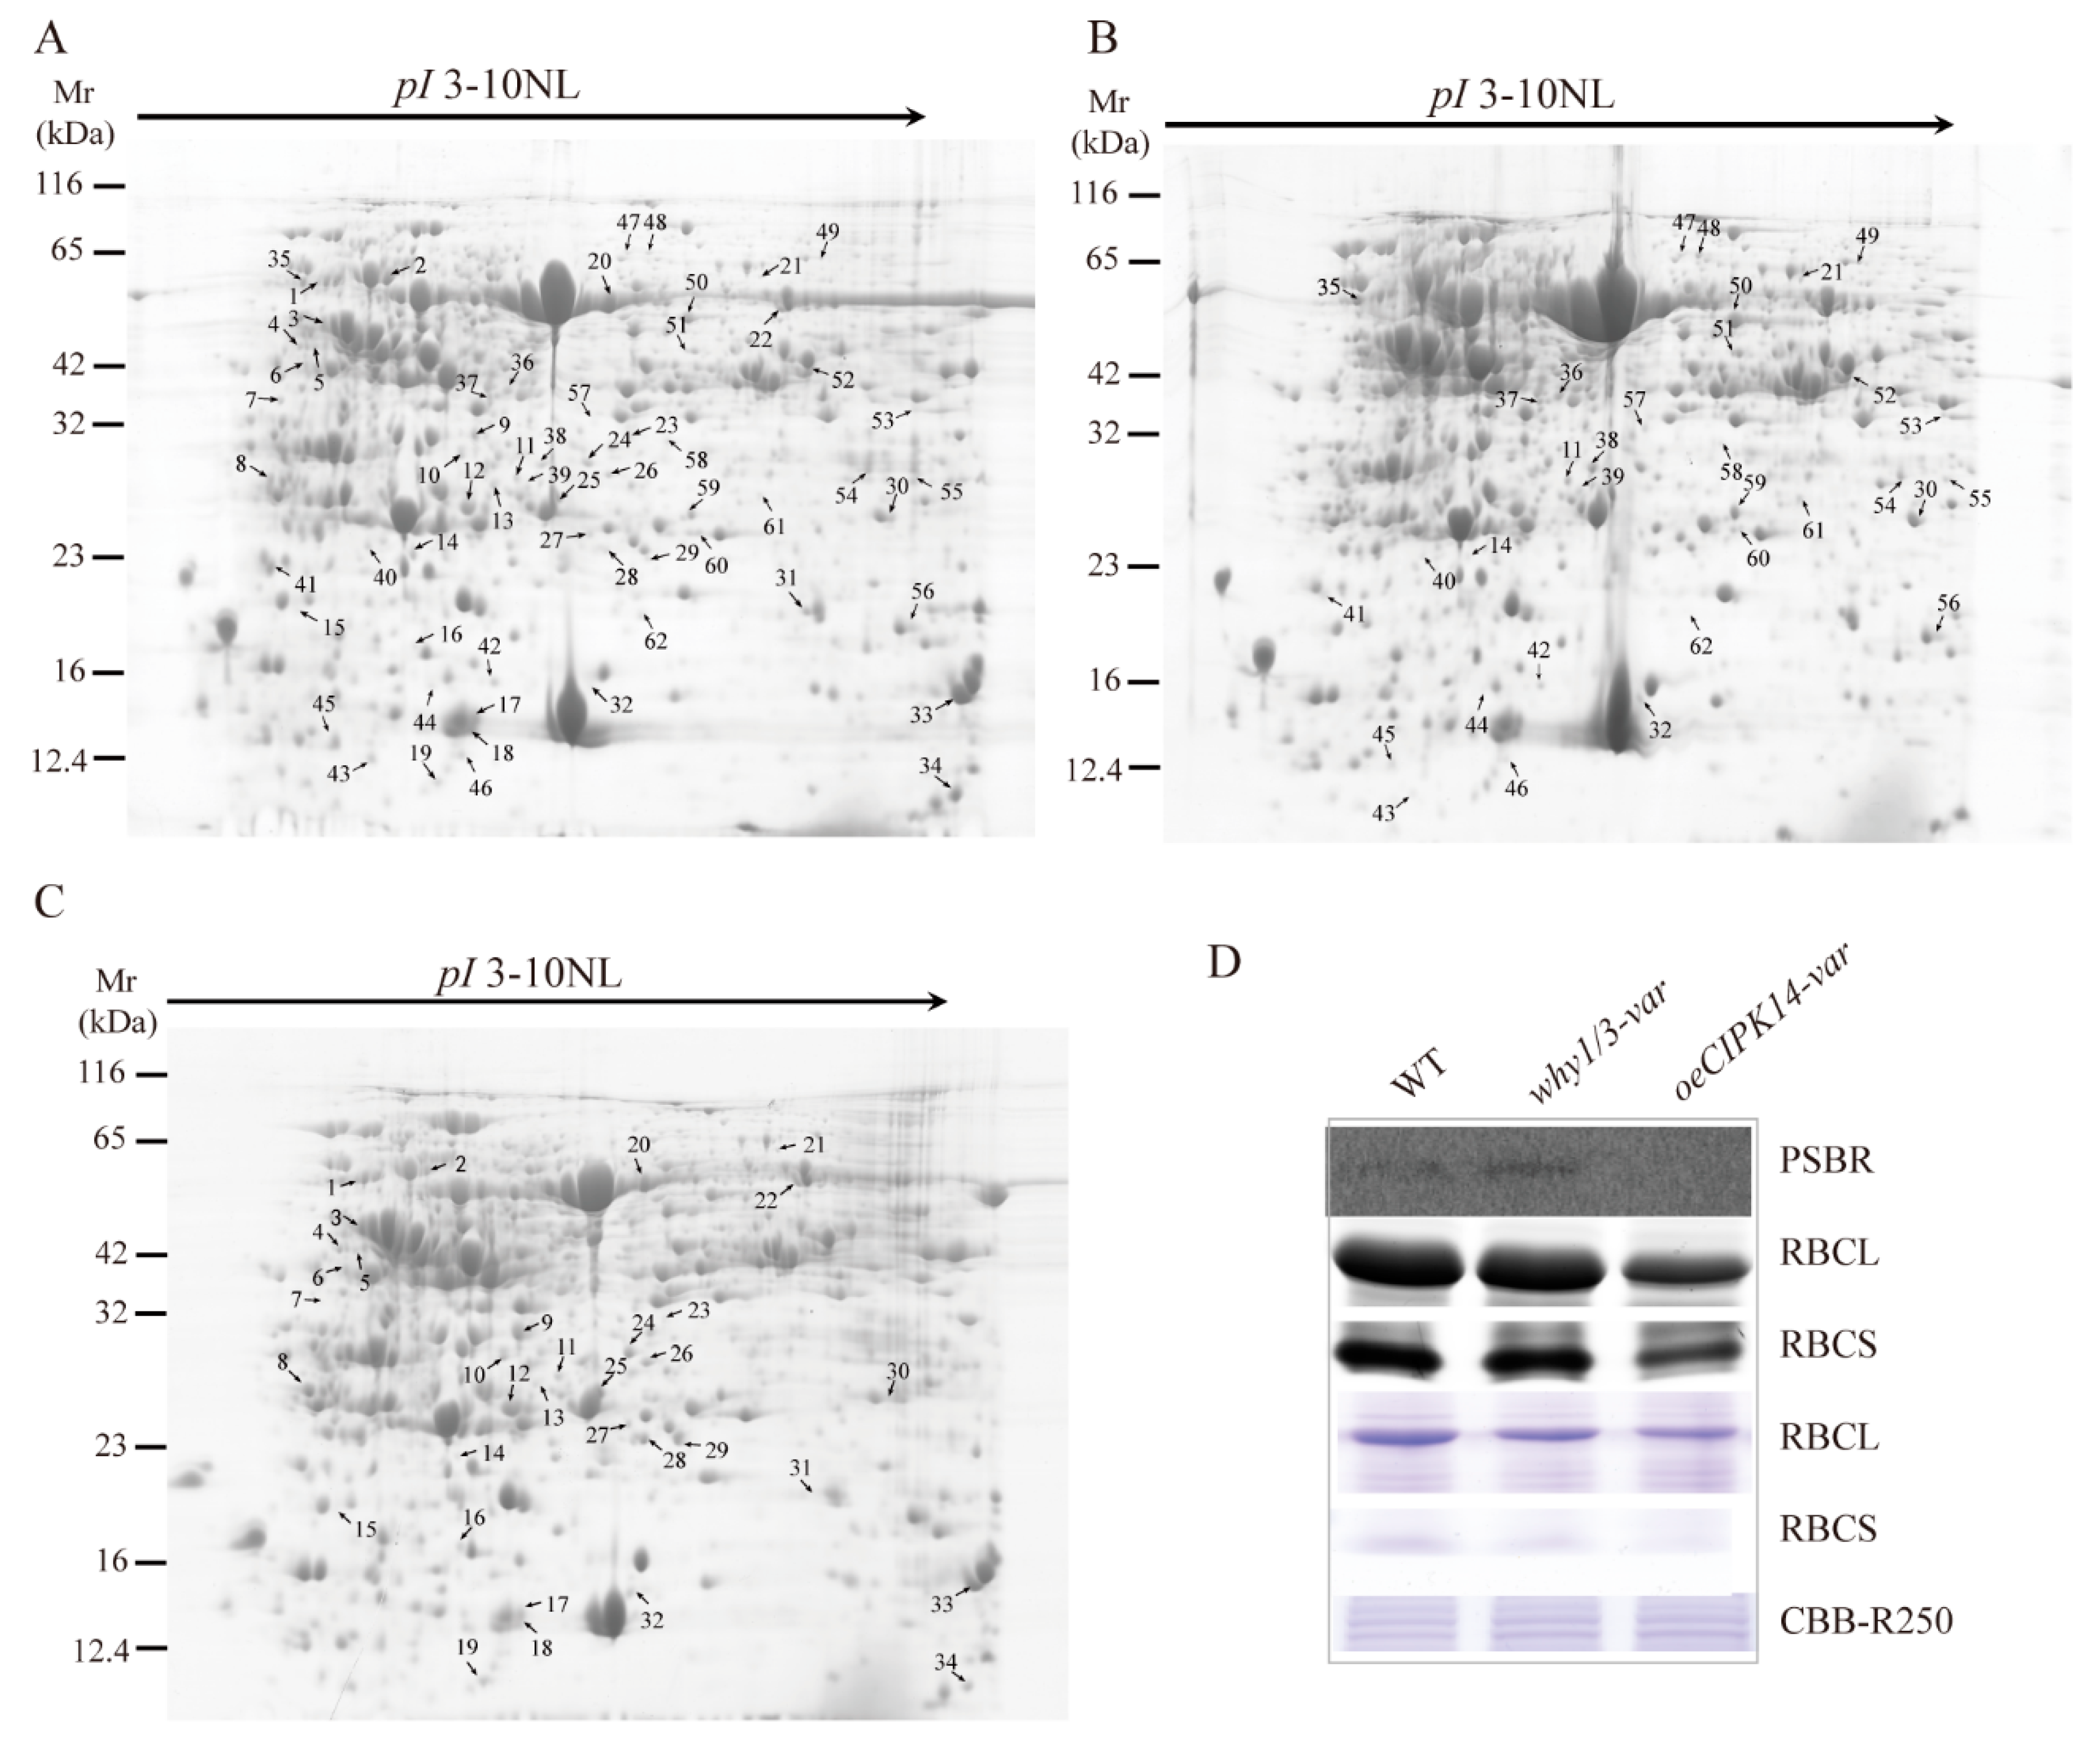
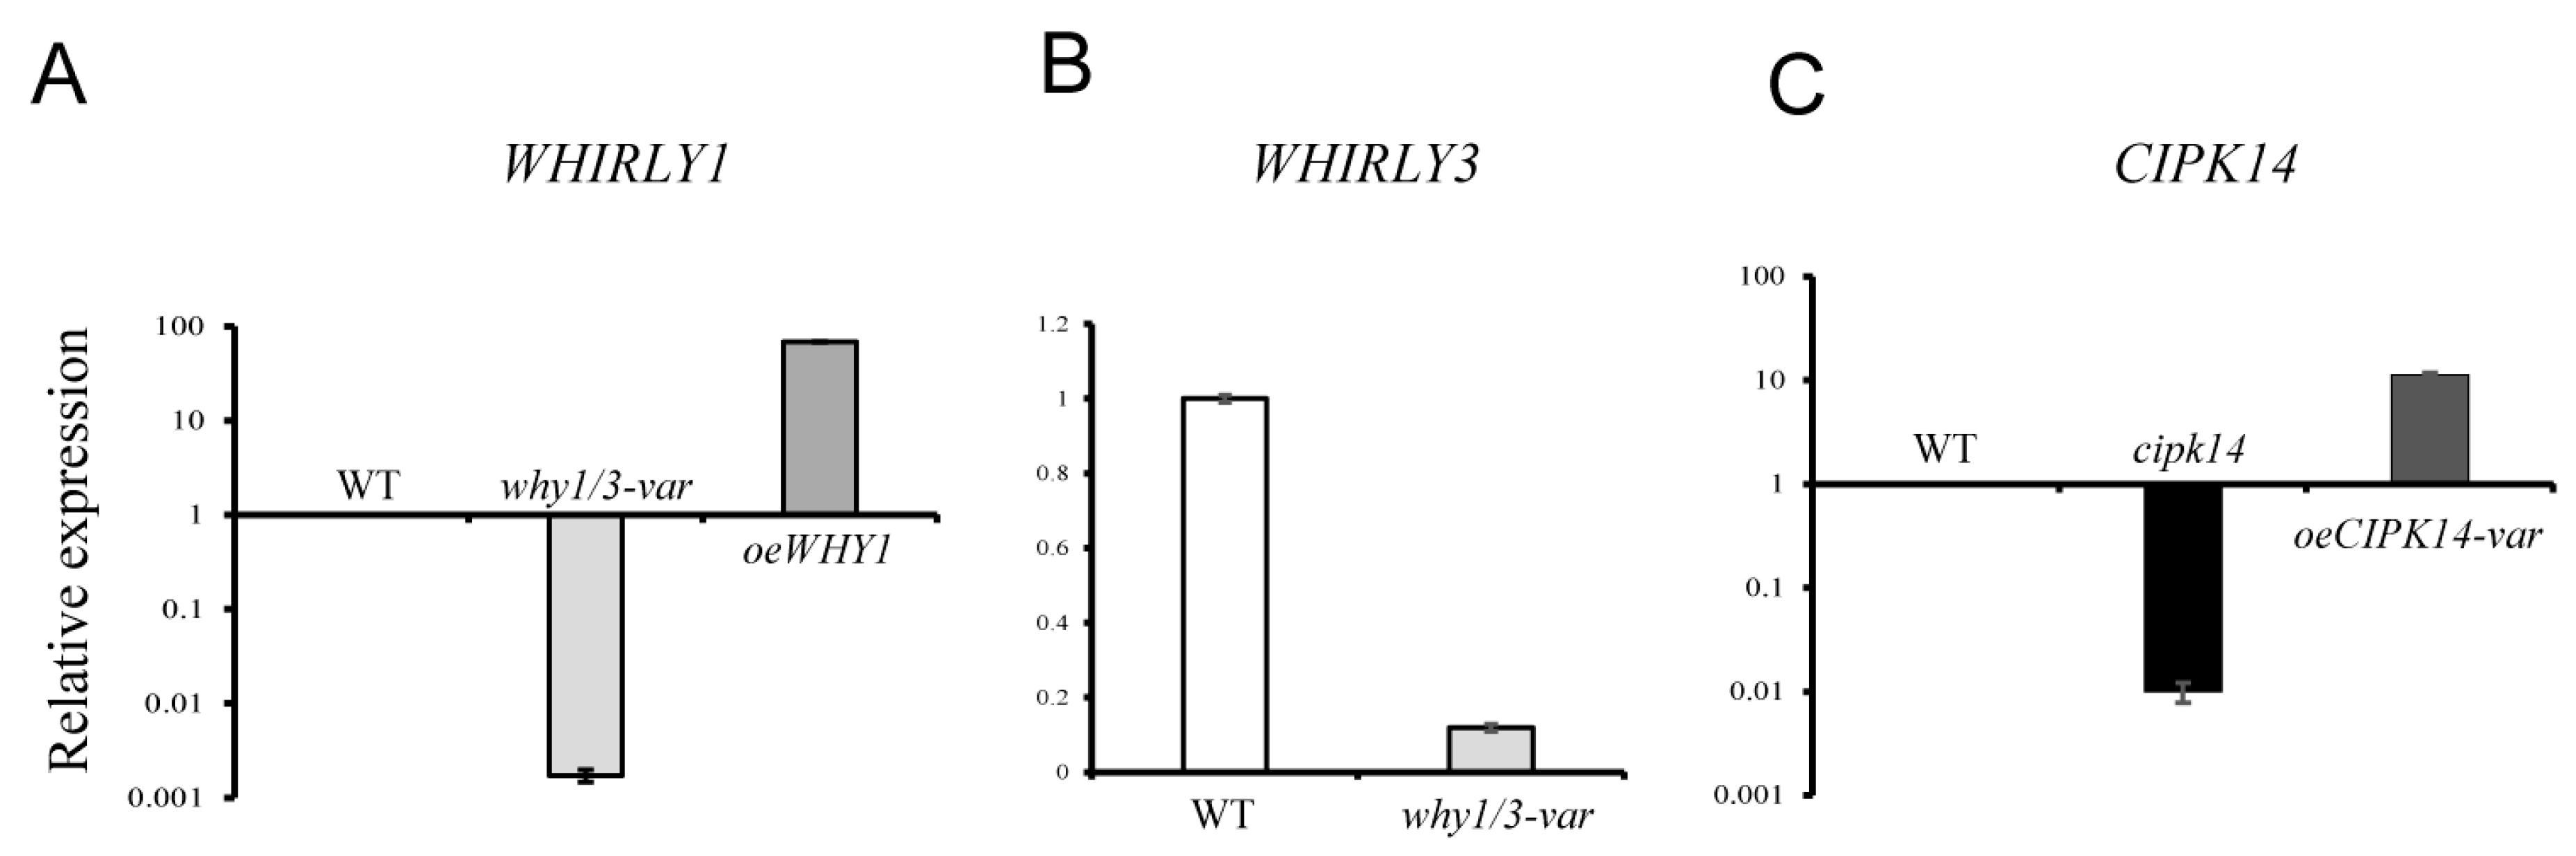
2.1. Proteomic Analysis of why1/3-var and oeCIPK14-var Mutants

Based on our previous reports, the dual localization and distribution of the WHY1 protein in plastids and the nucleus are affected by the WHY1 protein’s phosphorylation status, which is mediated by CIPK14. Of the CIPK14 overexpression transgenic plants, about 5% of the oeCIPK14-var line showed the variegated pale-green phenotype, which is similar to the why1/3-var phenotype [28]. To evaluate the relationship between CIPK14 and WHY1/WHY3 at the protein level and their association with the production of pale yellow leaves, proteomic analysis was conducted. The total protein in rosette leaves of 4-week-old plants was separated by 2-DE; more than 800 protein spots were detected reproducibly on each gel for the WT, why1/3-var, and oeCIPK14-var lines. A total of 67 differentially expressed protein spots showed significant changes (fold > 2, p < 0.05) in the why1/3-var and oeCIPK14-var lines (Figure 1A–C). The differentially expressed protein spots were analyzed by MALDI-TOF/TOF-MS, and a total of 66 protein spots were identified successfully (identification rate: 99%); only one protein (spot 42) remains unknown. The identified proteins are listed in Table 1. Among them, 33 differentially expressed protein spots (spots 11, 14, 21, 30, 32, 35–62) were detected in why1/3-var (Figure 1B), and 34 differentially expressed protein spots (spots 1–34) were detected in oeCIPK14-var (Figure 1C). Interestingly, only five overlapping proteins (spots 11, 14, 21, 30, 32) were discovered in both why1/3-var and oeCIPK14-var. These five proteins are proposed to be intimately associated with the CIPK14-mediated functions of WHY proteins.
In order to evaluate the quality of the 2-DE differentially displayed proteins, two light-dependent reaction complex-related proteins were selected for immunodetection, using consumable antibodies against ATP synthase subunit alpha (atp A) and the photosystem II (PS II) complex protein PSBR (Figure 1D). While the antibody against atp A did not produce any reaction, PSBR was barely detectable in the oeCIPK14-var line, which is in agreement with the changes in protein abundance observed by 2-DE (Figure 1D). We further directly detected the levels of Ribulose bisphosphate carboxylase large chain (RBCL) and Ribulose bisphosphate carboxylase small chain (RBCS) by Coomassie bright blue R250 staining (Figure 1D), which clearly showed that both RBCL and RBCS decreased in the why1/3-var and oeCIPK14-var lines, consistent with the changes in protein abundance observed by 2-DE. Furthermore, two antibodies against RBCL and RBCS were used to perform Western blotting. Consistent with our 2-DE findings, these results showed that the proteins RBCL and RBCS were downregulated in the oeCIPK14-var line and slightly decreased in the why1/3-var plants, as compared to wild-type plants (Figure 1D). These findings confirm that the MS data are reliable.

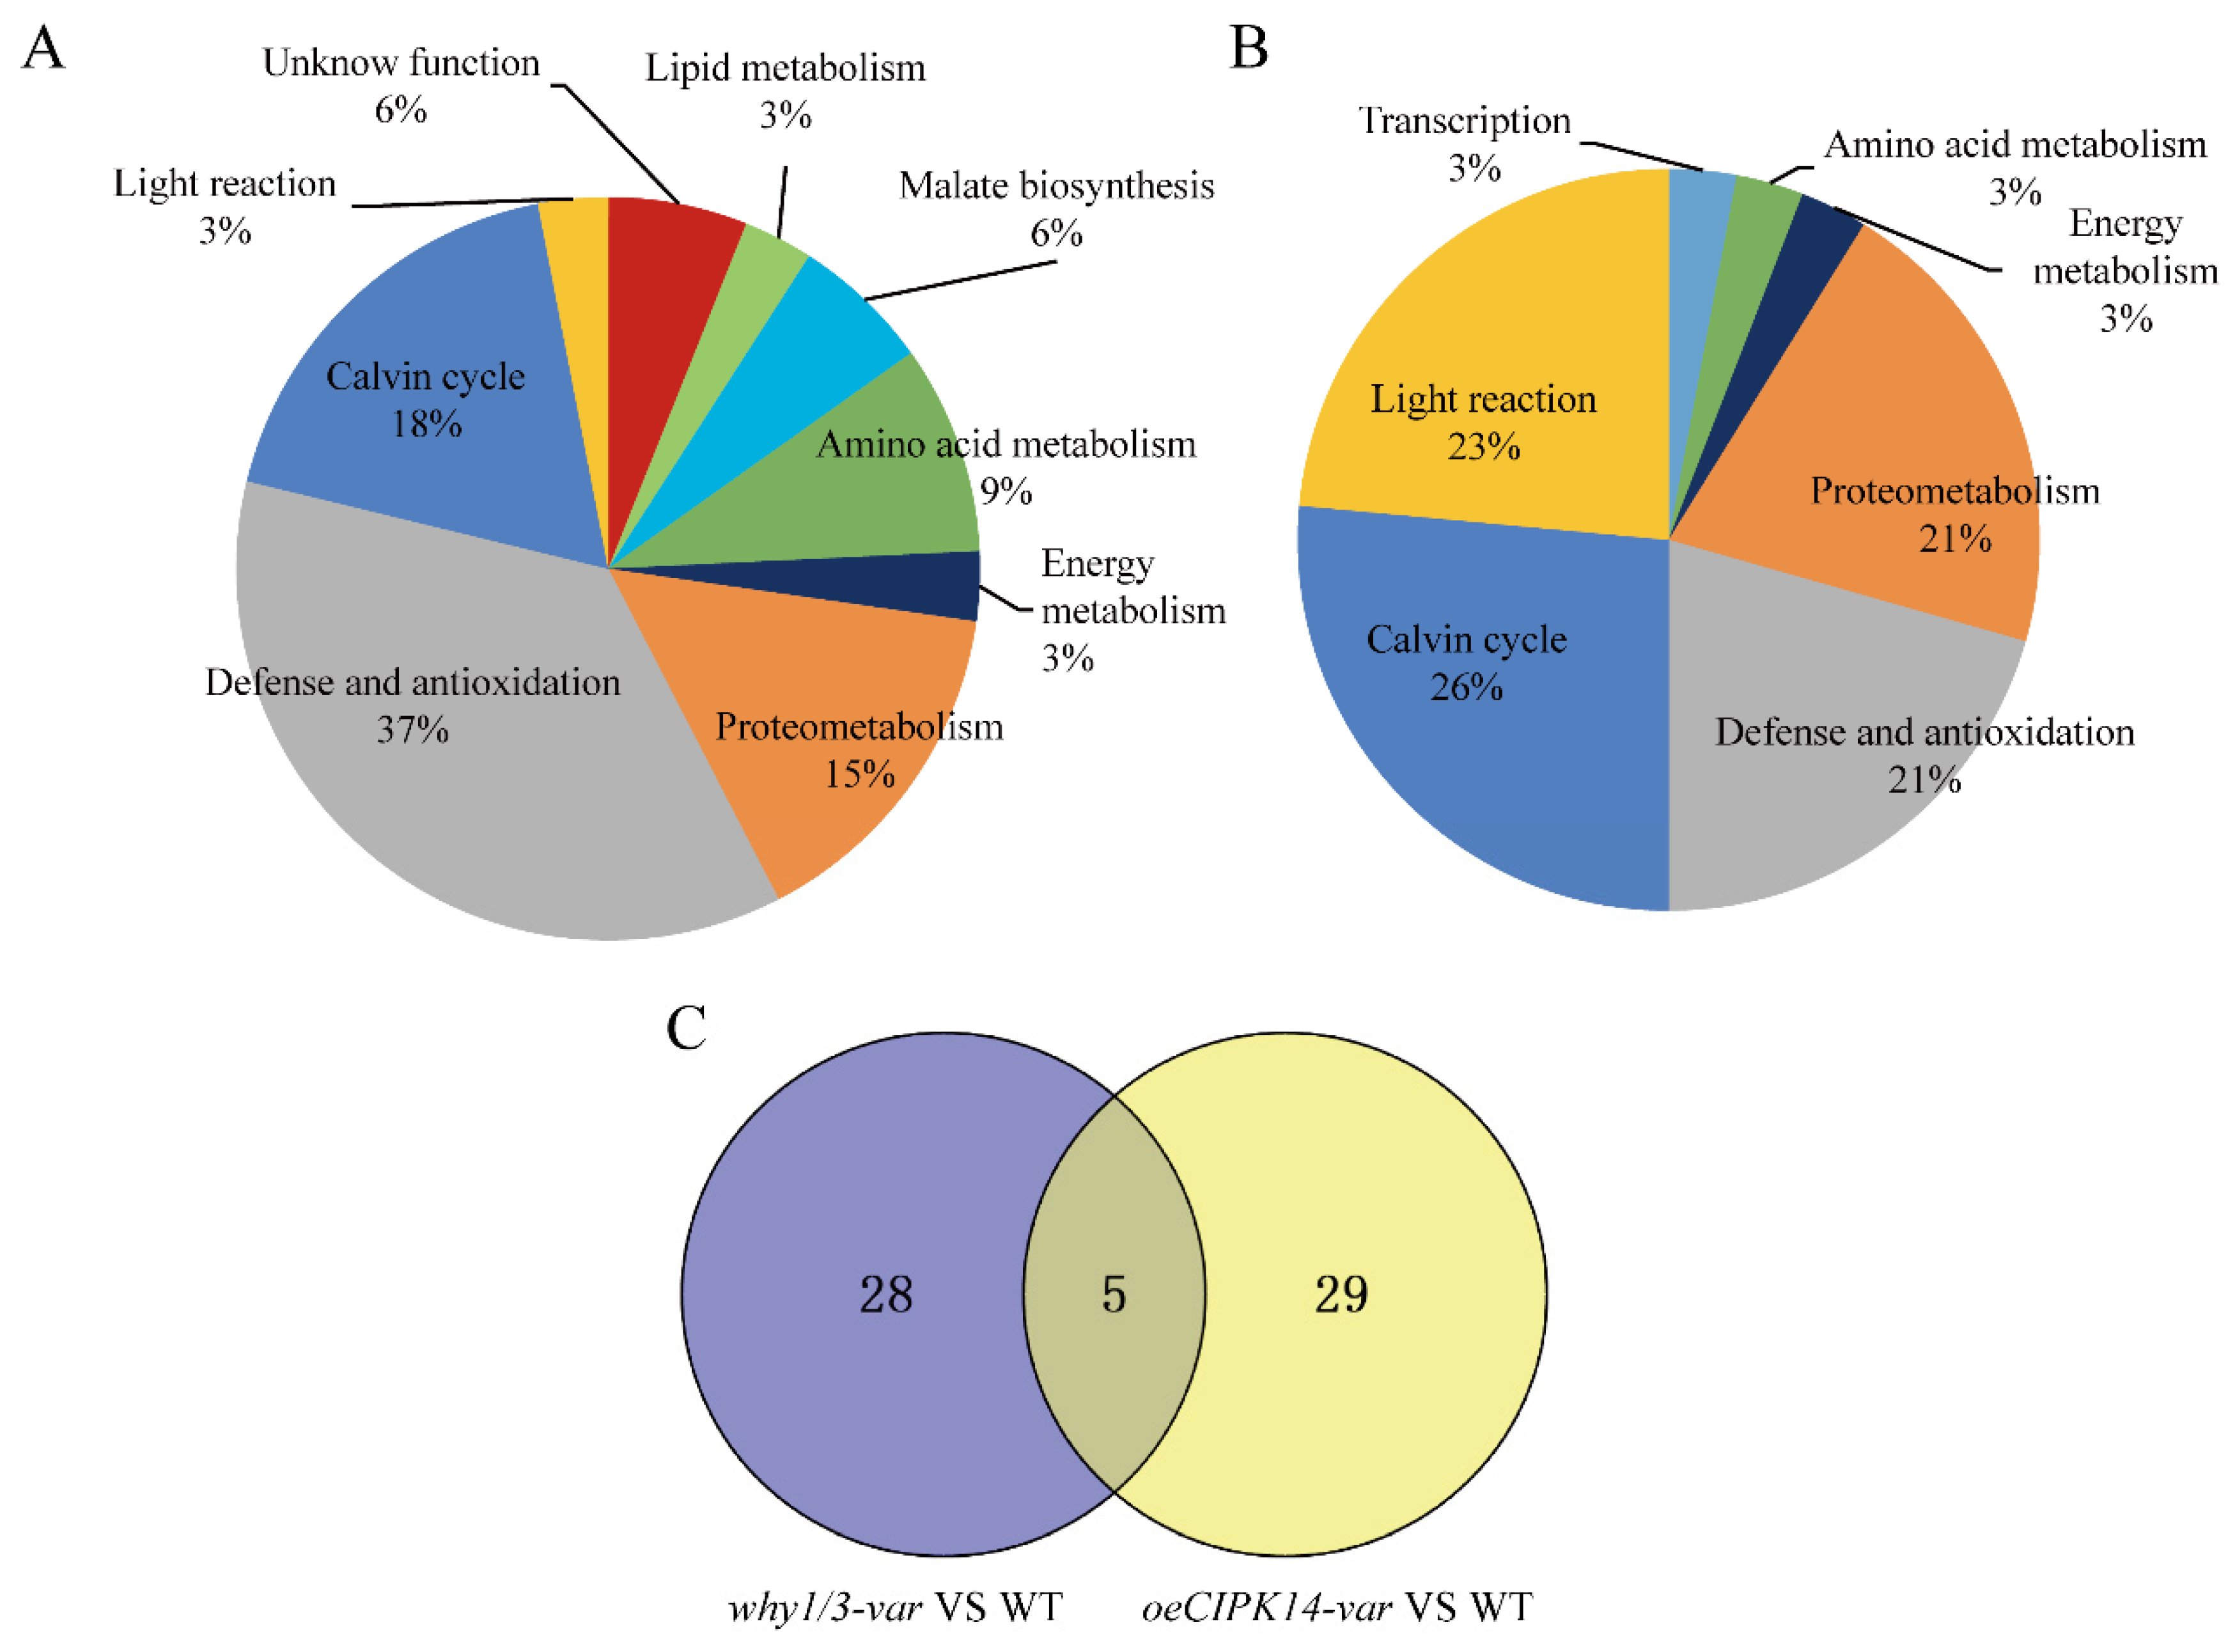
2.2. Functional Classification of Differentially Expressed Proteins

Based on the Uniprot database (http://www.uniprot.org/) and descriptions from the literature, the functions of 65 proteins were annotated. These proteins are categorized into eight groups based on their biochemical functions, as shown in Table 1. The majority of the proteins are photosynthesis-associated proteins, followed by proteins related to defense and antioxidation, protein and amino acid metabolism, energy metabolism, malate biosynthesis, lipid metabolism, and transcription (Table 1 and Figure 2). Comparative analysis of differentially expressed proteins between why1/3-var/WT and oeCIPK14-var/WT are shown in Figure 2A,B, respectively. The five overlapping proteins between why1/3-var/WT and oeCIPK14-var/WT are ATP-dependent Clp protease proteolytic subunit-related protein 3 (ClpR3), Ribulose bisphosphate carboxylase large chain (RBCL), Beta-amylase 3 (BAM3), Ribosome-recycling factor (RRF), and Ribulose bisphosphate carboxylase small chain (RBCS) (Figure 2C).

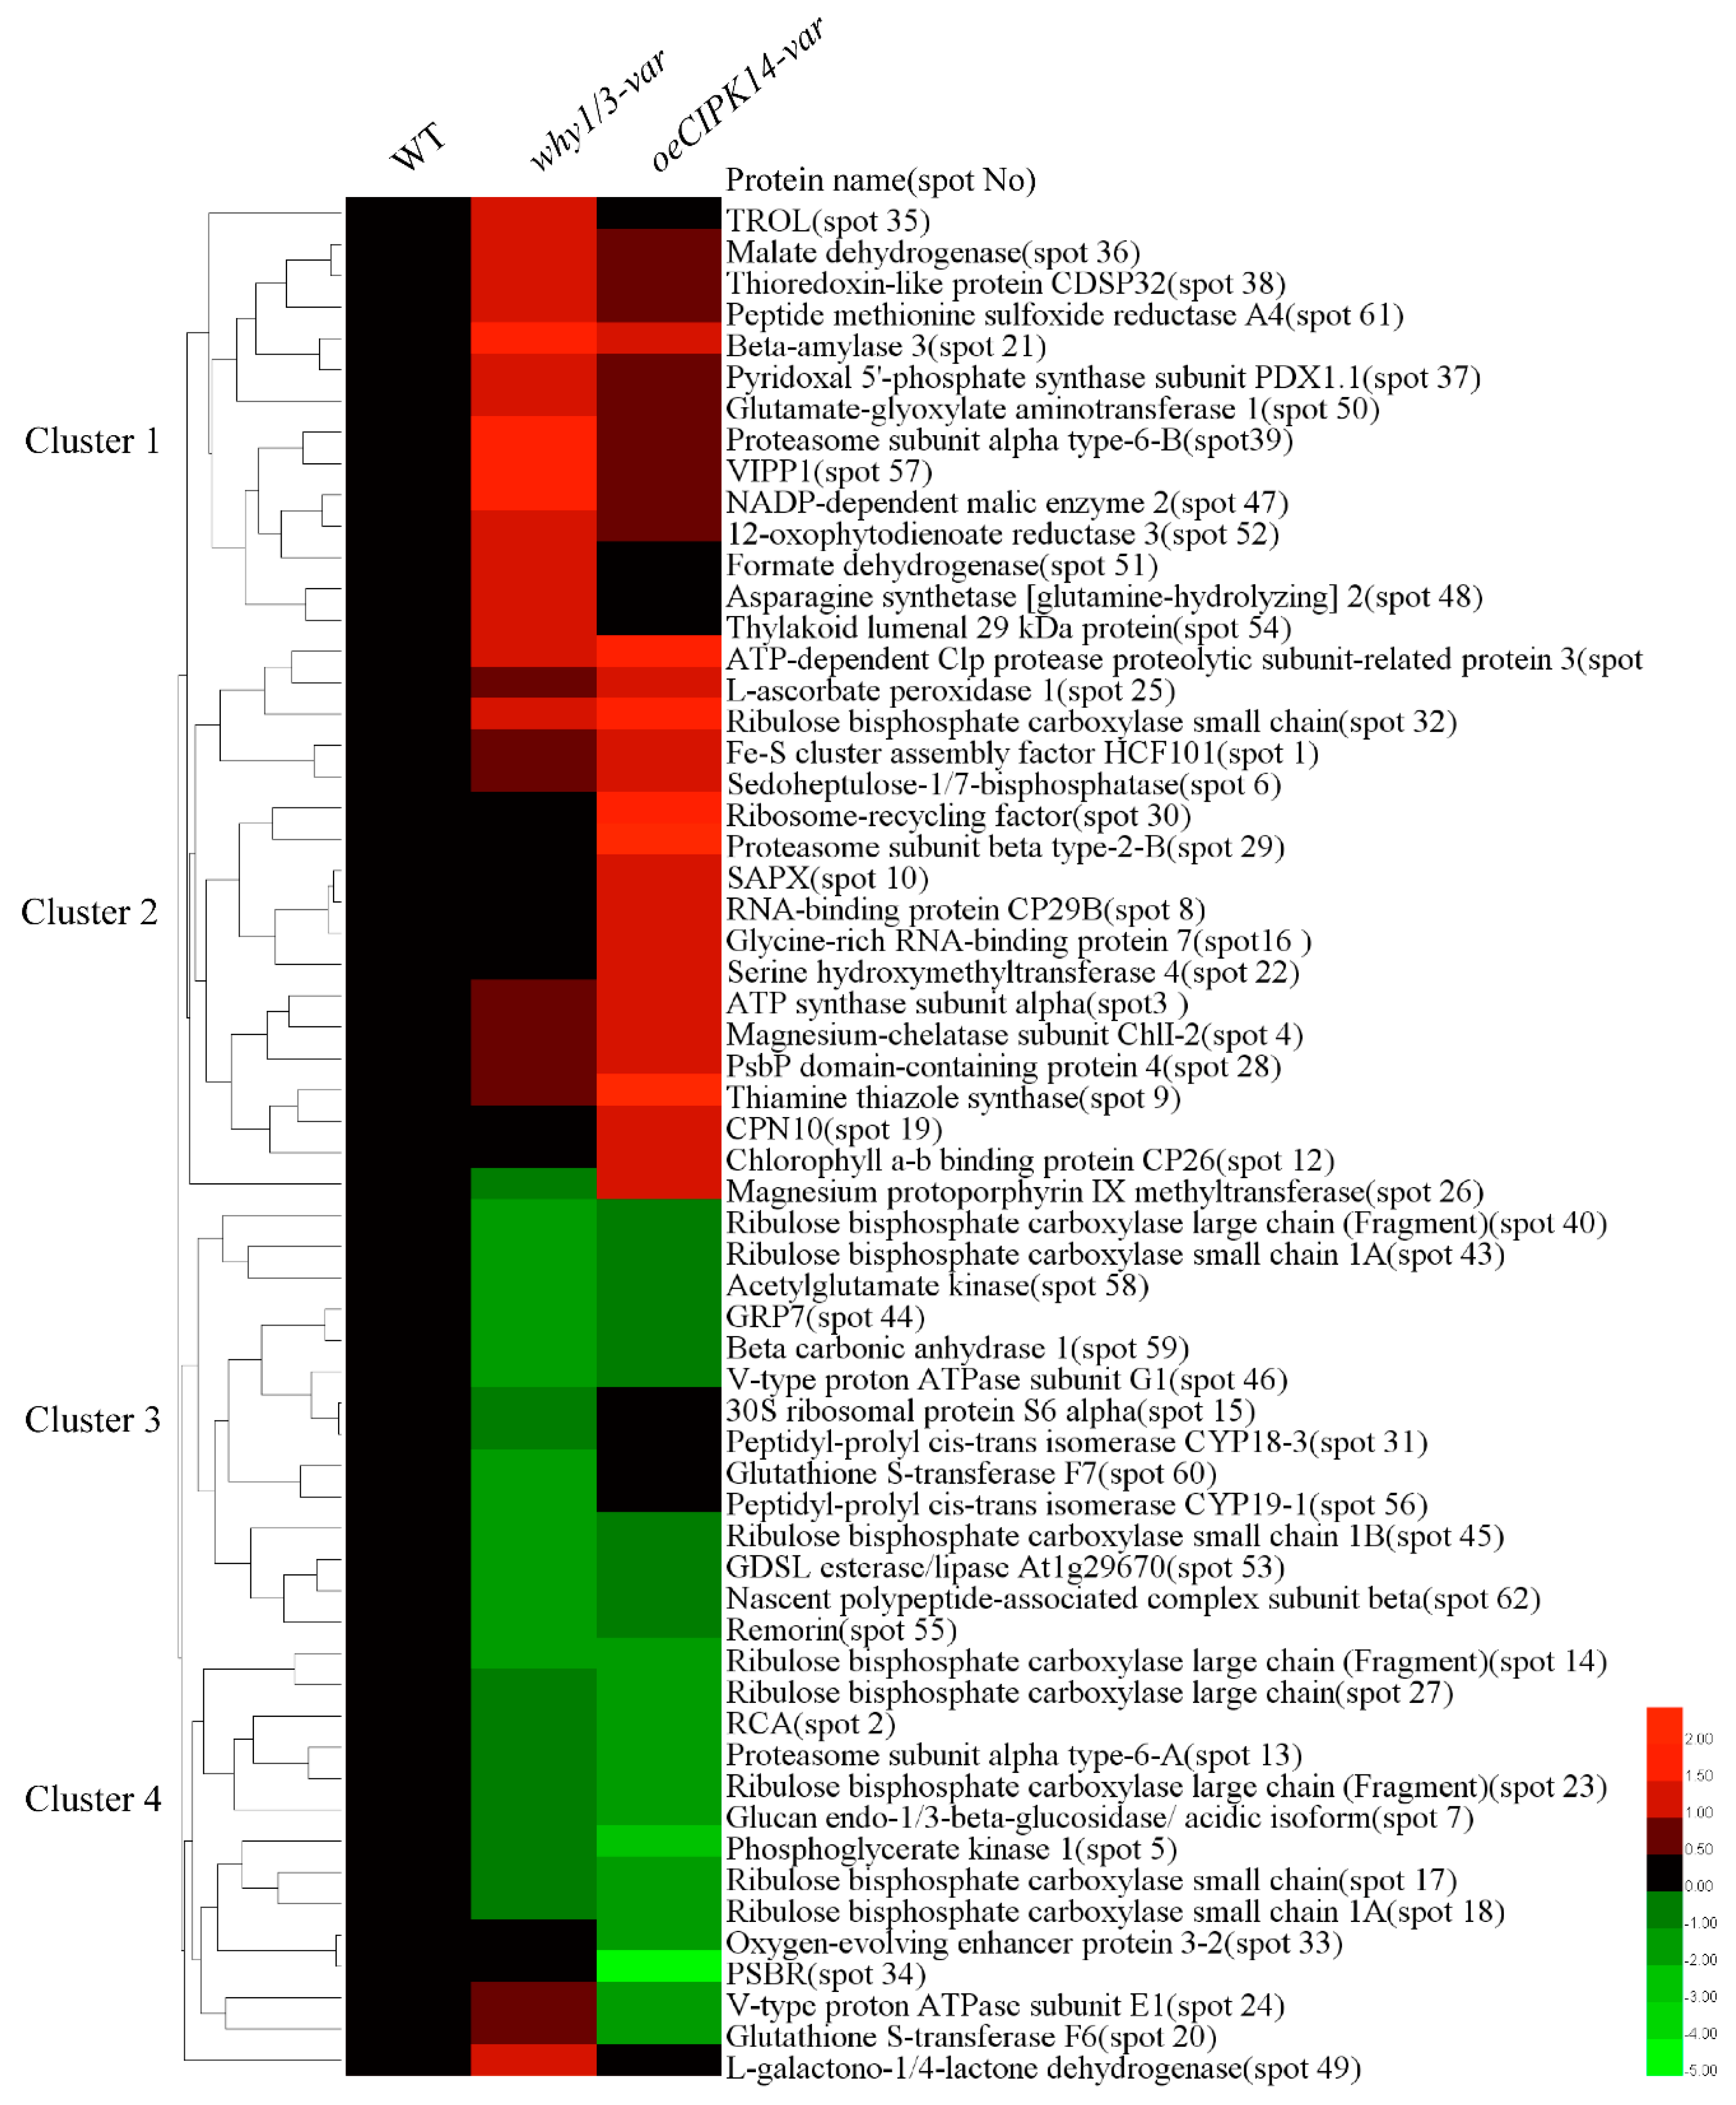
2.3. Hierarchical Clustering Analysis of Differentially Expressed Proteins

To acquire information on the identified proteins, hierarchical clustering analysis was performed on the proteins appearing on the same branch with similar expression patterns (Figure 3). There are four clusters of these proteins. The majority of the proteins in the first and second clusters were upregulated in the why1/3-var and oeCIPK14-var lines, respectively, and mainly contain defense and antioxidation-related proteins (spots 9, 10, 25, 37, 38, 52, 54, 57, 61), amino acid and protein metabolism-related proteins (spots 11, 19, 22, 29, 30, 39, 48, 50), photosynthesis-associated proteins (spots 1, 3, 4, 6, 12, 26, 28, 32, 35), and energy metabolism-related proteins (spots 21, 36, 47, 51). Most of the proteins in the third and fourth clusters were downregulated in the why1/3-var and oeCIPK14-var lines, respectively. Among them, some of the key enzymes of the Calvin cycle (spots 2, 5, 6, 14, 17, 18, 23, 27, 40, 43, 45) belong to the two branches, suggesting that the fixation rates of CO2 decrease in the why1/3-var and oeCIPK14-var variegated lines. We also found that other proteins downregulated in the why1/3-var and oeCIPK14-var lines are involved in light reaction, defense and antioxidation mechanisms, amino acid metabolism, protein metabolism, and so on.

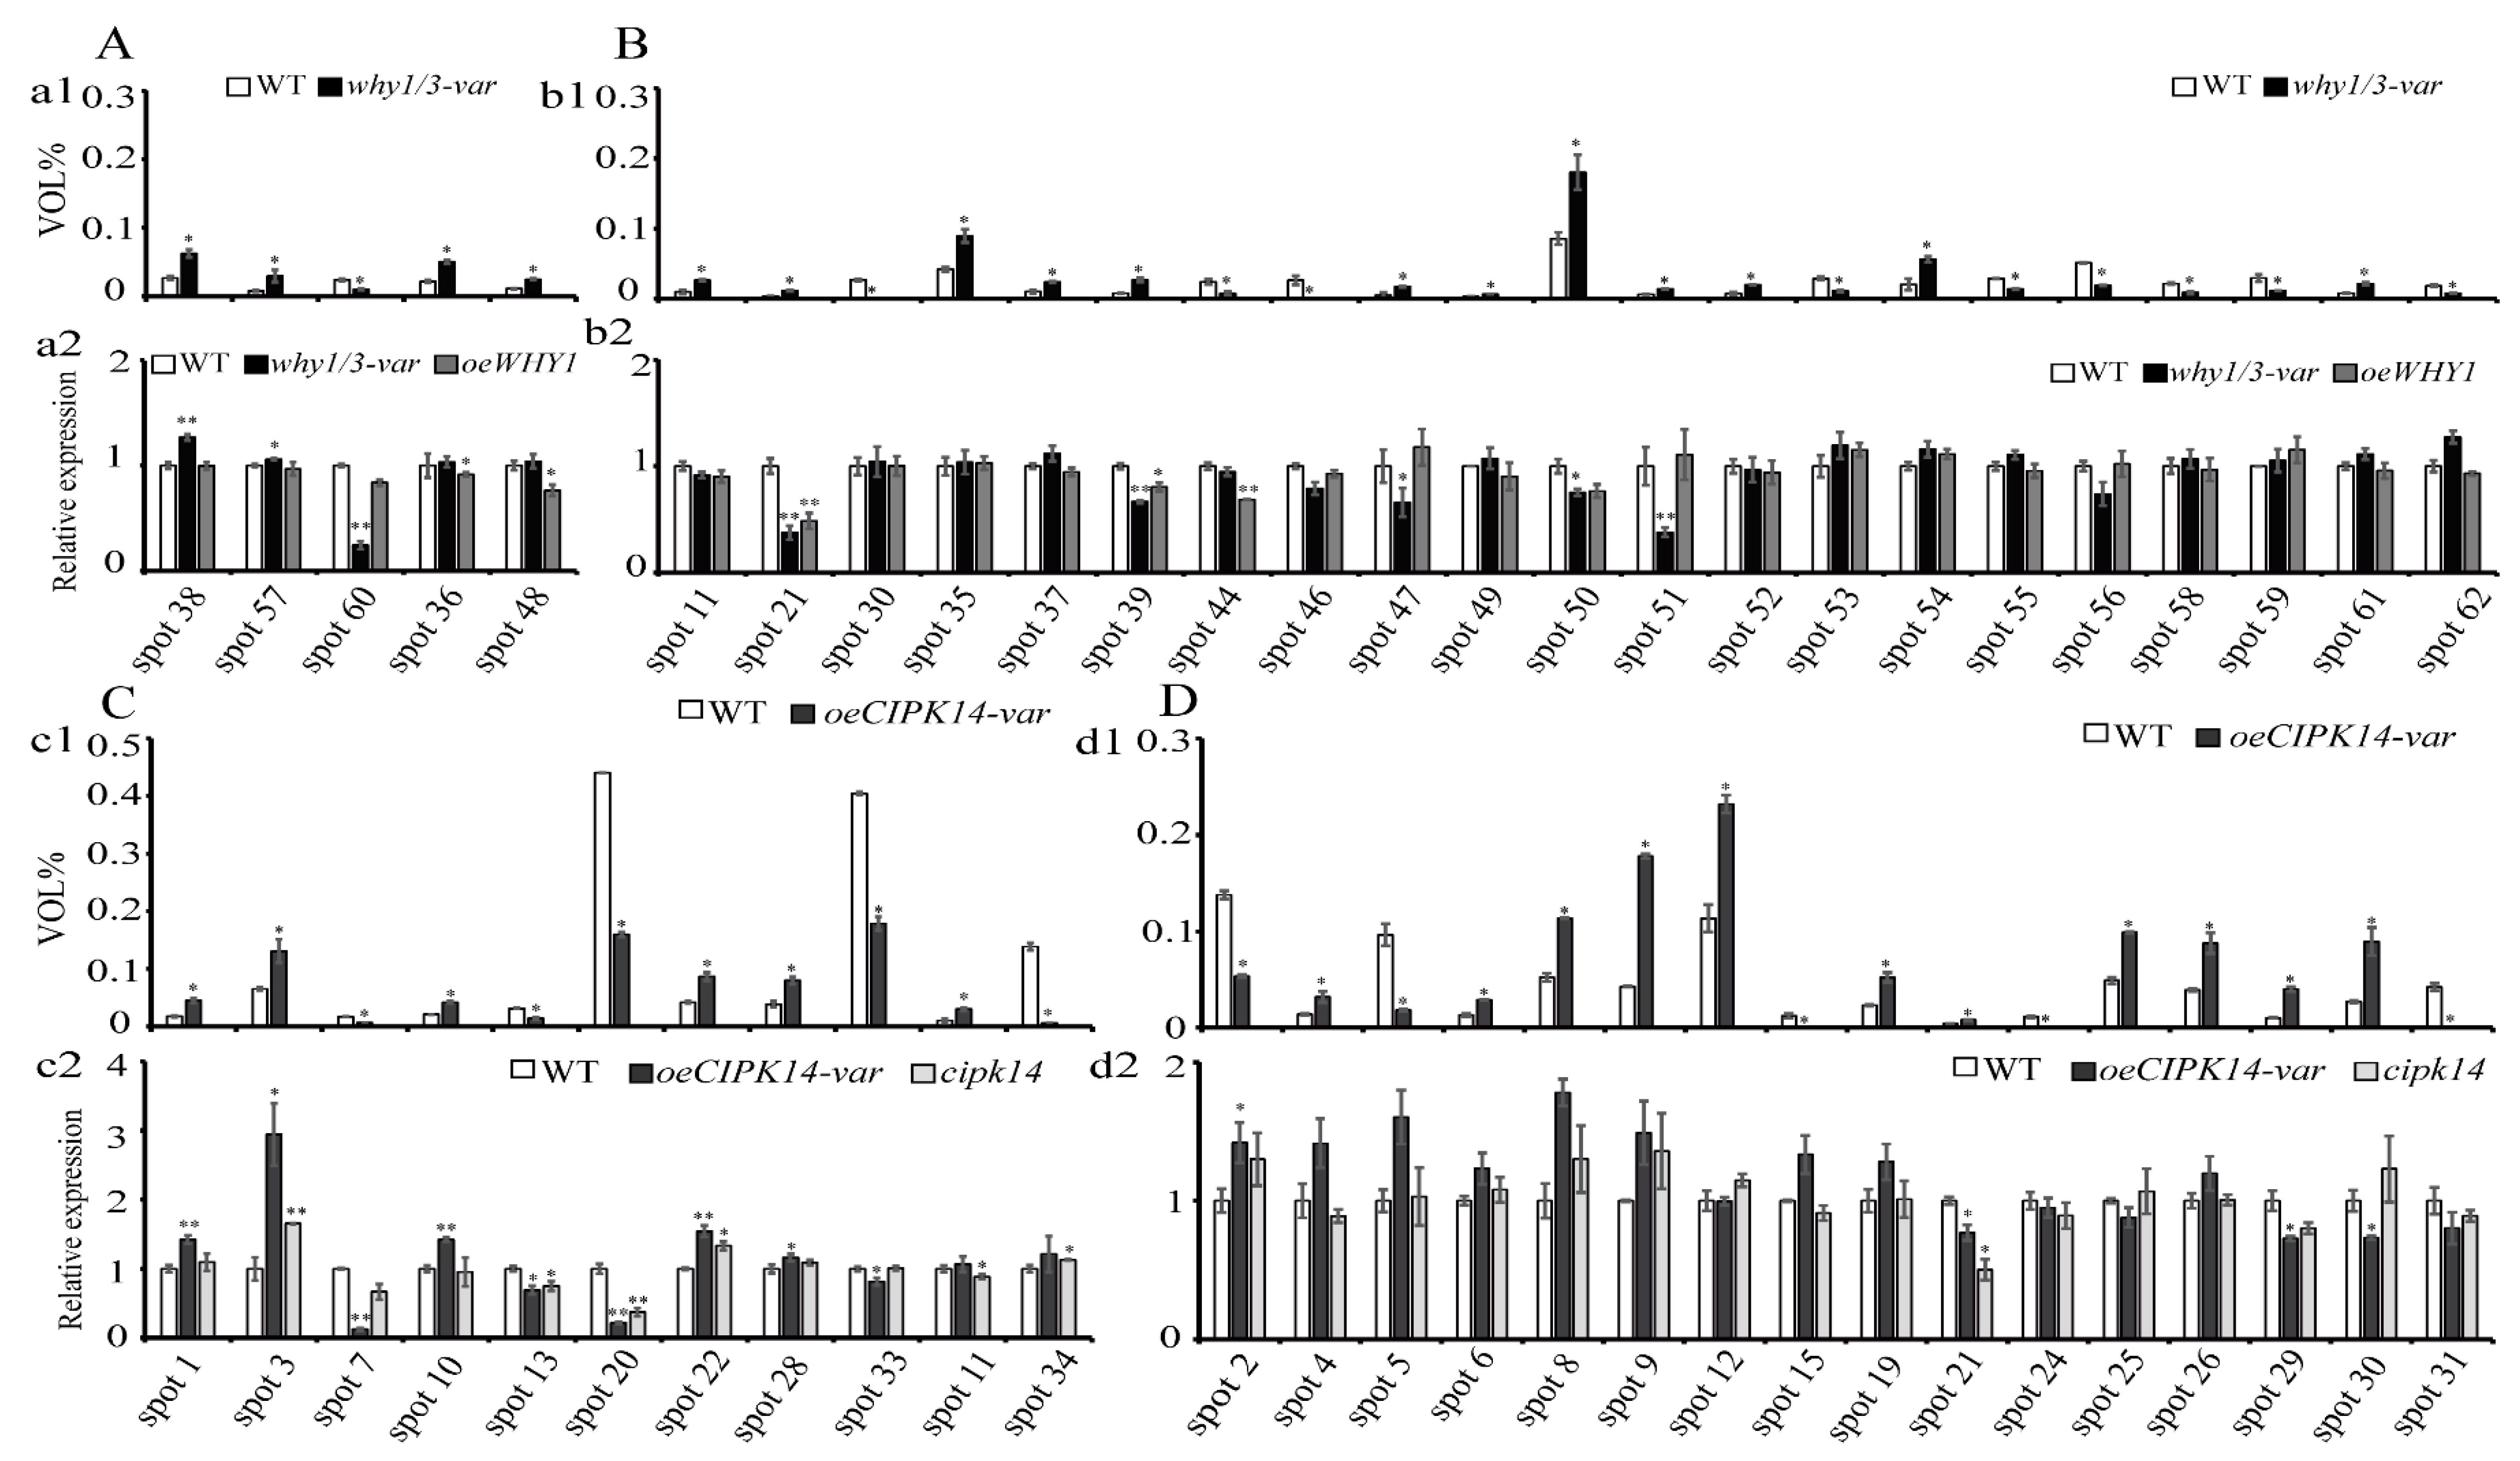
2.4. Transcriptional Level Analysis of the Encoding Genes of Differentially Expressed Proteins

To investigate the correlation between protein and transcript levels, the transcript levels of the encoding genes of differentially expressed proteins were analyzed by quantitative real-time PCR (qRT-PCR). Twenty-six genes were identified in the WT, why1/3-var, and overexpressing WHY1 (oeWHY1) lines; and 27 genes were identified in the WT, oeCIPK14-var, and knockout CIPK14 (cipk14) lines, respectively. The transcript levels of WHY1, WHY3, and CIPK14 were first detected in the WHY and CIPK14 mutants (Figure 4). As shown in Figure 4, the expression level of WHIRLY1 was barely detectable in the why1/3-var line, but it was significantly accumulated in oeWHY1 (Figure 4A). The expression level of WHIRLY3 was lower in why1/3-var compared with WT (Figure 4B). The expression level of CIPK14 was barely detectable in cipk14, while it showed significant upregulation in oeCIPK14-var (Figure 4C).
We further analyzed the transcript levels of the encoding genes of differentially expressed proteins. Relative protein abundance of WT and why1/3-var is represented by percent volume on the top panels (a1 and b1) of Figure 5A,B, and the relative expression levels of the encoding genes of differentially expressed proteins in why1/3-var and oeWHY1 compared to WT are shown in Figure 5A(a2),B(b2), respectively. The encoding genes of differentially expressed proteins in oeCIPK14-var were analyzed in the WT, cipk14, and oeCIPK14-var lines. Relative protein abundance in WT and oeCIPK14-var is represented by percent volume in the top panels (c1 and d1) of Figure 5C,D, and the relative expression levels of the encoding genes of differentially expressed proteins in oeCIPK14-var and cipk14 compared to WT are shown in Figure 5C(c2),D(d2), respectively. The quantitative RT-PCR results of all candidate genes showed that the transcript levels of 11 of the 26 genes were altered in why1/3-var or oeWHY1, and the transcriptional patterns of 5 of the 26 genes are consistent with the protein expression patterns (Figure 5A(a2)). The transcripts of the remaining 21 genes are inconsistent with protein levels in why1/3-var (Figure 5B(b2)). However, most of the changes in gene expression in why1/3-var were recovered in oeWHY1, except for spot 21, spot 39, and spot 44. This suggests that WHY1 is not sufficient to fully rescue the alteration of transcript levels of genes in why1/3-var. The transcript levels of 13 of the 27 expressed genes were changed in oeCIPK14-var or cipk14, and the mRNA levels of 9 of the 27 genes changed in parallel with protein levels (Figure 5C(c2)). The mRNA levels of the remaining 18 genes were inconsistent with oeCIPK14-var protein levels (Figure 4D(d2)). Unexpectedly, only a few gene expression levels were changed in the cipk14 line, and none of the changes in gene expression were rescued. This discrepancy between mRNA and protein levels may be caused by the different half-lives of protein and mRNA, or post-transcriptional or post-translational processing and modification.
The relative expression level of the gene is normalized to GAPC2, with the WT as 1. The error bars indicated standard error of three biological replications and three technique replicates. Asterisks indicate significant differences (* p < 0.05 and ** p < 0.01) based on Student’s t-test analyzed by Graphpad prism6 software.

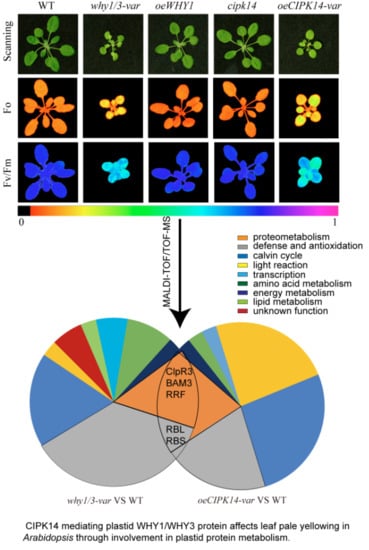
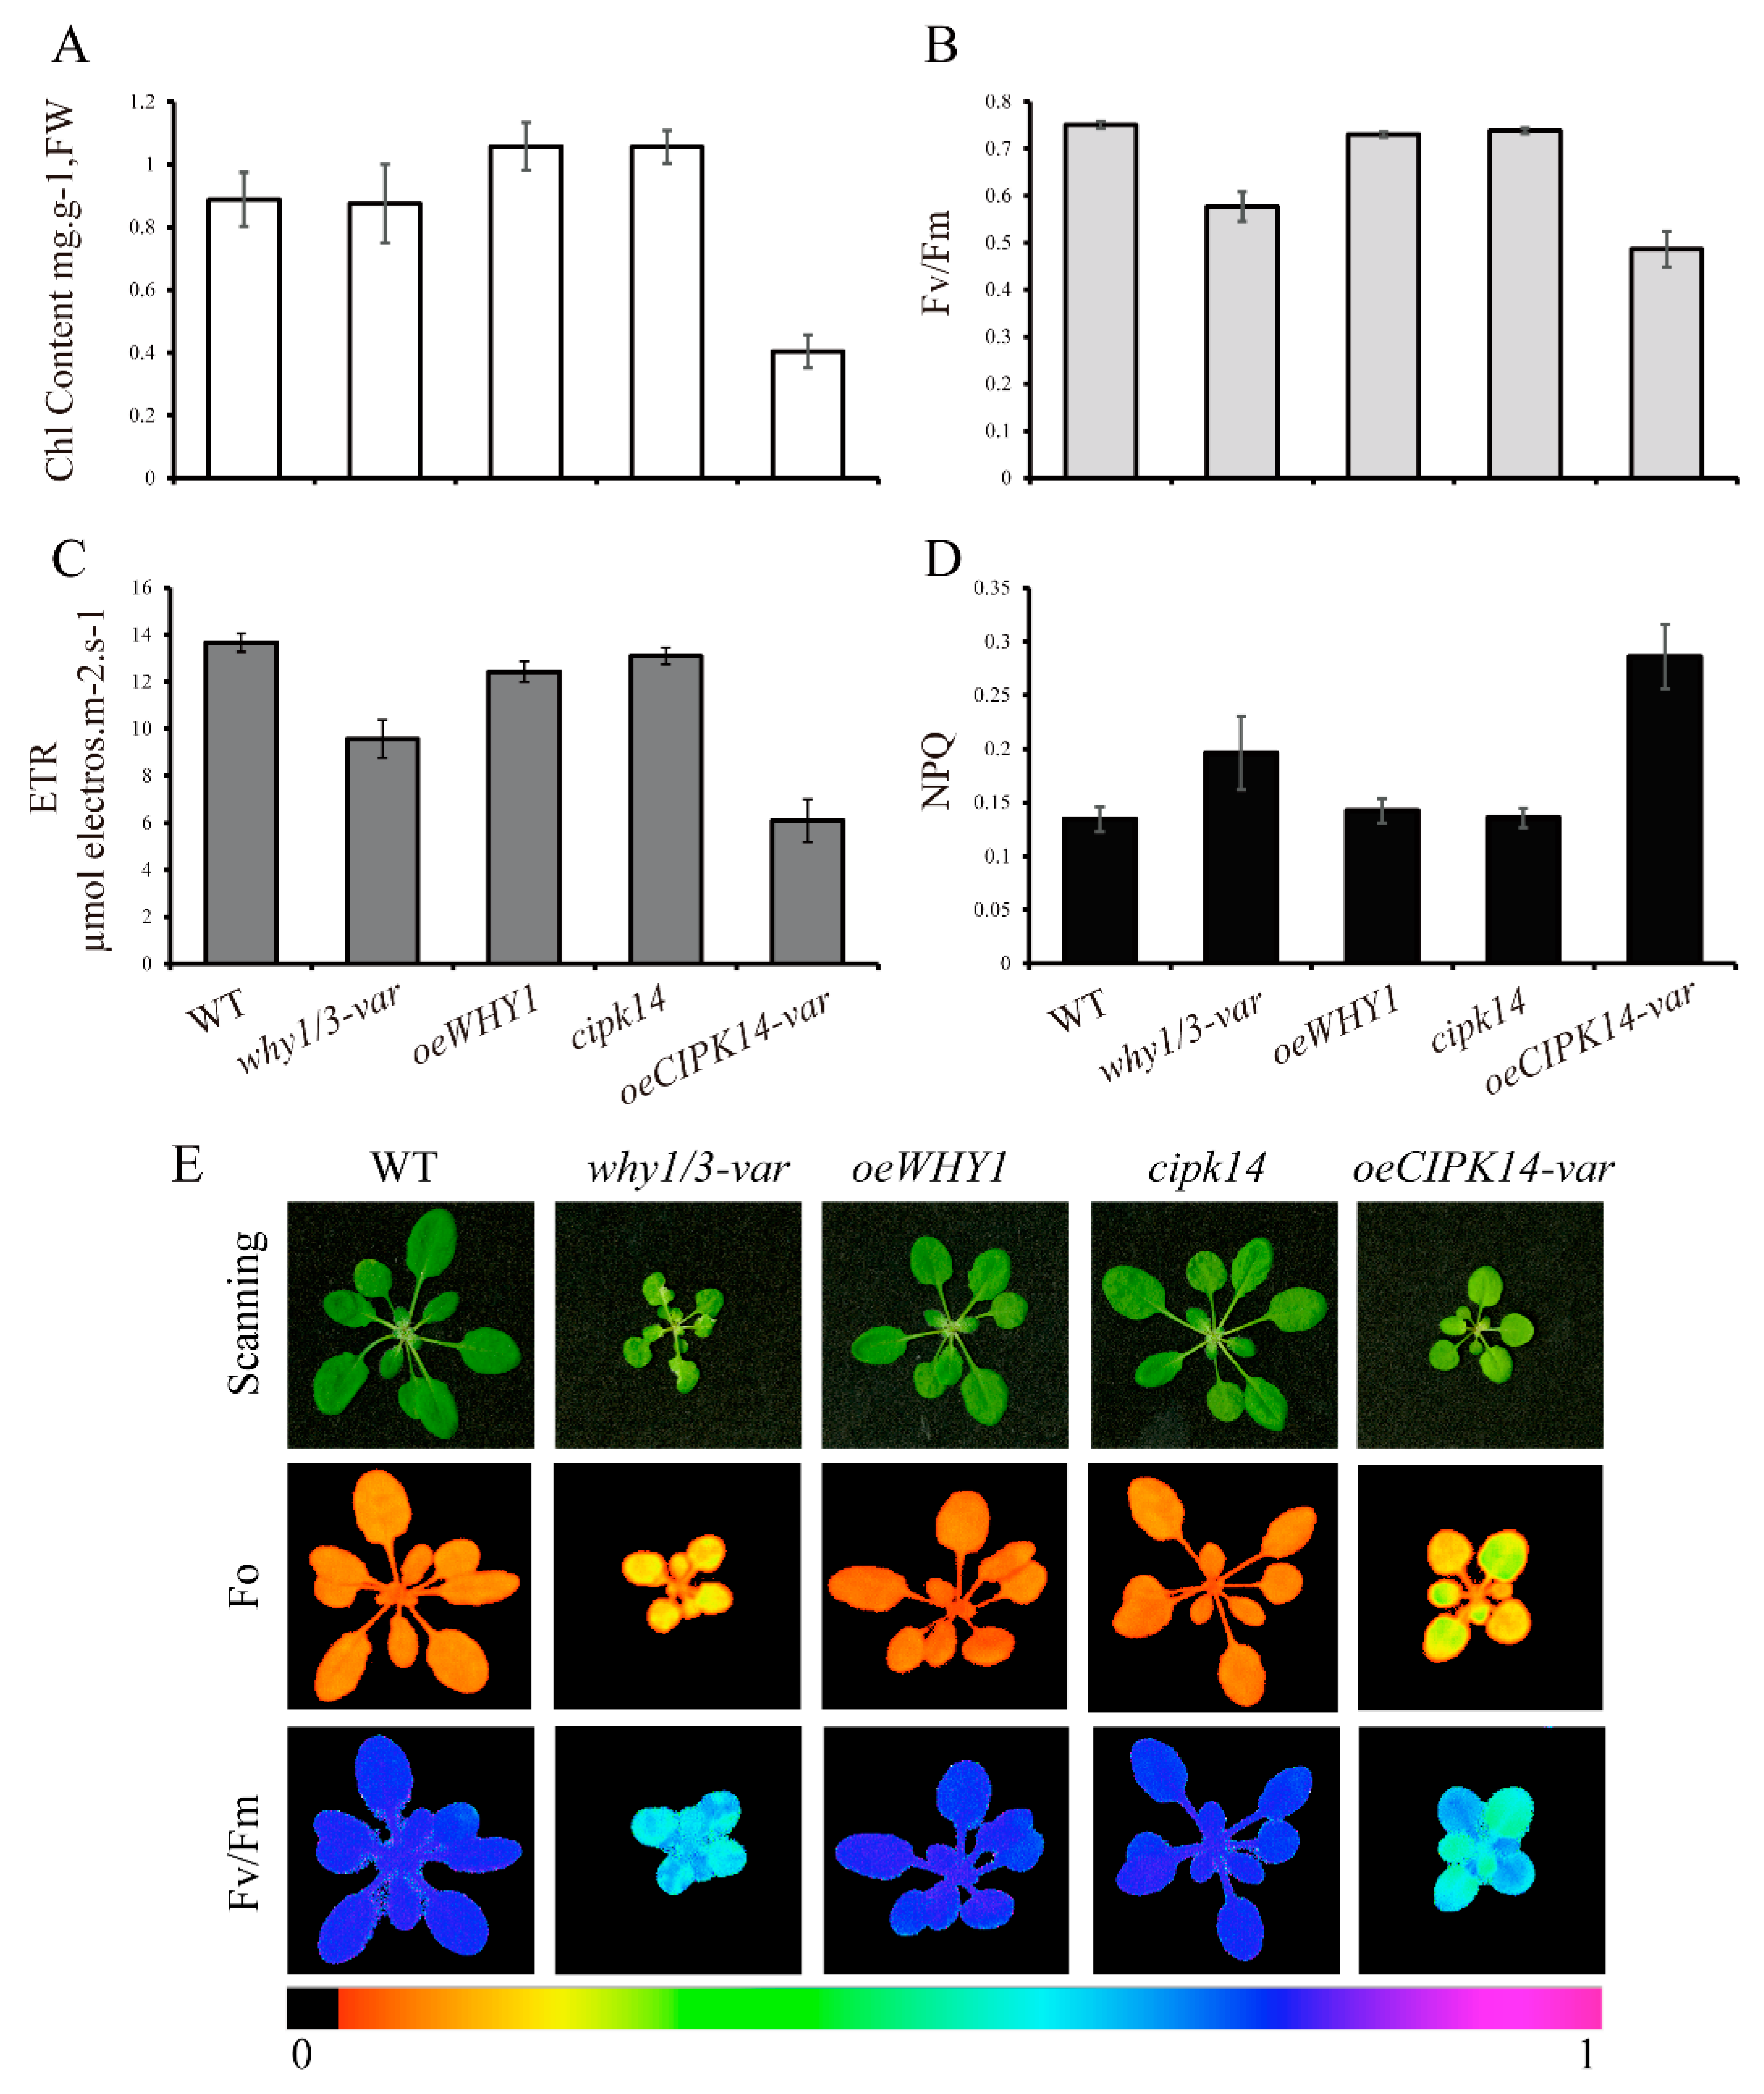
2.5. Effects of why1/3-var and oeCIPK14-var on Photosynthetic Performance

According to the above protein annotations, the majority of the differentially expressed proteins are photosynthesis-associated proteins. In order to address the relationship between protein function and the pale-green leaf phenotype in the why1/3-var and oeCIPK14-var lines, the chlorophyll contents and photosynthetic fluorescence parameters of 4-week-old plants of WHY and CIPK14 mutants were measured to determine the photosynthetic performance. Consistent with the pale-green phenotype, the chlorophyll content was lower in the oeCIPK14-var plants than in the wild type, whereas it remained unaltered in the why1/3-var line (Figure 6A). Interestingly, the chlorophyll content slightly increased in the oeWHY1 and cipk14 plants (Figure 6A). The maximum photochemical efficiency of photosystem II (Fv/Fm) significantly decreased in the why1/3-var and oeCIPK14-var plants (Figure 6B). The electron transport rates (ETRs) in why1/3-var and oeCIPK14-var were only about 70% and 45% of the WT, respectively (Figure 6C). The nonphotochemical quenching (NPQ) of photosystem II fluorescence displayed an increase in why1/3-var and oeCIPK14-var (Figure 6D), indicating that the two variegated mutants have a lower photosynthetic capacity, which is consistent with plants under high light conditions.
Fluorescence images of whole plants with different genotypes were taken using an Image-PAM (Pulse-Amplitude Modulation) measuring system, as shown in Figure 6E. The why1/3-var and oeCIPK14-var plants displayed a smaller size and variegated phenotype, as described previously [25,28]. While the oeWHY1 and cipk14 plants were almost indistinguishable from the wild type, the dark fluorescence yield (F0) of the two variegated lines was higher, but the Fv/Fm decreased markedly in the why1/3-var and oeCIPK14-var lines.
Taken together, in the why1/3-var and oeCIPK14-var plants, higher F0, lower Fv/Fm, lower ETR, and higher NPQ may lead to excessive excitation energy production, which may enhance the level of ROS production. The energy imbalance may further result in the variation of the redox state of the photosynthetic electron transport chain, triggering the relocation of WHY1 from the chloroplasts to the nucleus, where the signals are transmitted at the gene level.

3. Discussion

The pale yellowing phenotype normally appears during plastid dysfunction, such as defective plastid ribosomes, abnormal chlorophyll syntheses, or abnormal plastid RNA processing. As expected, in this study, most of differentially displayed proteins in the why1/3-var/WT oeCIPK14-var/WT plants were related to plastid dysfunction, such as photosynthesis, amino acid and protein metabolism, or defense and antioxidation.

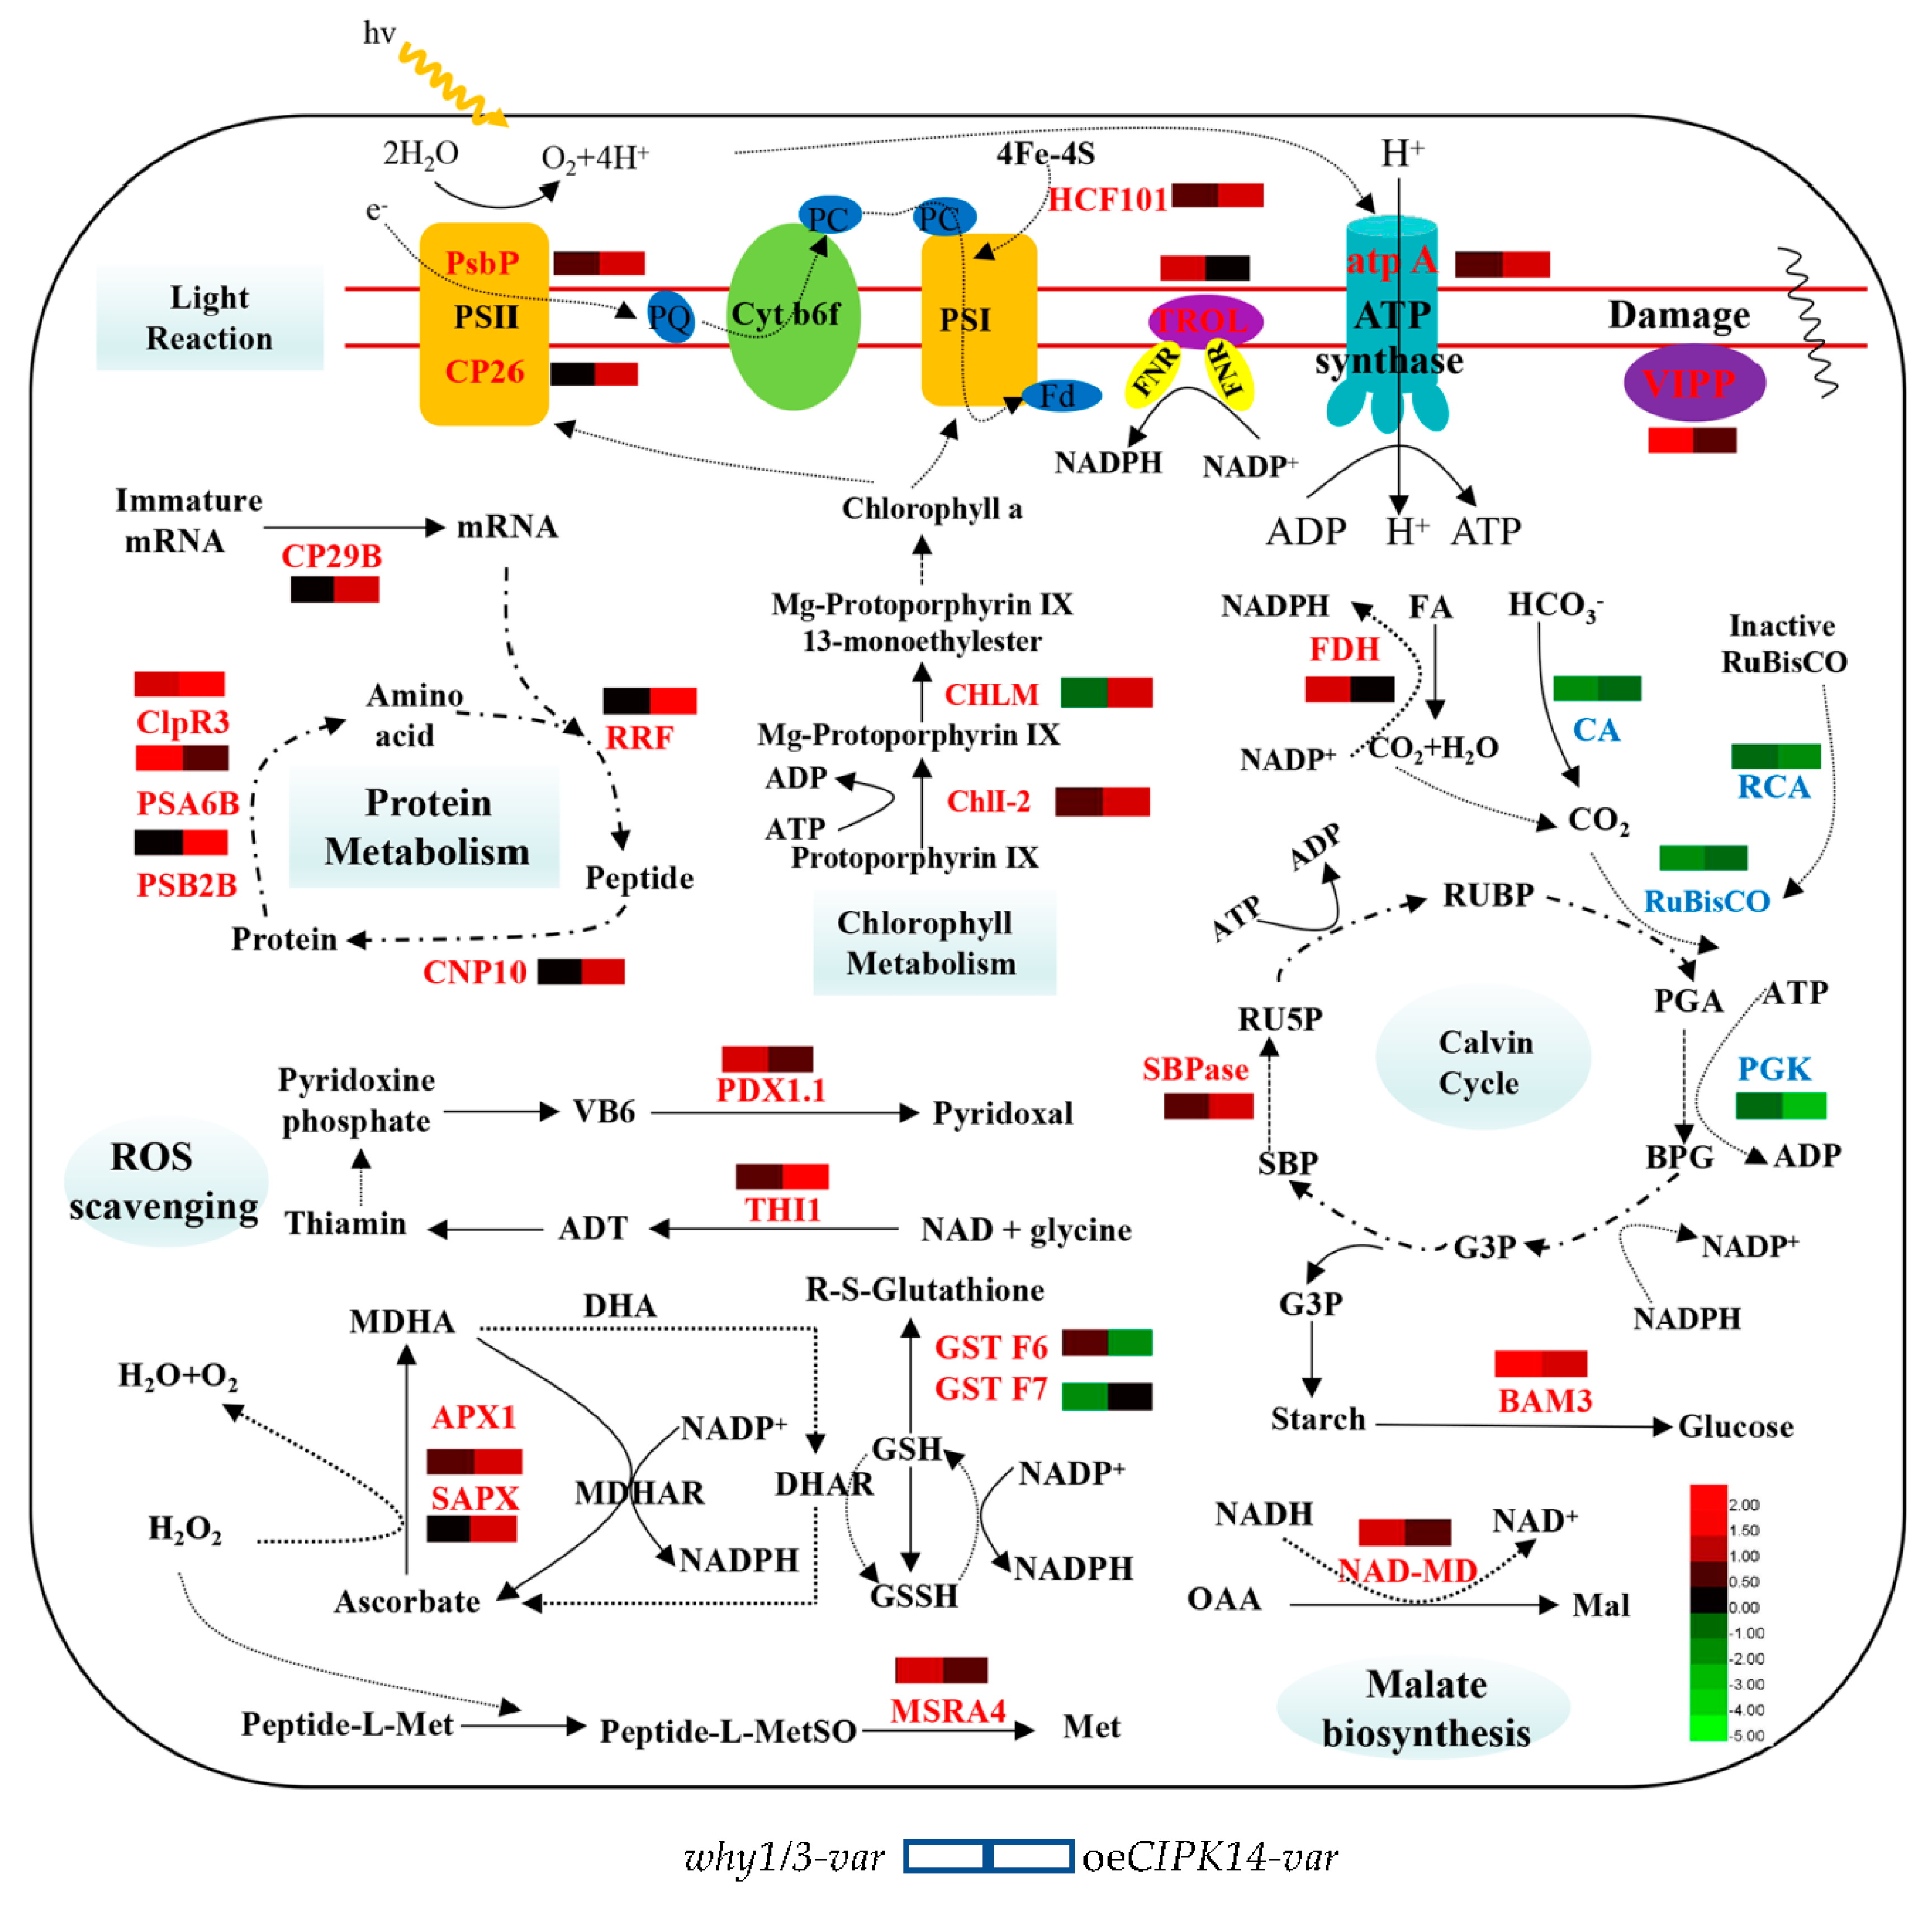
3.1. Proteins Involved in Light-Dependent Reaction of Photosynthesis

The dual-located protein WHY1 has been suggested as an ideal candidate for plastid-to-nucleus retrograde signaling [23]. In chloroplasts, WHY1 is located at the boundary between thylakoids and the nucleoids and, therefore, the WHY1 protein is presumed to be the link between the photosynthetic electron transport chain and gene expression [23]. WHY3 was found to be a cofactor of WHY1, playing a role in plastid genome stability [25] and as an activator of nuclear kinesin gene expression [17]. In our study, the results of functional classification and immunoblot analysis revealed that the following seven light reaction-related proteins exhibited greater abundance in the why1/3-var and oeCIPK14-var plants: Fe–S cluster assembly factor HCF101 (HCF101, spot 1), Magnesium-chelatase subunit ChlI-2 (ChlI-2, spot 4), atpA (spot 3), Chlorophyll a-b binding protein CP26 (CP26, spot 12), PsbP domain-containing protein 4 (PPD4, spot 28), TROL (spot 35), and Cyt f. PPD4 and CP26 are components of PS II [29,30]. CP26 is known as an antenna protein required for the formation of PS II supercomplexes and for the energy transfer from trimeric light-harvesting complex II (LHCII) to the reaction center of PS II [31]. The Cyt b6f complex modulates the electron transfer from PS II to PS I via the quinone pool and plastocyanin [28]. The increase in abundance of Cyt f may accelerate the ETR, which is lower in the why1/3-var and oeCIPK14-var plants. HCF101 has been shown to serve as a chloroplast scaffold protein for the assembly and transfer of [4Fe–4S] clusters, which are essential for the accumulation of the core complex PS I and soluble ferredoxin-thioredoxin reductases [32]. ATP synthase is responsible for ATP production, and upregulation of atpA was observed in our proteomic data. As expected, we also found that the TROL (spot 35) protein is required for tethering FNR and sustaining efficient linear electron flow (LEF) [33]. The TROL knockout mutant displays a lower ETR and increased NPQ, further confirming our previous results demonstrating that the why1 line expresses low levels of TROL protein [24]. Consistent with the pale-green phenotype of the two variegated lines, an enzyme for chlorophyll biosynthesis, ChlI-2, showed upregulation. This enzyme catalyzes the first committed step toward chlorophyll synthesis, accompanying Mg2+ insertion into protoporphyrin IX and producing Mg-protoporphyrin IX [34]. In addition, another key enzyme for chlorophyll biosynthesis—magnesium protoporphyrin IX methyltransferase (spot 26)—also exhibited upregulation in the oeCIPK14-var [35], which suggests that plants may increase the accumulation of chlorophyll and transport it to the two PSs for the synthesis of the LHC complex, thus maintaining the efficiency of electron transfer and alleviating the stress caused by excessive energy. Thylakoid lumenal 29 kDa protein (TL29, spot 54) is located in the thylakoid lumen of chloroplasts [36], and it was identified as a homolog of ascorbate peroxidase, associated with PS II [37]. This protein was found in greater abundance in the why1/3-var and oeCIPK14-var lines.

3.2. Proteins Involved in the Calvin Cycle

The expression of several essential proteins of the Calvin cycle were downregulated in the why1/3-var and oeCIPK14-var lines, including ribulose bisphosphate carboxylase large chain (RBCL, spots 14, 23, 27, 40), ribulose bisphosphate carboxylase small chain (RBCS, spots 17, 18, 43, 45), ribulose-1,5-bisphosphate carboxylase/oxygenase (Rubisco) activase (RCA, spot 2), and Phosphoglycerate kinase (PGK, spot 5). It is well known that Rubisco—a complex of eight RBCL and eight RBCS subunits containing eight catalytic sites—is the most abundant protein on Earth, utilized by autotrophic organisms to transform CO2 into organic compounds via the Calvin–Benson cycle [38]. Rubisco catalyzes the rate-limiting step of photosynthetic carbon reduction for CO2 assimilation [38]. In this study, except for spot 32, all other RBCL and RBCS protein levels decreased. In Arabidopsis, the activity of Rubisco is inhibited by RCA, which can release ribulose-1,5-bisphosphate (RuBP) from the active sites of Rubisco using the energy from ATP hydrolysis by increasing the ratios of ADP to ATP [39]. This allows CO2 to activate the enzyme [39], indicating that the redox state of the photosynthetic electron transport chain has changed, and the production of ATP is inhibited. PGK catalyzes the conversion of 3-phosphoglycerate to 1,3-bisphosphoglycerate, which is a substrate for the synthesis of glyceraldehyde-3-phosphate (G3P) in the Calvin–Benson cycle, where it serves as a substrate for the synthesis of other carbohydrates [40]. Carbonic Anhydrase 1 (CA, spot 59) is located in the chloroplast and catalyzes the conversion of H2O and CO2 to HCO3, which involves CO2-dependent stomatal closing [41]. The expression of CA was also decreased in the why1/3-var and oeCIPK14-var lines, implying a change to the photosynthetic efficiency.

3.3. Proteins Associated with Defense and Antioxidation

The results of photosynthetic performance analysis suggest that the why1/3-var and oeCIPK14-var lines have lower photosynthetic electron transport efficiencies. However, several defense and antioxidation-related proteins (spots 9, 10, 16, 25, 37, 38, 54, and 61) were upregulated in why1/3-var and oeCIPK14-var for ROS scavenging. Among them, thiamine thiazole synthase (THI, spot 9) and Pyridoxal 5-phosphate synthase subunit PDX1.1 (PDX, spot 37) have shown upregulated expression under oxidative stress [42]. THI (spot 9) is involved in the biosynthesis of the thiamine (vitamin B1) precursor thiazole [43]. PDX (spot 37) catalyzes the formation of pyridoxal 5′-phosphate—a phosphorylated derivative of VB6—which can act as a coenzyme for numerous metabolic enzymes and has been identified as a potent antioxidant [44,45]. The identified protein sAPX (spot 10) and l-ascorbate peroxidase APX1 (spot 25) have been proposed to reduce the generation of ROS and enhance the plant’s tolerance to oxidative stress [46,47]. Additional proteins characterized in this study include: thioredoxin-like protein CDSP32 (spot 38), which has been reported as a thioredoxin and is involved in plastid responses to oxidative stress [48]; the enzyme peptide methionine sulfoxide reductase (PMSR) (spot 61), which catalyzes the reduction of Met sulfoxides back to Met [49], has been shown to repair oxidative damage in chloroplast proteins [48]; VIPP1 (spot 57) is an essential component for thylakoid biogenesis in chloroplasts [50], and its expression is upregulated for membrane maintenance when the membrane integrity of the chloroplast envelope is disturbed [51]. Two members of the glutathione-S-transferase (GST) protein family, like glutathione-S-transferase F6 (spot 20, GSTF6) and Glutathione-S-transferase F7 (spot 60, GSTF7), were identified in this study. GSTF6 (spot 20) was upregulated in why1/3-var, but downregulated in oeCIPK14-var. GSTF7 was decreased in why1/3-var. Taken together, these findings indicate that WHY1/WHY3 or CIPK14 or both are involved in ROS balance. Excessive excitation energy may trigger the accumulation of ROS in chloroplasts in the why1/3 or oeCIPK14 lines.

3.4. Proteins Related to Protein Metabolism

Intriguingly, in the present study, several identified protein spots were found to be involved in protein metabolism. Among them, five spots (spots 11, 19, 29, 30, and 39) showed an increased abundance in the why1/3-var and oeCIPK14-var lines. For example, the ATP-dependent Clp protease is a plastid protease that plays an essential role in chloroplast development and maintenance [52,53]. ATP-dependent Clp protease proteolytic subunit-related protein 3 (spot 11) was upregulated in the why1/3-var and oeCIPK14-var lines, indicating chloroplast dysfunction. In general, selective proteolysis in plants is largely mediated by the ubiquitin (Ub)/26S proteasome system [54], where abnormal polypeptides are marked by the covalent attachment of Ub and are degraded by the 26S proteasome [55], which is composed of two subparticles—the 20S core protease and the 18S regulatory particle [55]. The 20S core protease subunit beta type-2-B (spot 29) and proteasome subunit alpha type-6-B (spot 39) [55] and protease subunit alpha type-6-A (spot 13) were all downregulated in the why1/3-var and oeCIPK14-var lines. Ribosome-recycling factor (spot 30, RRF), located in the chloroplast [56], increased in the oeCIPK14-var lines; RRF is essential for embryogenesis and chloroplast biogenesis, and is thought to be involved in the translation of chloroplast proteins [56]. The chaperonin CNP10 (spot 19) was also shown to localize to the chloroplasts [57]. It was upregulated in oeCIPK14-var, and is essential for proteins involved in cellular protein folding [57]. In addition, our data show that RNA-binding protein CP29B (spot 8) was upregulated in the oeCIPK14-var; CP29B is a kind of a chloroplast RNA-binding protein and may be involved in the processing of chloroplast RNA [58]. These results demonstrate that CIPK14-mediated plastid WHY1/WHY3 proteins might be involved in plastid protein metabolism, including protein translation, synthesis, and proteolysis (Figure 7).
Although the trends in altered transcription levels of the encoding genes of these proteins were not fully confirmed, on the one hand, the discrepancy between mRNA and protein levels may be caused by the different half-lives of protein and mRNA, or post-transcriptional or post-translational processing and modification. In fact, several identified protein spots are involved in protein metabolism or post-transcriptional or post-translational processing and modification. On the other hand, it seems that the alteration of the transcriptional levels in the why1/3-var and oeCIPK14-var lines could not be reverted in the oeWHY1 or cipk14 mutants. It has been proposed that, in maize, why1 plants with the pale yellowing phenotype may be related to impaired RNA processing [19,20]; however, in Arabidopsis, only double-mutated why1/3 showed the pale yellowing phenotype [25]. This suggests that the WHY1 protein in monocotyledon plants shares functions with both WHY1 and WHY3 in dicotyledonous Arabidopsis. This will be addressed by genetic rescue experiments in the future. It is not unexpected that the cipk14 plant cannot recused the leaf pale yellowing phenotype of oeCIPK14-var and the gene expression pattern of oeCIPK14-var. Actually, CIPK14 mainly acts as a kinase, phosphorylating WHY1 and thus inducing WHY1 to enter the nucleus; cipk14 mostly shows the staygreen phenotype [28], with only 5% of the plants showing pale yellowing. The pale yellowing of oeCIPK14-var leaves resulting from WHY1/WHY3 deficiency in plastids can be rescued by overexpressing the plastid isoform of WHY1 [28]. In fact, in this study, five proteins (ClpR3, RBL, RBS, RRF, and BAM3) showed altered abundance in the why1/3-var and oeCIPK14-var lines; interestingly, their mutants have been reported showing similar leaf yellowing and small rosette phenotypes [53,56,59]. The speculated mechanism of action connecting protein metabolism with the CIPK14 and WHIRLY protein-mediated pale yellowing of leaves will be addressed in future studies.

4. Materials and Methods

4.1. Plant Materials and Growth Conditions

Plants of Arabidopsis thaliana Columbia ecotype and the mutants were cultivated in a vermiculite matrix after vernalization. Plants were grown in a controlled climatic chamber at 13/11 h light/dark cycle with a periodic temperature of 22 °C/18 °C, a light intensity of 60 μmol·m−2s−1, and a relative humidity of 65%. The rosette leaves of each plant genotype were collected at 4 weeks after germination. The samples were frozen in liquid nitrogen and stored at −80 °C before use. Three biological replicates were used for each experiment.
T-DNA insertion lines SALK_023713 (why1) for WHY1 and SALK_009699 (cipk14) for CIPK14 were provided by NASC. Seeds of the WHY1 and WHY3 double-mutant (why1/3) were kindly provided by Normand Brisson, Department of Biochemistry, Montreal University, Montreal, Canada. Overexpression WHY1 (oeWHY1) and CIPK14 (oeCIPK14) lines were prepared from previous work [28].

4.2. Chlorophyll Content Measurement and Photosynthetic Parameters Analysis

Colored threads were used for labeling rosette leaves after their emergence, as previously described [8]. The weight of five leaves from 12 independent 4-week-old plants were measured, and each leaf was mixed with 1 mL 95% ethanol (v/v) in a 1.5 milliliter (mL) Eppendorf tube. Pigments were extracted after incubating for 48 h in the dark. The absorbance of the extracts was measured at 470, 649, and 665 nm by the Flexstation 3 Microplate Reader (Molecular Devices, Silicon Valley, CA, USA), and the total chlorophyll content was determined according the method described in [60].
Chlorophyll fluorescence was measured, and the chlorophyll fluorescence image was taken using an Imaging-PAM-Maxi (Walz, Effeltrich, Germany) as described by Shao [61]. Five leaves from 4-week-old plants were selected for measurement after 30 min adaptation to darkness. The minimal fluorescence yield (Fo) was measured at a low light intensity, and the maximal fluorescence yield (Fm) was measured under saturation pulse. Then, all of the leaves were exposed to a light intensity of 54 μmol·m−2s−1 photosynthetically active radiation (PAR), the kinetic curves were gained according to the manufacturer’s instructions for the instrument. The maximum photochemical efficiency of photosystem II (Fv/Fm), the nonphotochemical quenching (NPQ) of photosystem II fluorescence, and the electron transport rate (ETR) were calculated by control software. The chlorophyll fluorescence images of whole plants were taken after 30 min adaptation to darkness. Through one saturation pulse, the values of Fo and Fv/Fm were calculated, and fluorescence images were viewed using Imaging-PAM-Maxi (Walz, Effeltrich, Germany).

4.3. Protein Extraction and 2-DE Analysis

The total protein of rosette leaves was extracted by the phenol method [62]. Briefly, approximately 3 g material was ground with liquid nitrogen, then suspended in 12 mL ice-cold extraction buffer (50 mM PBS (PH 7.8), 5 mM EDTA, 2% (v/v) β-mercaptoethanol, 0.5% (v/v) NP-40, 1 mM Phenylmethane-sulfonyl fluoride (PMSF), 1% (w/v) polyvinylpolypyrrolidone (PVPP)) on ice and vortexed for 5 min. An equal volume of ice-cold Tris-saturation phenol (pH 8.0) was added to the suspension and vortexed for 10 min. The phenol phase was collected after centrifugation (4 °C, 15 min, 16,000× g), and proteins were precipitated overnight with five volumes of 0.1 M methanol/ammonium acetate at −20 °C. The protein pellets were collected after centrifugation (4 °C, 15 min, 16,000× g) and rinsed three times in ice-cold acetone/13 mM dithiothreitol (DTT). Between each wash, the proteins were incubated for 1 h at −20 °C. After centrifugation (4 °C, 15 min, 16,000× g), the supernatant was discarded carefully, and the protein pellets were air-dried.
The protein pellets were dissolved in sample lysis buffer (7 M urea, 2 M thiourea, 4% CHAPS, 65 mM DTT, 2% IPG Buffer pH 3–10 NL), and protein concentrations were determined by Bradford method [63]. A total of 1.5 mg protein was loaded onto an IPG Strip (24 cm, 3–10 NL) and rehydrated over 12 h at 25 °C. An Ettan IPGphor system (GE Healthcare, Uppsala, Sweden) was employed for Isoelectric focusing (IEF) using the program: 30 V (0.5 h), 100 V (1 h), 200 V (1 h), 500 V (3 h), 1 kV (1 h), 10 kV (2 h, gradient), and, finally, 10 kV up to 60,000 Vhs. Then, the strips were equilibrated for 15 min in equilibration buffer I (50 mM Tris–HCl (pH 8.8), 6 M urea, 30% (v/v) glycerol, 2% (w/v) SDS, 1% DTT) and in equilibration buffer II (50 mM Tris–HCl (pH 8.8), 6 M urea, 30% (v/v) glycerol, 2% (w/v) SDS, 2.5% iodoacetamide) for 15 min with gentle shaking. After equilibration, the strips were transferred to 12.5% SDS-PAGE, and electrophoresis was performed with an Ettan DALT-six System (GE Healthcare, Chicago, IL, USA) at 10 mA per gel for 1 h and then 15 mA per gel overnight. After electrophoresis, the 2-DE gels were stained by Coomassie Brilliant Blue R250 (CBB R250). Three independent biological replicates were used for each genotype.

4.4. Data Analysis In-Gel Protein Digestion and Protein Identification

Gels were scanned at a resolution of 600 dpi with a scanner (EPSON Expression 11000XT, Suwa, Japan), and the images were quantitatively analyzed by ImageMasterTM 2D Platinum 7.0 software (GE Healthcare, Uppsala, Sweden). The differential protein spots were in-gel digested and identified according to the methods as described [64]. In short, the protein spots were excised from the CCB R250-stained gels and subjected to in-gel trypsin digestion for 12 h at 37 °C. Peptides were extracted twice in 50% ACN/0.1% TFA, then the extracts were dried completely by a vacuum centrifuge. Peptide mixtures were dissolved in 0.1% TFA, and 0.8 μL of the peptide solution was mixed with 0.4 μL matrix α-cyano-4-hydroxycinnamic acid in 30% ACN/0.1% TFA before spotting on the target plate. An AB SCIEX MALDI TOF-TOFTM 5800 Analyzer (AB SCIEX, Foster City, CA, USA) equipped with a neodymium:yttrium-aluminum-garnet laser (laser wavelength was 349 nm) was employed for acquiring peptide mass fingerprints (PMFs). All automatic data analyses and database searches were conducted using GPS Explorer TM software (version 3.6, AB SCIEX) running a mascot search algorithm (v2.3, Matrix Science, London, UK) for protein identification. Proteins with a protein score confidence interval (CI) above 95% (protein score > 61) were considered confident identifications. The identified proteins were then matched to specific processes or functions by searching Uniprot.

4.5. RNA Extraction, Reverse Transcription, and qRT-PCR Analysis

Total RNA was extracted from the 4-week-old rosette leaves of Arabidopsis using Trizol Reagents (TransZol up, TRANSGEN BIOTECH, Beijing, China) according to the manufacturer’s protocol. First-strand cDNA was synthesized using cDNA Synthesis SuperMix with gDNA Removal (TRANSGEN BIOTECH, Beijing, China) according to the manufacturer’s instructions. Specific oligonucleotide primers were designed by http://quantprime.mpimp-golm.mpg.de and synthesized by Sangon Biotech (Shanghai, China). Quantitative real-time PCR was performed using the Ultra SYBR Mixture (CWBIO, Beijing, China) according to the manufacturer’s instructions using a Lightcycler® 96 (Roche, Basel, Switzerland). GAPC2 was used as an internal standard, and relative gene expression was analyzed using the 2−ΔΔCT Method. The primer pairs are shown in Supplemental Table S1.

4.6. Immunological Analyses

Proteins were extracted from rosette leaves according to the phenol method [62]. Equivalent quantities of proteins were determined by the Bradford method [63]. Proteins were separated on 12.5% polyacrylamide gels [65], transferred to PVDF membranes by semi-dry electroblotting, and immunodetected according to protocols as described in [24]. Primary antibodies directed toward RBCL, RBCS, and PSBR were purchased from Agrisera (Vännäs, Sweden).

5. Conclusions

We conclude that in the why1/3-var or oeCIPK14-var lines, most differentially expressed proteins are involved in photosynthesis, amino acid and protein metabolism, or defense and antioxidation (Figure 7). They are related to photosynthesis and the response to insufficient energy supply. The regulation of CIPK14 phosphorylation-mediated WHIRLY1/WHIRLY3 deficiency in plastids is speculated to be controlled by a mechanism of amino acid and plastid protein metabolism at the post-transcriptional level. The details of this mechanism will be addressed in future studies.

Supplementary Materials

Supplementary materials can be found at https://www.mdpi.com/1422-0067/19/8/2231/s1.

Author Contributions

Y.M. designed the research; Z.G., W.W. and X.Y. performed all experiments. W.L. helped to analyze the data; Z.G. and Y.M. analyzed data and wrote the paper.

Acknowledgments

We acknowledge Normand Brisson (Department of Biochemistry, Montreal University, Montreal, Canada), who kindly provided the why1/3 double mutants. T-DNA insertion line SALK_009699 (cipk14) for CIPK14 was provided by NASC. This work was supported by a grant of NSFC (31470383, 31770318) and a grant of NSF of Fujian Province Key Project (2015N0019).

Conflicts of Interest

The authors declare no conflict of interest.

Abbreviations

ADPadenosine diphosphate
ADTadenosine diphosphate 5-(2-hydroxyethyl)-4-methylthiazole-2-carboxylic acid
APX1l-ascorbate peroxidase 1
ATPadenosine triphosphate
ATPAATP synthase alpha subunit
BAM3beta-amylase 3
BPG1,3-diphosphoglycerate
CAcarbonic anhydrase
ChlI-2magnesium-chelatase subunit ChlI-2
CHLMmagnesium protoporphyrin IX methyltransferase
CLPR3ATP-dependent Clp protease proteolytic subunit-related protein 3
CNP1010 kDa chaperonin
CP26chlorophyll a-b binding protein CP26
CP29BRNA-binding protein CP29B
Cyt b6fcytochrome b6f
DHARdehydroascorbate reductase
FAformate
Fdferredoxin
FDHformate dehydrogenase
FNRferredoxin-NADP (H) oxidoreductase
G3Pglyceraldehydes-3-phosphate
GSHreduced glutathione
GSSHoxidized glutathione
GSTglutathione S-transferase
HCF101Fe-S cluster assembly factor HCF101
Malmalate
MDmalate dehydrogenase
MDHAmonodehydroascorbate
MDHARMDHA reductase
Metmethionine
MetSOmethionine sulfoxide
MSRA4peptide methionine sulfoxide reductase A4
NADP+/NADPHnicotinamide adenine dinucleotide phosphate
NAD+/NADHnicotinamide adenine dinucleotide
OAAoxaloacetic acid
PCplastocyanin
PDX1.1pyridoxal 5′-phosphate synthase subunit PDX1.1
PGA3-phosphoglycerate
PGKphosphoglycerate kinase
PQplastoquinone
PSIphotosystem I
PSIIphotosystem II
PSA6Bproteasome subunit alpha type-6-B
PSB2Bproteasome subunit beta type-2-B
PsbPPsbP domain-containing protein 4
RCAribulose-1,5-bisphosphate carboxylase/oxygenase activase
RRFribosome-recycling factor
Ru5Pribulose-5-phosphate
RuBisCOribulose-1,5-bisphosphate carboxylase/oxygenase
THIthiamine thiazole synthase
TROLthylakoid rhodanese-like protein
SBPsedoheptulose-1,7-bisphosphate
SBPasesedoheptulose-1,7-bisphosphatase
SAPXstromal ascorbate peroxidase
VB6vitamin B6
VIPP1vesicle-inducing protein in plastids

References

  1. Lim, P.O.; Kim, H.J.; Nam, H.G. Leaf senescence. Ann. Rev. Plant Biol. 2007, 58, 115–136. [Google Scholar] [CrossRef] [PubMed]
  2. Pottier, M.; Masclaux-Daubresse, C.; Yoshimoto, K.; Thomine, S. Autophagy as a possible mechanism for micronutrient remobilization from leaves to seeds. Front. Plant Sci. 2014, 5, 11. [Google Scholar] [CrossRef] [PubMed]
  3. Balazadeh, S.; Riano-Pachon, D.M.; Mueller-Roeber, B. Transcription factors regulating leaf senescence in Arabidopsis thaliana. Plant Biol. 2008, 10 (Suppl. 1), 63–75. [Google Scholar] [CrossRef] [PubMed]
  4. Balazadeh, S.; Siddiqui, H.; Allu, A.D.; Matallana-Ramirez, L.P.; Caldana, C.; Mehrnia, M.; Zanor, M.I.; Kohler, B.; Mueller-Roeber, B. A gene regulatory network controlled by the NAC transcription factor ANAC092/AtNAC2/ORE1 during salt-promoted senescence. Plant J. 2010, 62, 250–264. [Google Scholar] [CrossRef] [PubMed]
  5. Balazadeh, S.; Kwasniewski, M.; Caldana, C.; Mehrnia, M.; Zanor, M.I.; Xue, G.P.; Mueller-Roeber, B. ORS1, an H2O2-responsive NAC transcription factor, controls senescence in Arabidopsis thaliana. Mol. Plant 2011, 4, 346–360. [Google Scholar] [CrossRef] [PubMed]
  6. Zentgraf, U.; Laun, T.; Miao, Y. The complex regulation of WRKY53 during leaf senescence of Arabidopsis thaliana. Eur. J. Cell Biol. 2010, 89, 133–137. [Google Scholar] [CrossRef] [PubMed]
  7. Zhou, X.; Jiang, Y.; Yu, D. WRKY22 transcription factor mediates dark-induced leaf senescence in Arabidopsis. Mol. Cells 2011, 31, 303–313. [Google Scholar] [CrossRef] [PubMed] [Green Version]
  8. Hinderhofer, K.; Zentgraf, U. Identification of a transcription factor specifically expressed at the onset of leaf senescence. Planta 2001, 213, 469–473. [Google Scholar] [CrossRef] [PubMed]
  9. Miao, Y.; Jiang, J.; Ren, Y.; Zhao, Z. The single-stranded DNA-binding protein WHIRLY1 represses WRKY53 expression and delays leaf senescence in a developmental stage-dependent manner in Arabidopsis. Plant Physiol. 2013, 163, 746–756. [Google Scholar] [CrossRef] [PubMed]
  10. Krause, K.; Kilbienski, I.; Mulisch, M.; Rodiger, A.; Schafer, A.; Krupinska, K. DNA-binding proteins of the Whirly family in Arabidopsis thaliana are targeted to the organelles. FEBS Lett. 2005, 579, 3707–3712. [Google Scholar] [CrossRef] [PubMed]
  11. Grabowski, E.; Miao, Y.; Mulisch, M.; Krupinska, K. Single-stranded DNA-binding protein Whirly1 in barley leaves is located in plastids and the nucleus of the same cell. Plant Physiol. 2008, 147, 1800–1804. [Google Scholar] [CrossRef] [PubMed]
  12. Desveaux, D.; Marechal, A.; Brisson, N. Whirly transcription factors: Defense gene regulation and beyond. Trends Plant Sci. 2005, 10, 95–102. [Google Scholar] [CrossRef] [PubMed]
  13. Isemer, R.; Mulisch, M.; Schafer, A.; Kirchner, S.; Koop, H.U.; Krupinska, K. Recombinant Whirly1 translocates from transplastomic chloroplasts to the nucleus. FEBS Lett. 2012, 586, 85–88. [Google Scholar] [CrossRef] [PubMed]
  14. Desveaux, D.; Despres, C.; Joyeux, A.; Subramaniam, R.; Brisson, N. PBF-2 is a novel single-stranded DNA binding factor implicated in PR-10a gene activation in potato. Plant Cell 2000, 12, 1477–1489. [Google Scholar] [CrossRef] [PubMed]
  15. Desveaux, D.; Subramaniam, R.; Despres, C.; Mess, J.N.; Levesque, C.; Fobert, P.R.; Dangl, J.L.; Brisson, N. A “Whirly” transcription factor is required for salicylic acid-dependent disease resistance in Arabidopsis. Dev. Cell 2004, 6, 229–240. [Google Scholar] [CrossRef]
  16. Yoo, H.H.; Kwon, C.; Lee, M.M.; Chung, I.K. Single-stranded DNA binding factor AtWHY1 modulates telomere length homeostasis in Arabidopsis. Plant J. 2007, 49, 442–451. [Google Scholar] [CrossRef] [PubMed] [Green Version]
  17. Xiong, J.Y.; Lai, C.X.; Qu, Z.; Yang, X.Y.; Qin, X.H.; Liu, G.Q. Recruitment of AtWHY1 and AtWHY3 by a distal element upstream of the kinesin gene AtKP1 to mediate transcriptional repression. Plant Mol. Biol. 2009, 71, 437–449. [Google Scholar] [CrossRef] [PubMed]
  18. Krupinska, K.; Dahnhardt, D.; Fischer-Kilbienski, I.; Kucharewicz, W.; Scharrenberg, C.; Trosch, M.; Buck, F. Identification of WHIRLY1 as a Factor Binding to the Promoter of the Stress- and Senescence-Associated Gene HvS40. J. Plant Growth Regul. 2014, 33, 91–105. [Google Scholar] [CrossRef]
  19. Prikryl, J.; Watkins, K.P.; Friso, G.; van Wijk, K.J.; Barkan, A. A member of the Whirly family is a multifunctional RNA- and DNA-binding protein that is essential for chloroplast biogenesis. Nucleic Acids Res. 2008, 36, 5152–5165. [Google Scholar] [CrossRef] [PubMed]
  20. Melonek, J.; Mulisch, M.; Schmitz-Linneweber, C.; Grabowski, E.; Hensel, G.; Krupinska, K. Whirly1 in chloroplasts associates with intron containing RNAs and rarely co-localizes with nucleoids. Planta 2010, 232, 471–481. [Google Scholar] [CrossRef] [PubMed]
  21. Pfalz, J.; Liere, K.; Kandlbinder, A.; Dietz, K.J.; Oelmuller, R. pTAC2, -6, and -12 are components of the transcriptionally active plastid chromosome that are required for plastid gene expression. Plant Cell 2006, 18, 176–197. [Google Scholar] [CrossRef] [PubMed]
  22. Stroher, E.; Dietz, K.J. The dynamic thiol-disulphide redox proteome of the Arabidopsis thaliana chloroplast as revealed by differential electrophoretic mobility. Physiol. Plant. 2008, 133, 566–583. [Google Scholar] [CrossRef] [PubMed]
  23. Foyer, C.H.; Karpinska, B.; Krupinska, K. The functions of WHIRLY1 and REDOX-RESPONSIVE TRANSCRIPTION FACTOR 1 in cross tolerance responses in plants: A hypothesis. Philos. Trans. R. Soc. Lond. Ser. B Biol. Sci. 2014, 369, 20130226. [Google Scholar] [CrossRef] [PubMed]
  24. Huang, D.; Lin, W.; Deng, B.; Ren, Y.; Miao, Y. Dual-Located WHIRLY1 Interacting with LHCA1 Alters Photochemical Activities of Photosystem I and Is Involved in Light Adaptation in Arabidopsis. Int. J. Mol. Sci. 2017, 18, 2352. [Google Scholar] [CrossRef] [PubMed]
  25. Marechal, A.; Parent, J.S.; Veronneau-Lafortune, F.; Joyeux, A.; Lang, B.F.; Brisson, N. Whirly proteins maintain plastid genome stability in Arabidopsis. Proc. Natl. Acad. Sci. USA 2009, 106, 14693–14698. [Google Scholar] [CrossRef] [PubMed] [Green Version]
  26. Lepage, E.; Zampini, E.; Brisson, N. Plastid genome instability leads to reactive oxygen species production and plastid-to-nucleus retrograde signaling in Arabidopsis. Plant Physiol. 2013, 163, 867–881. [Google Scholar] [CrossRef] [PubMed]
  27. Comadira, G.; Rasool, B.; Kaprinska, B.; Garcia, B.M.; Morris, J.; Verrall, S.R.; Bayer, M.; Hedley, P.E.; Hancock, R.D.; Foyer, C.H. WHIRLY1 Functions in the Control of Responses to Nitrogen Deficiency But Not Aphid Infestation in Barley. Plant Physiol. 2015, 168, 1140–1151. [Google Scholar] [CrossRef] [PubMed]
  28. Ren, Y.; Li, Y.; Jiang, Y.; Wu, B.; Miao, Y. Phosphorylation of WHIRLY1 by CIPK14 Shifts Its Localization and Dual Functions in Arabidopsis. Mol. Plant 2017, 10, 749–763. [Google Scholar] [CrossRef] [PubMed]
  29. Balsera, M.; Arellano, J.B.; Gutierrez, J.R.; Heredia, P.; Revuelta, J.L.; De Las Rivas, J. Structural analysis of the PsbQ protein of photosystem II by Fourier transform infrared and circular dichroic spectroscopy and by bioinformatic methods. Biochemistry 2003, 42, 1000–1007. [Google Scholar] [CrossRef] [PubMed]
  30. Jansson, S. A guide to the Lhc genes and their relatives in Arabidopsis. Trends Plant Sci. 1999, 4, 236–240. [Google Scholar] [CrossRef]
  31. De Bianchi, S.; Dall’Osto, L.; Tognon, G.; Morosinotto, T.; Bassi, R. Minor antenna proteins CP24 and CP26 affect the interactions between photosystem II subunits and the electron transport rate in grana membranes of Arabidopsis. Plant Cell 2008, 20, 1012–1028. [Google Scholar] [CrossRef] [PubMed]
  32. Schwenkert, S.; Netz, D.J.; Frazzon, J.; Pierik, A.J.; Bill, E.; Gross, J.; Lill, R.; Meurer, J. Chloroplast HCF101 is a scaffold protein for [4Fe-4S] cluster assembly. Biochem. J. 2009, 425, 207–214. [Google Scholar] [CrossRef] [PubMed]
  33. Juric, S.; Hazler-Pilepic, K.; Tomasic, A.; Lepedus, H.; Jelicic, B.; Puthiyaveetil, S.; Bionda, T.; Vojta, L.; Allen, J.F.; Schleiff, E.; et al. Tethering of ferredoxin:NADP+ oxidoreductase to thylakoid membranes is mediated by novel chloroplast protein TROL. Plant J. 2009, 60, 783–794. [Google Scholar] [PubMed] [Green Version]
  34. Kobayashi, K.; Mochizuki, N.; Yoshimura, N.; Motohashi, K.; Hisabori, T.; Masuda, T. Functional analysis of Arabidopsis thaliana isoforms of the Mg-chelatase CHLI subunit. Photochem. Photobiol. Sci. 2008, 7, 1188–1195. [Google Scholar] [CrossRef] [PubMed]
  35. Pontier, D.; Albrieux, C.; Joyard, J.; Lagrange, T.; Block, M.A. Knock-out of the magnesium protoporphyrin IX methyltransferase gene in Arabidopsis. Effects on chloroplast development and on chloroplast-to-nucleus signaling. J. Biol. Chem. 2007, 282, 2297–2304. [Google Scholar] [CrossRef] [PubMed] [Green Version]
  36. Kieselbach, T.; Hagman, Å.; Andersson, B.; Schroder, W.P. The thylakoid lumen of chloroplasts. Isolation and characterization. J. Biol. Chem. 1998, 273, 6710–6716. [Google Scholar] [CrossRef] [PubMed]
  37. Granlund, I.; Storm, P.; Schubert, M.; Garcia-Cerdan, J.G.; Funk, C.; Schroder, W.P. The TL29 protein is lumen located, associated with PSII and not an ascorbate peroxidase. Plant Cell Physiol. 2009, 50, 1898–1910. [Google Scholar] [CrossRef] [PubMed]
  38. Andersson, I.; Backlund, A. Structure and function of Rubisco. Plant Physiol. Biochem. 2008, 46, 275–291. [Google Scholar] [CrossRef] [PubMed]
  39. Portis, A.R., Jr. Rubisco activase—Rubisco’s catalytic chaperone. Photosynth. Res. 2003, 75, 11–27. [Google Scholar] [CrossRef] [PubMed]
  40. Rosa-Tellez, S.; Anoman, A.D.; Flores-Tornero, M.; Toujani, W.; Alseek, S.; Fernie, A.R.; Nebauer, S.G.; Munoz-Bertomeu, J.; Segura, J.; Ros, R. Phosphoglycerate Kinases Are Co-Regulated to Adjust Metabolism and to Optimize Growth. Plant Physiol. 2018, 176, 1182–1198. [Google Scholar] [CrossRef] [PubMed]
  41. Hu, H.; Boisson-Dernier, A.; Israelsson-Nordstrom, M.; Bohmer, M.; Xue, S.; Ries, A.; Godoski, J.; Kuhn, J.M.; Schroeder, J.I. Carbonic anhydrases are upstream regulators of CO2-controlled stomatal movements in guard cells. Nat. Cell Biol. 2010, 12, 87–93. [Google Scholar] [CrossRef] [PubMed]
  42. Tunc-Ozdemir, M.; Miller, G.; Song, L.; Kim, J.; Sodek, A.; Koussevitzky, S.; Misra, A.N.; Mittler, R.; Shintani, D. Thiamin confers enhanced tolerance to oxidative stress in Arabidopsis. Plant Physiol. 2009, 151, 421–432. [Google Scholar] [CrossRef] [PubMed]
  43. Belanger, F.C.; Leustek, T.; Chu, B.; Kriz, A.L. Evidence for the thiamine biosynthetic pathway in higher-plant plastids and its developmental regulation. Plant Mol. Biol. 1995, 29, 809–821. [Google Scholar] [CrossRef] [PubMed]
  44. Tambasco-Studart, M.; Titiz, O.; Raschle, T.; Forster, G.; Amrhein, N.; Fitzpatrick, T.B. Vitamin B6 biosynthesis in higher plants. Proc. Natl. Acad. Sci. USA 2005, 102, 13687–13692. [Google Scholar] [CrossRef] [PubMed] [Green Version]
  45. Bilski, P.; Li, M.Y.; Ehrenshaft, M.; Daub, M.E.; Chignell, C.F. Vitamin B6 (pyridoxine) and its derivatives are efficient singlet oxygen quenchers and potential fungal antioxidants. Photochem. Photobiol. 2000, 71, 129–134. [Google Scholar] [CrossRef]
  46. Maruta, T.; Tanouchi, A.; Tamoi, M.; Yabuta, Y.; Yoshimura, K.; Ishikawa, T.; Shigeoka, S. Arabidopsis chloroplastic ascorbate peroxidase isoenzymes play a dual role in photoprotection and gene regulation under photooxidative stress. Plant Cell Physiol. 2010, 51, 190–200. [Google Scholar] [CrossRef] [PubMed]
  47. Davletova, S.; Rizhsky, L.; Liang, H.; Shengqiang, Z.; Oliver, D.J.; Coutu, J.; Shulaev, V.; Schlauch, K.; Mittler, R. Cytosolic ascorbate peroxidase 1 is a central component of the reactive oxygen gene network of Arabidopsis. Plant Cell 2005, 17, 268–281. [Google Scholar] [CrossRef] [PubMed]
  48. Rey, P.; Cuine, S.; Eymery, F.; Garin, J.; Court, M.; Jacquot, J.P.; Rouhier, N.; Broin, M. Analysis of the proteins targeted by CDSP32, a plastidic thioredoxin participating in oxidative stress responses. Plant J. 2005, 41, 31–42. [Google Scholar] [CrossRef] [PubMed]
  49. Brot, N.; Weissbach, L.; Werth, J.; Weissbach, H. Enzymatic reduction of protein-bound methionine sulfoxide. Proc. Natl. Acad. Sci. USA 1981, 78, 2155–2158. [Google Scholar] [CrossRef] [PubMed]
  50. Romero, H.M.; Berlett, B.S.; Jensen, P.J.; Pell, E.J.; Tien, M. Investigations into the role of the plastidial peptide methionine sulfoxide reductase in response to oxidative stress in Arabidopsis. Plant Physiol. 2004, 136, 3784–3794. [Google Scholar] [CrossRef] [PubMed]
  51. Zhang, L.; Kato, Y.; Otters, S.; Vothknecht, U.C.; Sakamoto, W. Essential role of VIPP1 in chloroplast envelope maintenance in Arabidopsis. Plant Cell 2012, 24, 3695–3707. [Google Scholar] [CrossRef] [PubMed]
  52. Adam, Z.; Rudella, A.; van Wijk, K.J. Recent advances in the study of Clp, FtsH and other proteases located in chloroplasts. Curr. Opin. Plant Biol. 2006, 9, 234–240. [Google Scholar] [CrossRef] [PubMed]
  53. Kim, J.; Rudella, A.; Ramirez Rodriguez, V.; Zybailov, B.; Olinares, P.D.; van Wijk, K.J. Subunits of the plastid ClpPR protease complex have differential contributions to embryogenesis, plastid biogenesis, and plant development in Arabidopsis. Plant Cell 2009, 21, 1669–1692. [Google Scholar] [CrossRef] [PubMed]
  54. Finley, D. Recognition and processing of ubiquitin-protein conjugates by the proteasome. Annu. Rev. Biochem. 2009, 78, 477–513. [Google Scholar] [CrossRef] [PubMed]
  55. Vierstra, R. The ubiquitin/26S proteasome pathway, the complex last chapter in the life of many plant proteins. Trends Plant Sci. 2003, 8, 135–142. [Google Scholar] [CrossRef]
  56. Wang, L.; Ouyang, M.; Li, Q.; Zou, M.; Guo, J.; Ma, J.; Lu, C.; Zhang, L. The Arabidopsis chloroplast ribosome recycling factor is essential for embryogenesis and chloroplast biogenesis. Plant Mol. Biol. 2010, 74, 47–59. [Google Scholar] [CrossRef] [PubMed]
  57. Koumoto, Y.; Shimada, T.; Kondo, M.; Hara-Nishimura, I.; Nishimura, M. Chloroplasts have a novel Cpn10 in addition to Cpn20 as co-chaperonins in Arabidopsis thaliana. J. Biol. Chem. 2001, 276, 29688–29694. [Google Scholar] [CrossRef] [PubMed]
  58. Xu, Y.; Wang, B.C.; Zhu, Y.X. Identification of proteins expressed at extremely low level in Arabidopsis leaves. Biochem. Biophys. Res. Commun. 2007, 358, 808–812. [Google Scholar] [CrossRef] [PubMed]
  59. Fulton, D.C.; Stettler, M.; Mettler, T.; Vaughan, C.K.; Li, J.; Francisco, P.; Gil, M.; Reinhold, H.; Eicke, S.; Messerli, G.; et al. Beta-AMYLASE4, a noncatalytic protein required for starch breakdown, acts upstream of three active beta-amylases in Arabidopsis chloroplasts. Plant cell 2008, 20, 1040–1058. [Google Scholar] [CrossRef] [PubMed]
  60. Ren, Y.; Yang, J.; Lu, B.; Jiang, Y.; Chen, H.; Hong, Y.; Wu, B.; Miao, Y. Structure of Pigment Metabolic Pathways and Their Contributions to White Tepal Color Formation of Chinese Narcissus tazetta var. chinensis cv Jinzhanyintai. Int. J. Mol. Sci. 2017, 18, 1923. [Google Scholar] [CrossRef] [PubMed]
  61. Shao, L.; Shu, Z.; Peng, C.L.; Lin, Z.F.; Yang, C.W.; Gu, Q. Enhanced sensitivity of Arabidopsis anthocyanin mutants to photooxidation: A study with fluorescence imaging. Funct. Plant Biol. 2008, 35, 714–724. [Google Scholar] [CrossRef]
  62. Carpentier, S.C.; Witters, E.; Laukens, K.; Deckers, P.; Swennen, R.; Panis, B. Preparation of protein extracts from recalcitrant plant tissues: An evaluation of different methods for two-dimensional gel electrophoresis analysis. Proteomics 2005, 5, 2497–2507. [Google Scholar] [CrossRef] [PubMed]
  63. Bradford, M.M. A rapid and sensitive method for the quantitation of microgram quantities of protein utilizing the principle of protein-dye binding. Anal. Biochem. 1976, 72, 248–254. [Google Scholar] [CrossRef]
  64. Wang, L.; Pan, D.; Li, J.; Tan, F.; Hoffmann-Benning, S.; Liang, W.; Chen, W. Proteomic analysis of changes in the Kandelia candel chloroplast proteins reveals pathways associated with salt tolerance. Plant Sci. 2015, 231, 159–172. [Google Scholar] [CrossRef] [PubMed]
  65. Fling, S.P.; Gregerson, D.S. Peptide and protein molecular weight determination by electrophoresis using a high-molarity tris buffer system without urea. Anal. Biochem. 1986, 155, 83–88. [Google Scholar] [CrossRef]
Figure 1. 2-DE and immunoblot analysis of total proteins extracted from rosette leaves of WT and two variegated mutants. (AC) Representative 2-DE gel images of WT (A); why1/3-var (B); and oeCIPK14-var (C). An equal amount (1.5 mg) of total proteins was loaded on each IPG strips (3–10 NL). The spot numbers indicated proteins that showed significant changes between WT and two variegated mutants. (D) The changing of protein abundance selected from 2-DE were confirmed by western blot and CBB R250 staining. The immunoblot analysis is performed using antibodies against RBCL, RBCS, and PSBR. CBB R250 staining shows RBCL and RBCS protein amount and the same amount of loading proteins.
Ijms 19 02231 g001
Figure 2. Functional classifications of the differentially expressed proteins identified in why1/3-var and oeCIPK14-var compared with WT. (A) Functional classifications of the differentially expressed proteins between why1/3-var and WT; (B) Functional classifications of the differentially expressed proteins between oeCIPK14-var and WT; (C) The Venn diagram analysis between why1/3-var and oeCIPK14-var compared with WT. The Venn diagram is completed by the online tool (available online: http://bioinfogp.cnb.csic.es/tools/venny/index.html).
Ijms 19 02231 g002
Figure 3. Hierarchical cluster analysis of the differentially expressed proteins of why1/3-var and oeCIPK14-var compared with WT. The three columns represent protein expression changings in the (A) WT, (B) why1/3-var, and (C) oeCIPK14-var, respectively. The rows represent individual proteins identified in the why1/3-var and oeCIPK14-var lines; the up-regulated or down-regulated proteins are indicated in red or green. The heat map used log2 of fold changes of protein abundance between WT and why1/3-var and oeCIPK14-var mutants.
Ijms 19 02231 g003
Figure 4. The transcript levels of WHIRLY1, WHIRLY3 and CIPK14 in the used lines. (A) The level of expression of WHIRLY1 in the WT, why1/3-var and oeWHY1; (B) The level of expression of WHIRLY3 in the WT and why1/3-var; (C) The level of expression of CIPK14 in the WT, cipk14 and oeCIPK14-var.
Ijms 19 02231 g004
Figure 5. Comparison of changes in the protein and mRNA levels for selected protein spots. The relative protein abundance is represented by percent volume. (A) The mRNA levels change in parallel with protein levels in the why1/3-var lines; (a1) The relative protein abundance of protein spots in the WT and why1/3-var; (a2) The relative expression levels of the corresponding genes in (a1) are analyzed in the WT, why1/3-var, and oeWHY1; (B) The mRNA levels change independently in the why1/3-var lines; (b1) The relative protein abundance of protein spots in the WT and why1/3-var; (b2) The relative expression levels of the corresponding genes (b1) are analyzed in the WT, why1/3-var, and oeWHY1; (C) The mRNA levels change in parallel with protein levels in the oeCIPK14-var lines; (c1) The relative protein abundance of protein spots in the WT and oeCIPK14-var; (c2) The relative expression level of the corresponding genes in (c1) are analyzed in the WT, oeCIPK14-var, and cipk14; (D) The mRNA levels change independently in the oeCIPK14-var lines; (d1) The relative protein abundance of protein spots in the WT and oeCIPK14-var; (d2) The relative expression of the corresponding genes in (d1) are analyzed in the WT, oeCIPK14-var, and cipk14. The relative expression level of the gene is normalized to GAPC2, with the WT as 1. The error bars indicated standard error of three biological replications and three technique replicates. Asterisk indicate significant differences (* p < 0.05 and ** p < 0.01) based on Student’s t-test analyzed by Graphpad prism6 software.
Ijms 19 02231 g005
Figure 6. The photosynthetic performance analysis of WHY and CIPK14 mutants. (A) Total chlorophyll content; (B) The maximum photochemical efficiency of photosystem II (Fv/Fm); (C) The nonphotochemical quenching of photosystem II fluorescence (NPQ); (D) The electron transport rate (ETR). The error bars indicate the standard error of nine independent measurements; (E) The fluorescence images of the whole plants of WHY and CIPK14 mutants. The fluorescence images are taken by Image-PAM using the plants after being dark-adapted 30 min.
Ijms 19 02231 g006
Figure 7. Summary of CIPK14 or/and WHIRLY1/3 mediated pathways in chloroplasts, including light reaction, chlorophyll metabolism, ROS scavenging, malate biosynthesis, calvin cycle, and protein metabolism. The solid lines indicate a direct pathway, the dashed lines indicate a hypothetic connection.
Ijms 19 02231 g007
Table 1. Differential proteins identified by MALDI-TOF/TOF-MS of why1/3-var and CIPK14-var.
Spot No aProtein NameAccession No bMascot ScoreMatched PeptidesTheor MW (kDa)/pI cCov% dSubcellular Loc e
Light reaction
1Fe-S cluster assembly factor HCF101HF101_ARATH3711357.728/5.9120%plastid
2RCAF4IVZ7_ARATH4991848.469/7.5534%chloroplast
3ATP synthase subunit alphaATPA_ARATH9273255.294/5.1950%plastid
4Magnesium-chelatase subunit ChlI-2CHLI2_ARATH3652346.069/5.3644%chloroplast
12Chlorophyll a-b binding protein CP26CB5_ARATH2131230.183/635%plastid
26Magnesium protoporphyrin IX methyltransferaseCHLM_ARATH6532333.775/7.6853%chloroplast
28PsbP domain-containing protein 4PPD4_ARATH122828.484/7.0233%plastid
33Oxygen-evolving enhancer protein 3-2PSBQ2_ARATH4641624.628/9.7259%plastid
34PSBRA0A178WGP6_ARATH11279.77/10.139%plastid
35TROLA0A178V0X3_ARATH4442154.448/5.0929%chloroplast
Calvin cycle
5Phosphoglycerate kinase 1PGKH1_ARATH6422450.081/5.9137%chloroplast
6Sedoheptulose-1,7-bisphosphataseS17P_ARATH3541842.388/6.1728%chloroplast
14Ribulose bisphosphate carboxylase large chain (Fragment)A0A142I795_ARATH2921251.833/6.179%chloroplast
17Ribulose bisphosphate carboxylase small chainA0A178UL15_ARATH3261420.33/7.5945%chloroplast
18Ribulose bisphosphate carboxylase small chain 1ARBS1A_ARATH3691520.203/7.5945%chloroplast
23Ribulose bisphosphate carboxylase large chain (Fragment)A0A142I795_ARATH2921251.833/6.1718%plastid
27Ribulose bisphosphate carboxylase large chainRBL_ARATH7403152.922/5.8842%chloroplast
32Ribulose bisphosphate carboxylase small chainA0A178UL15_ARATH3261420.33/7.5945%chloroplast
40Ribulose bisphosphate carboxylase large chain (Fragment)A0A142I795_ARATH2921251.833/6.1726%chloroplast
43Ribulose bisphosphate carboxylase small chain 1ARBS1A_ARATH3621320.203/7.7949%chloroplast
45Ribulose bisphosphate carboxylase small chain 1BRBS1B_ARATH3481418.506/8.2253%chloroplast
59Beta carbonic anhydrase 1BCA1_ARATH3071537.426/5.7448%plastid/ cytomembrane
Defense and antioxidation
7Glucan endo-1,3-beta-glucosidase, acidic isoformE13A_ARATH5681637.316/4.8533%secretion
9Thiamine thiazole synthaseTHI4_ARATH1831036.641/5.8228%plastid
10SAPXA0A178V0Q5_ARATH5242440.446/8.3147%chloroplast
16Glycine-rich RNA-binding protein 7RBG7_ARATH167916.88/5.8551%cytoplasm/nucleus
20Glutathione S-transferase F6GSTF6_ARATH3551523.471/5.849%cytoplasm
24V-type proton ATPase subunit E1VATE1_ARATH3283026.044/6.0475%vacuole
25l-ascorbate peroxidase 1F4HU93_ARATH3891627.503/5.8552%cytoplasm
37Pyridoxal 5′-phosphate synthase subunit PDX1.1PDX11_ARATH4232332.841/5.7537%cytoplasm
38Thioredoxin-like protein CDSP32CDSP_ARATH3712033.663/8.6535%chloroplast
44GRP7A0A178VQY8_ARATH315916.937/5.8537%cytoplasm/nucleus
46V-type proton ATPase subunit G1VATG1_ARATH3041012.389/5.7770%vacuole
51Formate dehydrogenaseFDH_ARATH3541842.383/7.1236%chloroplast/mitochondria
5212-oxophytodienoate reductase 3OPR3_ARATH7822442.664/7.7154%peroxysome
54Thylakoid lumenal 29 kDa proteinTL29_ARATH4752437.911/8.5953%plastid
55RemorinREMO_ARATH4272620.955/8.6365%plasmalemma
57VIPP1A0A178W0D3_ARATH4122328.895/5.967%plastid
60Glutathione S-transferase F7GSTF7_ARATH5521823.583/6.1452%cytoplasm
61Peptide methionine sulfoxide reductase A4MSRA4_ARATH2361238.626/8.9626%plastid
Amino acid metabolism
22Serine hydroxymethyltransferase 4GLYC4_ARATH5042251.685/6.846%cytoplasm
48Asparagine synthetase [glutamine-hydrolyzing] 2ASNS2_ARATH2351864.989/6.0127%cytoplasm/plasmodesmata
50Glutamate-glyoxylate aminotransferase 1GGT1_ARATH4782053.267/6.4937%peroxysome
58Acetylglutamate kinaseNAGK_ARATH4241436.572/9.0436%plastid
Proteometabolism
11ATP-dependent Clp protease proteolytic subunit-related protein 3CLPR3_ARATH5972336.284/8.6441%chloroplast
13Proteasome subunit alpha type-6-APSA6A_ARATH9262527.277/5.658%cytoplasm/nucleus
1530S ribosomal protein S6 alphaRR6_ARATH119822.746/5.9226%plastid
19CPN10O80504_ARATH5671015.04/8.7545%chloroplast
29Proteasome subunit beta type-2-BPSB2B_ARATH7152221.97/6.2170%cytoplasm/nucleus
30Ribosome-recycling factorRRFC_ARATH4971830.403/9.4644%plastid
31Peptidyl-prolyl cis-trans isomerase CYP18-3CP18C_ARATH3071118.361/7.6834%cytoplasm
39Proteasome subunit alpha type-6-BPSA6B_ARATH3121927.333/5.7556%cytoplasm/nucleus
56Peptidyl-prolyl cis-trans isomerase CYP19-1CP19A_ARATH4061418.48/8.6543%cytoplasm
62Nascent polypeptide-associated complex subunit betaA0A178W6R8_ARATH3321416.935/5.5045%cytoplasm/nucleus
Energy metabolism
21Beta-amylase 3BAM3_ARATH5102461.314/6.5941%chloroplast
Malate biosynthesis
36Malate dehydrogenaseMDHP_ARATH3341242.379/8.6623%chloroplast
47NADP-dependent malic enzyme 2MAOP2_ARATH3231964.372/6.0125%cytoplasm
49l-galactono-1,4-lactone dehydrogenaseGLDH_ARATH7593568.513/8.738%mitochondria
Lipid metabolism
53GDSL esterase/lipase At1g29670GDL15_ARATH8411939.847/8.8544%secretion
Transcription
8RNA-binding protein CP29BCP29B_ARATH6021630.699/5.0652%plastid
Unknow function
41At1g13930/F16A14.27Q9XI93_ARATH3101416.154/4.8287%chloroplast/plasmalemma
42Kinesin-like calmodulin-binding proteinKCBP_ARATH5435143.359/6.6921%cytoplasm
a Numbering corresponds to 2-DE gel in Figure 1A–C. b Database accession of the identified proteins in uniprot (http://www.uniprot.org/). c Molecular mass and pI theoretical. d Percentage of predicted protein sequence with match sequence. e Subcellular localization of the identified protein base on uniprot and previous literature.

