Identification of Long Non-Coding RNAs Related to Skeletal Muscle Development in Two Rabbit Breeds with Different Growth Rate


Abstract
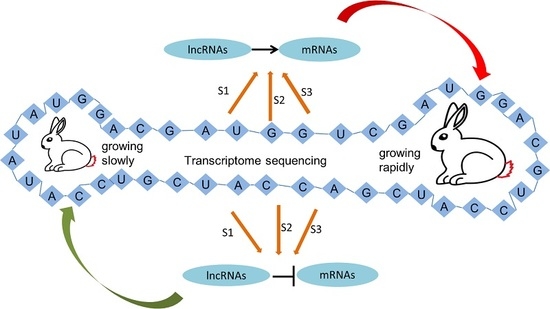
1. Introduction
2. Results
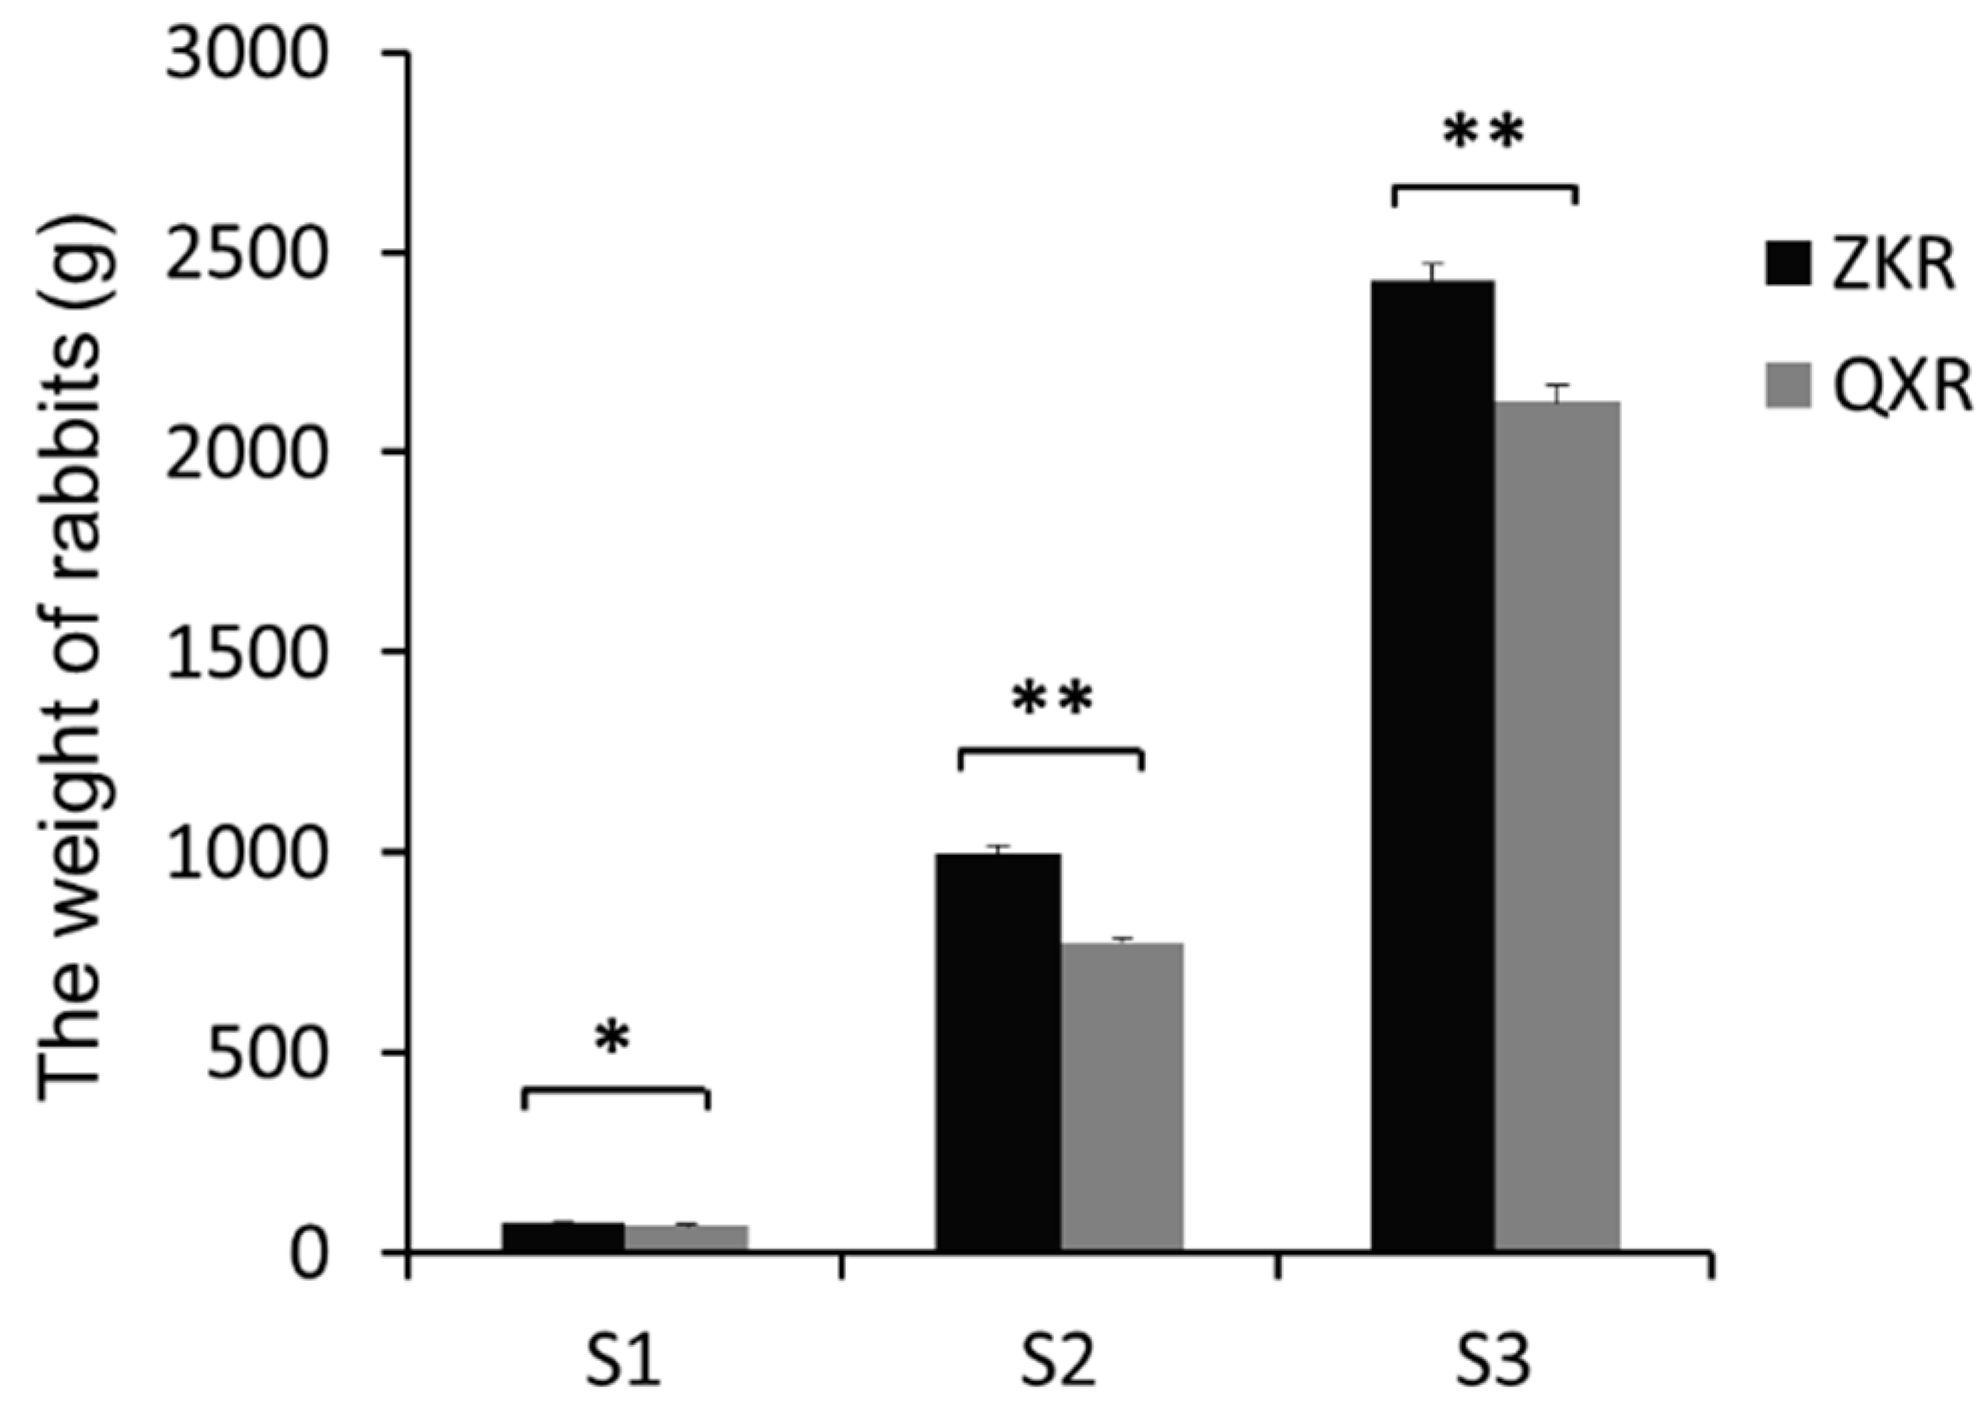
2.1. Sample Information
2.2. Reads Filtering and Mapping
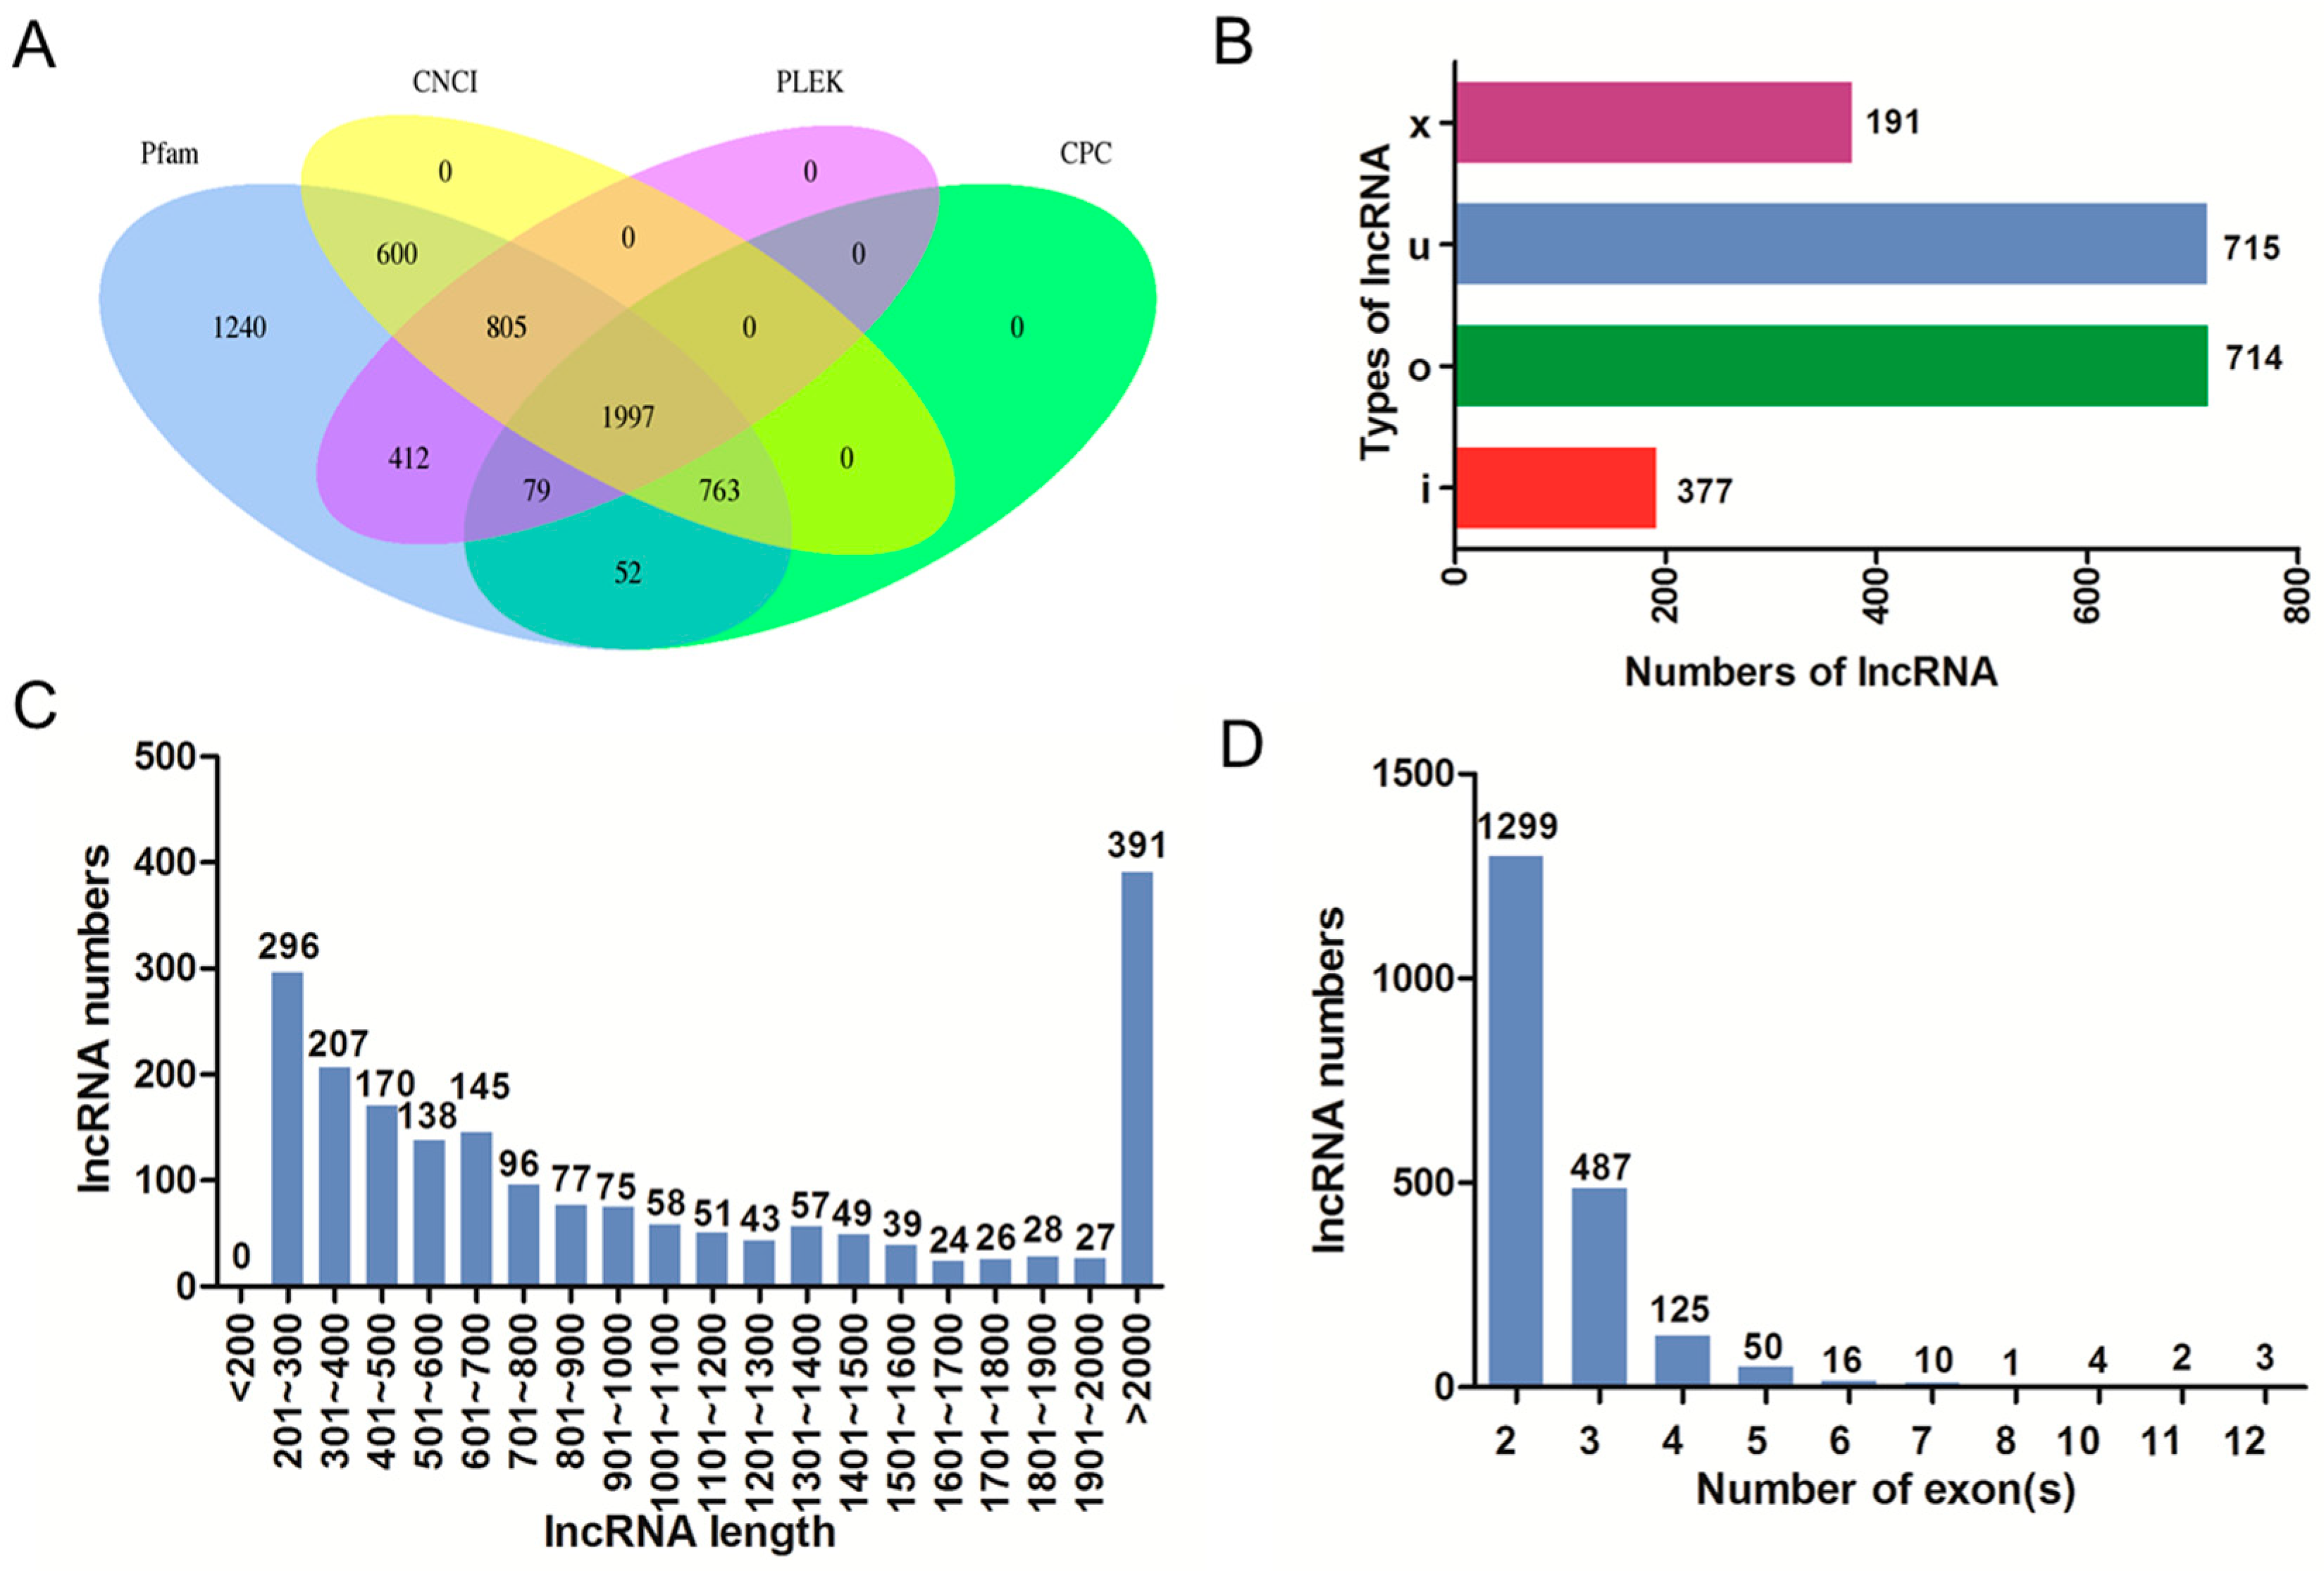
2.3. Identification and Characterization of lncRNAs
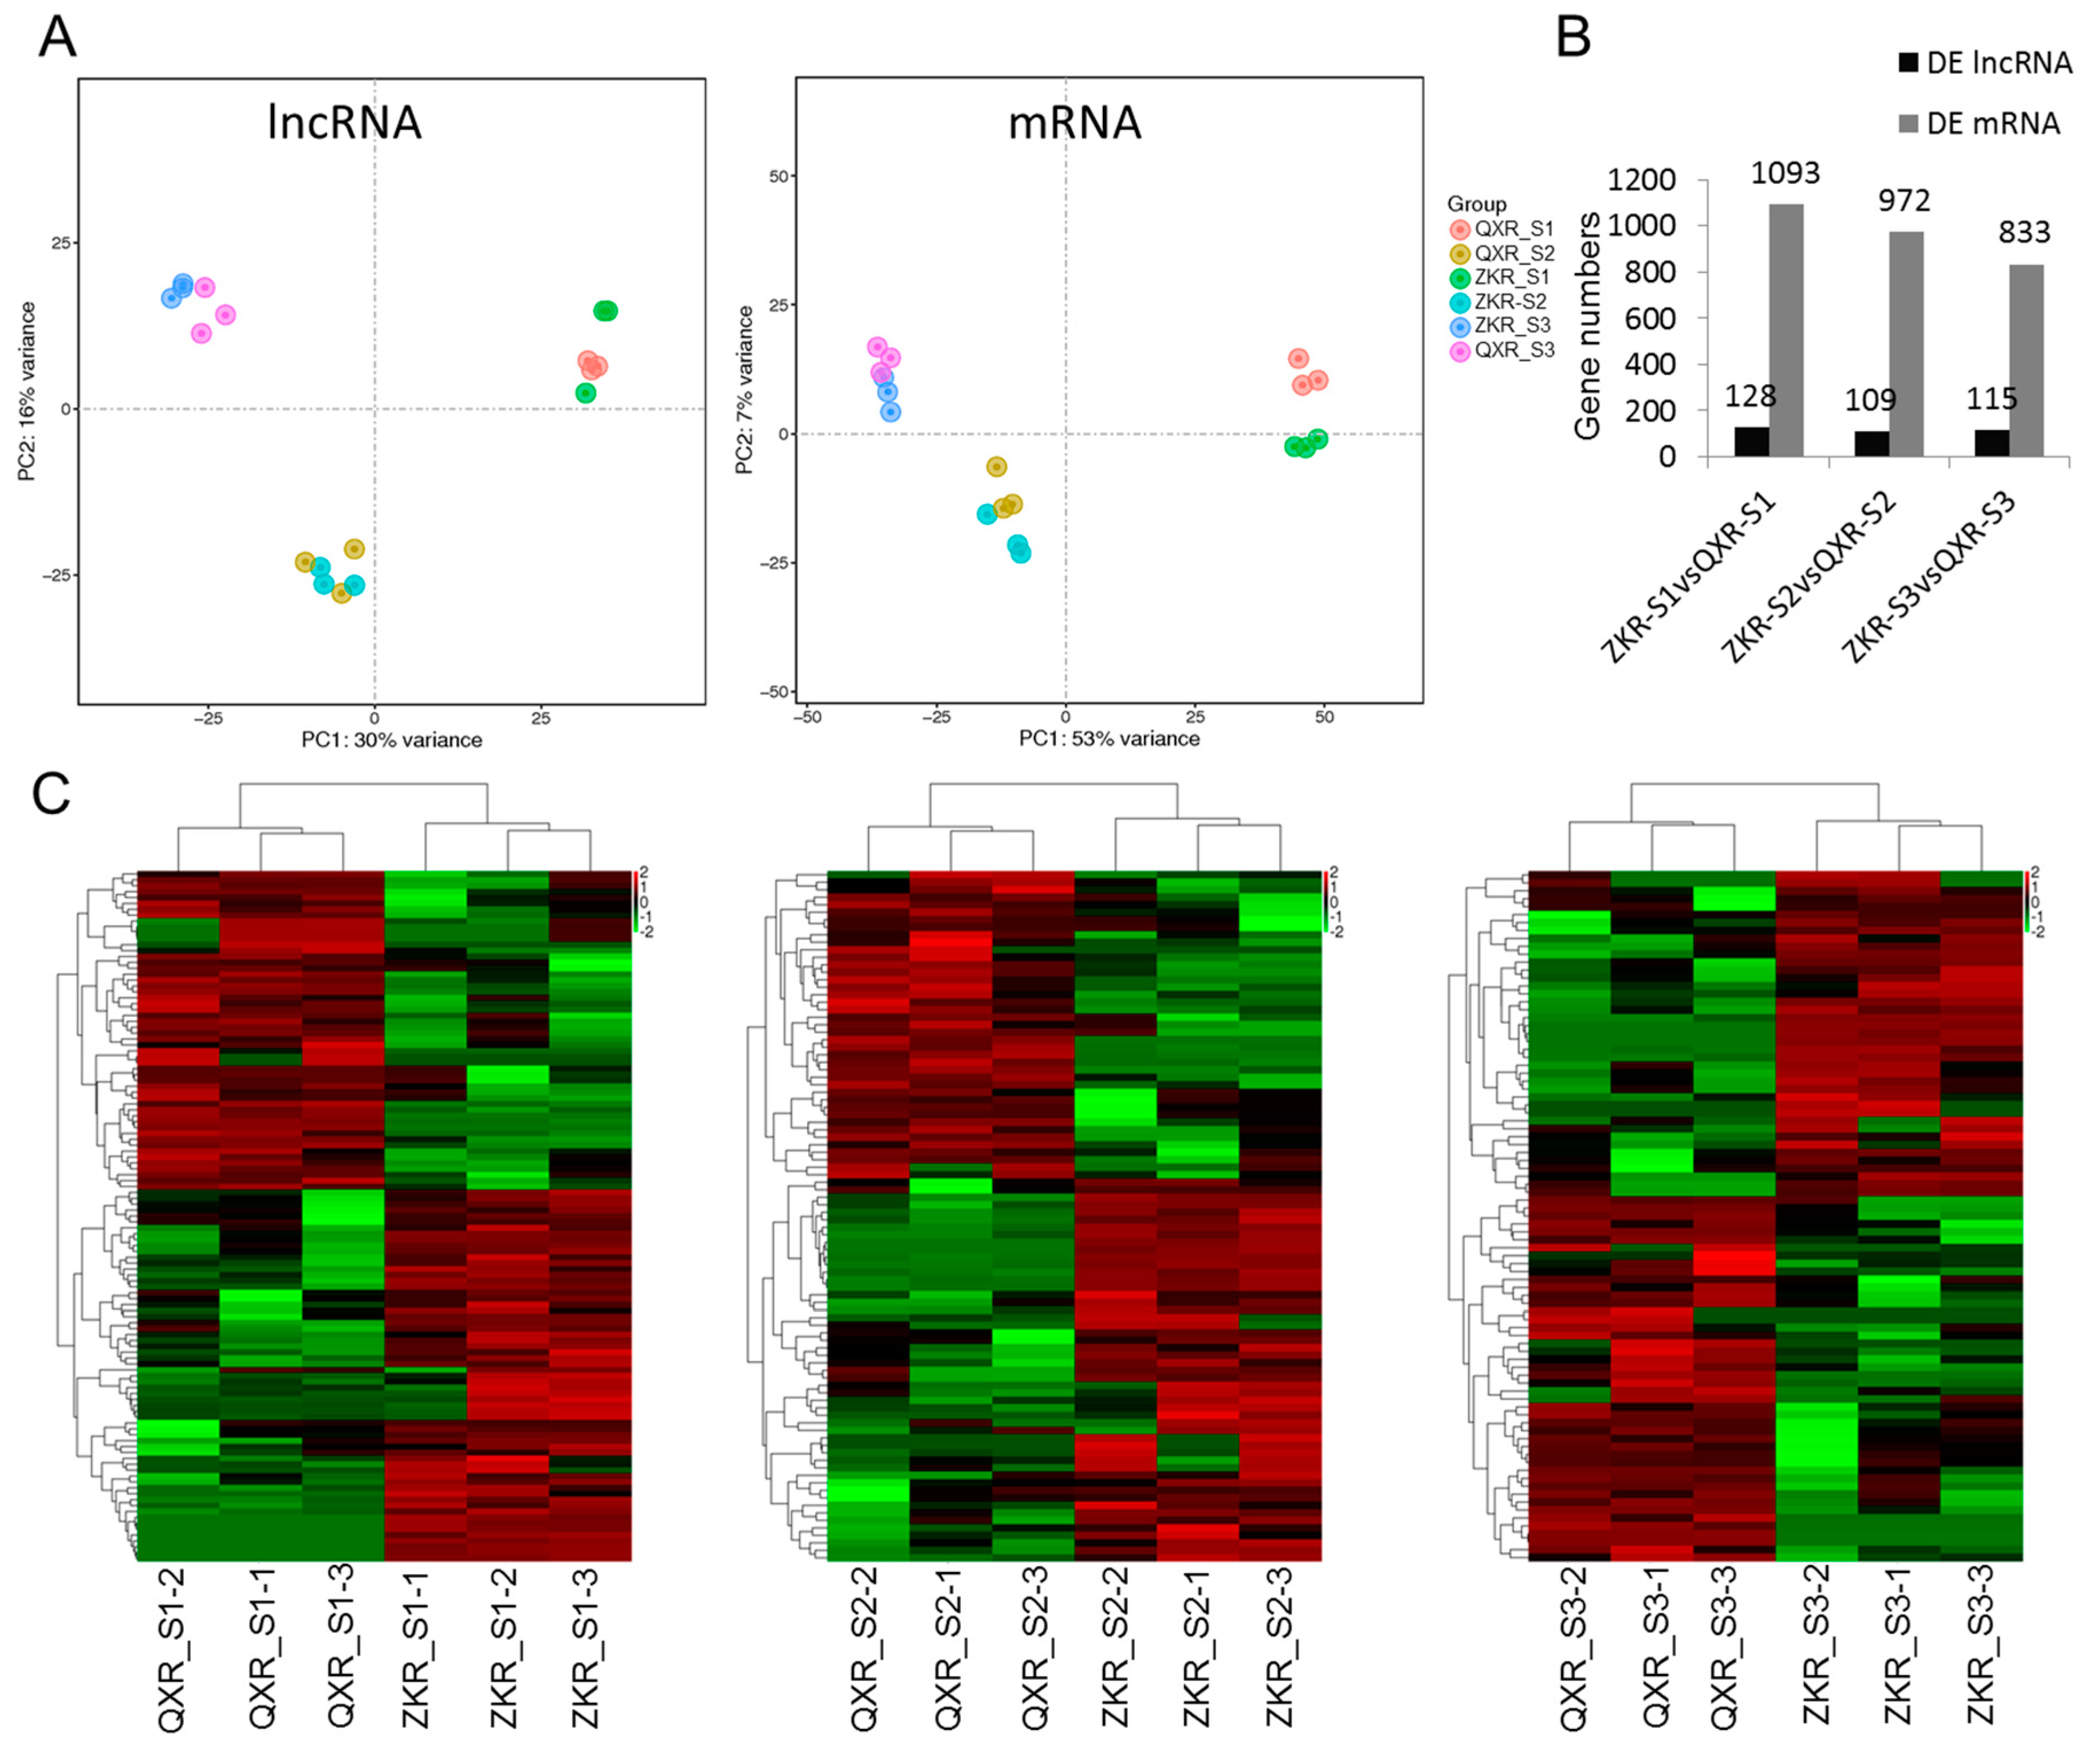
2.4. Principal Component Analysis (PCA) and Differential Expression Analysis
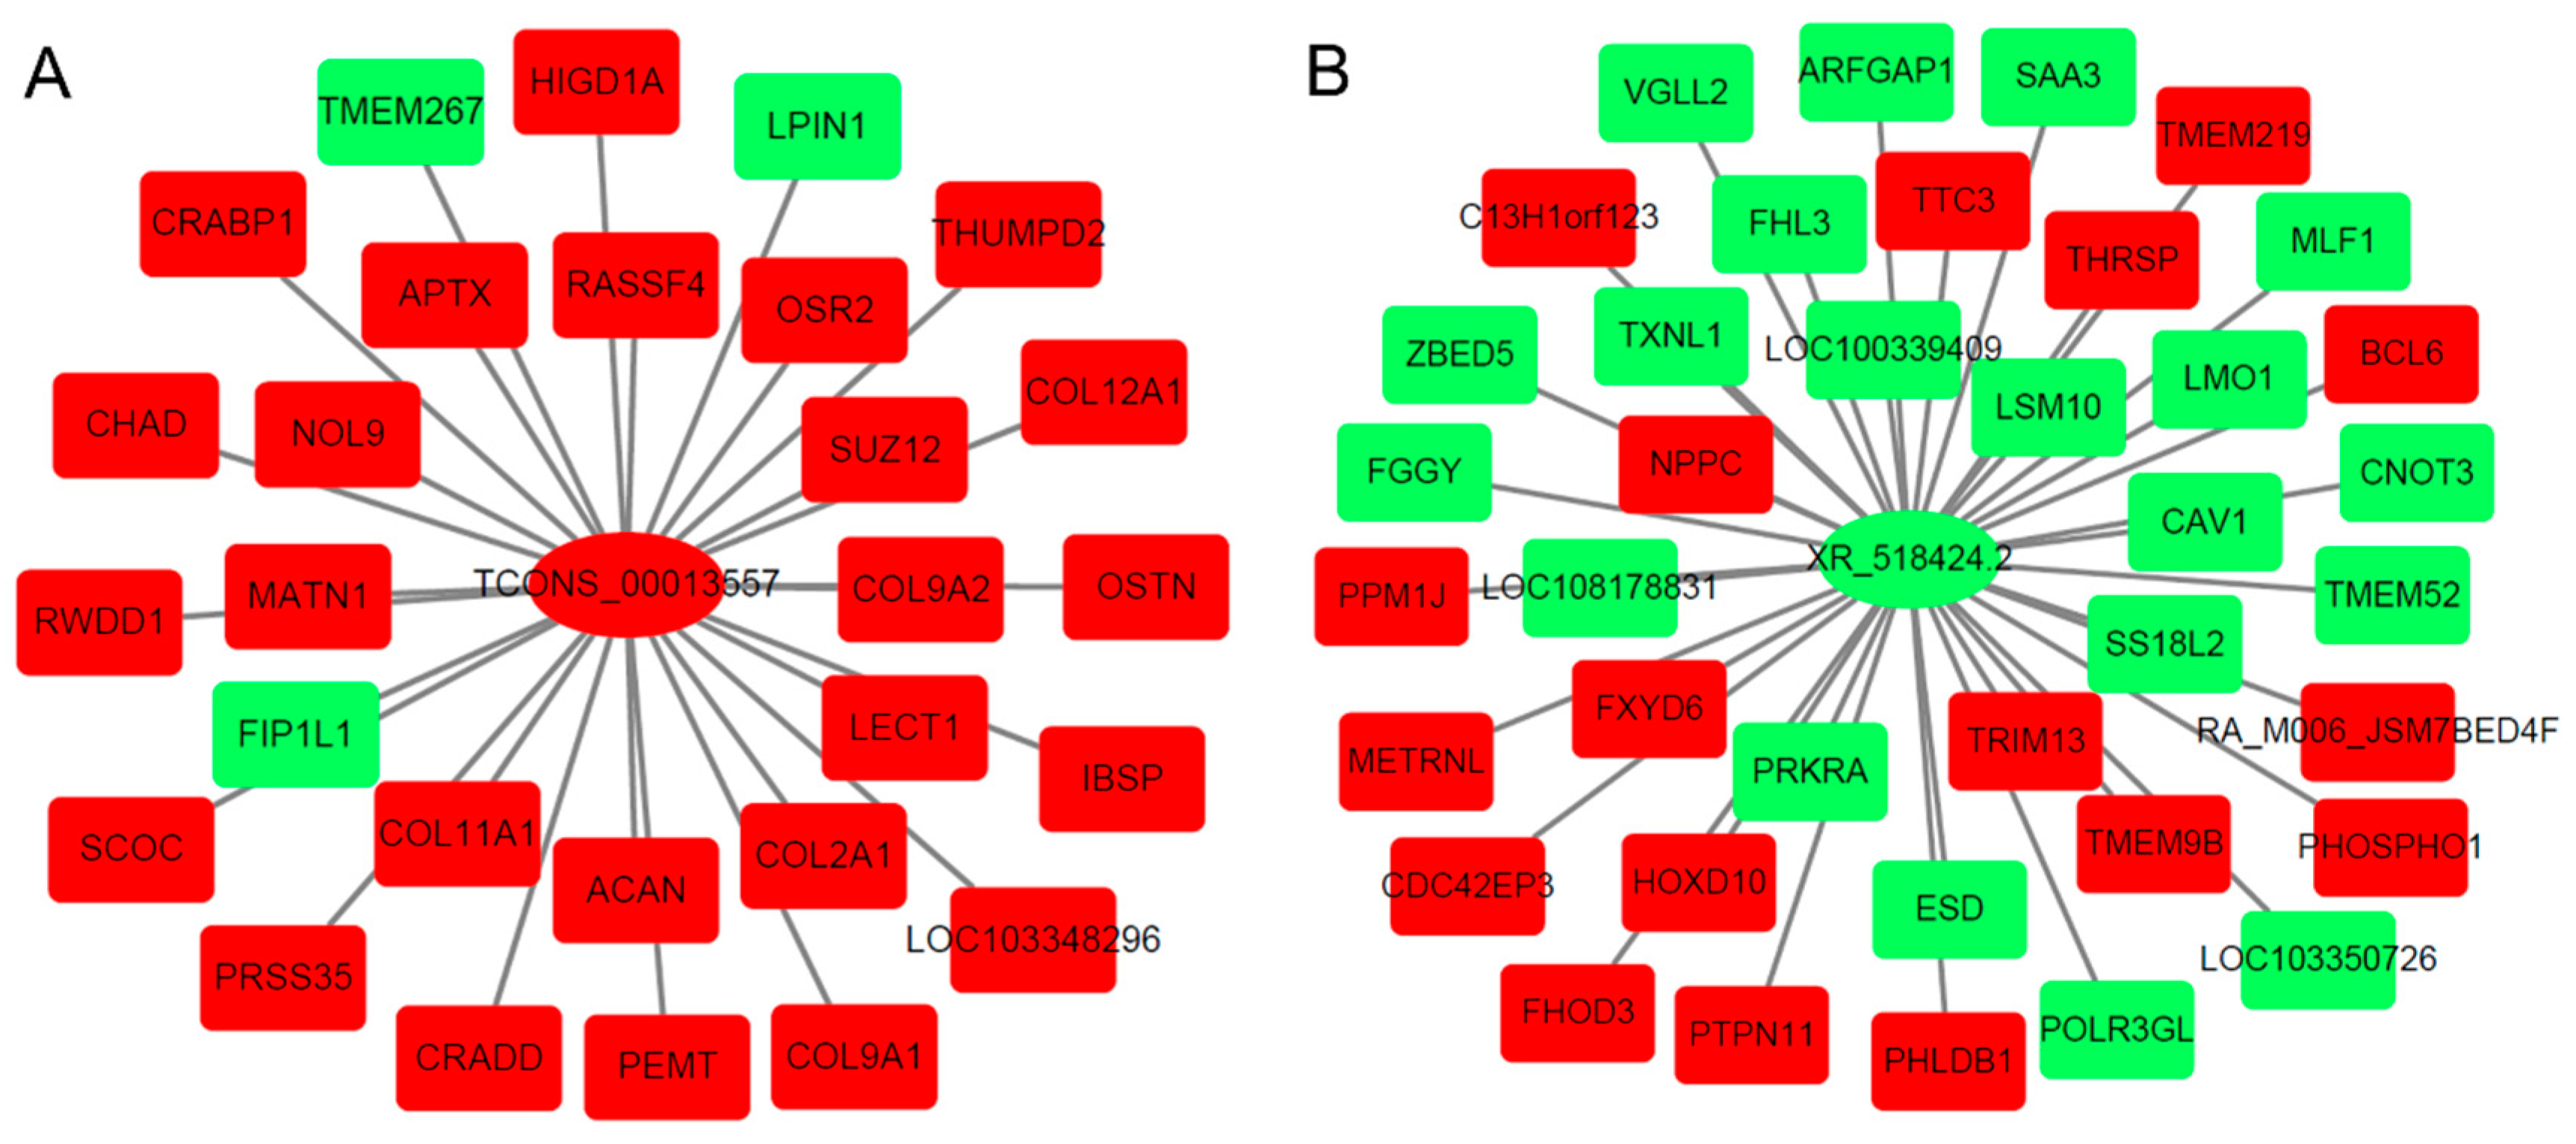
2.5. lncRNA–mRNA Co-Regulated Pairs
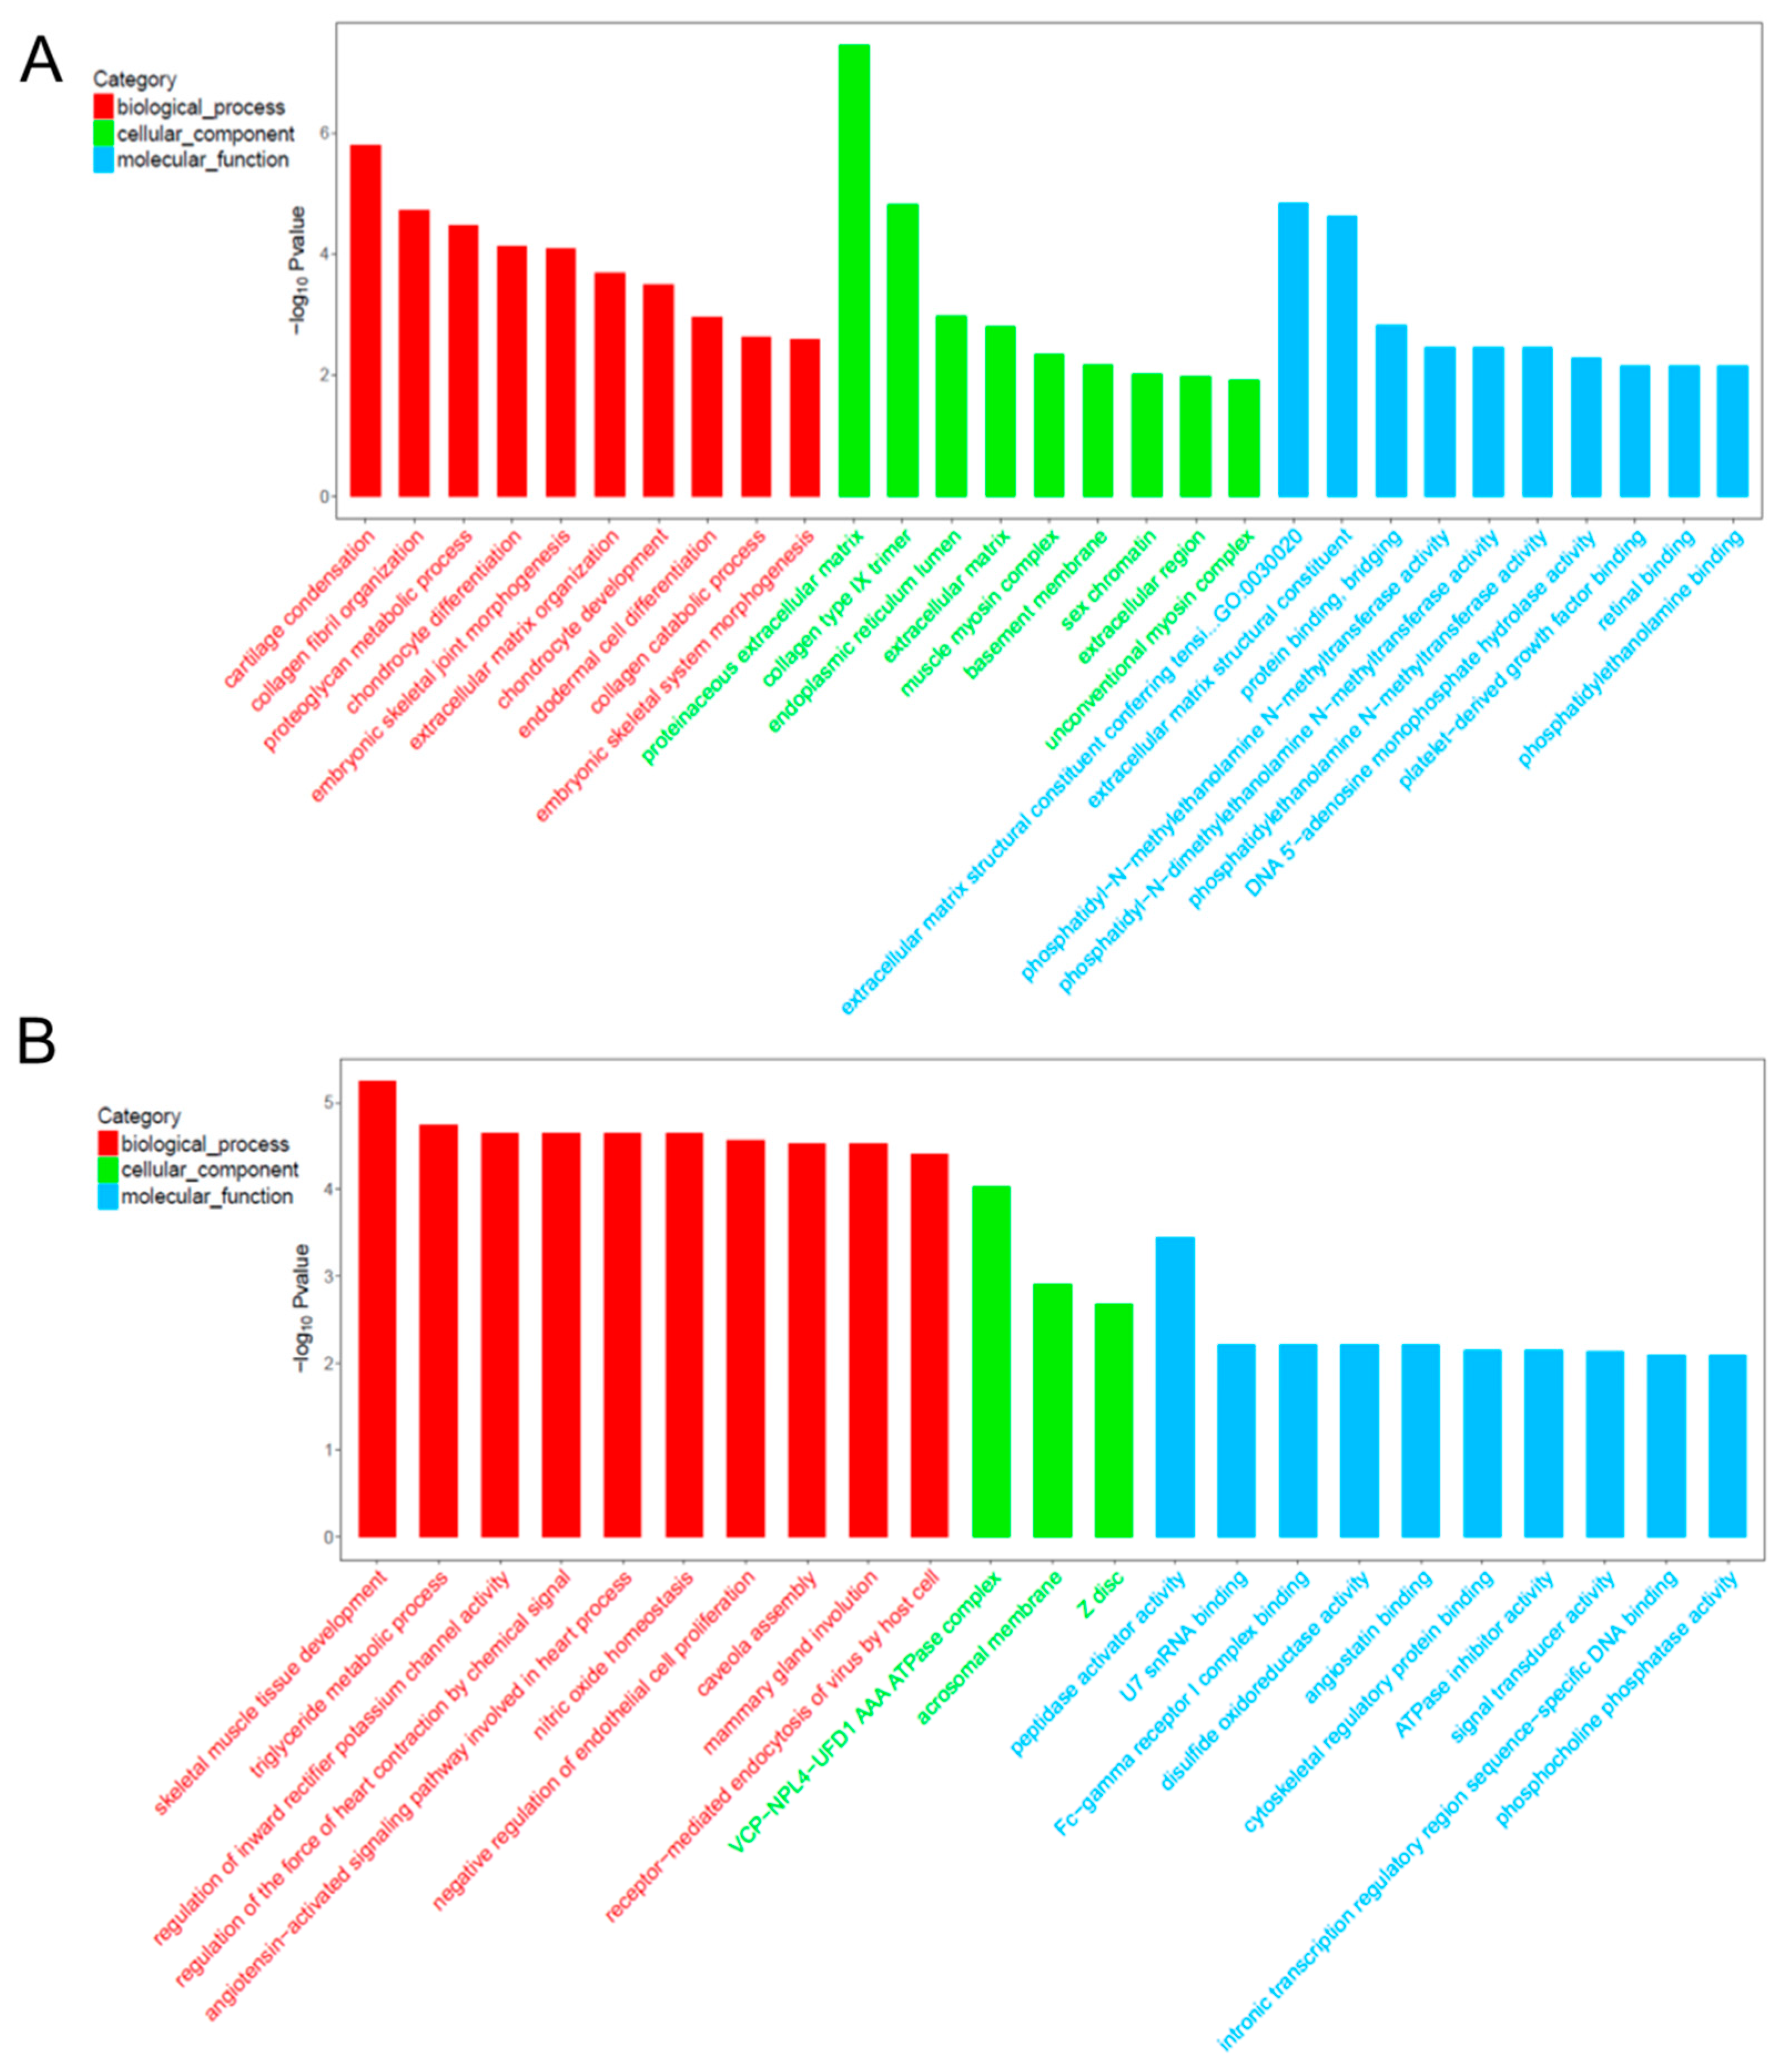
2.6. Gene Ontology (GO) Analysis for Co-Expression mRNA of Each lncRNA
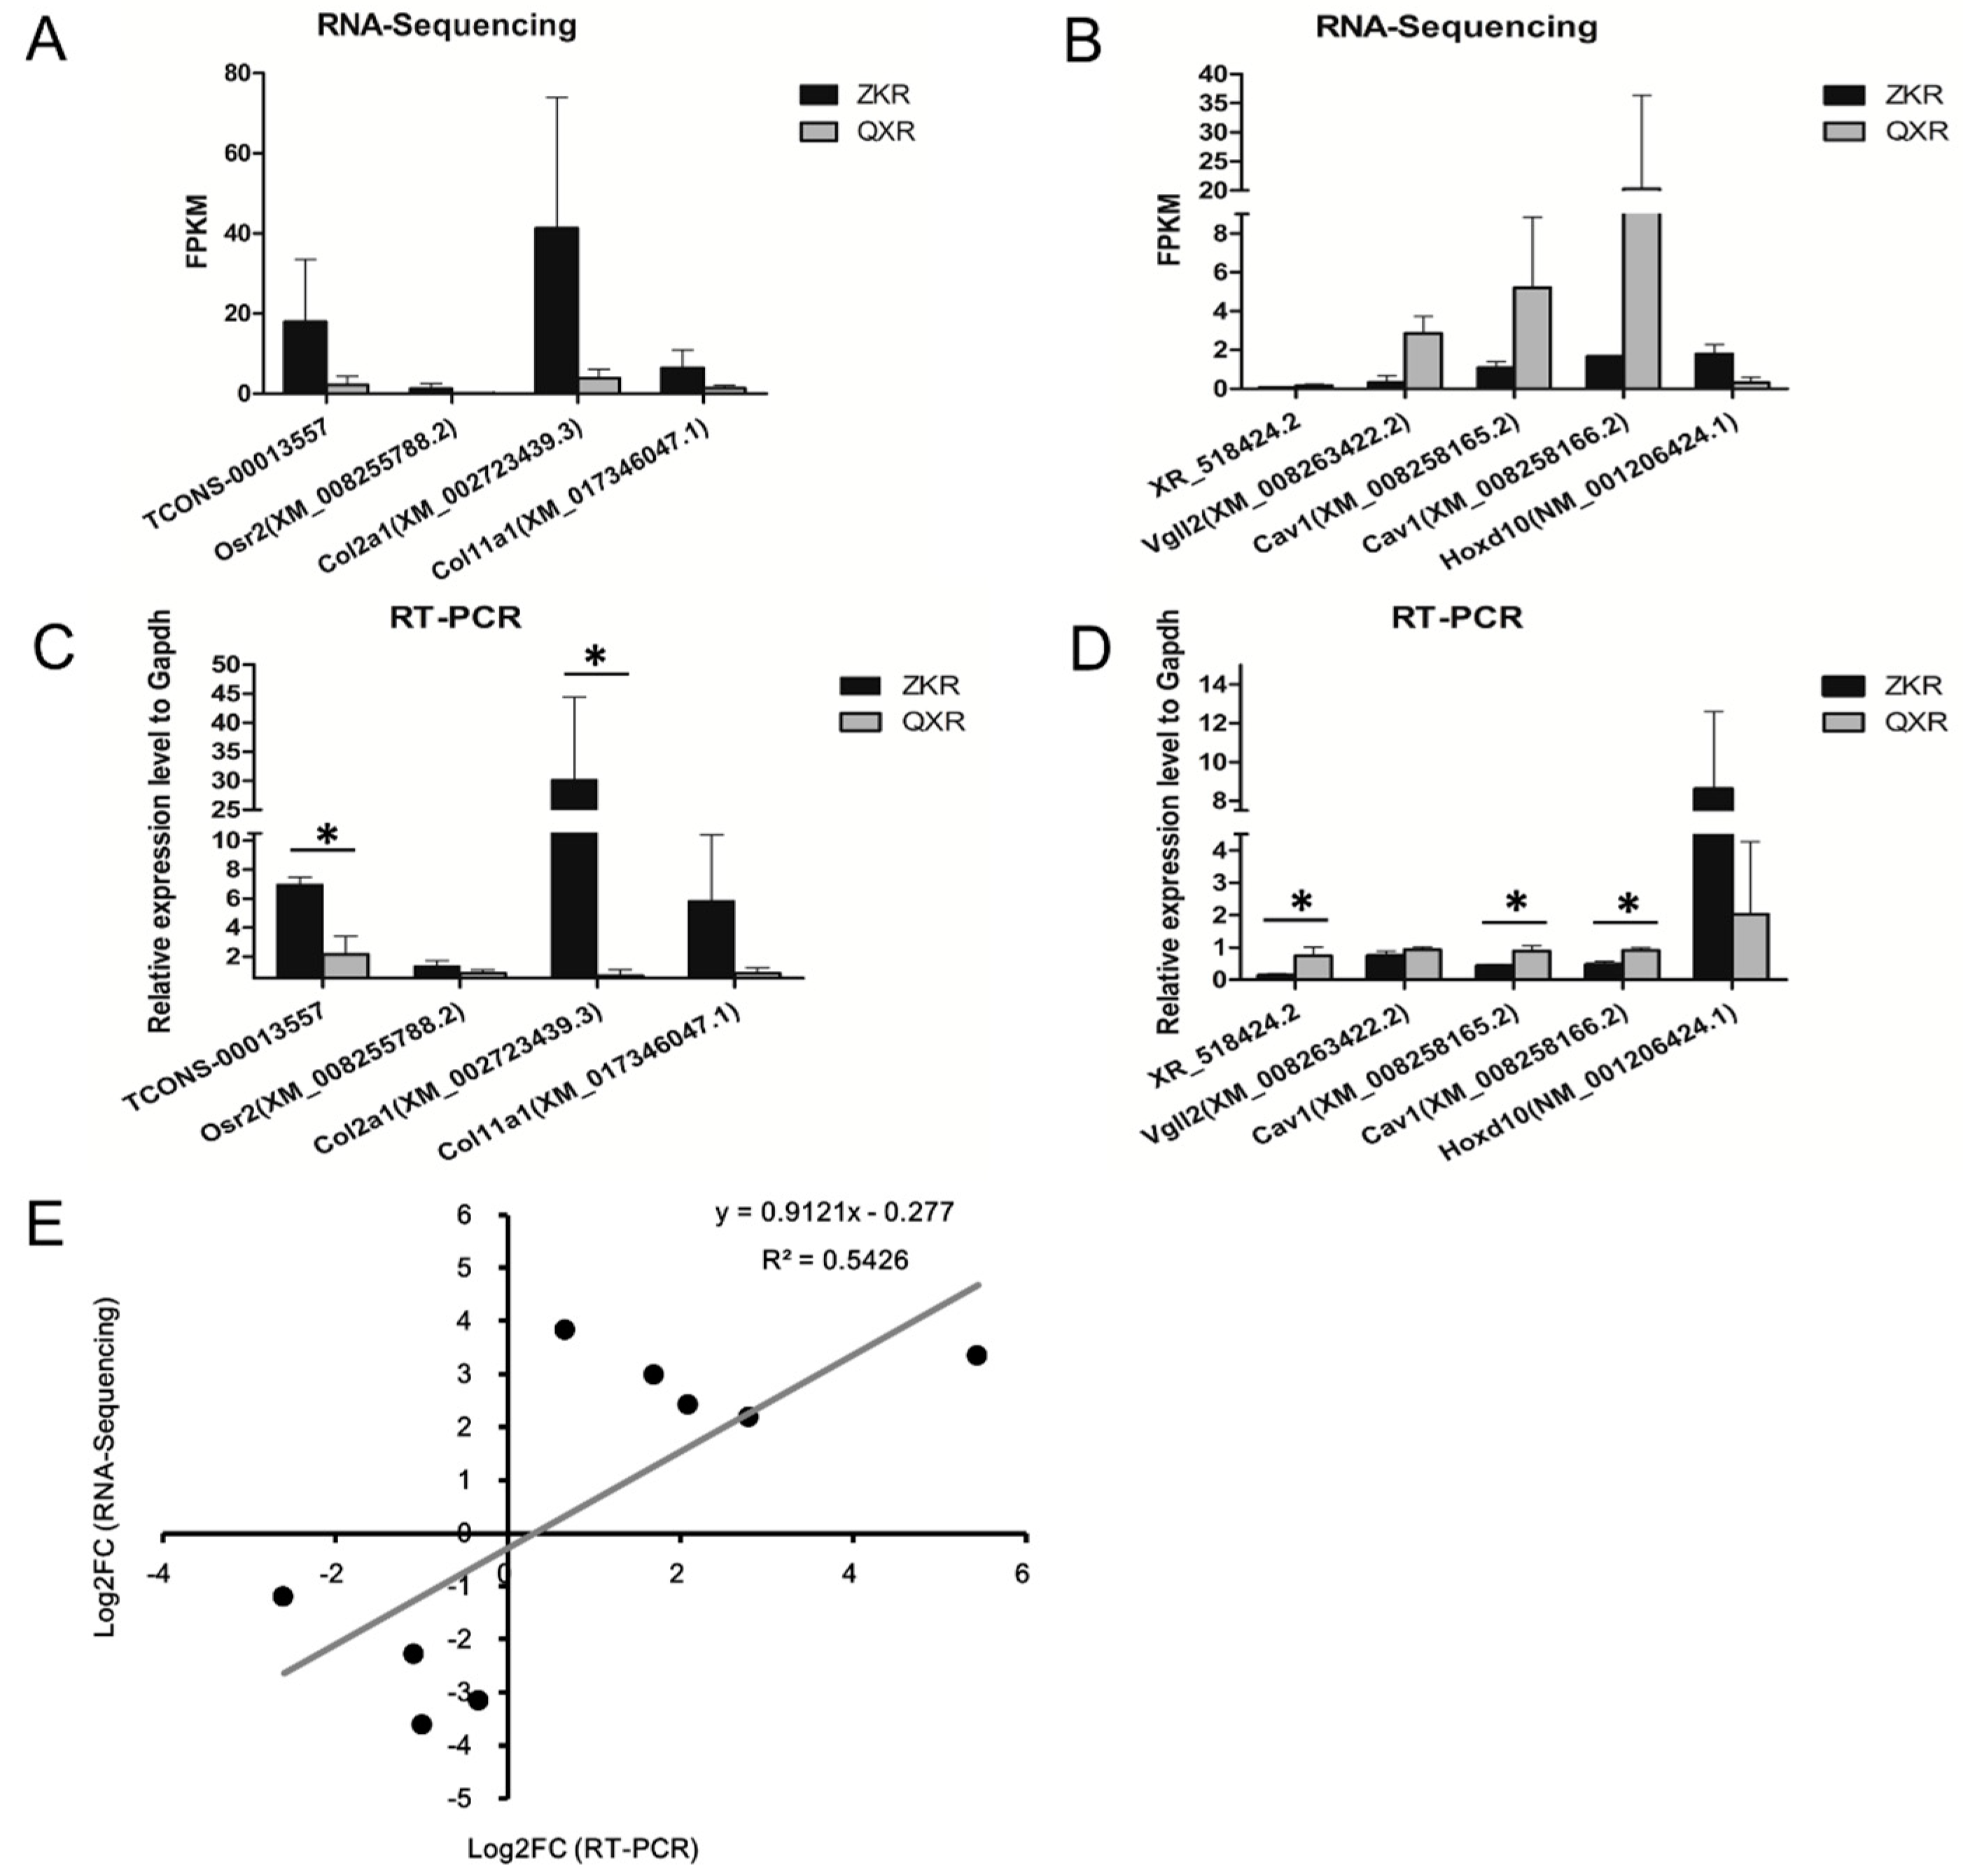
2.7. Validation of the Selected lncRNAs and Co-Expression mRNAs
3. Discussion
4. Materials and Methods
4.1. Sample Collection
4.2. RNA Isolation, Library Construction, and Sequencing
4.3. Raw Reads Preprocessing
4.4. Prediction of lncRNA and mRNA
4.5. PCA and Differential Expression Analysis of lncRNAs and mRNAs
4.6. Co-Expression Correlations of Differentially Expressed lncRNA and mRNA
4.7. GO Enrichment Analysis
4.8. RT-PCR
4.9. Statistical Analysis
Author Contributions
Acknowledgments
Conflicts of Interest
References
- Dalle Zotte, A.; Szendro, Z. The role of rabbit meat as functional food. Meat Sci. 2011, 88, 319–331. [Google Scholar] [CrossRef] [PubMed]
- Hermida, M.; Gonzalez, M.; Miranda, M.; Rodriguez-Otero, J.L. Mineral analysis in rabbit meat from galicia (NW Spain). Meat Sci. 2006, 73, 635–639. [Google Scholar] [CrossRef] [PubMed]
- Ramayo-Caldas, Y.; Mach, N.; Esteve-Codina, A.; Corominas, J.; Castello, A.; Ballester, M.; Estelle, J.; Ibanez-Escriche, N.; Fernandez, A.I.; Perez-Enciso, M.; et al. Liver transcriptome profile in pigs with extreme phenotypes of intramuscular fatty acid composition. BMC Genom. 2012, 13, 547. [Google Scholar] [CrossRef] [PubMed]
- Billerey, C.; Boussaha, M.; Esquerre, D.; Rebours, E.; Djari, A.; Meersseman, C.; Klopp, C.; Gautheret, D.; Rocha, D. Identification of large intergenic non-coding RNAs in bovine muscle using next-generation transcriptomic sequencing. BMC Genom. 2014, 15, 499. [Google Scholar] [CrossRef] [PubMed]
- Li, T.; Wang, S.; Wu, R.; Zhou, X.; Zhu, D.; Zhang, Y. Identification of long non-protein coding RNAs in chicken skeletal muscle using next generation sequencing. Genomics 2012, 99, 292–298. [Google Scholar] [CrossRef] [PubMed]
- Ren, C.; Deng, M.; Fan, Y.; Yang, H.; Zhang, G.; Feng, X.; Li, F.; Wang, D.; Wang, F.; Zhang, Y. Genome-wide analysis reveals extensive changes in lncRNAs during skeletal muscle development in Hu sheep. Genes 2017, 8, 191. [Google Scholar] [CrossRef] [PubMed]
- Matsumoto, A.; Pasut, A.; Matsumoto, M.; Yamashita, R.; Fung, J.; Monteleone, E.; Saghatelian, A.; Nakayama, K.I.; Clohessy, J.G.; Pandolfi, P.P. mTORC1 and muscle regeneration are regulated by the LINC00961-encoded SPAR polypeptide. Nature 2017, 541, 228–232. [Google Scholar] [CrossRef] [PubMed]
- Kjaer, M. Role of extracellular matrix in adaptation of tendon and skeletal muscle to mechanical loading. Physiol. Rev. 2004, 84, 649–698. [Google Scholar] [CrossRef] [PubMed]
- Nishimura, T. Role of extracellular matrix in development of skeletal muscle and postmortem aging of meat. Meat Sci. 2015, 109, 48–55. [Google Scholar] [CrossRef] [PubMed]
- Nandan, D.; Clarke, E.P.; Ball, E.H.; Sanwal, B.D. Ethyl-3,4-dihydroxybenzoate inhibits myoblast differentiation: Evidence for an essential role of collagen. J. Cell Biol. 1990, 110, 1673–1679. [Google Scholar] [CrossRef] [PubMed]
- Saitoh, O.; Periasamy, M.; Kan, M.; Matsuda, R. Cis-4-hydroxy-l-proline and ethyl-3,4-dihydroxybenzoate prevent myogenesis of C2C12 muscle cells and block myod1 and myogenin expression. Exp. Cell Res. 1992, 200, 70–76. [Google Scholar] [CrossRef]
- Velleman, S.G. The role of the extracellular matrix in skeletal muscle development. Poult. Sci. 1999, 78, 778–784. [Google Scholar] [CrossRef] [PubMed]
- Melo, F.; Carey, D.J.; Brandan, E. Extracellular matrix is required for skeletal muscle differentiation but not myogenin expression. J. Cell. Biochem. 1996, 62, 227–239. [Google Scholar] [CrossRef]
- Kawai, S.; Michikami, I.; Kitagaki, J.; Hashino, E.; Amano, A. Expression pattern of zinc-finger transcription factor odd-skipped related 2 in murine development and neonatal stage. Gene Expr. Patterns 2013, 13, 372–376. [Google Scholar] [CrossRef] [PubMed]
- Kawai, S.; Kato, T.; Inaba, H.; Okahashi, N.; Amano, A. Odd-skipped related 2 splicing variants show opposite transcriptional activity. Biochem. Biophys. Res. Commun. 2005, 328, 306–311. [Google Scholar] [CrossRef] [PubMed]
- Tsai, C.C.; Huang, T.F.; Ma, H.L.; Chiang, E.R.; Hung, S.C. Isolation of mesenchymal stem cells from shoulder rotator cuff: A potential source for muscle and tendon repair. Cell Transplant. 2013, 22, 413–422. [Google Scholar] [CrossRef] [PubMed]
- Okada, K.; Fukai, A.; Mori, D.; Hosaka, Y.; Yano, F.; Chung, U.I.; Kawaguchi, H.; Tanaka, S.; Ikeda, T.; Saito, T. Identification of SCAN domain zinc-finger gene ZNF449 as a novel factor of chondrogenesis. PLoS ONE 2014, 9, e115169. [Google Scholar] [CrossRef] [PubMed]
- Kinoshita, A.; Greenwel, P.; Tanaka, S.; Di Liberto, M.; Yoshioka, H.; Ramirez, F. A transcription activator with restricted tissue distribution regulates cell-specific expression of α1(XI) collagen. J. Biol. Chem. 1997, 272, 31777–31784. [Google Scholar] [CrossRef] [PubMed]
- Maeda, T.; Chapman, D.L.; Stewart, A.F. Mammalian vestigial-like 2, a cofactor of TEF-1 and MEF2 transcription factors that promotes skeletal muscle differentiation. J. Biol. Chem. 2002, 277, 48889–48898. [Google Scholar] [CrossRef] [PubMed]
- Chen, H.H.; Maeda, T.; Mullett, S.J.; Stewart, A.F. Transcription cofactor VGL-2 is required for skeletal muscle differentiation. Genesis 2004, 39, 273–279. [Google Scholar] [CrossRef] [PubMed]
- Bonnet, A.; Dai, F.; Brand-Saberi, B.; Duprez, D. Vestigial-like 2 acts downstream of myod activation and is associated with skeletal muscle differentiation in chick myogenesis. Mech. Dev. 2010, 127, 120–136. [Google Scholar] [CrossRef] [PubMed]
- Honda, M.; Hidaka, K.; Fukada, S.I.; Sugawa, R.; Shirai, M.; Ikawa, M.; Morisaki, T. Vestigial-like 2 contributes to normal muscle fiber type distribution in mice. Sci. Rep. 2017, 7, 7168. [Google Scholar] [CrossRef] [PubMed]
- Hagiwara, Y.; Nishina, Y.; Yorifuji, H.; Kikuchi, T. Immunolocalization of caveolin-1 and caveolin-3 in monkey skeletal, cardiac and uterine smooth muscles. Cell Struct. Funct. 2002, 27, 375–382. [Google Scholar] [CrossRef] [PubMed]
- Kunert-Keil, C.; Gredes, T.; Lucke, S.; Morgenstern, S.; Mielczarek, A.; Sporniak-Tutak, K.; Gedrange, T.; Spassov, A. Caveolin-1, caveolin-3 and VEGF expression in the masticatory muscles of mdx mice. Folia Histochem. Cytobiol. 2011, 49, 291–298. [Google Scholar] [CrossRef] [PubMed]
- Baguma-Nibasheka, M.; Fracassi, A.; Costain, W.J.; Moreno, S.; Kablar, B. Role of skeletal muscle in motor neuron development. Histol. Histopathol. 2016, 31, 699–719. [Google Scholar] [PubMed]
- Bolger, A.M.; Lohse, M.; Usadel, B. Trimmomatic: A flexible trimmer for illumina sequence data. Bioinformatics 2014, 30, 2114–2120. [Google Scholar] [CrossRef] [PubMed]
- Kim, D.; Langmead, B.; Salzberg, S.L. Hisat: A fast spliced aligner with low memory requirements. Nat. Methods 2015, 12, 357–360. [Google Scholar] [CrossRef] [PubMed]
- Pertea, M.; Kim, D.; Pertea, G.M.; Leek, J.T.; Salzberg, S.L. Transcript-level expression analysis of RNA-seq experiments with HISAT, StringTie and Ballgown. Nat. Protoc. 2016, 11, 1650–1667. [Google Scholar] [CrossRef] [PubMed]
- Kong, L.; Zhang, Y.; Ye, Z.Q.; Liu, X.Q.; Zhao, S.Q.; Wei, L.; Gao, G. CPC: Assess the protein-coding potential of transcripts using sequence features and support vector machine. Nucleic Acids Res. 2007, 35, W345–W349. [Google Scholar] [CrossRef] [PubMed]
- Sun, L.; Luo, H.; Bu, D.; Zhao, G.; Yu, K.; Zhang, C.; Liu, Y.; Chen, R.; Zhao, Y. Utilizing sequence intrinsic composition to classify protein-coding and long non-coding transcripts. Nucleic Acids Res. 2013, 41, e166. [Google Scholar] [CrossRef] [PubMed]
- Sonnhammer, E.L.; Eddy, S.R.; Birney, E.; Bateman, A.; Durbin, R. Pfam: Multiple sequence alignments and HMM-profiles of protein domains. Nucleic Acids Res. 1998, 26, 320–322. [Google Scholar] [CrossRef] [PubMed]
- Li, A.; Zhang, J.; Zhou, Z. PLEK: A tool for predicting long non-coding RNAs and messenger RNAs based on an improved k-mer scheme. BMC Bioinform. 2014, 15, 311. [Google Scholar] [CrossRef] [PubMed]
- Roberts, A.; Trapnell, C.; Donaghey, J.; Rinn, J.L.; Pachter, L. Improving RNA-seq expression estimates by correcting for fragment bias. Genome Biol. 2011, 12, R22. [Google Scholar] [CrossRef] [PubMed]
- Langmead, B.; Salzberg, S.L. Fast gapped-read alignment with bowtie 2. Nat. Methods 2012, 9, 357–359. [Google Scholar] [CrossRef] [PubMed]
- Roberts, A.; Pachter, L. Streaming fragment assignment for real-time analysis of sequencing experiments. Nat. Methods 2013, 10, 71–73. [Google Scholar] [CrossRef] [PubMed]


| Sample | ZKR a_S1 b | ZKR_S2 b | ZKR_S3 b | QXR c_S1 | QXR_S2 | QXR_S3 |
|---|---|---|---|---|---|---|
| Raw reads | 100,481,781 | 99,812,614 | 99,445,825 | 100,002,793 | 99,887,525 | 99,071,615 |
| Clean reads | 95,660,601 | 94,297,177 | 90,539,959 | 97,386,913 | 97,460,159 | 91,414,542 |
| Filtering rate | 93.26% | 92.81% | 90.31% | 95.51% | 95.85% | 91.25% |
| Q30 | 92.25% | 91.40% | 95.96% | 94.52% | 95.74% | 96.03% |
| Total mapped reads | 87,463,758 (91.41%) | 87,557,832 (92.85%) | 83,122,460 (91.81%) | 89,812,801 (92.22%) | 90,465,752 (92.82%) | 83,950,965 (91.84%) |
| Multiple mapped | 10,182,952 (10.65%) | 11,506,609 (12.20%) | 11,988,424 (13.24%) | 10,370,562 (10.65%) | 11,019,503 (11.30%) | 13,298,066 (14.53%) |
| Uniquely mapped | 77,280,806 (80.77%) | 76,051,223 (80.65%) | 71,134,037 (78.56%) | 79,442,240 (81.58%) | 79,446,249 (81.52%) | 70,652,899 (77.31%) |
| Reads map to ‘+’ | 38,609,153 (40.35%) | 37,967,782 (40.26%) | 35,526,529 (39.24%) | 39,685,378 (40.75%) | 39,665,757 (40.70%) | 35,482,024 (38.82%) |
| Reads map to ‘−’ | 38,671,654 (40.42%) | 38,083,441 (40.39%) | 35,607,508 (39.33%) | 39,756,861 (40.83%) | 39,780,492 (40.82%) | 35,170,875 (38.49%) |
| Comparison | LncRNA Name |
|---|---|
| ZKR a_S1 b vs. QXR c_S1 | TCONS_00013557, TCONS_00014076, TCONS_00018134, XR_515577.1, XR_519108.2, XR_519249.1, XR_519800.2, XR_001792901.1, XR_001795022.1 |
| ZKR_S2 b vs. QXR_S2 | TCONS_00013141, TCONS_00018134, TCONS_00031283, TCONS_00034998, TCONS_00036781, XR_518424.2, XR_518559.2, XR_519023.2, XR_001792558.1, XR_001795599.1 |
| QXR_S3 b vs. ZKR_S3 | TCONS_00008020, TCONS_00015535, TCONS_00035456, XR_515521.2, XR_517087.2, XR_519431.2, XR_001792689.1, XR_001792882.1, XR_001794410.1, XR_001795042.1 |
| Term a ID | Term Description | Gene Symbols | p-Value | FDR b |
|---|---|---|---|---|
| GO terms for co-expressed mRNAs of TCONS_00013557 | ||||
| GO:0001502 | cartilage condensation | ACAN; COL11A1; COL2A1 | 1.62 × 10⁻⁶ | 0.000197 |
| GO:0030199 | collagen fibril organization | ACAN; COL11A1; COL2A1 | 1.90 × 10⁻⁵ | 0.001158 |
| GO:0006029 | proteoglycan metabolic process | COL11A1; COL2A1 | 3.35 × 10⁻⁵ | 0.001362 |
| GO:0002062 | chondrocyte differentiation | MATN1; COL2A1; OSR2 | 7.32 × 10⁻⁵ | 0.002015 |
| GO:0060272 | embryonic skeletal joint morphogenesis | OSR2; COL2A1 | 8.26 × 10⁻⁵ | 0.002015 |
| GO:0030198 | extracellular matrix organization | COL9A1; COL11A1; IBSP; COL2A1 | 0.0002075 | 0.004219 |
| GO:0002063 | chondrocyte development | ACAN; COL11A1 | 0.0003181 | 0.005543 |
| GO:0035987 | endodermal cell differentiation | COL11A1; COL12A1 | 0.0011231 | 0.017127 |
| GO:0030574 | collagen catabolic process | COL11A1; COL2A1 | 0.0023463 | 0.031805 |
| GO:0048704 | embryonic skeletal system morphogenesis | COL11A1; OSR2 | 0.0026094 | 0.031835 |
| GO:0005578 | proteinaceous extracellular matrix | MATN1; COL12A1; COL9A2; LECT1; ACAN; COL9A1; CHAD | 3.53 × 10⁻⁸ | 1.06 × 10⁻⁶ |
| GO:0005594 | collagen type IX trimer | COL9A1; COL9A2 | 1.49 × 10⁻⁵ | 0.000224 |
| GO:0005788 | endoplasmic reticulum lumen | COL9A1; COL11A1; COL2A1 | 0.0010591 | 0.010591 |
| GO:0031012 | extracellular matrix | COL12A1; IBSP; COL2A1 | 0.0015573 | 0.01168 |
| GO:0005859 | muscle myosin complex | LOC103348296 | 0.0044683 | 0.02681 |
| GO:0005604 | basement membrane | ACAN; COL2A1 | 0.0068787 | 0.034393 |
| GO:0001739 | sex chromatin | SUZ12 | 0.0096571 | 0.039576 |
| GO:0005576 | extracellular region | PRSS35; COL11A1; COL9A1; IBSP; COL2A1 | 0.0106248 | 0.039576 |
| GO:0016461 | unconventional myosin complex | LOC103348296 | 0.0118729 | 0.039576 |
| GO:0030020 | extracellular matrix structural constituent conferring tensile strength | COL9A1; COL2A1 | 1.45 × 10⁻⁵ | 0.000439 |
| GO:0005201 | extracellular matrix structural constituent | MATN1; COL11A1; ACAN | 2.37 × 10⁻⁵ | 0.000439 |
| GO:0030674 | protein binding, bridging | CRADD; COL11A1 | 0.0015134 | 0.018665 |
| GO:0000773 | phosphatidyl-N-methylethanolamine N-methyltransferase activity | PEMT | 0.0035077 | 0.021631 |
| GO:0080101 | phosphatidyl-N-dimethylethanolamine N-methyltransferase activity | PEMT | 0.0035077 | 0.021631 |
| GO:0004608 | phosphatidylethanolamine N-methyltransferase activity | PEMT | 0.0035077 | 0.021631 |
| GO:0033699 | DNA 5′-adenosine monophosphate hydrolase activity | APTX | 0.0052572 | 0.023118 |
| GO:0048407 | platelet-derived growth factor binding | COL2A1 | 0.0070038 | 0.023118 |
| GO:0016918 | retinal binding | CRABP1 | 0.0070038 | 0.023118 |
| GO:0008429 | phosphatidylethanolamine binding | PEMT | 0.0070038 | 0.023118 |
| GO terms for co-expressed mRNAs of XR_518424.2 | ||||
| GO:0007519 | skeletal muscle tissue development | VGLL2; CAV1; HOXD10; CAV1 | 5.64 × 10⁻⁶ | 0.000954 |
| GO:0006641 | triglyceride metabolic process | CAV1; PTPN11; CAV1 | 1.78 × 10⁻⁵ | 0.000954 |
| GO:1901979 | regulation of inward rectifier potassium channel activity | CAV1; CAV1 | 2.25 × 10⁻⁵ | 0.000954 |
| GO:0003057 | regulation of the force of heart contraction by chemical signal | CAV1; CAV1 | 2.25 × 10⁻⁵ | 0.000954 |
| GO:0086098 | angiotensin-activated signaling pathway involved in heart process | CAV1; CAV1 | 2.25 × 10⁻⁵ | 0.000954 |
| GO:0033484 | nitric oxide homeostasis | CAV1; CAV1 | 2.25 × 10⁻⁵ | 0.000954 |
| GO:0001937 | negative regulation of endothelial cell proliferation | CAV1; LOC100339409; CAV1 | 2.69 × 10⁻⁵ | 0.000954 |
| GO:0070836 | caveola assembly | CAV1; CAV1 | 3.00 × 10⁻⁵ | 0.000954 |
| GO:0060056 | mammary gland involution | CAV1; CAV1 | 3.00 × 10⁻⁵ | 0.000954 |
| GO:0019065 | receptor-mediated endocytosis of virus by host cell | CAV1; CAV1 | 3.86 × 10⁻⁵ | 0.000954 |
| GO:0034098 | VCP-NPL4-UFD1 AAA ATPase complex | CAV1; CAV1 | 9.36 × 10⁻⁵ | 0.004681 |
| GO:0002080 | acrosomal membrane | CAV1; CAV1 | 0.001231186 | 0.03078 |
| GO:0030018 | Z disc | FHL3; FHOD3; RA_M006_JSM7BED4F | 0.002062968 | 0.034383 |
| GO:0016504 | peptidase activator activity | CAV1; CAV1 | 0.000356053 | 0.023856 |
| GO:0071209 | U7 snRNA binding | LSM10 | 0.006180344 | 0.045963 |
| GO:0034988 | Fc-gamma receptor I complex binding | RA_M006_JSM7BED4F | 0.006180344 | 0.045963 |
| GO:0015036 | disulfide oxidoreductase activity | TXNL1 | 0.006180344 | 0.045963 |
| GO:0043532 | angiostatin binding | LOC100339409 | 0.006180344 | 0.045963 |
| GO:0005519 | cytoskeletal regulatory protein binding | CDC42EP3 | 0.007206806 | 0.045963 |
| GO:0042030 | ATPase inhibitor activity | LOC100339409 | 0.007206806 | 0.045963 |
| GO:0004871 | signal transducer activity | TRIM13; RA_M006_JSM7BED4F; TMEM9B | 0.007345729 | 0.045963 |
| GO:0001161 | intronic transcription regulatory region sequence-specific DNA binding | BCL6 | 0.008232242 | 0.045963 |
| GO:0052731 | phosphocholine phosphatase activity | PHOSPHO1 | 0.008232242 | 0.045963 |
| Gene | Sequence | Annealing Temperature (°C) | Aim Band Length (bp) |
|---|---|---|---|
| TCONS_00013557 | F 5′ GCTGCTGCCCTTGGACCTT 3′ | 60 | 58 |
| TCONS_00013557 | R 5′ CGTCACCCACAAACAGAGCA 3′ | ||
| Osr2 (XM_008255788.2) | F 5′ GCACACCCAGACCTCGCCG 3′ | 60 | 101 |
| Osr2 (XM_008255788.2) | R 5′ AACAACACGTAGAAAATAGCCCG 3′ | ||
| Col2a1 (XM_002723439.3) | F 5′ CATGAGGGCGCGGTAGAGA 3′ | 60 | 193 |
| Col2a1 (XM_002723439.3) | R 5′ CTTTGGTCCTGGTTTCCGG 3′ | ||
| Col11a1 (XM_017346047.1) | F 5′ CTGGATCCAATGAGATAAATGGC 3′ | 60 | 104 |
| Col11a1 (XM_017346047.1) | R 5′ CCCTGGTGGTCCTTCAACAA 3′ | ||
| XR_518424.2 | F 5′ ACCCTAGTAATTCAGCCTGCTCT 3′ | 60 | 140 |
| XR_518424.2 | R 5′ TGAGTGGTGAGGGAATGGAATA 3′ | ||
| Vgll2 (XM_008263422.2) | F 5′ TCAGCGTGGACTCAGCTCGT 3′ | 60 | 135 |
| Vgll2 (XM_008263422.2) | R 5′ CACGAAGTGAGAGGCACAGATG 3′ | ||
| Cav1 (XM_008258165.2) | F 5′ TGGGAACGACCTGAGGGTG 3′ | 60 | 56 |
| Cav1 (XM_008258165.2) | R 5′ AGTGTAGAGATGTCCCTGCACCA | ||
| Cav1 (XM_008258166.2) | F 5′ TGAGCGGCCGCTGTCGA 3′ | 60 | 113 |
| Cav1 (XM_008258166.2) | R 5′ ACTTGCTTCTCGTTCACCTCG 3′ | ||
| Hoxd10 (NM_001206424.1) | F 5′ AAGGAAAGCAAAGAGGAAATCAAG 3′ | 60 | 106 |
| Hoxd10 (NM_001206424.1) | R 5′ CCAGCGTTTGGTGCTTAGTGT 3′ | ||
| Gapdh | F 5′ AGGTCGGAGTGAACGGATTTG 3′ | 60 | 60 |
| Gapdh | R 5′ AGTTAAAAGCAGCCCTGGTGAC 3′ |
© 2018 by the authors. Licensee MDPI, Basel, Switzerland. This article is an open access article distributed under the terms and conditions of the Creative Commons Attribution (CC BY) license (http://creativecommons.org/licenses/by/4.0/).
Share and Cite
Kuang, L.; Lei, M.; Li, C.; Zhang, X.; Ren, Y.; Zheng, J.; Guo, Z.; Zhang, C.; Yang, C.; Mei, X.; et al. Identification of Long Non-Coding RNAs Related to Skeletal Muscle Development in Two Rabbit Breeds with Different Growth Rate. Int. J. Mol. Sci. 2018, 19, 2046. https://doi.org/10.3390/ijms19072046
Kuang L, Lei M, Li C, Zhang X, Ren Y, Zheng J, Guo Z, Zhang C, Yang C, Mei X, et al. Identification of Long Non-Coding RNAs Related to Skeletal Muscle Development in Two Rabbit Breeds with Different Growth Rate. International Journal of Molecular Sciences. 2018; 19(7):2046. https://doi.org/10.3390/ijms19072046
Chicago/Turabian StyleKuang, Liangde, Min Lei, Congyan Li, Xiangyu Zhang, Yongjun Ren, Jie Zheng, Zhiqiang Guo, Cuixia Zhang, Chao Yang, Xiuli Mei, and et al. 2018. "Identification of Long Non-Coding RNAs Related to Skeletal Muscle Development in Two Rabbit Breeds with Different Growth Rate" International Journal of Molecular Sciences 19, no. 7: 2046. https://doi.org/10.3390/ijms19072046
APA StyleKuang, L., Lei, M., Li, C., Zhang, X., Ren, Y., Zheng, J., Guo, Z., Zhang, C., Yang, C., Mei, X., Fu, M., & Xie, X. (2018). Identification of Long Non-Coding RNAs Related to Skeletal Muscle Development in Two Rabbit Breeds with Different Growth Rate. International Journal of Molecular Sciences, 19(7), 2046. https://doi.org/10.3390/ijms19072046