Role of mTOR in Glucose and Lipid Metabolism


Abstract
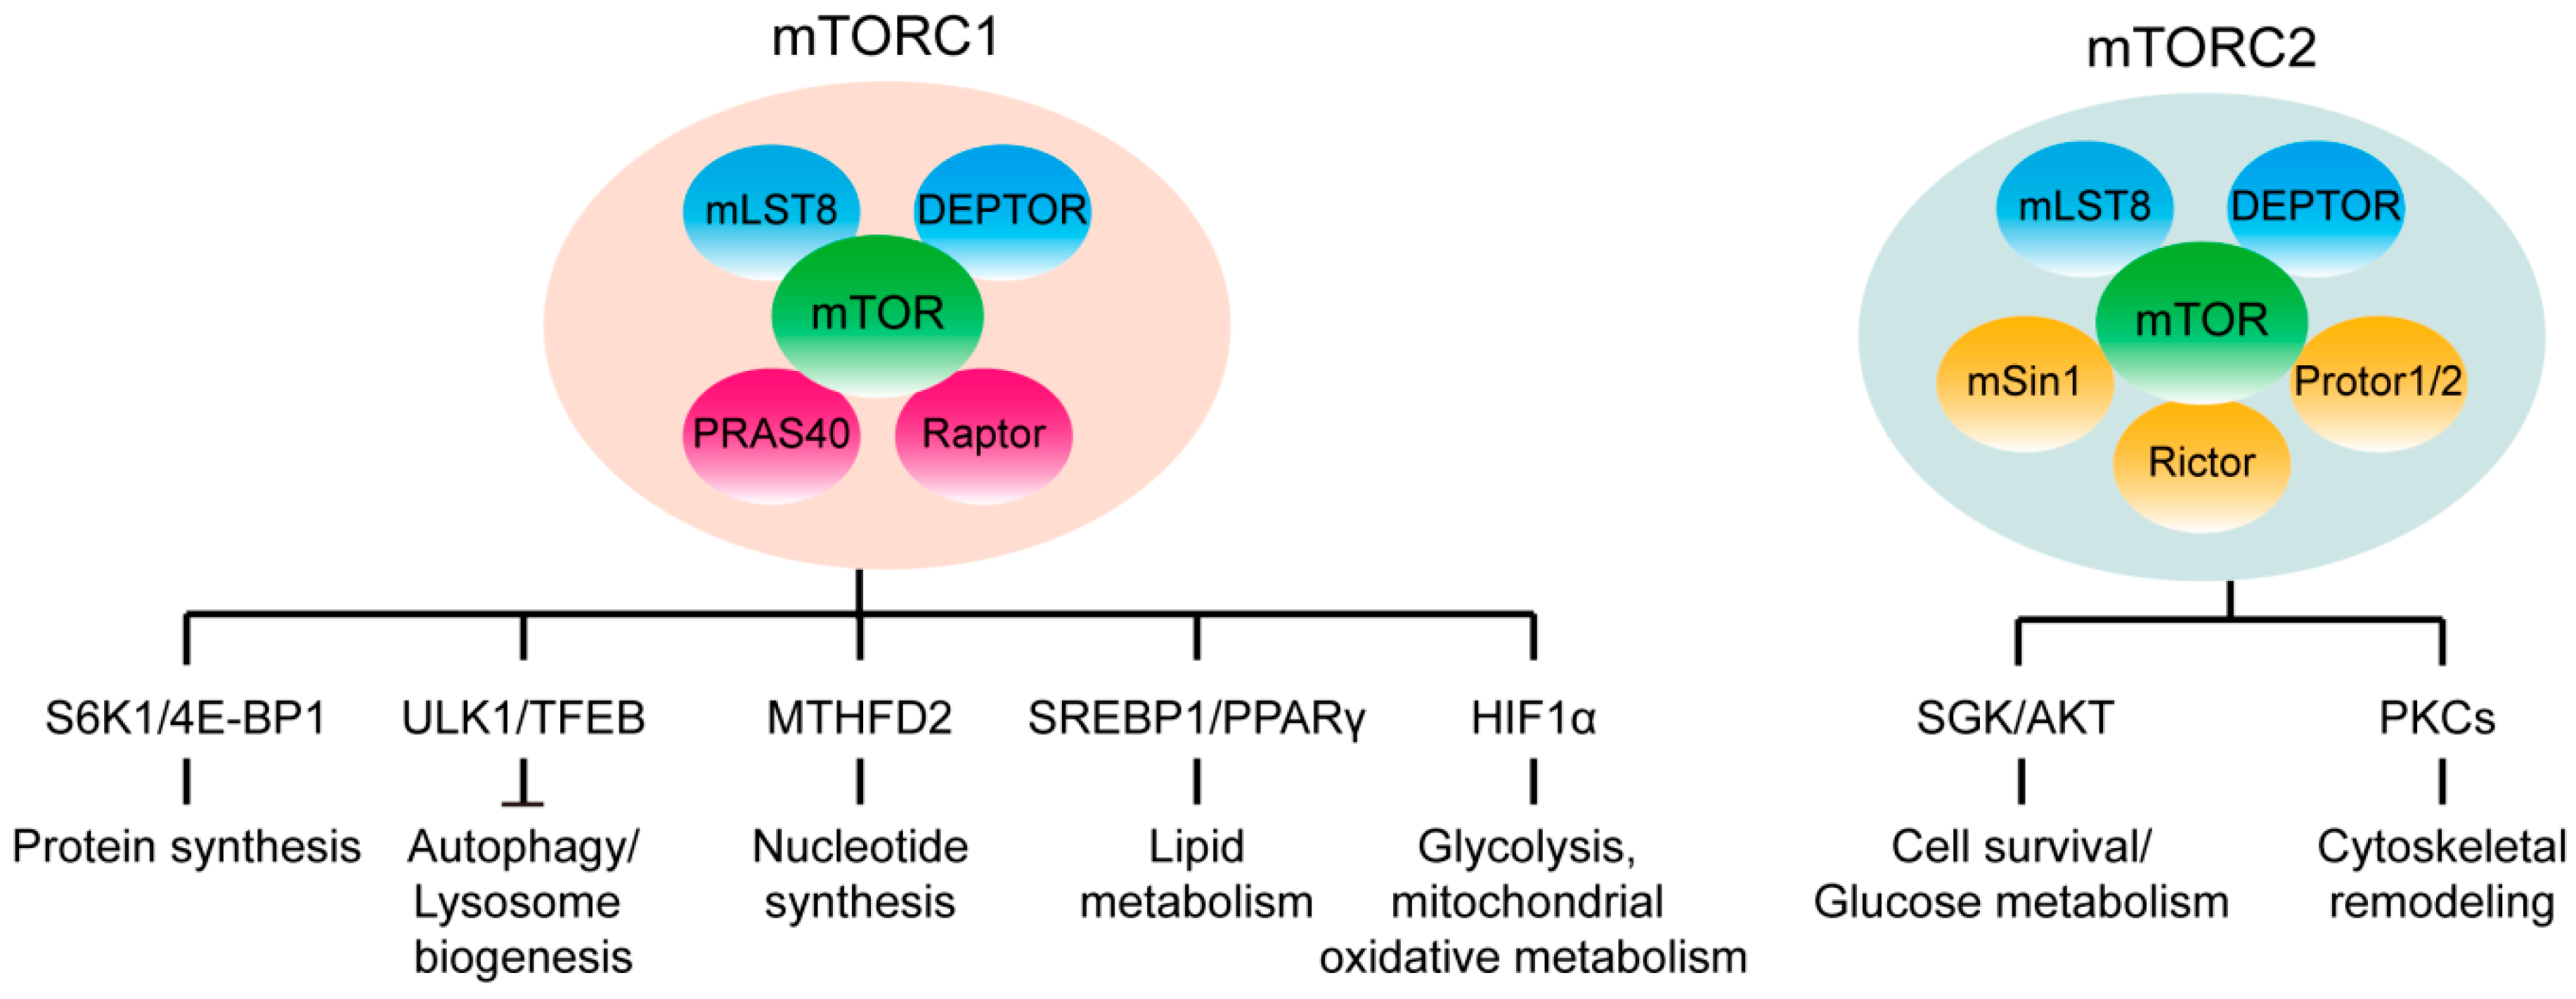
1. mTOR Signaling
2. mTOR Signaling in Adipose Tissue
3. mTOR Signaling in Liver
4. mTOR Signaling in Muscle
5. mTOR Signaling in Pancreas
6. mTOR Signaling in Brain
7. Therapeutic Potential of Targeting mTOR Signaling Pathway
8. Concluding Remarks
Funding
Conflicts of Interest
References
- Saxton, R.A.; Sabatini, D.M. mTOR Signaling in Growth, Metabolism, and Disease. Cell 2017, 168, 960–976. [Google Scholar] [CrossRef] [PubMed]
- Um, S.H.; Frigerio, F.; Watanabe, M.; Picard, F.; Joaquin, M.; Sticker, M.; Fumagalli, S.; Allegrini, P.R.; Kozma, S.C.; Auwerx, J.; et al. Absence of S6K1 protects against age- and diet-induced obesity while enhancing insulin sensitivity. Nature 2004, 431, 200–205. [Google Scholar] [CrossRef] [PubMed]
- Laplante, M.; Sabatini, D.M. mTOR signaling in growth control and disease. Cell 2012, 149, 274–293. [Google Scholar] [CrossRef] [PubMed]
- Yuan, T.; Rafizadeh, S.; Gorrepati, K.D.D.; Lupse, B.; Oberholzer, J.; Maedler, K.; Ardestani, A. Reciprocal regulation of mTOR complexes in pancreatic islets from humans with type 2 diabetes. Diabetologia 2017, 60, 668–678. [Google Scholar] [CrossRef] [PubMed]
- Sancak, Y.; Bar-Peled, L.; Zoncu, R.; Markhard, A.L.; Nada, S.; Sabatini, D.M. Ragulator-Rag Complex Targets mTORC1 to the Lysosomal Surface and Is Necessary for Its Activation by Amino Acids. Cell 2010, 141, 290–303. [Google Scholar] [CrossRef] [PubMed]
- Kim, E.; Goraksha-Hicks, P.; Li, L.; Neufeld, T.P.; Guan, K.-L. Regulation of TORC1 by Rag GTPases in nutrient response. Nat. Cell Biol. 2008, 10, 935–945. [Google Scholar] [CrossRef] [PubMed]
- Inoki, K.; Zhu, T.; Guan, K.L. TSC2 mediates cellular energy response to control cell growth and survival. Cell 2003, 115, 577–590. [Google Scholar] [CrossRef]
- Cornu, M.; Albert, V.; Hall, M.N. mTOR in aging, metabolism, and cancer. Curr. Opin. Genet. Dev. 2013, 23, 53–62. [Google Scholar] [CrossRef] [PubMed]
- Ben-Sahra, I.; Hoxhaj, G.; Ricoult, S.J.H.; Asara, J.M.; Manning, B.D. mTORC1 induces purine synthesis through control of the mitochondrial tetrahydrofolate cycle. Science 2016, 351, 728–733. [Google Scholar] [CrossRef] [PubMed]
- Düvel, K.; Yecies, J.L.; Menon, S.; Raman, P.; Lipovsky, A.I.; Souza, A.L.; Triantafellow, E.; Ma, Q.; Gorski, R.; Cleaver, S.; et al. Activation of a Metabolic Gene Regulatory Network Downstream of mTOR Complex 1. Mol. Cell 2010, 39, 171–183. [Google Scholar] [CrossRef] [PubMed]
- Peterson, T.R.; Sengupta, S.S.; Harris, T.E.; Carmack, A.E.; Kang, S.A.; Balderas, E.; Guertin, D.A.; Madden, K.L.; Carpenter, A.E.; Finck, B.N.; et al. mTOR Complex 1 Regulates Lipin 1 Localization to Control the SREBP Pathway. Cell 2011, 146, 408–420. [Google Scholar] [CrossRef] [PubMed]
- Kim, J.; Kundu, M.; Viollet, B.; Guan, K.-L. AMPK and mTOR regulate autophagy through direct phosphorylation of Ulk1. Nat. Cell Biol. 2011, 13, 132. [Google Scholar] [CrossRef] [PubMed]
- Settembre, C.; Zoncu, R.; Medina, D.L.; Vetrini, F.; Erdin, S.; Erdin, S.; Huynh, T.; Ferron, M.; Karsenty, G.; Vellard, M.C.; et al. A lysosome-to-nucleus signalling mechanism senses and regulates the lysosome via mTOR and TFEB. EMBO J. 2012, 31, 1095–1108. [Google Scholar] [CrossRef] [PubMed]
- Zhao, J.; Zhai, B.; Gygi, S.P.; Goldberg, A.L. mTOR inhibition activates overall protein degradation by the ubiquitin proteasome system as well as by autophagy. Proc. Natl. Acad. Sci. USA 2015, 112, 15790–15797. [Google Scholar] [CrossRef] [PubMed]
- Rousseau, A.; Bertolotti, A. An evolutionarily conserved pathway controls proteasome homeostasis. Nature 2016, 536, 184–189. [Google Scholar] [CrossRef] [PubMed]
- Shan, T.; Zhang, P.; Jiang, Q.; Xiong, Y.; Wang, Y.; Kuang, S. Adipocyte-specific deletion of mTOR inhibits adipose tissue development and causes insulin resistance in mice. Diabetologia 2016, 59, 1995–2004. [Google Scholar] [CrossRef] [PubMed]
- Arif, A.; Terenzi, F.; Potdar, A.A.; Jia, J.; Sacks, J.; China, A.; Halawani, D.; Vasu, K.; Li, X.X.; Brown, J.M.; et al. EPRS is a critical mTORC1-S6K1 effector that influences adiposity in mice. Nature 2017, 542, 357–361. [Google Scholar] [CrossRef] [PubMed]
- Xiang, X.; Lan, H.; Tang, H.; Yuan, F.; Xu, Y.; Zhao, J.; Li, Y.; Zhang, W. Tuberous Sclerosis Complex 1–Mechanistic Target of Rapamycin Complex 1 Signaling Determines Brown-to-White Adipocyte Phenotypic Switch. Diabetes 2015, 64, 519–528. [Google Scholar] [CrossRef] [PubMed]
- Liu, D.X.; Bordicchia, M.; Zhang, C.Y.; Fang, H.F.; Wei, W.; Li, J.L.; Guilherme, A.; Guntur, K.; Czech, M.P.; Collins, S. Activation of mTORC1 is essential for beta-adrenergic stimulation of adipose browning. J. Clin. Investig. 2016, 126, 1704–1716. [Google Scholar] [CrossRef] [PubMed]
- Tran, C.M.; Mukherjee, S.; Ye, L.; Frederick, D.W.; Kissig, M.; Davis, J.G.; Lamming, D.W.; Seale, P.; Baur, J.A. Rapamycin Blocks Induction of the Thermogenic Program in White Adipose Tissue. Diabetes 2016, 65, 927–941. [Google Scholar] [CrossRef] [PubMed]
- Cybulski, N.; Polak, P.; Auwerx, J.; Rüegg, M.A.; Hall, M.N. mTOR complex 2 in adipose tissue negatively controls whole-body growth. Proc. Natl. Acad. Sci. USA 2009, 106, 9902–9907. [Google Scholar] [CrossRef] [PubMed]
- Kumar, A.; Lawrence, J.C., Jr.; Jung, D.Y.; Ko, H.J.; Keller, S.R.; Kim, J.K.; Magnuson, M.A.; Harris, T.E. Fat cell-specific ablation of rictor in mice impairs insulin-regulated fat cell and whole-body glucose and lipid metabolism. Diabetes 2010, 59, 1397–1406. [Google Scholar] [CrossRef] [PubMed]
- Yao, Y.; Suraokar, M.; Darnay, B.G.; Hollier, B.G.; Shaiken, T.E.; Asano, T.; Chen, C.-H.; Chang, B.H.-J.; Lu, Y.; Mills, G.B.; et al. BSTA Promotes mTORC2-Mediated Phosphorylation of Akt1 to Suppress Expression of FoxC2 and Stimulate Adipocyte Differentiation. Sci. Signal. 2013, 6, ra2. [Google Scholar] [CrossRef] [PubMed]
- Tang, Y.F.; Wallace, M.; Sanchez-Gurmaches, J.; Hsiao, W.Y.; Li, H.W.; Lee, P.L.; Vernia, S.; Metallo, C.M.; Guertin, D.A. Adipose tissue mTORC2 regulates ChREBP-driven de novo lipogenesis and hepatic glucose metabolism. Nat. Commun. 2016, 7, 14. [Google Scholar] [CrossRef] [PubMed]
- Hung, C.-M.; Calejman, C.M.; Sanchez-Gurmaches, J.; Li, H.; Clish, C.B.; Hettmer, S.; Wagers, A.J.; Guertin, D.A. Rictor/mTORC2 loss in the Myf5 lineage reprograms brown fat metabolism and protects mice against obesity and metabolic disease. Cell Rep. 2014, 8, 256–271. [Google Scholar] [CrossRef] [PubMed]
- Albert, V.; Svensson, K.; Shimobayashi, M.; Colombi, M.; Muñoz, S.; Jimenez, V.; Handschin, C.; Bosch, F.; Hall, M.N. mTORC2 sustains thermogenesis via Akt-induced glucose uptake and glycolysis in brown adipose tissue. EMBO Mol. Med. 2016, 8, 232–246. [Google Scholar] [CrossRef] [PubMed]
- Sengupta, S.; Peterson, T.R.; Laplante, M.; Oh, S.; Sabatini, D.M. mTORC1 controls fasting-induced ketogenesis and its modulation by ageing. Nature 2010, 468, 1100. [Google Scholar] [CrossRef] [PubMed]
- Li, Z.; Xu, G.; Qin, Y.; Zhang, C.; Tang, H.; Yin, Y.; Xiang, X.; Li, Y.; Zhao, J.; Mulholland, M.; et al. Ghrelin promotes hepatic lipogenesis by activation of mTOR-PPARγ signaling pathway. Proc. Natl. Acad. Sci. USA 2014, 111, 13163–13168. [Google Scholar] [CrossRef] [PubMed]
- Han, J.B.; Li, E.W.; Chen, L.Q.; Zhang, Y.Y.; Wei, F.C.; Liu, J.Y.; Deng, H.T.; Wang, Y.G. The CREB coactivator CRTC2 controls hepatic lipid metabolism by regulating SREBP1. Nature 2015, 524, 243. [Google Scholar] [CrossRef] [PubMed]
- Kim, K.; Qiang, L.; Hayden, M.S.; Sparling, D.P.; Purcell, N.H.; Pajvani, U.B. mTORC1-independent Raptor prevents hepatic steatosis by stabilizing PHLPP2. Nat. Commun. 2016, 7, 10. [Google Scholar] [CrossRef] [PubMed]
- Cornu, M.; Oppliger, W.; Albert, V.; Robitaille, A.M.; Trapani, F.; Quagliata, L.; Fuhrer, T.; Sauer, U.; Terracciano, L.; Hall, M.N. Hepatic mTORC1 controls locomotor activity, body temperature, and lipid metabolism through FGF21. Proc. Natl. Acad. Sci. USA 2014, 111, 11592–11599. [Google Scholar] [PubMed]
- Lee, J.H.; Budanov, A.V.; Talukdar, S.; Park, E.J.; Park, H.L.; Park, H.W.; Bandyopadhyay, G.; Li, N.; Aghajan, M.; Jang, I.; et al. Maintenance of metabolic homeostasis by Sestrin2 and Sestrin3. Cell Metab. 2012, 16, 311–321. [Google Scholar] [CrossRef] [PubMed]
- Park, H.W.; Park, H.; Ro, S.H.; Jang, I.; Semple, I.A.; Kim, D.N.; Kim, M.; Nam, M.; Zhang, D.; Yin, L.; et al. Hepatoprotective role of Sestrin2 against chronic ER stress. Nat. Commun. 2014, 5, 4233. [Google Scholar] [CrossRef] [PubMed]
- Howell, J.J.; Hellberg, K.; Turner, M.; Talbott, G.; Kolar, M.J.; Ross, D.S.; Hoxhaj, G.; Saghatelian, A.; Shaw, R.J.; Manning, B.D. Metformin Inhibits Hepatic mTORC1 Signaling via Dose-Dependent Mechanisms Involving AMPK and the TSC Complex. Cell Metab. 2017, 25, 463–471. [Google Scholar] [CrossRef] [PubMed]
- Hagiwara, A.; Cornu, M.; Cybulski, N.; Polak, P.; Betz, C.; Trapani, F.; Terracciano, L.; Heim, M.H.; Rüegg, M.A.; Hall, M.N. Hepatic mTORC2 Activates Glycolysis and Lipogenesis through Akt, Glucokinase, and SREBP1c. Cell Metab. 2012, 15, 725–738. [Google Scholar] [CrossRef] [PubMed]
- Yuan, M.; Pino, E.; Wu, L.; Kacergis, M.; Soukas, A.A. Identification of Akt-independent Regulation of Hepatic Lipogenesis by Mammalian Target of Rapamycin (mTOR) Complex 2. J. Biol. Chem. 2012, 287, 29579–29588. [Google Scholar] [CrossRef] [PubMed]
- Lamming, D.W.; Ye, L.; Katajisto, P.; Goncalves, M.D.; Saitoh, M.; Stevens, D.M.; Davis, J.G.; Salmon, A.B.; Richardson, A.; Ahima, R.S.; et al. Rapamycin-Induced Insulin Resistance Is Mediated by mTORC2 Loss and Uncoupled from Longevity. Science 2012, 335, 1638–1643. [Google Scholar] [PubMed]
- Tao, R.; Xiong, X.; Liangpunsakul, S.; Dong, X.C. Sestrin 3 Protein Enhances Hepatic Insulin Sensitivity by Direct Activation of the mTORC2-Akt Signaling. Diabetes 2015, 64, 1211–1223. [Google Scholar] [CrossRef] [PubMed]
- Javary, J.; Allain-Courtois, N.; Saucisse, N.; Costet, P.; Heraud, C.; Benhamed, F.; Pierre, R.; Bure, C.; Pallares-Lupon, N.; Do Cruzeiro, M.; et al. Liver Reptin/RUVBL2 controls glucose and lipid metabolism with opposite actions on mTORC1 and mTORC2 signalling. Gut 2017. [Google Scholar] [CrossRef] [PubMed]
- Bentzinger, C.F.; Romanino, K.; Cloëtta, D.; Lin, S.; Mascarenhas, J.B.; Oliveri, F.; Xia, J.; Casanova, E.; Costa, C.F.; Brink, M.; et al. Skeletal Muscle-Specific Ablation of raptor, but Not of rictor, Causes Metabolic Changes and Results in Muscle Dystrophy. Cell Metab. 2008, 8, 411–424. [Google Scholar] [CrossRef] [PubMed]
- Lopez, R.J.; Mosca, B.; Treves, S.; Maj, M.; Bergamelli, L.; Calderon, J.C.; Bentzinger, C.F.; Romanino, K.; Hall, M.N.; Ruegg, M.A.; et al. Raptor ablation in skeletal muscle decreases Cav1.1 expression and affects the function of the excitation-contraction coupling supramolecular complex. Biochem. J. 2015, 466, 123–135. [Google Scholar] [CrossRef] [PubMed]
- Guridi, M.; Kupr, B.; Romanino, K.; Lin, S.; Falcetta, D.; Tintignac, L.; Rüegg, M.A. Alterations to mTORC1 signaling in the skeletal muscle differentially affect whole-body metabolism. Skeletal Muscle 2016, 6, 13. [Google Scholar] [CrossRef] [PubMed]
- Guridi, M.; Tintignac, L.A.; Lin, S.; Kupr, B.; Castets, P.; Rüegg, M.A. Activation of mTORC1 in skeletal muscle regulates whole-body metabolism through FGF21. Sci. Signal. 2015, 8, ra113. [Google Scholar] [CrossRef] [PubMed]
- Tsai, S.; Sitzmann, J.M.; Dastidar, S.G.; Rodriguez, A.A.; Vu, S.L.; McDonald, C.E.; Academia, E.C.; O’Leary, M.N.; Ashe, T.D.; La Spada, A.R.; et al. Muscle-specific 4E-BP1 signaling activation improves metabolic parameters during aging and obesity. J. Clin. Investig. 2015, 125, 2952–2964. [Google Scholar] [CrossRef] [PubMed]
- Lipina, C.; Hundal, H.S. Is REDD1 a Metabolic Eminence Grise? Trends Endocrinol. Metab. TEM 2016, 27, 868–880. [Google Scholar] [CrossRef] [PubMed]
- Tan, C.Y.; Hagen, T. mTORC1 dependent regulation of REDD1 protein stability. PLoS ONE 2013, 8, e63970. [Google Scholar] [CrossRef] [PubMed]
- Williamson, D.L.; Li, Z.; Tuder, R.M.; Feinstein, E.; Kimball, S.R.; Dungan, C.M. Altered nutrient response of mTORC1 as a result of changes in REDD1 expression: Effect of obesity vs. REDD1 deficiency. J. Appl. Physiol. 2014, 117, 246–256. [Google Scholar] [CrossRef] [PubMed]
- Williamson, D.L.; Dungan, C.M.; Mahmoud, A.M.; Mey, J.T.; Blackburn, B.K.; Haus, J.M. Aberrant REDD1-mTORC1 responses to insulin in skeletal muscle from Type 2 diabetics. Am. J. Physiol. Regul. Integr. Comp. Physiol. 2015, 309, R855–R863. [Google Scholar] [CrossRef] [PubMed]
- Castets, P.; Lin, S.; Rion, N.; Di Fulvio, S.; Romanino, K.; Guridi, M.; Frank, S.; Tintignac, L.A.; Sinnreich, M.; Rüegg, M.A. Sustained Activation of mTORC1 in Skeletal Muscle Inhibits Constitutive and Starvation-Induced Autophagy and Causes a Severe, Late-Onset Myopathy. Cell Metab. 2013, 17, 731–744. [Google Scholar] [CrossRef] [PubMed]
- Tang, H.; Inoki, K.; Lee, M.; Wright, E.; Khuong, A.; Khuong, A.; Sugiarto, S.; Garner, M.; Paik, J.; DePinho, R.A.; et al. mTORC1 Promotes Denervation-Induced Muscle Atrophy Through a Mechanism Involving the Activation of FoxO and E3 Ubiquitin Ligases. Sci. Signal. 2014, 7, ra18. [Google Scholar] [CrossRef] [PubMed]
- Kumar, A.; Harris, T.E.; Keller, S.R.; Choi, K.M.; Magnuson, M.A.; Lawrence, J.C., Jr. Muscle-specific deletion of rictor impairs insulin-stimulated glucose transport and enhances Basal glycogen synthase activity. Mol. Cell Biol. 2008, 28, 61–70. [Google Scholar] [CrossRef] [PubMed]
- Kleinert, M.; Sylow, L.; Fazakerley, D.J.; Krycer, J.R.; Thomas, K.C.; Oxboll, A.J.; Jordy, A.B.; Jensen, T.E.; Yang, G.; Schjerling, P.; et al. Acute mTOR inhibition induces insulin resistance and alters substrate utilization in vivo. Mol. Metab. 2014, 3, 630–641. [Google Scholar] [CrossRef] [PubMed]
- Kleinert, M.; Parker, B.L.; Chaudhuri, R.; Fazakerley, D.J.; Serup, A.; Thomas, K.C.; Krycer, J.R.; Sylow, L.; Fritzen, A.M.; Hoffman, N.J.; et al. mTORC2 and AMPK differentially regulate muscle triglyceride content via Perilipin 3. Mol. Metab. 2016, 5, 646–655. [Google Scholar] [CrossRef] [PubMed]
- Blandino-Rosano, M.; Barbaresso, R.; Jimenez-Palomares, M.; Bozadjieva, N.; Werneck-de-Castro, J.P.; Hatanaka, M.; Mirmira, R.G.; Sonenberg, N.; Liu, M.; Ruegg, M.A.; et al. Loss of mTORC1 signalling impairs beta-cell homeostasis and insulin processing. Nat. Commun. 2017, 8, 16014. [Google Scholar] [CrossRef] [PubMed]
- Chau, G.C.; Im, D.U.; Kang, T.M.; Bae, J.M.; Kim, W.; Pyo, S.; Moon, E.-Y.; Um, S.H. mTOR controls ChREBP transcriptional activity and pancreatic β cell survival under diabetic stress. J. Cell Biol. 2017. [Google Scholar] [CrossRef] [PubMed]
- Elghazi, L.; Blandino-Rosano, M.; Alejandro, E.; Cras-Méneur, C.; Bernal-Mizrachi, E. Role of nutrients and mTOR signaling in the regulation of pancreatic progenitors development. Mol. Metab. 2017, 6, 560–573. [Google Scholar] [CrossRef] [PubMed]
- Ni, Q.; Gu, Y.; Xie, Y.; Yin, Q.; Zhang, H.; Nie, A.; Li, W.; Wang, Y.; Ning, G.; Wang, W.; et al. Raptor regulates functional maturation of murine beta cells. Nat. Commun. 2017, 8, 15755. [Google Scholar] [CrossRef] [PubMed]
- Sinagoga, K.L.; Stone, W.J.; Schiesser, J.V.; Schweitzer, J.I.; Sampson, L.; Zheng, Y.; Wells, J.M. Distinct roles for the mTOR pathway in postnatal morphogenesis, maturation and function of pancreatic islets. Development 2017, 144, 2402–2414. [Google Scholar] [CrossRef] [PubMed]
- Ding, L.; Yin, Y.; Han, L.; Li, Y.; Zhao, J.; Zhang, W. TSC1-mTOR signaling determines the differentiation of islet cells. J. Endocrinol. 2017, 232, 59–70. [Google Scholar] [CrossRef] [PubMed]
- Bartolome, A.; Kimura-Koyanagi, M.; Asahara, S.I.; Guillen, C.; Inoue, H.; Teruyama, K.; Shimizu, S.; Kanno, A.; Garcia-Aguilar, A.; Koike, M.; et al. Pancreatic beta-Cell Failure Mediated by mTORC1 Hyperactivity and Autophagic Impairment. Diabetes 2014, 63, 2996–3008. [Google Scholar] [CrossRef] [PubMed]
- Rachdi, L.; Balcazar, N.; Osorio-Duque, F.; Elghazi, L.; Weiss, A.; Gould, A.; Chang-Chen, K.J.; Gambello, M.J.; Bernal-Mizrachi, E. Disruption of Tsc2 in pancreatic beta cells induces beta cell mass expansion and improved glucose tolerance in a TORC1-dependent manner. Proc. Natl. Acad. Sci. USA 2008, 105, 9250–9255. [Google Scholar] [CrossRef] [PubMed]
- Varshney, R.; Varshney, R.; Mishra, R.; Roy, P. Kaempferol alleviates palmitic acid-induced lipid stores, endoplasmic reticulum stress and pancreatic β-cell dysfunction through AMPK/mTOR-mediated lipophagy. J. Nutr. Biochem. 2018. [Google Scholar] [CrossRef] [PubMed]
- Ardestani, A.; Lupse, B.; Kido, Y.; Leibowitz, G.; Maedler, K. mTORC1 Signaling: A Double-Edged Sword in Diabetic beta Cells. Cell Metab. 2018, 27, 314–331. [Google Scholar] [CrossRef] [PubMed]
- Warren, K.J.; Fang, X.; Gowda, N.M.; Thompson, J.J.; Heller, N.M. The TORC1-activated Proteins, p70S6K and GRB10, Regulate IL-4 Signaling and M2 Macrophage Polarization by Modulating Phosphorylation of Insulin Receptor Substrate-2. J. Biol. Chem. 2016, 291, 24922–24930. [Google Scholar] [CrossRef] [PubMed]
- Wick, K.R.; Werner, E.D.; Langlais, P.; Ramos, F.J.; Dong, L.Q.; Shoelson, S.E.; Liu, F. Grb10 Inhibits Insulin-stimulated Insulin Receptor Substrate (IRS)-Phosphatidylinositol 3-Kinase/Akt Signaling Pathway by Disrupting the Association of IRS-1/IRS-2 with the Insulin Receptor. J. Biol. Chem. 2003, 278, 8460–8467. [Google Scholar] [CrossRef] [PubMed]
- Julien, L.-A.; Carriere, A.; Moreau, J.; Roux, P.P. mTORC1-activated S6K1 phosphorylates Rictor on threonine 1135 and regulates mTORC2 signaling. Mol. Cell. Biol. 2010, 30, 908–921. [Google Scholar] [CrossRef] [PubMed]
- Liu, P.; Gan, W.; Inuzuka, H.; Lazorchak, A.S.; Gao, D.; Arojo, O.; Liu, D.; Wan, L.; Zhai, B.; Yu, Y.; et al. Sin1 phosphorylation impairs mTORC2 complex integrity and inhibits downstream Akt signalling to suppress tumorigenesis. Nat. Cell Biol. 2013, 15, 1340. [Google Scholar] [CrossRef] [PubMed]
- Bozadjieva, N.; Blandino-Rosano, M.; Chase, J.; Dai, X.-Q.; Cummings, K.; Gimeno, J.; Dean, D.; Powers, A.C.; Gittes, G.K.; Rüegg, M.A.; et al. Loss of mTORC1 signaling alters pancreatic α cell mass and impairs glucagon secretion. J. Clin. Investig. 2017, 127, 4379–4393. [Google Scholar] [CrossRef] [PubMed]
- Dean, E.D.; Li, M.; Prasad, N.; Wisniewski, S.N.; Von Deylen, A.; Spaeth, J.; Maddison, L.; Botros, A.; Sedgeman, L.R.; Bozadjieva, N.; et al. Interrupted Glucagon Signaling Reveals Hepatic α Cell Axis and Role for L-Glutamine in α Cell Proliferation. Cell Metab. 2017, 25, 1362–1373. [Google Scholar] [CrossRef] [PubMed]
- Kim, J.; Okamoto, H.; Huang, Z.; Anguiano, G.; Chen, S.; Liu, Q.; Cavino, K.; Xin, Y.; Na, E.; Hamid, R.; et al. Amino Acid Transporter Slc38a5 Controls Glucagon Receptor Inhibition-Induced Pancreatic α Cell Hyperplasia in Mice. Cell Metab. 2017, 25, 1348–1361. [Google Scholar] [CrossRef] [PubMed]
- Solloway, M.J.; Madjidi, A.; Gu, C.; Eastham-Anderson, J.; Clarke, H.J.; Kljavin, N.; Zavala-Solorio, J.; Kates, L.; Friedman, B.; Brauer, M.; et al. Glucagon Couples Hepatic Amino Acid Catabolism to mTOR-Dependent Regulation of α-Cell Mass. Cell Rep. 2015, 12, 495–510. [Google Scholar] [CrossRef] [PubMed]
- Gu, Y.; Lindner, J.; Kumar, A.; Yuan, W.; Magnuson, M.A. Rictor/mTORC2 Is Essential for Maintaining a Balance Between β-Cell Proliferation and Cell Size. Diabetes 2011, 60, 827–837. [Google Scholar] [CrossRef] [PubMed]
- Bockaert, J.; Marin, P. mTOR in Brain Physiology and Pathologies. Physiol. Rev. 2015, 95, 1157–1187. [Google Scholar] [CrossRef] [PubMed]
- Hu, F.; Xu, Y.; Liu, F. Hypothalamic roles of mTOR complex I: Integration of nutrient and hormone signals to regulate energy homeostasis. Am. J. Physiol.-Endocrinol. Metab. 2016, 310, E994–E1002. [Google Scholar] [CrossRef] [PubMed]
- Blouet, C.; Ono, H.; Schwartz, G.J. Mediobasal Hypothalamic p70 S6 Kinase 1 Modulates the Control of Energy Homeostasis. Cell Metab. 2008, 8, 459–467. [Google Scholar] [CrossRef] [PubMed]
- Burke, L.K.; Darwish, T.; Cavanaugh, A.R.; Virtue, S.; Roth, E.; Morro, J.; Liu, S.M.; Xia, J.; Dalley, J.W.; Burling, K.; et al. mTORC1 in AGRP neurons integrates exteroceptive and interoceptive food-related cues in the modulation of adaptive energy expenditure in mice. eLife 2017, 6, 22. [Google Scholar] [CrossRef] [PubMed]
- Smith, M.A.; Katsouri, L.; Irvine, E.E.; Hankir, M.K.; Pedroni, S.M.A.; Voshol, P.J.; Gordon, M.W.; Choudhury, A.I.; Woods, A.; Vidal-Puig, A.; et al. Ribosomal S6K1 in POMC and AgRP Neurons Regulates Glucose Homeostasis but Not Feeding Behavior in Mice. Cell Rep. 2015, 11, 335–343. [Google Scholar] [CrossRef] [PubMed]
- Mori, H.; Inoki, K.; Munzberg, H.; Opland, D.; Faouzi, M.; Villanueva, E.C.; Ikenoue, T.; Kwiatkowski, D.; MacDougald, O.A.; Myers, M.G., Jr.; et al. Critical role for hypothalamic mTOR activity in energy balance. Cell Metab. 2009, 9, 362–374. [Google Scholar] [CrossRef] [PubMed]
- Yang, S.B.; Tien, A.C.; Boddupalli, G.; Xu, A.W.; Jan, Y.N.; Jan, L.Y. Rapamycin ameliorates age-dependent obesity associated with increased mTOR signaling in hypothalamic POMC neurons. Neuron 2012, 75, 425–436. [Google Scholar] [CrossRef] [PubMed]
- Caron, A.; Labbé, S.M.; Lanfray, D.; Blanchard, P.-G.; Villot, R.; Roy, C.; Sabatini, D.M.; Richard, D.; Laplante, M. Mediobasal hypothalamic overexpression of DEPTOR protects against high-fat diet-induced obesity. Mol. Metab. 2016, 5, 102–112. [Google Scholar] [CrossRef] [PubMed]
- Caron, A.; Labbe, S.M.; Mouchiroud, M.; Huard, R.; Lanfray, D.; Richard, D.; Laplante, M. DEPTOR in POMC neurons affects liver metabolism but is dispensable for the regulation of energy balance. Am. J. Physiol.-Regul. Integr. Comp. Physiol. 2016, 310, R1322–R1331. [Google Scholar] [CrossRef] [PubMed]
- Park, A.H.; Park, E.K.; Cho, Y.W.; Kim, S.; Kim, H.M.; Kim, J.A.; Kim, J.; Rhee, H.; Kang, S.G.; Kim, H.D.; et al. Brain somatic mutations in MTOR cause focal cortical dysplasia type II leading to intractable epilepsy. Nat. Med. 2015, 21, 395–400. [Google Scholar]
- Lim, J.S.; Gopalappa, R.; Kim, S.H.; Ramakrishna, S.; Lee, M.; Kim, W.I.; Kim, J.; Park, S.M.; Lee, J.; Oh, J.H.; et al. Somatic Mutations in TSC1 and TSC2 Cause Focal Cortical Dysplasia. Am. J. Hum. Genet. 2017, 100, 454–472. [Google Scholar] [CrossRef] [PubMed]
- Park, S.M.; Lim, J.S.; Ramakrishina, S.; Kim, S.H.; Kim, W.K.; Lee, J.; Kang, H.C.; Reiter, J.F.; Kim, D.S.; Kim, H.H.; et al. Brain Somatic Mutations in MTOR Disrupt Neuronal Ciliogenesis, Leading to Focal Cortical Dyslamination. Neuron 2018. [Google Scholar] [CrossRef] [PubMed]
- Kocalis, H.E.; Hagan, S.L.; George, L.; Turney, M.K.; Siuta, M.A.; Laryea, G.N.; Morris, L.C.; Muglia, L.J.; Printz, R.L.; Stanwood, G.D.; et al. Rictor/mTORC2 facilitates central regulation of energy and glucose homeostasis. Mol. Metab. 2014, 3, 394–407. [Google Scholar] [CrossRef] [PubMed]
- Thomanetz, V.; Angliker, N.; Cloëtta, D.; Lustenberger, R.M.; Schweighauser, M.; Oliveri, F.; Suzuki, N.; Rüegg, M.A. Ablation of the mTORC2 component rictor in brain or Purkinje cells affects size and neuron morphology. J. Cell Biol. 2013, 201, 293–308. [Google Scholar] [CrossRef] [PubMed]
- Harrison, D.E.; Strong, R.; Sharp, Z.D.; Nelson, J.F.; Astle, C.M.; Flurkey, K.; Nadon, N.L.; Wilkinson, J.E.; Frenkel, K.; Carter, C.S.; et al. Rapamycin fed late in life extends lifespan in genetically heterogeneous mice. Nature 2009, 460, 392–395. [Google Scholar] [CrossRef] [PubMed]
- Barlow, A.D.; Nicholson, M.L.; Herbert, T.P. Evidence for Rapamycin Toxicity in Pancreatic β-Cells and a Review of the Underlying Molecular Mechanisms. Diabetes 2013, 62, 2674–2682. [Google Scholar] [CrossRef] [PubMed]
- Deblon, N.; Bourgoin, L.; Veyrat-Durebex, C.; Peyrou, M.; Vinciguerra, M.; Caillon, A.; Maeder, C.; Fournier, M.; Montet, X.; Rohner-Jeanrenaud, F.; et al. Chronic mTOR inhibition by rapamycin induces muscle insulin resistance despite weight loss in rats. Br. J. Pharmacol. 2012, 165, 2325–2340. [Google Scholar] [CrossRef] [PubMed]
- Houde, V.P.; Brule, S.; Festuccia, W.T.; Blanchard, P.G.; Bellmann, K.; Deshaies, Y.; Marette, A. Chronic Rapamycin Treatment Causes Glucose Intolerance and Hyperlipidemia by Upregulating Hepatic Gluconeogenesis and Impairing Lipid Deposition in Adipose Tissue. Diabetes 2010, 59, 1338–1348. [Google Scholar] [CrossRef] [PubMed]
- Pereira, M.J.; Palming, J.; Rizell, M.; Aureliano, M.; Carvalho, E.; Svensson, M.K.; Eriksson, J.W. mTOR inhibition with rapamycin causes impaired insulin signalling and glucose uptake in human subcutaneous and omental adipocytes. Mol. Cell. Endocrinol. 2012, 355, 96–105. [Google Scholar] [CrossRef] [PubMed]
- Reifsnyder, P.C.; Flurkey, K.; Te, A.; Harrison, D.E. Rapamycin treatment benefits glucose metabolism in mouse models of type 2 diabetes. Aging 2016, 8, 3120–3130. [Google Scholar] [CrossRef] [PubMed]
- Ye, L.; Varamini, B.; Lamming, D.; Sabatini, D.; Baur, J. Rapamycin has a biphasic effect on insulin sensitivity in C2C12 myotubes due to sequential disruption of mTORC1 and mTORC2. Front. Genet. 2012, 3, 177. [Google Scholar] [CrossRef] [PubMed]
- Pearce, L.R.; Alton, G.R.; Richter, D.T.; Kath, J.C.; Lingardo, L.; Chapman, J.; Hwang, C.; Alessi, D.R. Characterization of PF-4708671, a novel and highly specific inhibitor of p70 ribosomal S6 kinase (S6K1). Biochem. J. 2010, 431, 245–255. [Google Scholar] [CrossRef] [PubMed]
- Shum, M.; Bellmann, K.; St-Pierre, P.; Marette, A. Pharmacological inhibition of S6K1 increases glucose metabolism and Akt signalling in vitro and in diet-induced obese mice. Diabetologia 2016, 59, 592–603. [Google Scholar] [CrossRef] [PubMed]


| mTORC1 | mTORC2 | |
|---|---|---|
| Adipose tissue | Normal adipose tissue growth [16]; BAT-WAT phenotypic switch [18,19,20] | Regulate fat and whole body organ size [21]; systemic glucose and lipid metabolism [22]; BAT differentiation [25] |
| Liver | Suppress ketogenesis in response to fasting [27]; promote lipogenesis [28,29] | Regulate constitutive gluconeogenesis, increase glycolysis and lipogenesis [35,36] |
| Muscle | Glucose intolerance and insulin resistance, hypertrophy [42,43] | Promote glucose uptake and improve insulin signaling [51]; negatively modualtes systemic lipid metabolism and intramyocellular triglycerid content [52,53] |
| Pancreas | Promote beta cell growth and proliferation [54,55,56,57,58]; improved glucose tolerance in short term, deteriorates beta cell mass and function in long term [60,61]; maintain α cell maturation and glucagon secretion [68] | Maintaining beta cell mass and glucose homeostasis [72] |
| Brain | Regulate the hepatic glucose output, peripheral lipid metabolism and skeletal muscle insulin sensitivity [75,76,77] | Regulate fat mass and adiposity, and glucose tolerance [85] |
© 2018 by the authors. Licensee MDPI, Basel, Switzerland. This article is an open access article distributed under the terms and conditions of the Creative Commons Attribution (CC BY) license (http://creativecommons.org/licenses/by/4.0/).
Share and Cite
Mao, Z.; Zhang, W. Role of mTOR in Glucose and Lipid Metabolism. Int. J. Mol. Sci. 2018, 19, 2043. https://doi.org/10.3390/ijms19072043
Mao Z, Zhang W. Role of mTOR in Glucose and Lipid Metabolism. International Journal of Molecular Sciences. 2018; 19(7):2043. https://doi.org/10.3390/ijms19072043
Chicago/Turabian StyleMao, Zhuo, and Weizhen Zhang. 2018. "Role of mTOR in Glucose and Lipid Metabolism" International Journal of Molecular Sciences 19, no. 7: 2043. https://doi.org/10.3390/ijms19072043
APA StyleMao, Z., & Zhang, W. (2018). Role of mTOR in Glucose and Lipid Metabolism. International Journal of Molecular Sciences, 19(7), 2043. https://doi.org/10.3390/ijms19072043