Article

GBS Mapping and Analysis of Genes Conserved between Gossypium tomentosum and Gossypium hirsutum Cotton Cultivars that Respond to Drought Stress at the Seedling Stage of the BC2F2 Generation

1
State Key Laboratory of Cotton Biology/Institute of Cotton Research, Chinese Academy of Agricultural Sciences, Anyang 455000, China
2
School of Biological and Physical Sciences (SBPS), Main Campus, Jaramogi Oginga Odinga University of Science and Technology (JOOUST), Main Campus, P.O. Box 210-40601 Bondo, Kenya
*
Authors to whom correspondence should be addressed.
These authors contributed equally to this work.
Int. J. Mol. Sci. 2018, 19(6), 1614; https://doi.org/10.3390/ijms19061614
Submission received: 25 April 2018 / Revised: 21 May 2018 / Accepted: 28 May 2018 / Published: 30 May 2018
(This article belongs to the Section Molecular Plant Sciences)

Abstract

:
Cotton production is on the decline due to ever-changing environmental conditions. Drought and salinity stress contribute to over 30% of total loss in cotton production, the situation has worsened more due to the narrow genetic base of the cultivated upland cotton. The genetic diversity of upland cotton has been eroded over the years due to intense selection and inbreeding. To break the bottleneck, the wild cotton progenitors offer unique traits which can be introgressed into the cultivated cotton, thereby improving their performance. In this research, we developed a BC2F2 population between wild male parent, G. tomentosum as the donor, known for its high tolerance to drought and the elite female parent, G. hirsutum as the recurrent parent, which is high yielding but sensitive to drought stress. The population was genotyped through the genotyping by sequencing (GBS) method, in which 10,888 single-nucleotide polymorphism (SNP) s were generated and used to construct a genetic map. The map spanned 4191.3 cM, with average marker distance of 0.3849 cM. The map size of the two sub genomes had a narrow range, 2149 cM and 2042.3 cM for At and Dt_sub genomes respectively. A total of 66,434 genes were mined, with 32,032 (48.2%) and 34,402 (51.8%) genes being obtained within the At and Dt_sub genomes respectively. Pkinase (PF00069) was found to be the dominant domain, with 1069 genes. Analysis of the main sub family, serine threonine protein kinases through gene ontology (GO), cis element and miRNA targets analysis revealed that most of the genes were involved in various functions aimed at enhancing abiotic stress tolerance. Further analysis of the RNA sequence data and qRT-PCR validation revealed 16 putative genes, which were highly up regulated under drought stress condition, and were found to be targeted by ghr-miR169a and ghr-miR164, previously associated with NAC(NAM, ATAF1/2 and CUC2) and myeloblastosis (MYB), the top rank drought stress tolerance genes. These genes can be exploited further to aid in development of more drought tolerant cotton genotypes.

1. Introduction

Cotton has been the number one source of natural fibre, which over the centuries been the indispensable raw material for textile industries globally [1]. Since cotton production has become a major economic activity globally, the desire to have improved production and superior fibre qualities has been the main focus for cotton breeders [2]. For a long period of time, breeding and intensive selection for desirable agronomic traits has negatively affected the diversity, and therefore, reduced the genetic diversity of the modern cotton genotypes [3]. Cotton being a mesophytic plant, its production and fibre quality has been greatly affected by various abiotic and biotic stresses globally [4]. The development of more abiotic stress resilient cotton varieties has become a difficult due to the narrow genetic diversity of the available elite cultivars [5]. Although cotton has been described as a relatively tolerant crop, the rate of salinization of the arable land and diminishing level of fresh water for agriculture compound the desire to have super performing cotton genotypes, with higher productivity in saline soil, and with higher water use efficiency [6].
Several studies have been conducted in various agronomic crops to enhance their genetic diversity and in turn improve their performance under various stress factors [7]. A number of physiological, morphological and molecular aspects of plants to abiotic stress tolerance has been proposed, for instance, leaf morphological and anatomical features of wheat have been found to enhance cell membrane stability and water balance under drought stress [8]. In cotton, root development, closing of the stomata, cellular adaptations, photosynthesis regulation, plant hormonal synthesis such as abscisic acid (ABA) and jasmonic acid (JA) production, and reactive oxygen species (ROS) scavenging enzymes such as catalase (CAT), peroxidase (POD) among others have been strongly suggested as critical for enhancing abiotic stress tolerance [9]. The uses of wild progenitors have been of great significance in boosting the genetic diversity of various crops [10]. In rice, various new and improved genotypes have been developed by crossing the upland rice to its wild relatives [11]. Similar approaches have also been used in wheat [12]. For tetraploid upland cotton, having emerged due to polyploidization of the A and D genomes, direct crossing has been hampered due to chromosomal breakdown and or pollen grain mortality [5]. Globally, upland cotton is known for its superior fibre, high yielding ability, and versatility in a range of climatic conditions, accounting for more than 90% world fibre production [13]. Among the tetraploid cotton, two are prominent strains, G. barbadense known for its superior fibre quality with low lint quantity, though limited by low yield capacity even though widely grown in arid and semi-arid regions globally [14]; and G. hirsutum, on the other hand, which has high yielding capacity but is limited in terms of adaptability to various stress factors and relatively inferior fibre quality compared to G. barbadense [14]. The two upland cotton genotypes would be important varieties to improve cotton in terms of wider adaptability, with increased tolerance to various abiotic stress factors and high yield with improved qualities. However, this has not been possible due to reproductive barrier, indicated by hybrid breakdown in interspecific F2 and advanced generations, even though both are cultivated tetraploid species that originated from the same ancestor 1–2 million years ago [15].
The closest relative to G. hirsutum of the wild type is G. tomentosum [16]. It is endemic to the dry, saline, and rocky environment of Hawaiian island. Several studies have shown that G. tomentosum has an inherent ability to tolerate high levels of salinity and drought stress. Hybridization between G. hirsutum and G. tomentosum has been found to be viable, resulting in a viable offspring [17]. And thus, the introgression of favourable traits from G. tomentosum into the genome of upland cotton has been achieved through the development of an F2:3 population [18]. The F2:3 population has been widely used in the development of genetic maps, a microsatellite-based linkage map was developed spanning a map distance of 3320.8 cM [19], a high density genetic map with map distance of 4365.3 cM [20], and a simple sequence repeat (SSR) based linkage map of 3328.24 cM [18]. In the F2:3 population, the parental contribution is significantly higher, basically 50:50, and thus polymorphism between the offspring’s is relatively higher because of higher probability of gene introgression [21]. Even though several studies have been conducted in the F2:3 population derived from the two tetraploid cotton genotypes, little research work has been done on the backcross inbred lines (BILs). The backcross technique allows for maintenance of higher percentage of the recurrent parent genomic content and only allows for significantly low flow of genetic materials from the donor parents [22]. Backcross method had been valuable for incorporating a blast resistance gene into a rice cultivar [23]; enhancing genetic diversity in soybeans [24]; lowering grain amylose content in rice [25]; improving yield components, agronomic traits, and disease resistance in barley [26]; improving resistance to common bacterial blight in pinto bean (Phaseolus vulgaris L.) [27]. Furthermore, the backcross technique has also been applied in broadening the genetic base of cucumber (Cucumis sativus L.) [28]. Based on the previous research, signifying the importance of backcross method in enhancing the performance of crops, we developed a backcross population between G. hirsutum as the recurrent parent and G. tomentosum as the donor parent. The BC2F2 generations were then genotyped through genotyping by sequence (GBS) in order to develop a fine genetic map with broader application. The map developed was then used to determine the various genes which could have been possibly introgressed from the wild, tolerant donor parent to the recurrent parent.

2. Results

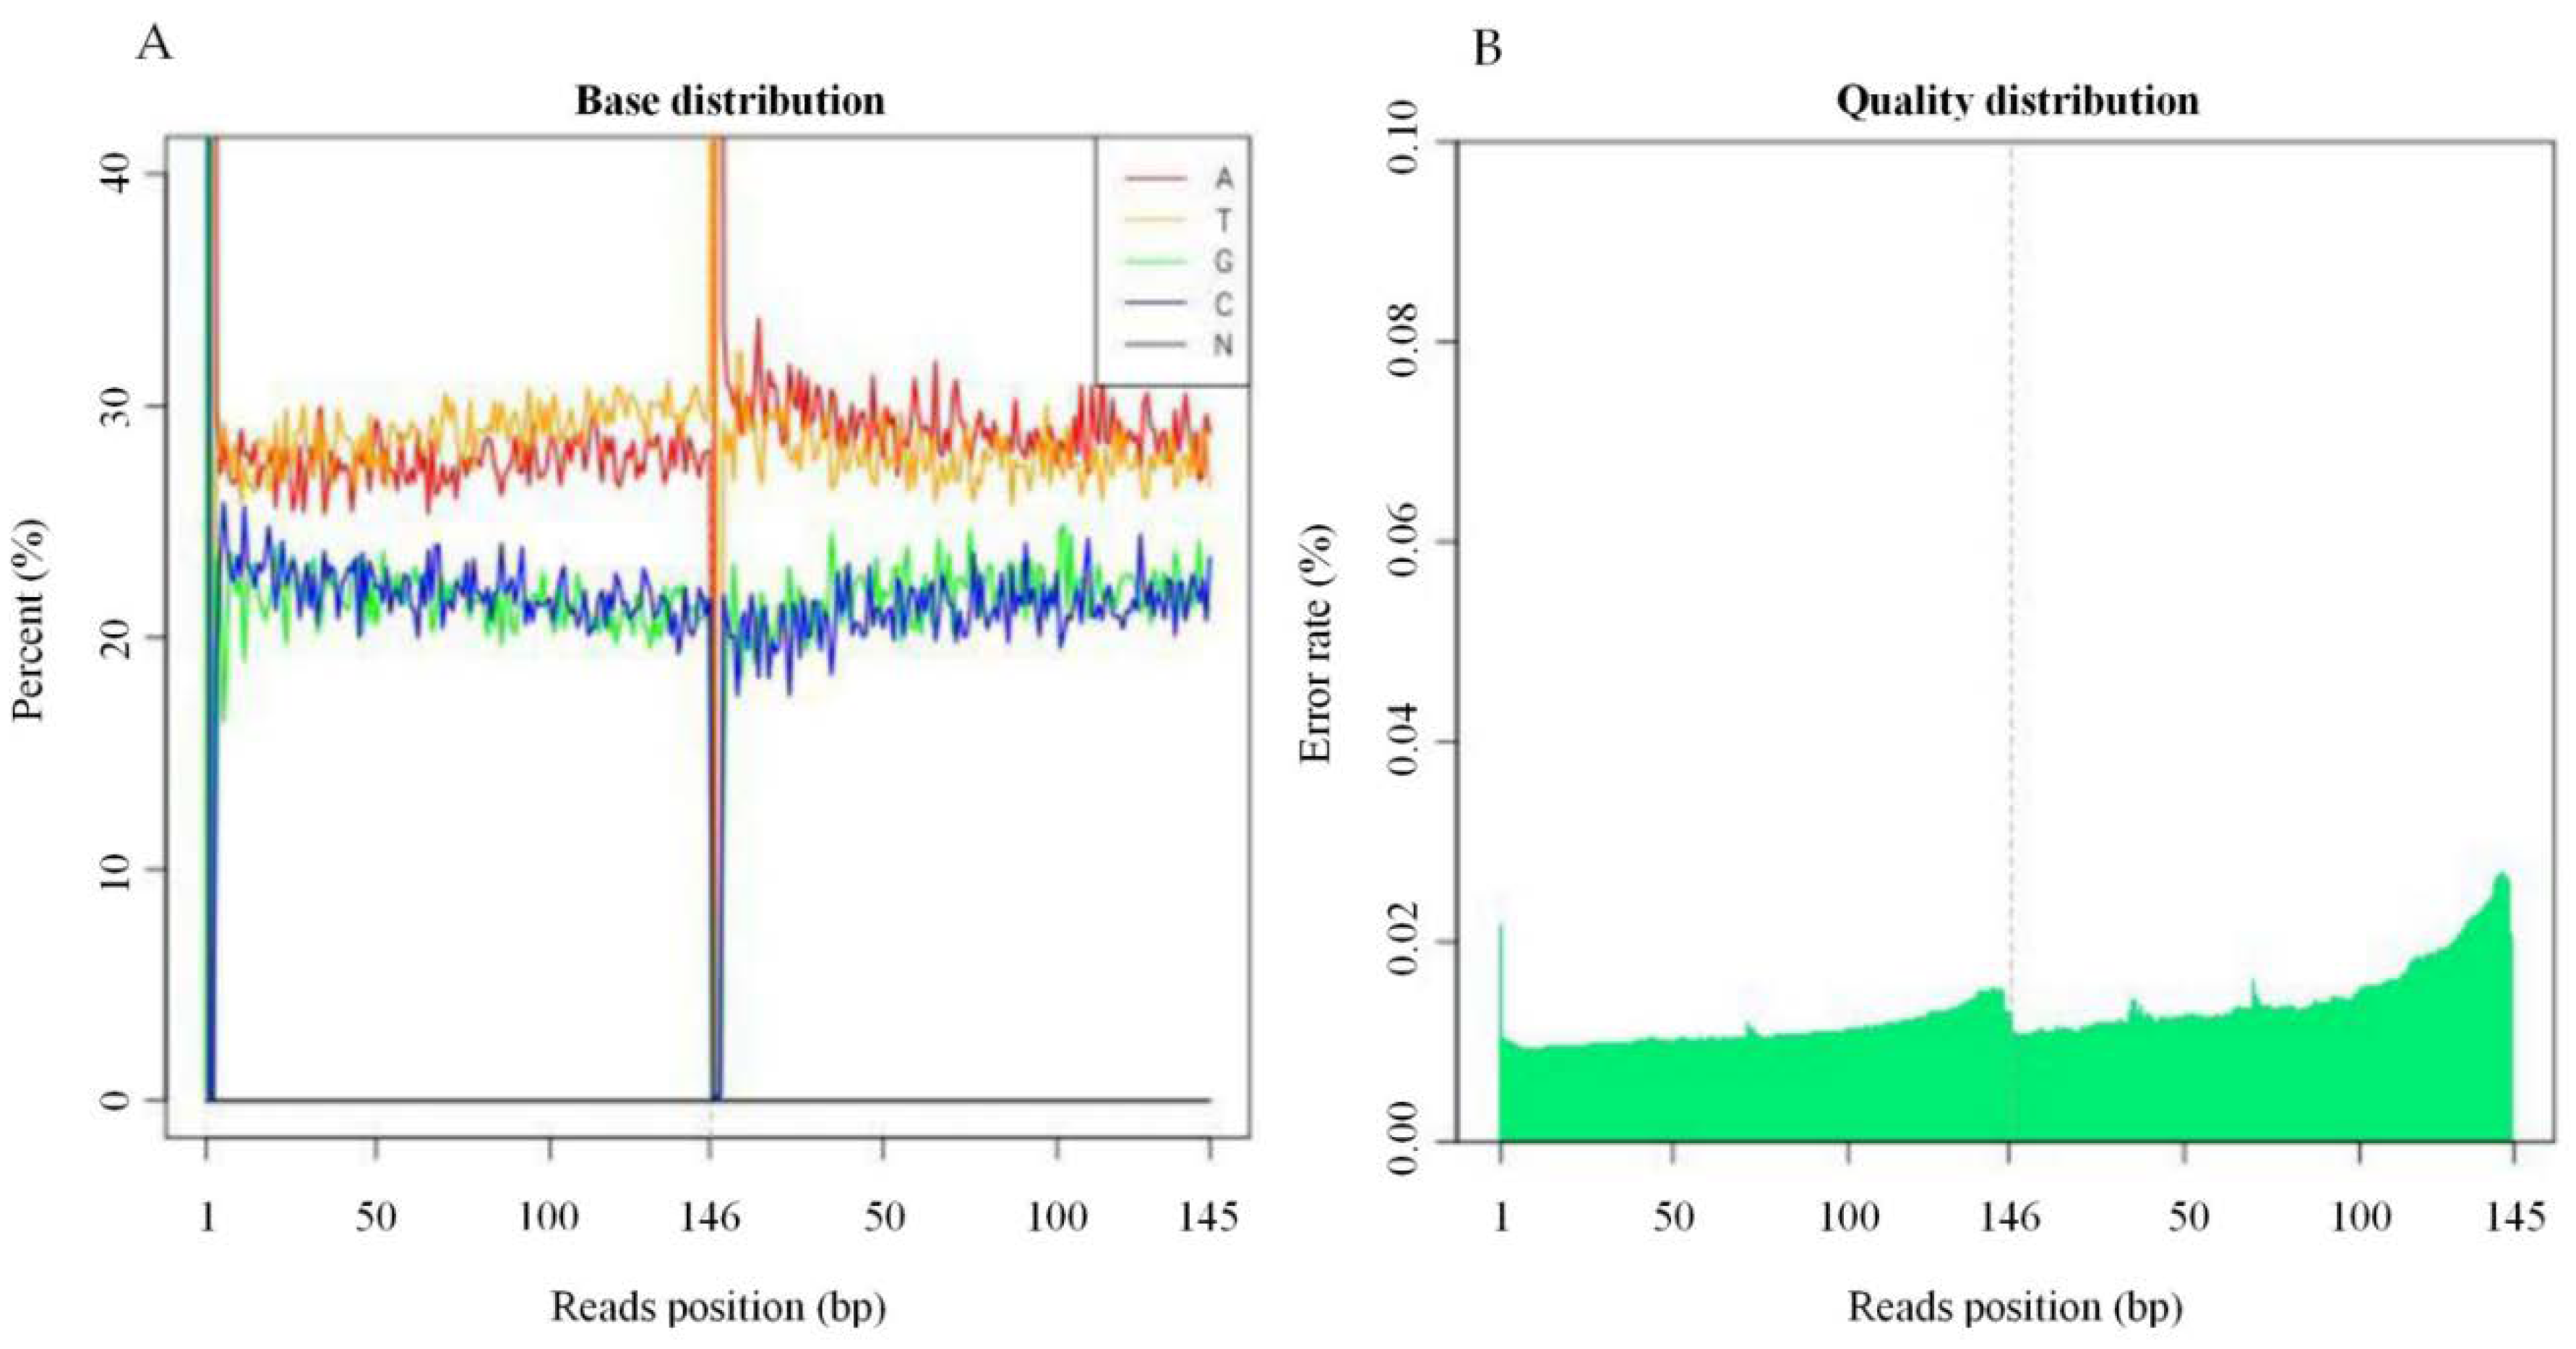
2.1. Sequencing Base Content Distribution, and Error Rate Distribution Statistics

The base content distribution test is generally used to detect the separation of Adenine (A)-Thymine (T) and Guanine (G)-Cytosine (C), “AT” and “GC”, given the randomness of the sequence and base complementarity. The principle of pairing is that, theoretically, GC and AT contents are equal on each sequencing cycle, and they are the same throughout the sequencing process. The “N” is the base type that the sequencer cannot detect (Figure 1A). The sequencing error rate increases with the length of the sequence, caused by the consumption of chemical reagents during the sequencing process. In addition, due to the technical characteristics of Hiseq sequencing, the error rate at the end of the sequencing segment and at the end of several cycles were higher as illustrated in (Figure 1B).

2.2. Raw Sequencing Data Filtering Mechanism, SNP Detection, and Annotation

Illumina’s library-based sequencing platform was used to construct a sequencing library with an insertion size of approximately 400 bp. The library contraction required sequencing agreement between overlaps of paired-end reads in Massively Parallel Sequencing (MPS), also referred to as called Next Generation Sequencing (NGS), which is important in quality filtering to increase sequence accuracy. The MPS genotyping methods do not require fluorescently-labeled oligonucleotides to distinguish amplification products of similar size. Furthermore, it is not necessary to design primers within a color channel to generate amplicons of different sizes to avoid allele overlap. Consequently, all the amplicons can be of a similar, small size (typically < 275 base pairs) [29]. For marker gene analyses, the selection of primer sites within well-conserved regions aids to control the library insert size and specify the extent of overlap between paired-end reads. Alternatively, the insert size of shotgun genomic or metagenomic libraries can be constrained to a narrow range by size selection, which also controls the extent of overlap for the forward and reverse reads. Since Illumina’s raw sequencing data is likely to have some low-quality data. The data was filtered to remove the low-quality reads, five steps were followed; firstly, the adapter sequence removed in reads, the 5′ end containing non-AGCT bases before cutting removed, the reads with lower sequencing quality (sequencing quality values less than Q20) were removed, the reads containing 10% of N were removed, and finally the small fragments of less than 25 bp after the adapter and quality filtering were discarded. The data before and after mass shear were sequenced respectively: reads number, total numbers of bases, average library insert length, and Q30% were obtained (Supplementary Table S1).
Single nucleotide polymorphism (SNP), mainly refers to a single level at the genome. DNA sequence polymorphism caused by nucleotide variation is one of the highest polymorphisms in the genome. The variations of SNP type are of two kinds, the conversion and transversion type. The mutation between the same types is referred to as transition. For example, mutations between purines and purines and or between pyrimidines and pyrimidines, on the other hand, mutation between different types of bases is known as transversions, such as the variation between purines and pyrimidines. In normal condition, conversion is highly favored compared to transversion. The GATK’s Best Practices (Available online: https://software.broadinstitute.org/), was used to process the result (BAM file), using GATK’s Haplotype method of SNP detection [30].

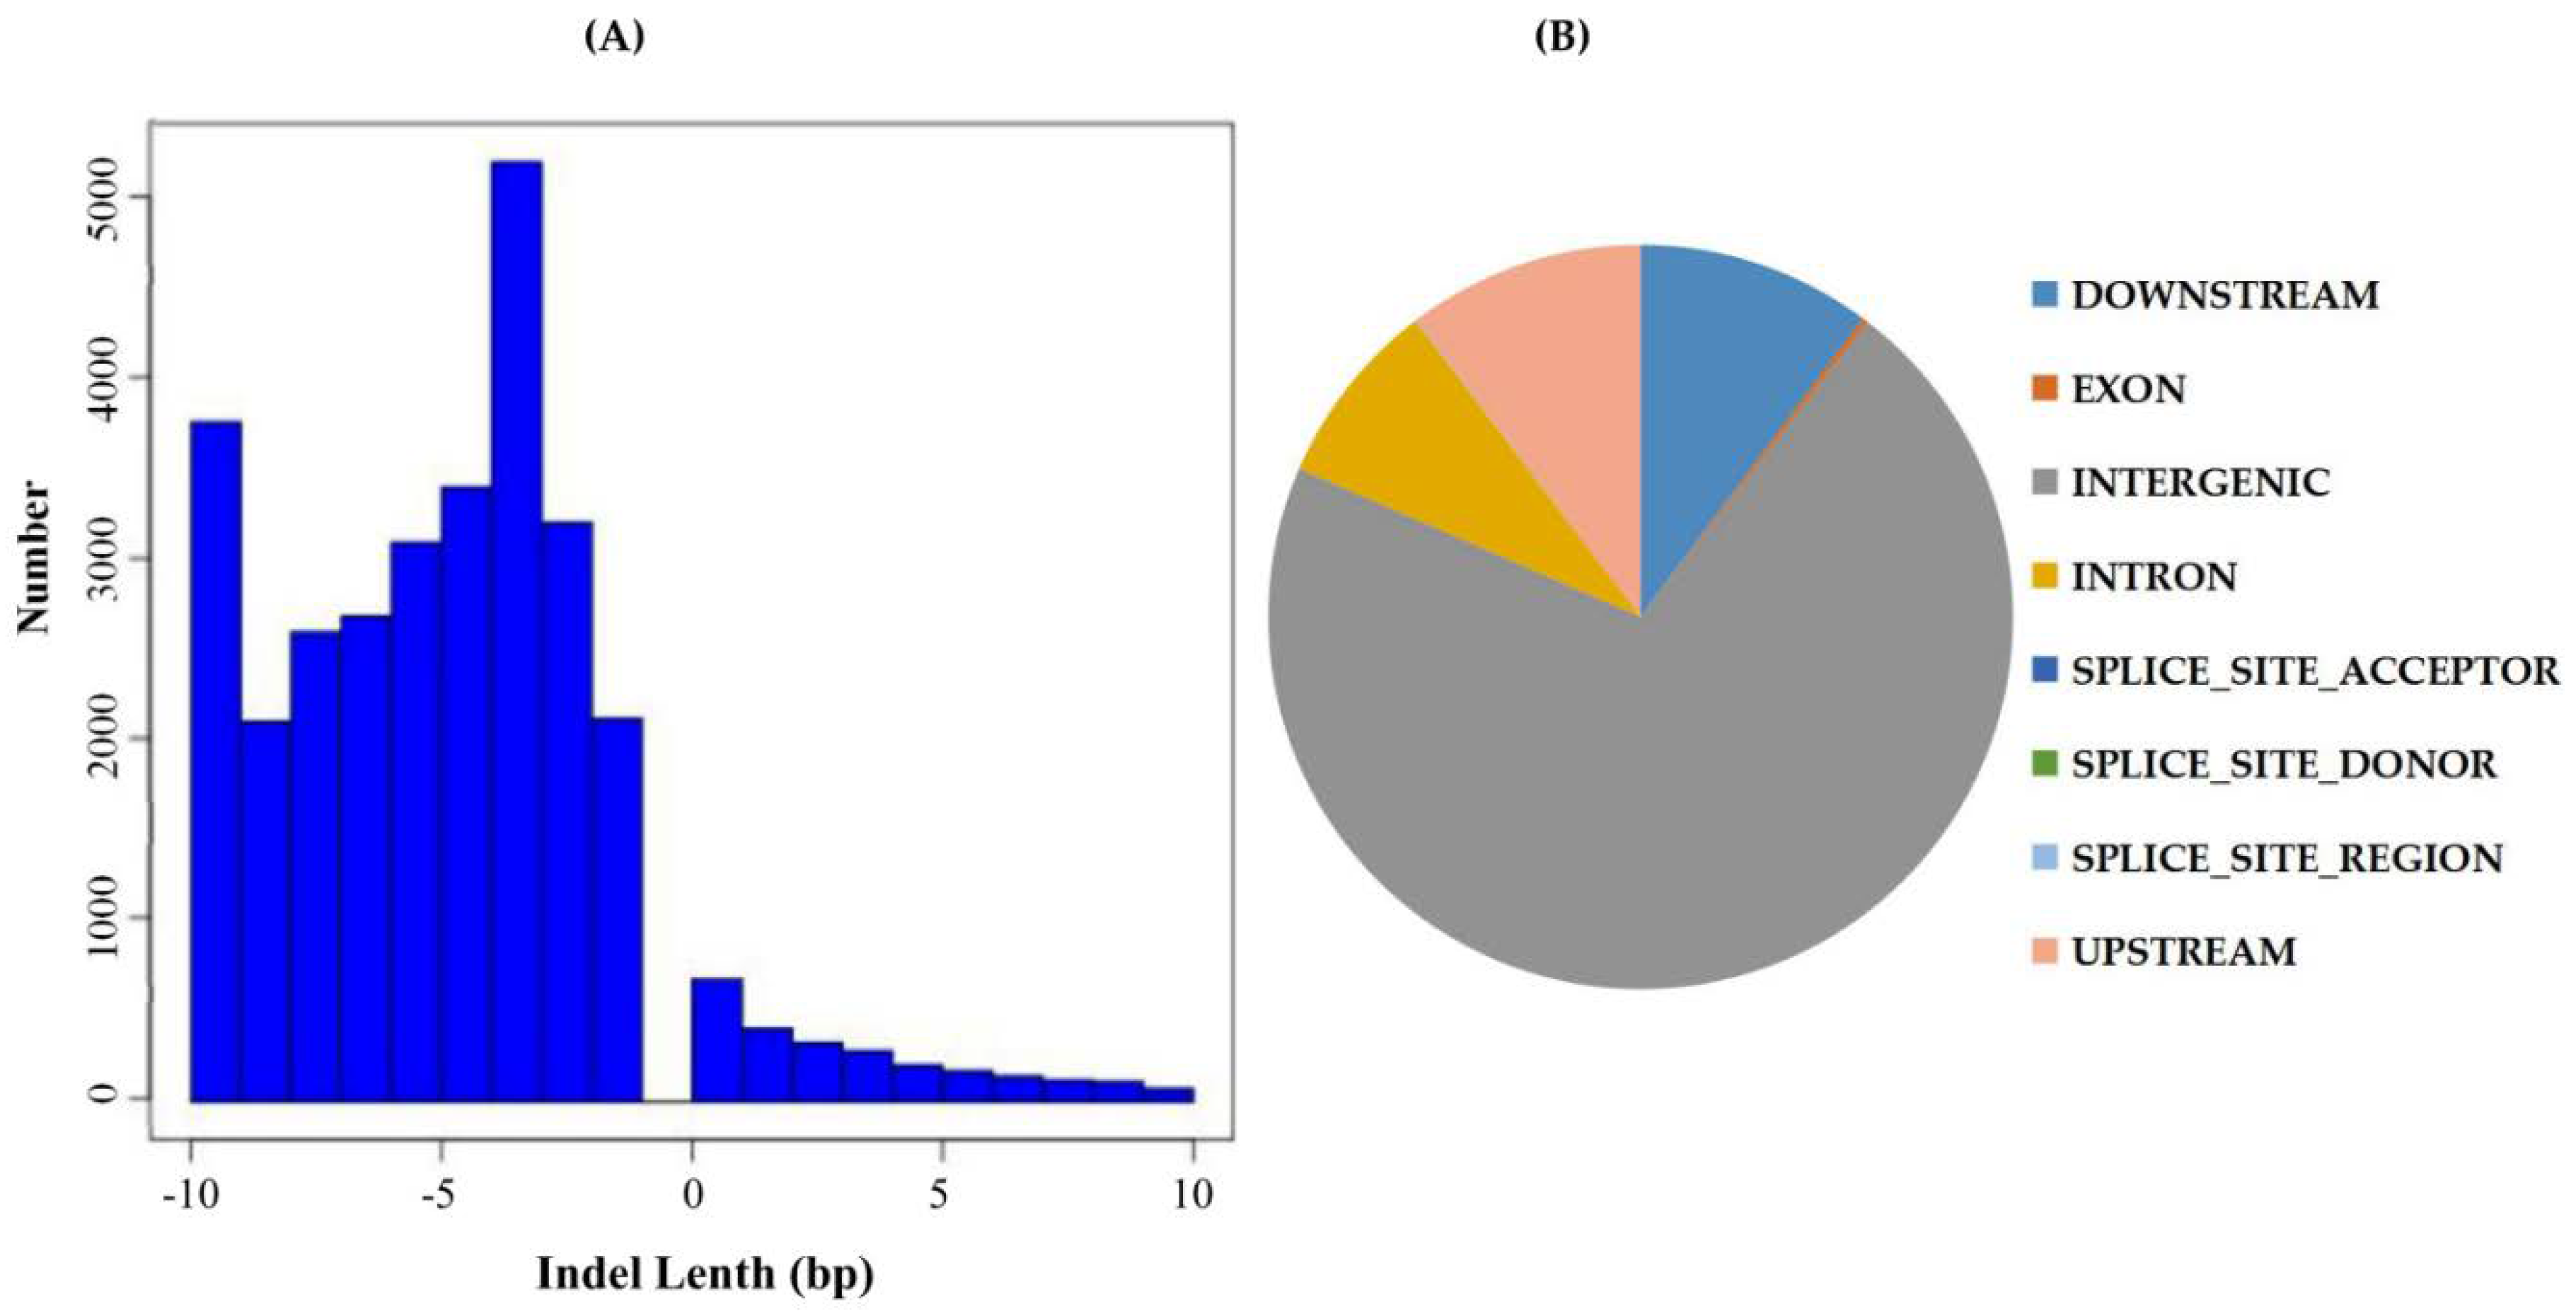
2.3. Indel Detection, Annotation, and Location Distribution

Advancement in population and evolutionary genetic research has been a consequence of continuous improvement in the way genetic similarity or dissimilarity between genomes is assessed [31]. Currently, there is an increasing focus on polymorphisms of the type short insertions and deletions (indels) in genomic research both in animals more human and the plants in general [32]. Indels have been recognized as an abundant source of genetic markers that are widely spread across the genome, although not as common as SNPs. Genetic differences between individuals are encoded as local changes consisting of substitutions of small indels, which alter a few base pairs, and large-scale changes that consist of larger indels rearrangements and copy number variations [33]. Indels are the most common structural variant that contributes to the pathogenesis of disease in animals, and more so to human gene expression and functionality [34]. Current approaches to identify indels include de-novo assembly of unaligned reads [35], read splitting [36], depth of coverage analysis [37], and analysis of insert size inconsistencies. GATK’s was applied to compare the results of the BAM files, using GATK’s Haplotyper method to perform SNP detection and filter conditions according to GATK recommendation parameters (Available online: https://software.broadinstitute.org/). The wild donor parent, G. tomentosum exhibited a higher level of insertion number of 371,852, a deletion number of 352,463, a heterozygosity level of 522,862 and a homozygosity of 201,453. The recurrent parent, known to be highly affected by various environmental stresses due to massive erosion of genetic diversity, had relatively lower values of insertion (86,467), deletion number (76,206), heterozygosity (50,170), and a relatively higher level of homozygosity of 112,503. We further compared the two parental lines, with the BC2F1, the result showed that the BC2F1 generation had enhanced heterozygosity (20,895) compared to homozygosity level of 13,097. The results showed that the BC2F1 were more diverse compared to the recurrent parent; the results were also replicated among the entire BC2F2 generation, in which all were found to be more heterozygous (Supplementary Table S2). The length distributions (Figure 2A) and site locations of the indels in all the samples were determined (Figure 2B). The high number of indel markers within the intergenic regions, could possibly explain their significant roles, similar results have also been obtained in Arabidopsis, in which 6545 intergenic transcribed fragments (ITFs) were detected in Arabidopsis intergenic region and were found to be associated with known genes [38].

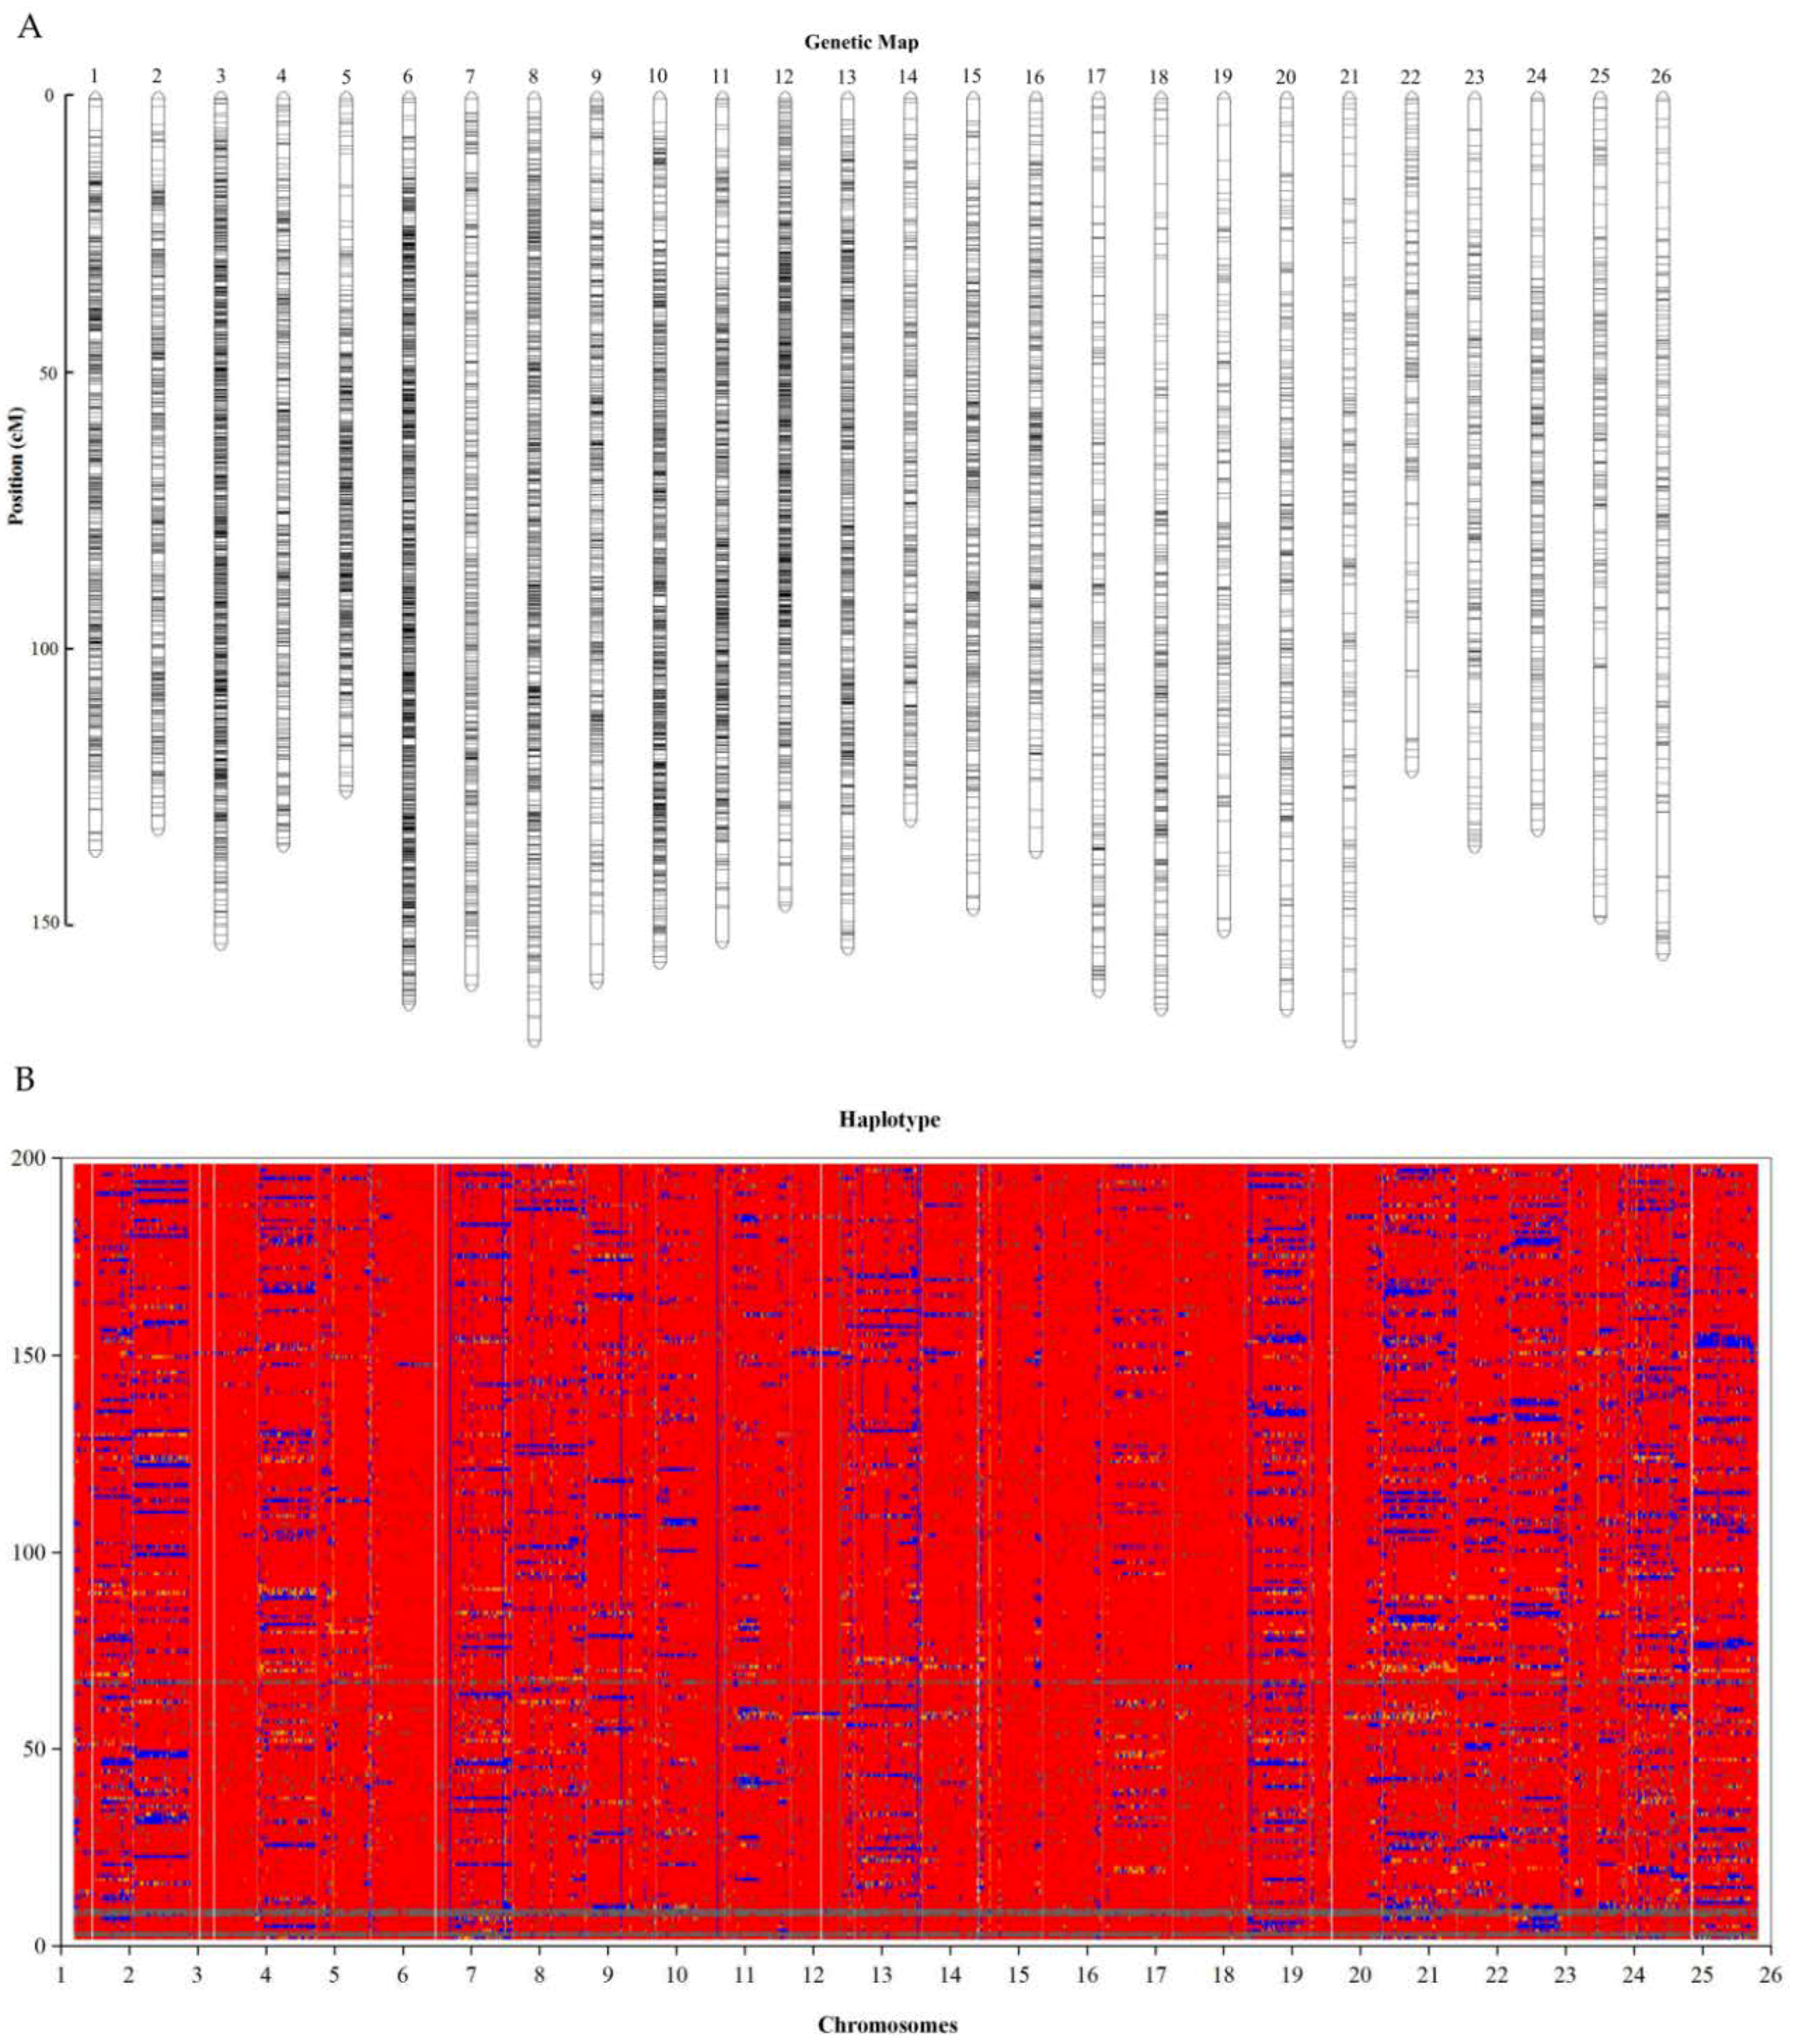
2.4. Genetic Map Construction

Backcross Inbred Lines (BILs) were developed using G. hirsutum, coded as CRI-12 (G09091801-2) as the recurrent parent and G. tomentosum, accession number AD3-00 (P0601211) as the donor parent. The parental lines were sequenced using genotyping by sequencing (GBS) method with efficient sequencing depths. An average mapped reads of ten individuals for each of the parent lines were mapped to the reference genome sequence downloaded from cotton genome (Available online: http://mascotton.njau.edu.cn). A total of 13,695,154 and 13,496,550 reads were obtained for G. hirsutum and G. tomentosum respectively. An average of 85,372 and 117,128 SNPs were identified for G. hirsutum and G. tomentosum respectively, where the efficiency of enzyme digestion was 99%. For the BC2F2 populations, the efficiency of enzyme digestion was relatively low compared to the efficiency levels of the two parental lines; the efficiency level for the BILs was 98.85%. 1,507,193,217 mapped reads were produced, with an average of 5,074,724.636 mapped reads per individual, which corresponded to nearly 186.98 Gb of clean bases. This was equivalent to approximately 83.13-fold haploid genome coverage, of raw paired-end Illumina reads by sequencing whole genome shotgun (WGS) libraries of homozygous cv. “TM-1” compared to the previous results [39]. In their study, which generated a total of 445.7 Gb of clean reads or 181-fold haploid genome coverage of raw paired-end, Illumina read by sequencing whole genome shotgun (WGS) libraries of homozygous cv. “TM-1” with fragment lengths that ranged from 250 to 40,000 bp. The average guanine-cytosine (GC) content of the sequences for the parental lines was 41.17% (G. hirsutum), 37.76% (G. tomentosum), and 43.1% (BC2F1), with a Q30 score range of 94.31% to 94.75%. The GC content range of the sequence among the mapping population (BC2F2) lines, ranged from 41.16 to 48.89% with Q30 score arrange of 93.59% to 96.02%, an indication that the sequencing process was minimal of errors. The parental lines, G. hirsutum-CRI-12 and G. tomentosum-AD3-00 were homozygous lines with “aa” and “bb” genotypes respectively. A total of 28,660 markers, after removing duplicated markers, were used for further analysis. All the SNPs generated were used because none felt below the threshold level, all had coverage of 75–100% of the entire BC2F2 population.
The marker distributions on the 26 linkages ranged from 193 to 2368 in At_sub-genome (13 linkages) and 109 to 1918 in Dt_sub-genome (13 linkages). The markers were found to span 97.3–100% of the entire length of the reference genome (Supplementary Table S3). The highest marker density was observed in LG19_chrD06 (38 markers/Mb), while the lowest level of marker loci density was noted in LG18_chrD05 (2 markers/Mb). The marker distribution was asymmetric, the highest markers were found on LG19_chrD06 with 2419 markers, while the least number of markers were detected on LG18_chrD05 with only 109 translating to 0.38% of all the SNPs mapped as illustrated in genetic map (Figure 3A) and bin map (Figure 3B). The bin map showed that the markers were located within a narrow interval. Ultra-high density bin maps are significant for precise quantitative trait loci (QTL) mapping in various agricultural crops [40].

2.5. Fine Genetic Linkage Map Construction using the GBS-SNP Markers

In mapping the BC2F2 population, not all the 28,660 SNP markers generated were mapped, high number of markers were found to be duplicated in the same positions and with a high level of segregation distortion (SD). The highest level of markers duplication was detected in LG9_chrA09, with 824 markers found to be duplicated, which translated to 78.18% of the markers mapped in the linkage. The lowest level of markers duplication was observed in LG18_chrD05, with only 39 markers found to be duplicated (35.78%). The marker duplication is much more common in tetraploid organisms as opposed to diploid organisms, and it is believed that duplication occurs due to large and complex genome and presence of homoeologous loci from the individual sub genomes or paralogous loci from duplicated segments of the genome [41]. In order to improve the precision of the map, all the duplicated markers were removed and finally 10,888 markers were applied. All the markers were successfully linked to all the 26 linkage groups, being the mapping population of tetraploid cotton, within 2n = 52 chromosomes. The map size was 4191.3 cM, with 2149 cM, and 2042.3 cM in At and Dt_sub genomes respectively. The average marker distance in the map developed was 0.3849 cM, which make the map generated to the finest linkage map ever developed from the BIL population of semi-wild origin. The At_sub genome had the highest number of markers of 6318, while the Dt_sub genome contained only 4570 markers. The results obtained could be possibly explained by the variation in sizes of the two sub-genomes; At_sub genome was relatively larger than the Dt_sub genome.
The marker distributions were uneven among the linkage groups, LG6_D06 (chr25) had the highest number of marker loci of 947 with chromosome size of 158.72 cM, and an average marker distance of 0.168 cM while LG1_D01(chr15) was the lowest populated linkage, with only 45 markers with chromosomes size of 151.78 cM and average distance of 3.3728 cM. The chromosomes LG_chrA01, LG_chrA02, LG_chrA04, LG_chrA07, LG_chrA08, LG_chr11, LG_chr18 (D13), LG_chr20 (D10), LG_chr24 (D08), LG_chr25 (D06), and LG_chr26 (D12) had the highest number of markers, while LG_chr15 (D01) had the least number of markers of 45, but had the smallest gap of 0.1047 cM among all the 26 chromosomes (Table 1).

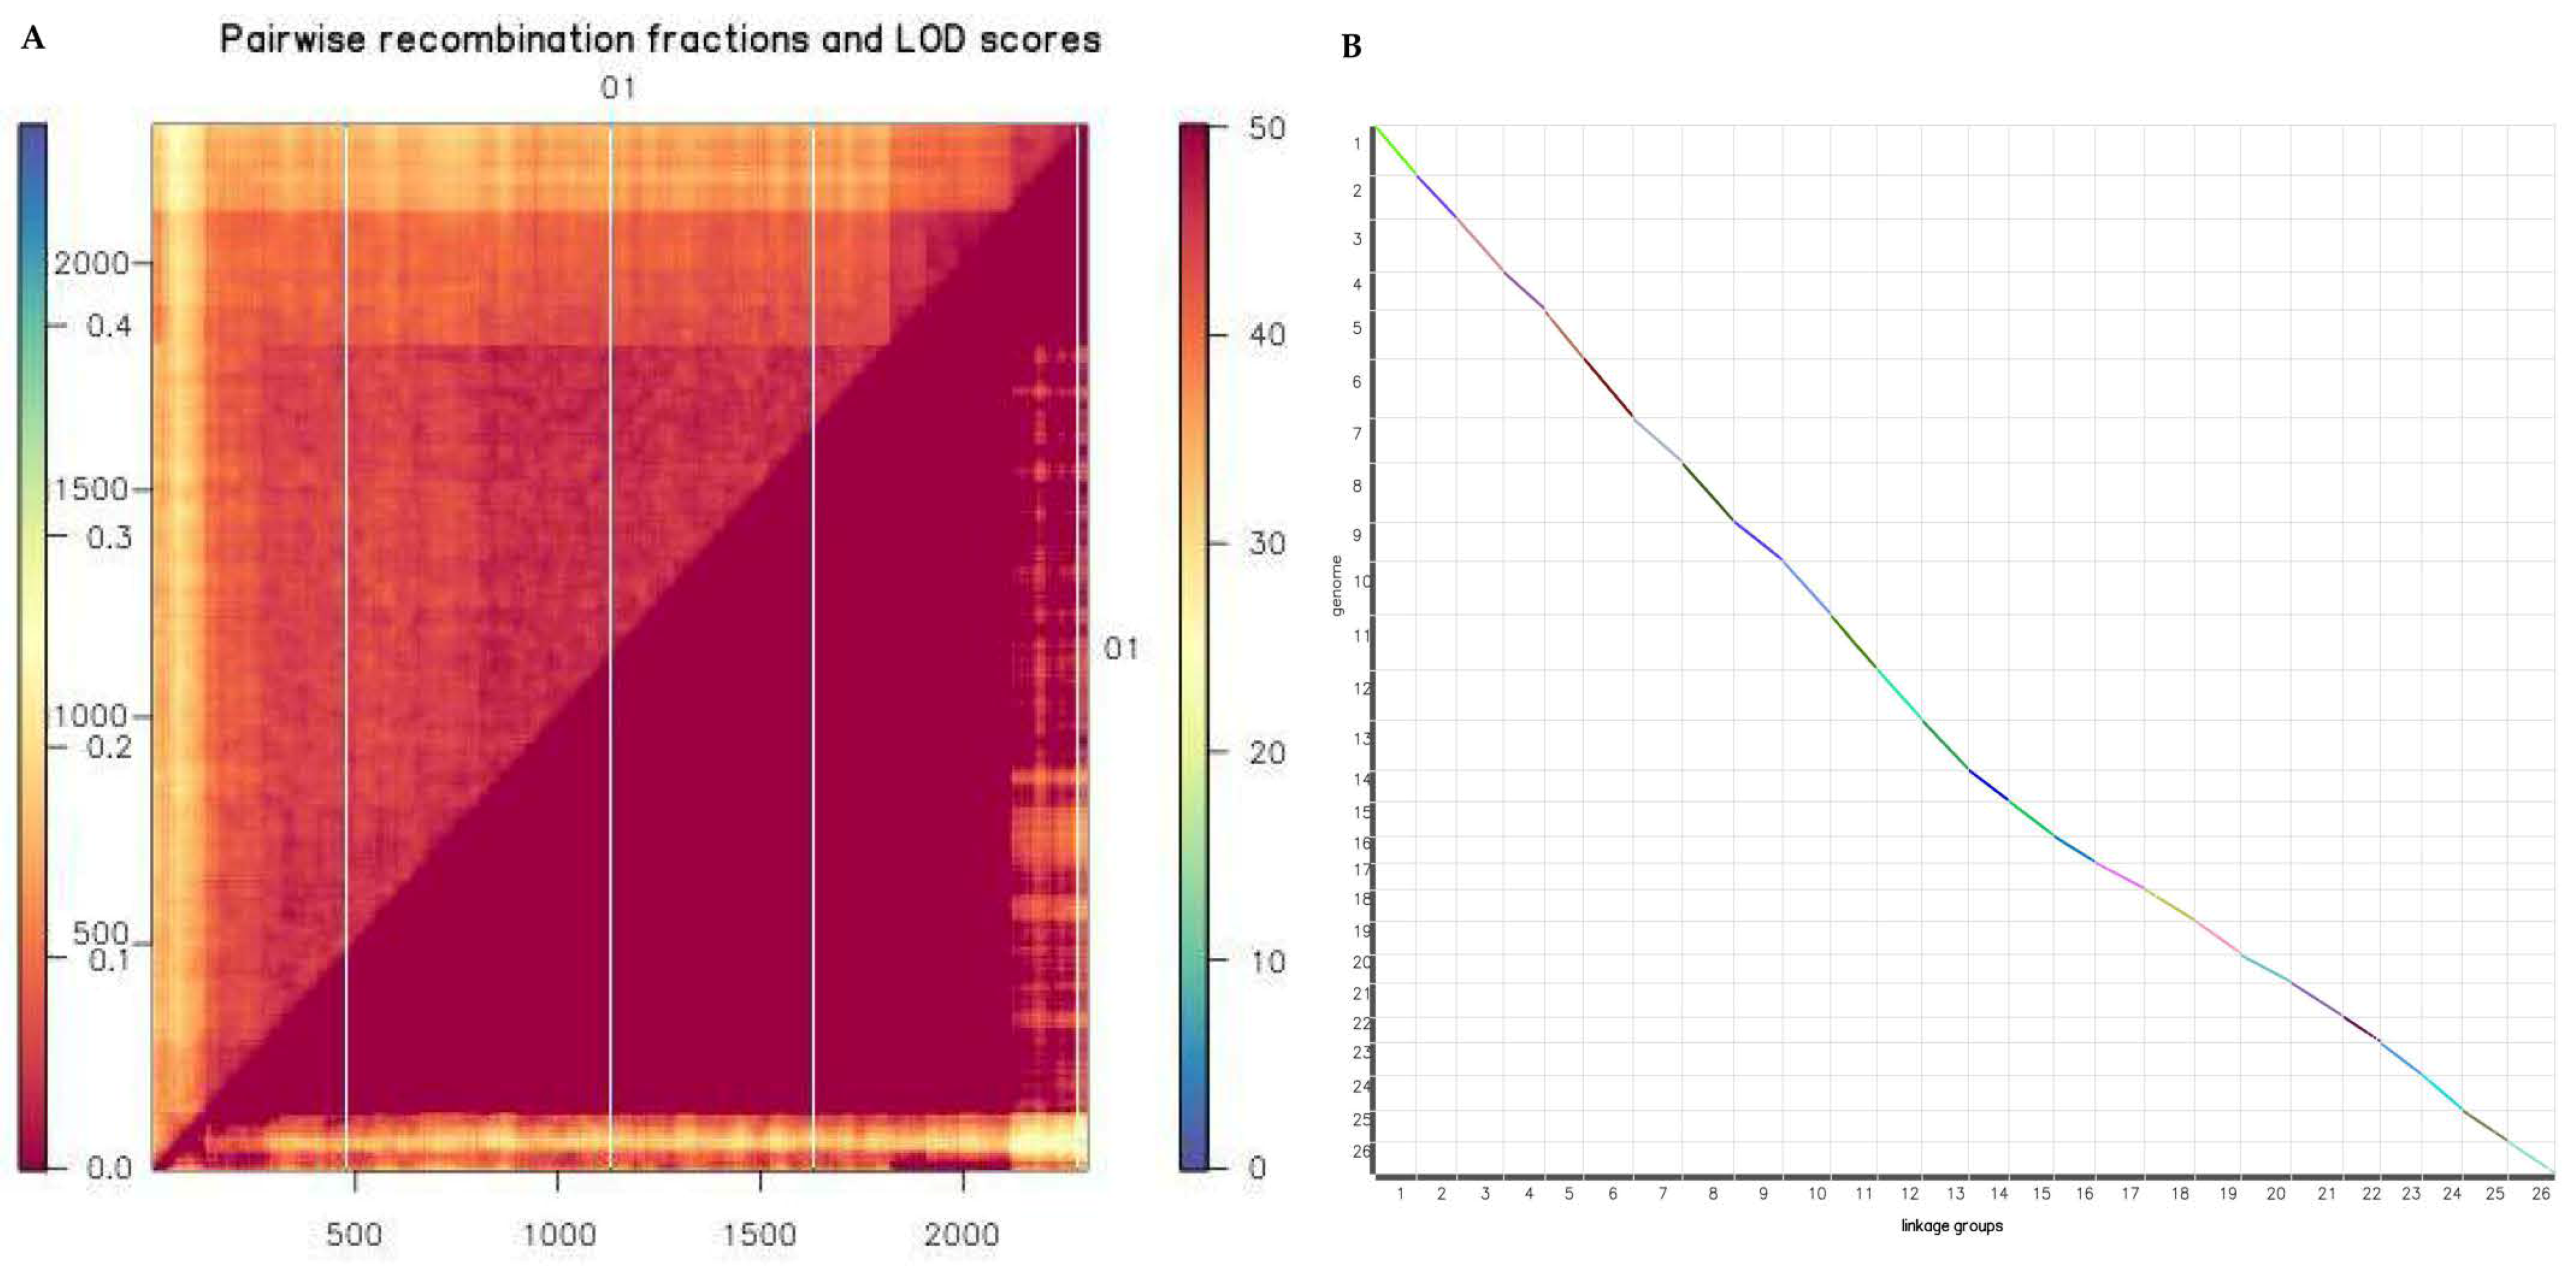
2.6. Evaluation of Reorganization Relationship and Collinearity of Genetic Maps and Genomes

The genetic map is essentially a multipoint recombination analysis. The closer the marker distance, the smaller the recombination rate. The analysis of the marker reorganization in the entire genetic map was performed in order to determine defective markers in the sequencing work of the BC2F2 progenies. The map generated showed that the markers had a lower recombination frequency due to relatively narrow distance between markers. The narrower the distance, the higher the precision level of the genetic map for detection of reliable quantitative traits within the mapping population [42]. The map generated showed that the logarithm of odds (LOD) values were above the noise level. The closer the color is to red, the larger the LOD value is, while the closer to blue, the lower the LOD as evident in chr01, which had a total of 772 markers, with a map size of 185.4601 cM and average marker distance of 0.24 cM (Figure 4A). Colinearity analysis was performed; the results obtained showed effective synteny between the genetic map generated and the physical map in relation to the reference genome (Figure 4B).

2.7. Gene Mining within the GBS Marker Regions of the Mapping Population

Based on the physical position of the GBS markers per linkage, we utilized the various physical positions in base pair to mine the genes. The genes mined were of different domain, in total 66,434 genes were mined, with 32,032 (48.2%) and 34,402 (51.8%) genes being obtained within the At and Dt_sub genomes respectively. The results obtained were in agreement to previous publications in which Dt_sub genome had been found to harbor more genes than the At_sub genome despite the genome size variation, where At_sub genome is relatively larger compared to Dt_sub genome [43]. The gene proportions varied across the linkage groups, the highest percentage of genes was noted for Dt_chr09 (96.3%) while the smallest proportion was detected for At_chr05 with only 72% of the genes mined. It is of interest to note that the proportions of the genes mined were not positively correlated to the number of markers per linkage, for instance, LG22_chrD09 of the Dt_sub genome had the highest number of genes even though the marker numbers were low, with only 852, compared to other linkages such as LG19_chrD06 (2419 markers), LG23_chrD10 (1854 markers), LG25_chrD12 (1593), and LG26_chrD13 (1230) in Dt_sub genome and even compared to those in At_sub genome as illustrated in Table 2. The high number of genes detected in LG22_chrD08 (chr23) indicated that the chromosome could be harboring some important traits, which are vital for aiding plants tolerance to various abiotic stress factors, such as drought stress. In a number of research findings on the analysis of various important drought tolerant traits in upland cotton, Chr23 (LG22_chrD08) has been found to harbor various significant traits known to be important for enhancing drought tolerance in plants, fresh root weight (FRW) [44], relative water content (RLWC), and excise leaf water loss (ELWL) [45]. Generally, more QTLs have been detected in the Dt_sub genome compared to the At_sub gnomes [46], an indication that the Dt_sub genome plays a major role in enhancing tolerance level of the tetraploid cotton to various abiotic stress factors.
We examined the mined genes in order to determine the various functional domains, 6141 gene domains were obtained, at 3007 and 3134 domains in the At and Dt_sub genomes respectively. The lowest number of gene domains was noted in At_chr04 with only 202 (3.3%), while the highest domain numbers was observed for Dt_chr05 with 1128 (18.4%) gene domains. It was technically impossible to analyse all the domains obtained in each linkage group. Therefore, we determined the frequency of each domain, the domains with the highest frequency was finally analysed, thus termed as the dominant domains (Supplementary Table S4). In the dominant domain, the genes were found to belong to the functional domain of Pkinase (PF00069), with a total of 1069 genes. The protein kinase (PF00069) domain contains proteins with highly conserved structure and mainly functions as catalytic protein kinases [47,48]. The protein kinases are mainly involved in the process of phosphorylation, which are of a regulatory role in metabolism, transcription, cell cycle progression, cytoskeletal rearrangement and cell movement, apoptosis, and differentiation. In animals, the protein kinases have been found to be integral in embryonic development, physiological responses, and in the nervous and immune systems. Abnormal phosphorylation causes many human diseases, including cancer, and drugs that affect phosphorylation can treat those diseases [49]. In the Pkinase domain (PF00069), we identified 44 different sub domains, 3-phosphoinositide-dependent protein kinase (four genes), Brassinosteroid insensitive 1-associated receptor kinase (three genes), Calcium and calcium/calmodulin-dependent serine/threonine-protein kinase (2 genes), Calcium-dependent protein kinase (79 genes), Calmodulin-binding receptor-like cytoplasmic kinase (five genes), Casein kinase (five genes), Casein kinase I homolog (five genes), Casein kinase I isoform α (six genes), Casein kinase I isoform β (five genes), Casein kinase I isoform δ-like (31 genes), Casein kinase II subunit α, chloroplastic (five genes), Casein kinase II subunit α-1 (seven genes), CBL-interacting protein kinase (81 genes), CDPK-related kinase 1 (16 genes), cell division control protein (seven genes), Cyclin-dependent kinase (24 genes), Cysteine-rich receptor-like protein kinase (two genes), Mitogen-activated protein kinase (111 genes), probable receptor-like protein kinase (208 genes), and Serine/threonine-protein kinase (271 genes) among others. In all the various sub families, Serine/threonine-protein kinase gene members were the most abundant, with 271 genes.
Based on the number of the various sub families of the Pkinases, we analysed the members of Serine/threonine-protein kinase, as they were the most abundant. Forty four (44) sub classes of the Pkinases sub family were identified, Serine/threonine-protein kinase 16/38 (seven genes), AFC1/2/3 (seven genes), AGC1-7 (two genes), At3g07070 (six genes), ATG1a/c (four genes), ATG1t (one gene), AtPK2/AtPK19 (nine genes), Aurora-1/3 (four genes), BLUS1 (13 genes), CBK1 (six genes), CDL1 (ten genes), D6PKL2 (16 genes), dst1 (four genes), fray2 (19 genes), Seri GRIK2 (four genes), HT1 (one gene), KIPK (six genes), MHK (four genes), mph1 (three genes), Nek2 (20 genes), OSR1 (one gene), OXI1 (three genes), and PBS1 (26 genes) among other as illustrated in the (Supplementary Table S5). The high number of the serine/threonine-protein kinases sub group could mean that the genes transgressed from the tolerant genotype, in to the semi wild mapping population might be linked to various stress factors tolerance.

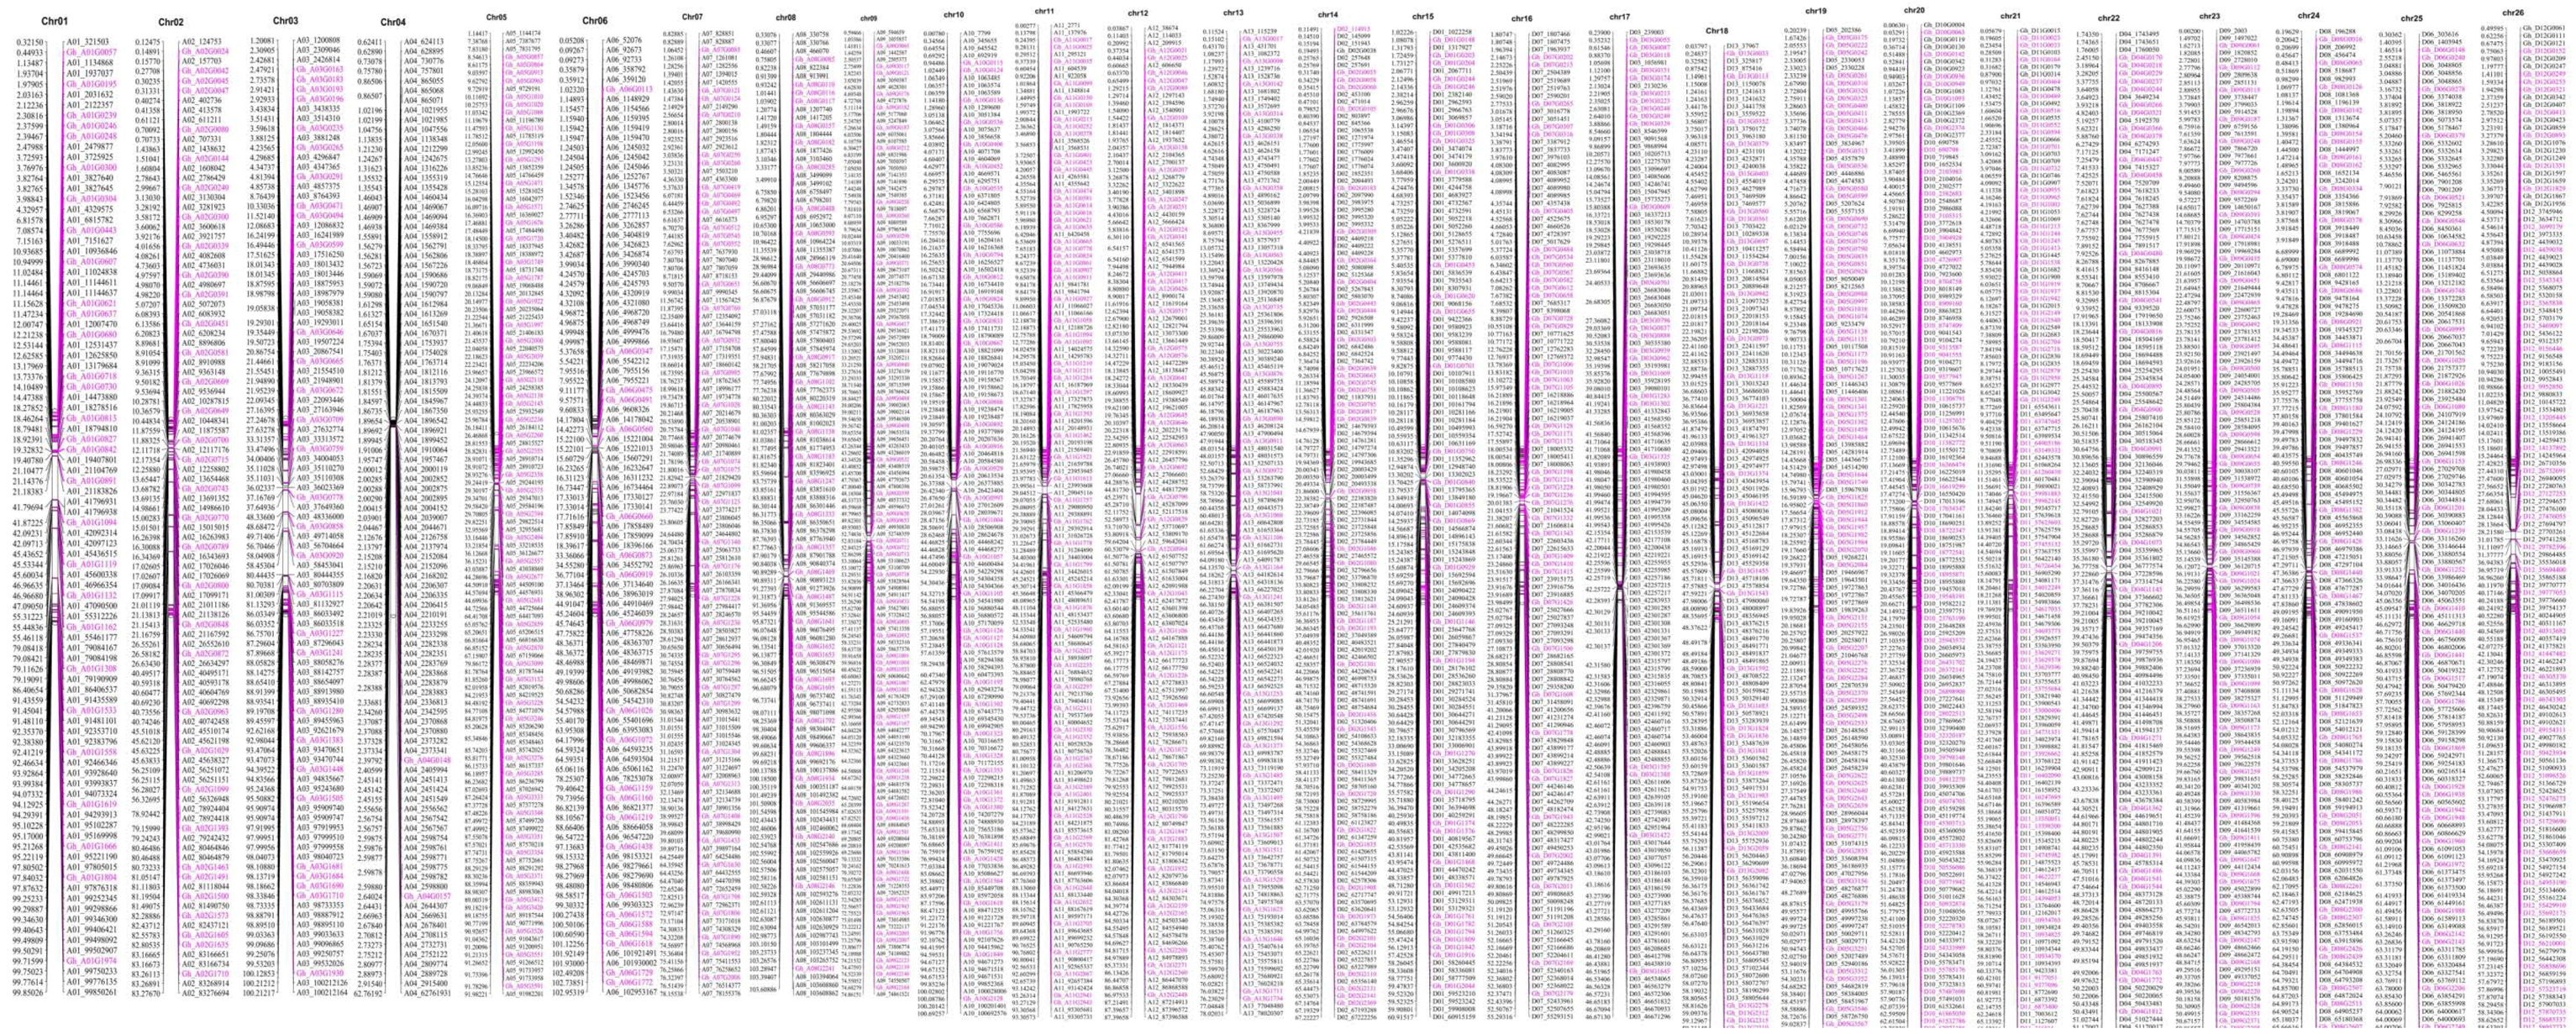
2.8. Chromosomes Mapping of the Genes Mined for the Dominant Domain, Pkinase

Chromosome mapping is critical in determining the distribution of the genes across the linkage groups. We sought to determine the distributions of the 1069 genes mined for the dominant domain, Pkinase (PF00069). The genes were skewed towards the Dt_sub genome, with 594 genes found to be mapped in Dt_sub genome, accounting for 56% of all the genes found to belong to the Pkinase, as mined within the GBS markers in the entire genome. The D genome is known to harbour very significant genes, and in various mapping for various quantitative trait loci (QTLs), controlling either phenotypic traits or fiber qualities, higher proportions are found to be located in Dt_sub genome as opposed to At_sub genome [50]. The highest number of genes, were found to be located in chr19 (D05), with 75 genes, while the least number of genes were mapped in chr04, with only two genes (Figure 5). We observed some element of gene loss between homologous chromosomal pairs, for instance chr04 and its homolog chr22, had two and 30 genes respectively, this phenomena was evident across the entire chromosomes.

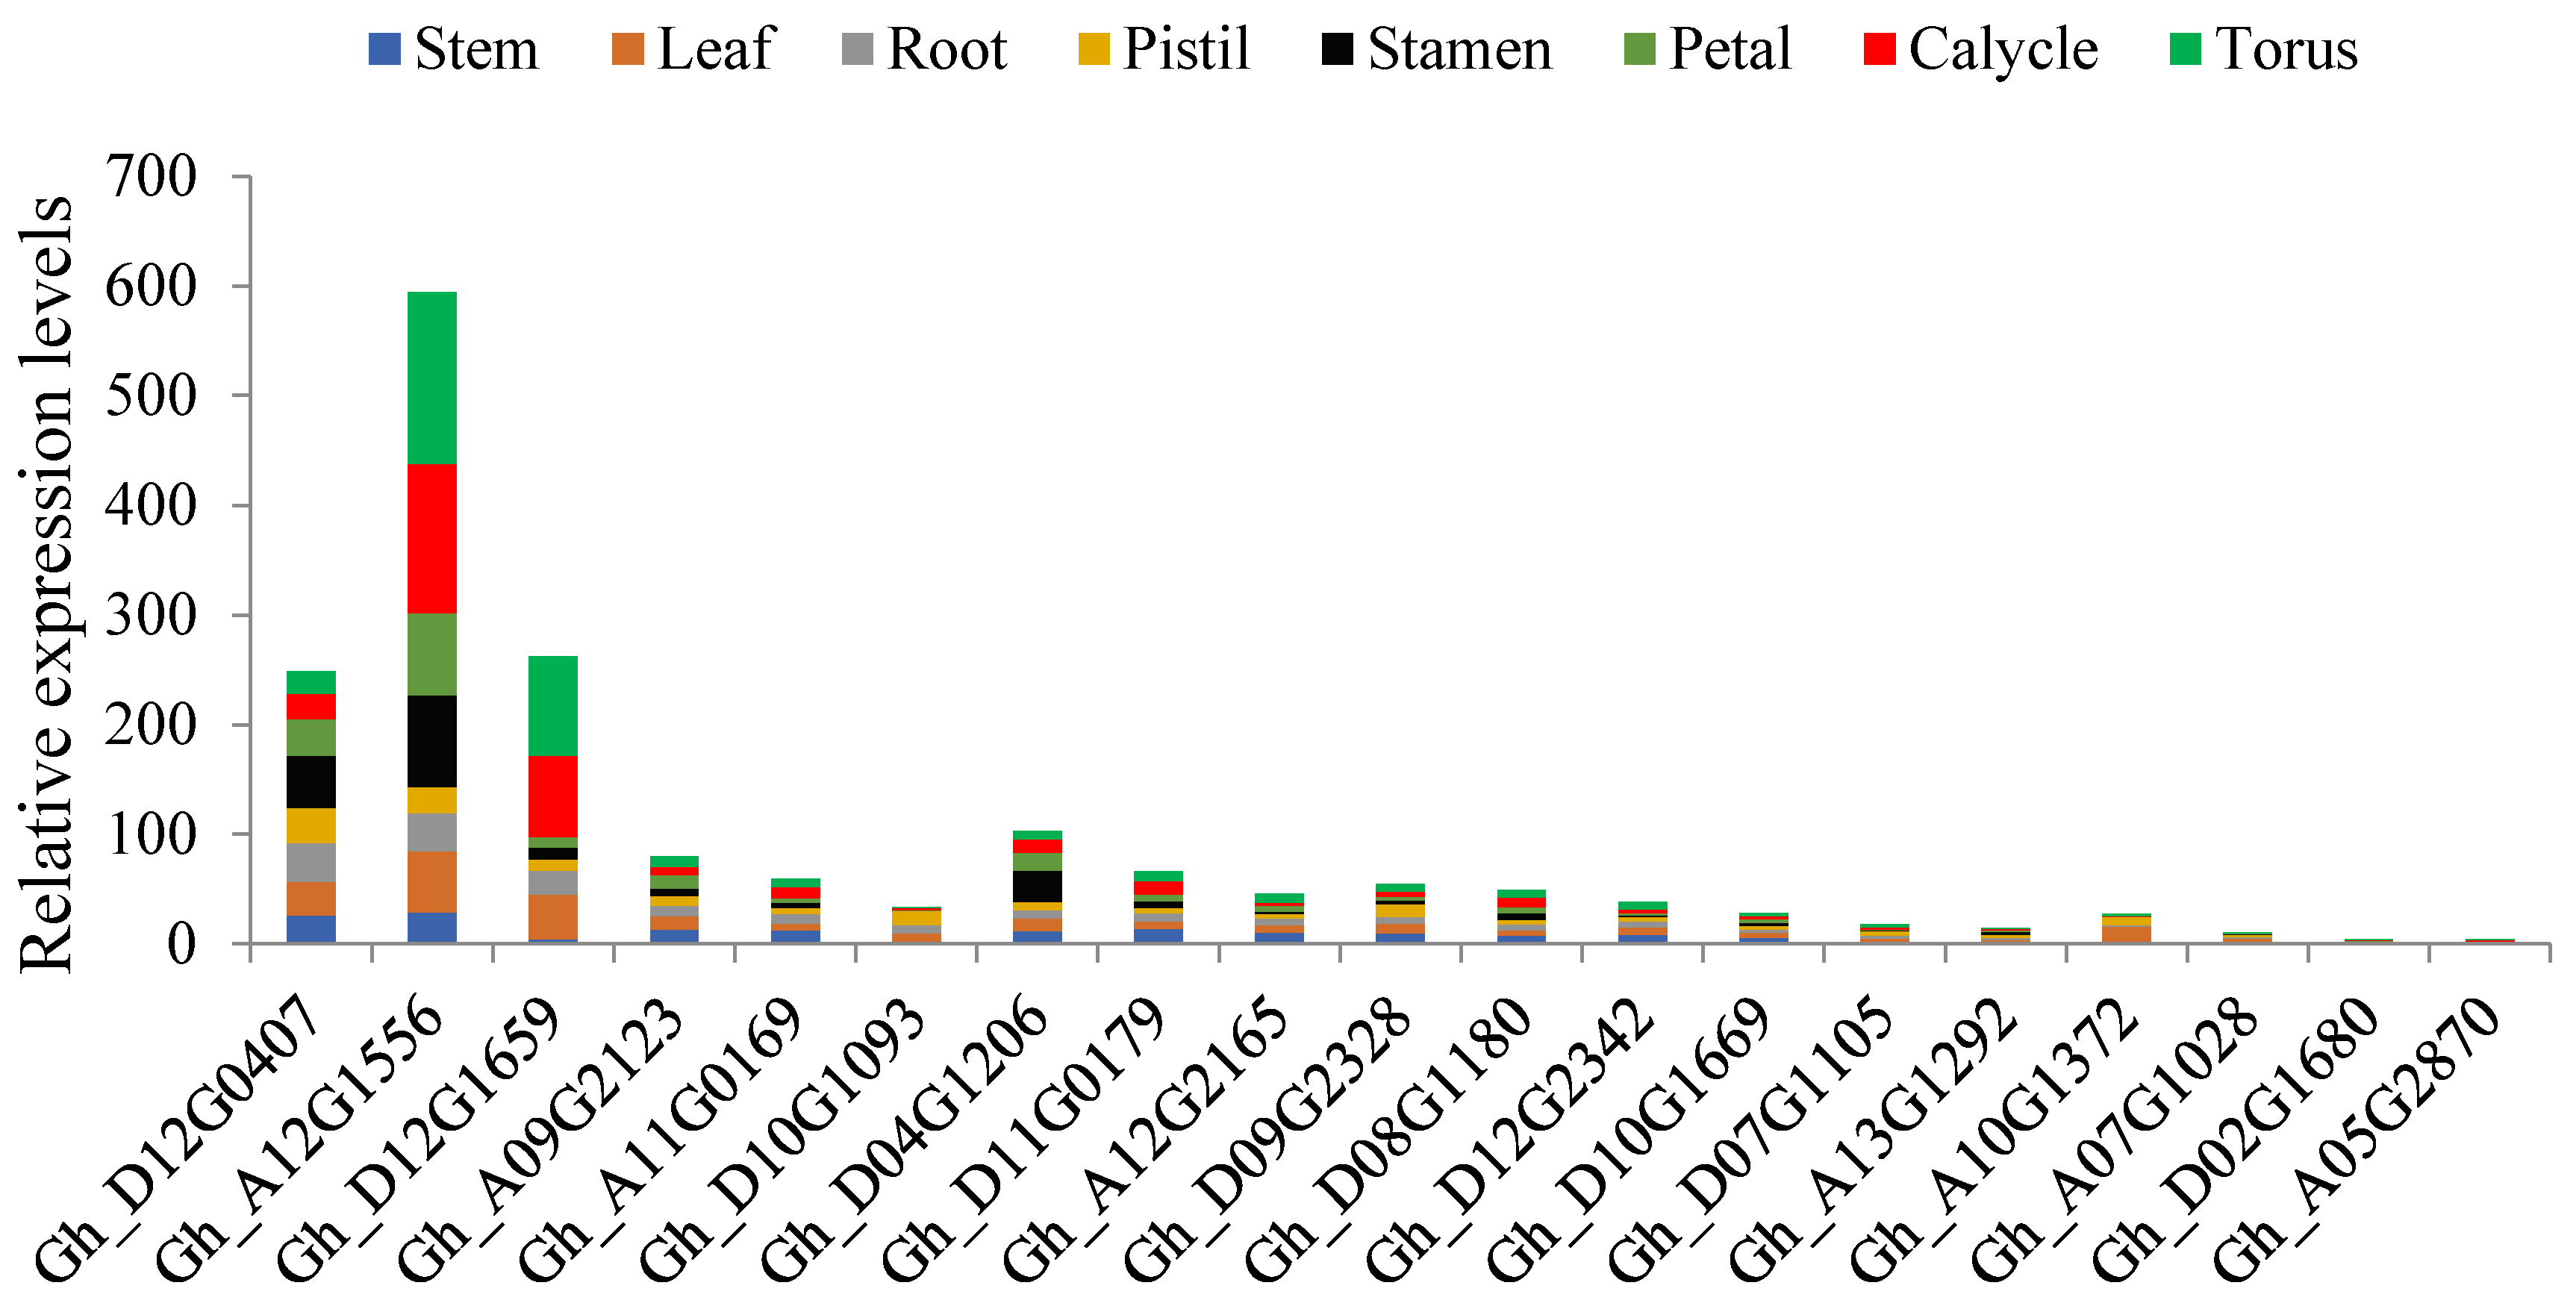
2.9. RNA Sequence Data of the Genes of the Pkinase Domain

RNA sequence is a critical tool which provides a summative role of the genes. It provides information in relation to the abundance of the genes in various plant tissues and expression levels when plants are exposed various abiotic and biotic stress elicitors. Among all the members of the Pkinase domain, we analysed the RNA sequence data for the dominant sub family, the Serine/threonine-protein kinases. The entire dominant sub family was 271 genes, their RNA sequence data were downloaded from cotton functional genome project, transformed into log10, in order to determine the abundance and expression levels under abiotic stress factors, such as drought and salt stress.
The genes were basically clustered in to four main groups, group 1 was highly up regulated, followed by group 3, while group 2 and 4 were mainly down regulated (Supplementary Figure S1). In group 1, had 21 genes, all were highly up regulated in both salt and drought stress conditions, among them were, Gh_A12G1556, Gh_D11G0352, Gh_A13G0314, Gh_D12G1659, Gh_D06G2249, Gh_A02G0300, Gh_D06G1942, Gh_A12G0364, Gh_D06G2142, Gh_D13G1374, Gh_D07G0582, Gh_A09G0713, Gh_D12G0859, Gh_A12G0641, Gh_D11G1445, Gh_A11G1297, Gh_D01G1809, Gh_A01G1558, Gh_A06G1729, and Gh_D07G1063. Majority of the highly up regulated genes, were mainly members of Serine/threonine-protein kinase D6PKL2 (four genes), Shaggy-related protein kinase eta (three genes), while the other sub groups either had two or one genes each, such as Serine/threonine-protein kinase STN7, chloroplastic, Serine/threonine-protein kinase MHK, Serine/threonine-protein kinase SRK2I, and Shaggy-related protein kinase kappa, which had two genes each. The very lowest numbers of genes were observed for Serine/threonine-protein kinase WNK1, Serine/threonine-protein kinase SRK2B, Serine/threonine-protein kinase AtPK2/AtPK19, Formin-like protein 20, and Serine/threonine-protein kinase 16 with one gene each.

2.10. miRNA Target Analysis of the 271 Dominant Genes

Gene functions are regulated by a number of biomolecules, in which miRNAs have been found to be integral in the regulation of gene activities [51]. The microRNAs are single-stranded noncoding RNAs with sizes ranging from 20 to 24 nucleotides and mainly have functions in controlling gene expression by translational inhibition and destabilization of miRNAs [52]. The miRNAs have been found to be involved in various biological processes in plants including development of organs such as stems, roots, leaves, and floral parts [53]. A growing body of evidence suggests that miRNAs play key roles in plant responses to biotic and abiotic stresses [54]. In the determination of the association of the mined genes to whether they were targeted to any of the known cotton ghr-miRNAs, a total of 69 ghr-miRNAs were found to target 183 genes out of the 271, translating to 68% of all the genes of the serine/threonine-protein kinase groups. The highest level of miRNA target was noted for ghr-miR749, found to target 21 genes each, ghr-miR390a (19 genes), ghr-miR7493 (13 genes), ghr-miR7511 (12 genes), ghr-miR2949b (seven genes), ghr-miR7484a (seven genes), and ghr-miR7512 (seven genes), while the rest targeted genes ranging from one to six (Supplementary Table S6). Deep sequencing has revealed the enormous roles played by plant miRNAs, for instance, miR169 is a large miRNA family that is widespread in the plant kingdom and has been found to have a functional role in plant development and responses to environmental cues [55]. In rice, being a hydrophytic plant, some members of the miR169 family were found to be induced by drought stress [56]. In the analysis of the miRNAs, cotton ghr-miR169a, which was found to target Gh_A05G3152 (D6PKL2), Gh_A10G2128 (ppk15), and Gh_D04G0480 (D6PKL2), could possibly be have a functional role in enhancing drought stress tolerance in plants. Other known miRNAs, whose functions have been described, such as miR482, with a functional role in the regulation of NBS-LRR defense genes during fungal pathogen infection [57]. Two types of ghr-miR482 were found to target five genes, ghr-miR482a targeted Gh_A10G1428 (PBS1), Gh_A11G1858 (SAPK1), Gh_D05G0690 (UCNL), and Gh_D11G2149 (SAPK2) while ghr-miR482b targeted Gh_D05G3179 (WAG1). The five sets of genes targeted could possibly be involved in defense mechanism to prevent fungal infection. Plant growth, such as primary root growth, is vital to improve plants water uptake under low soil water potential. The plant miR390, TAS3-derived trans-acting short-interfering RNAs (tasiRNAs), and Auxin response factors (ARFs) form an auxin-responsive regulatory network controlling lateral root growth [58]. The cotton, ghr-miR390a was found to target 19 genes with different relative abundance as per the RNA sequencing data profiling in various tissues under drought condition, the most abundant gene was Gh_A12G1556 across all the tissues, but more importantly in the root, followed by Gh_D12G0407 and Gh_D04G1206 (Figure 6). The abundance levels of Gh_A12G1556, Gh_D12G0407 and Gh_D04G1206 in the root tissues could perhaps be linked to the promotion of primary root growth, and therefore increasing the capacity of the plants to acquire more water due increased absorption area.

2.11. Cis Element Analysis

Gene regulatory networks refer to a collection of molecules, which regulate a set of gene expression in a specific growth stage or in response to external stimuli [59]. One of the important stages of gene expression regulation is at transcription level in which cis-acting elements and transcription factors (TFs) mediate it [60]. Cis-acting elements are strength (sequences) of DNA at the promoter region of a gene, which interact with transcription factors. TFs bound to cis-acting elements form the transcriptional initiation complex that activates RNA polymerase to start transcription process of specific genes. In the transcription process, TFs act as molecular switchers to start transcription of the extraordinary gene. TFs themselves are activated in response to external stimuli such as salinity, drought, temperature alterations, and internal stimuli such as hormones [61]. In the analysis of the cis elements, GATABOX (GATA), GT1CONSENSUS (GRWAAW), EBOXBNNAPA (CANNTG), WRKY71OS (TGAC), and MYCCONSENSUSAT (CANNTG) were the most abundant with the role of chlorophyll a/b binding protein/light regulations, GT-1 binding site in many light-regulated genes, light-responsive and tissue-specific activation, a transcriptional repressor of the gibberellin signaling pathway and dehydration-responsive respectively (Table 3). Photosynthesis is an important biochemical process to the plants, which enables the plants to synthesize their own food, any process that affects the photosynthetic process and the organelles, do effectively affect the performance of the plant and in turn reduces the quality and quantity of the yield [62]. Among the cis elements with the regulatory roles in plant stress regulation detected were MYCATERD1 (water-stress responsiveness), AGCBOXNPGLB (stress signal-response factors), ASF1MOTIFCAMV (response to abiotic and biotic stress), ACGTATERD1 (required for etiolation-induced/expression of erd1 (early responsive to dehydration), CCAATBOX1 (promoter of heat shock protein), and MYB2CONSENSUSAT (MYB recognition site/dehydration-responsive) among others; the detection of these cis elements, is a pointer to show that some important alleles from the tolerant cultivar, G. tomentosum used as the donor parent for the development of the BC2F2 mapping population could have been introgressed into the population, thus could help in solving the drought stress effect in cotton.

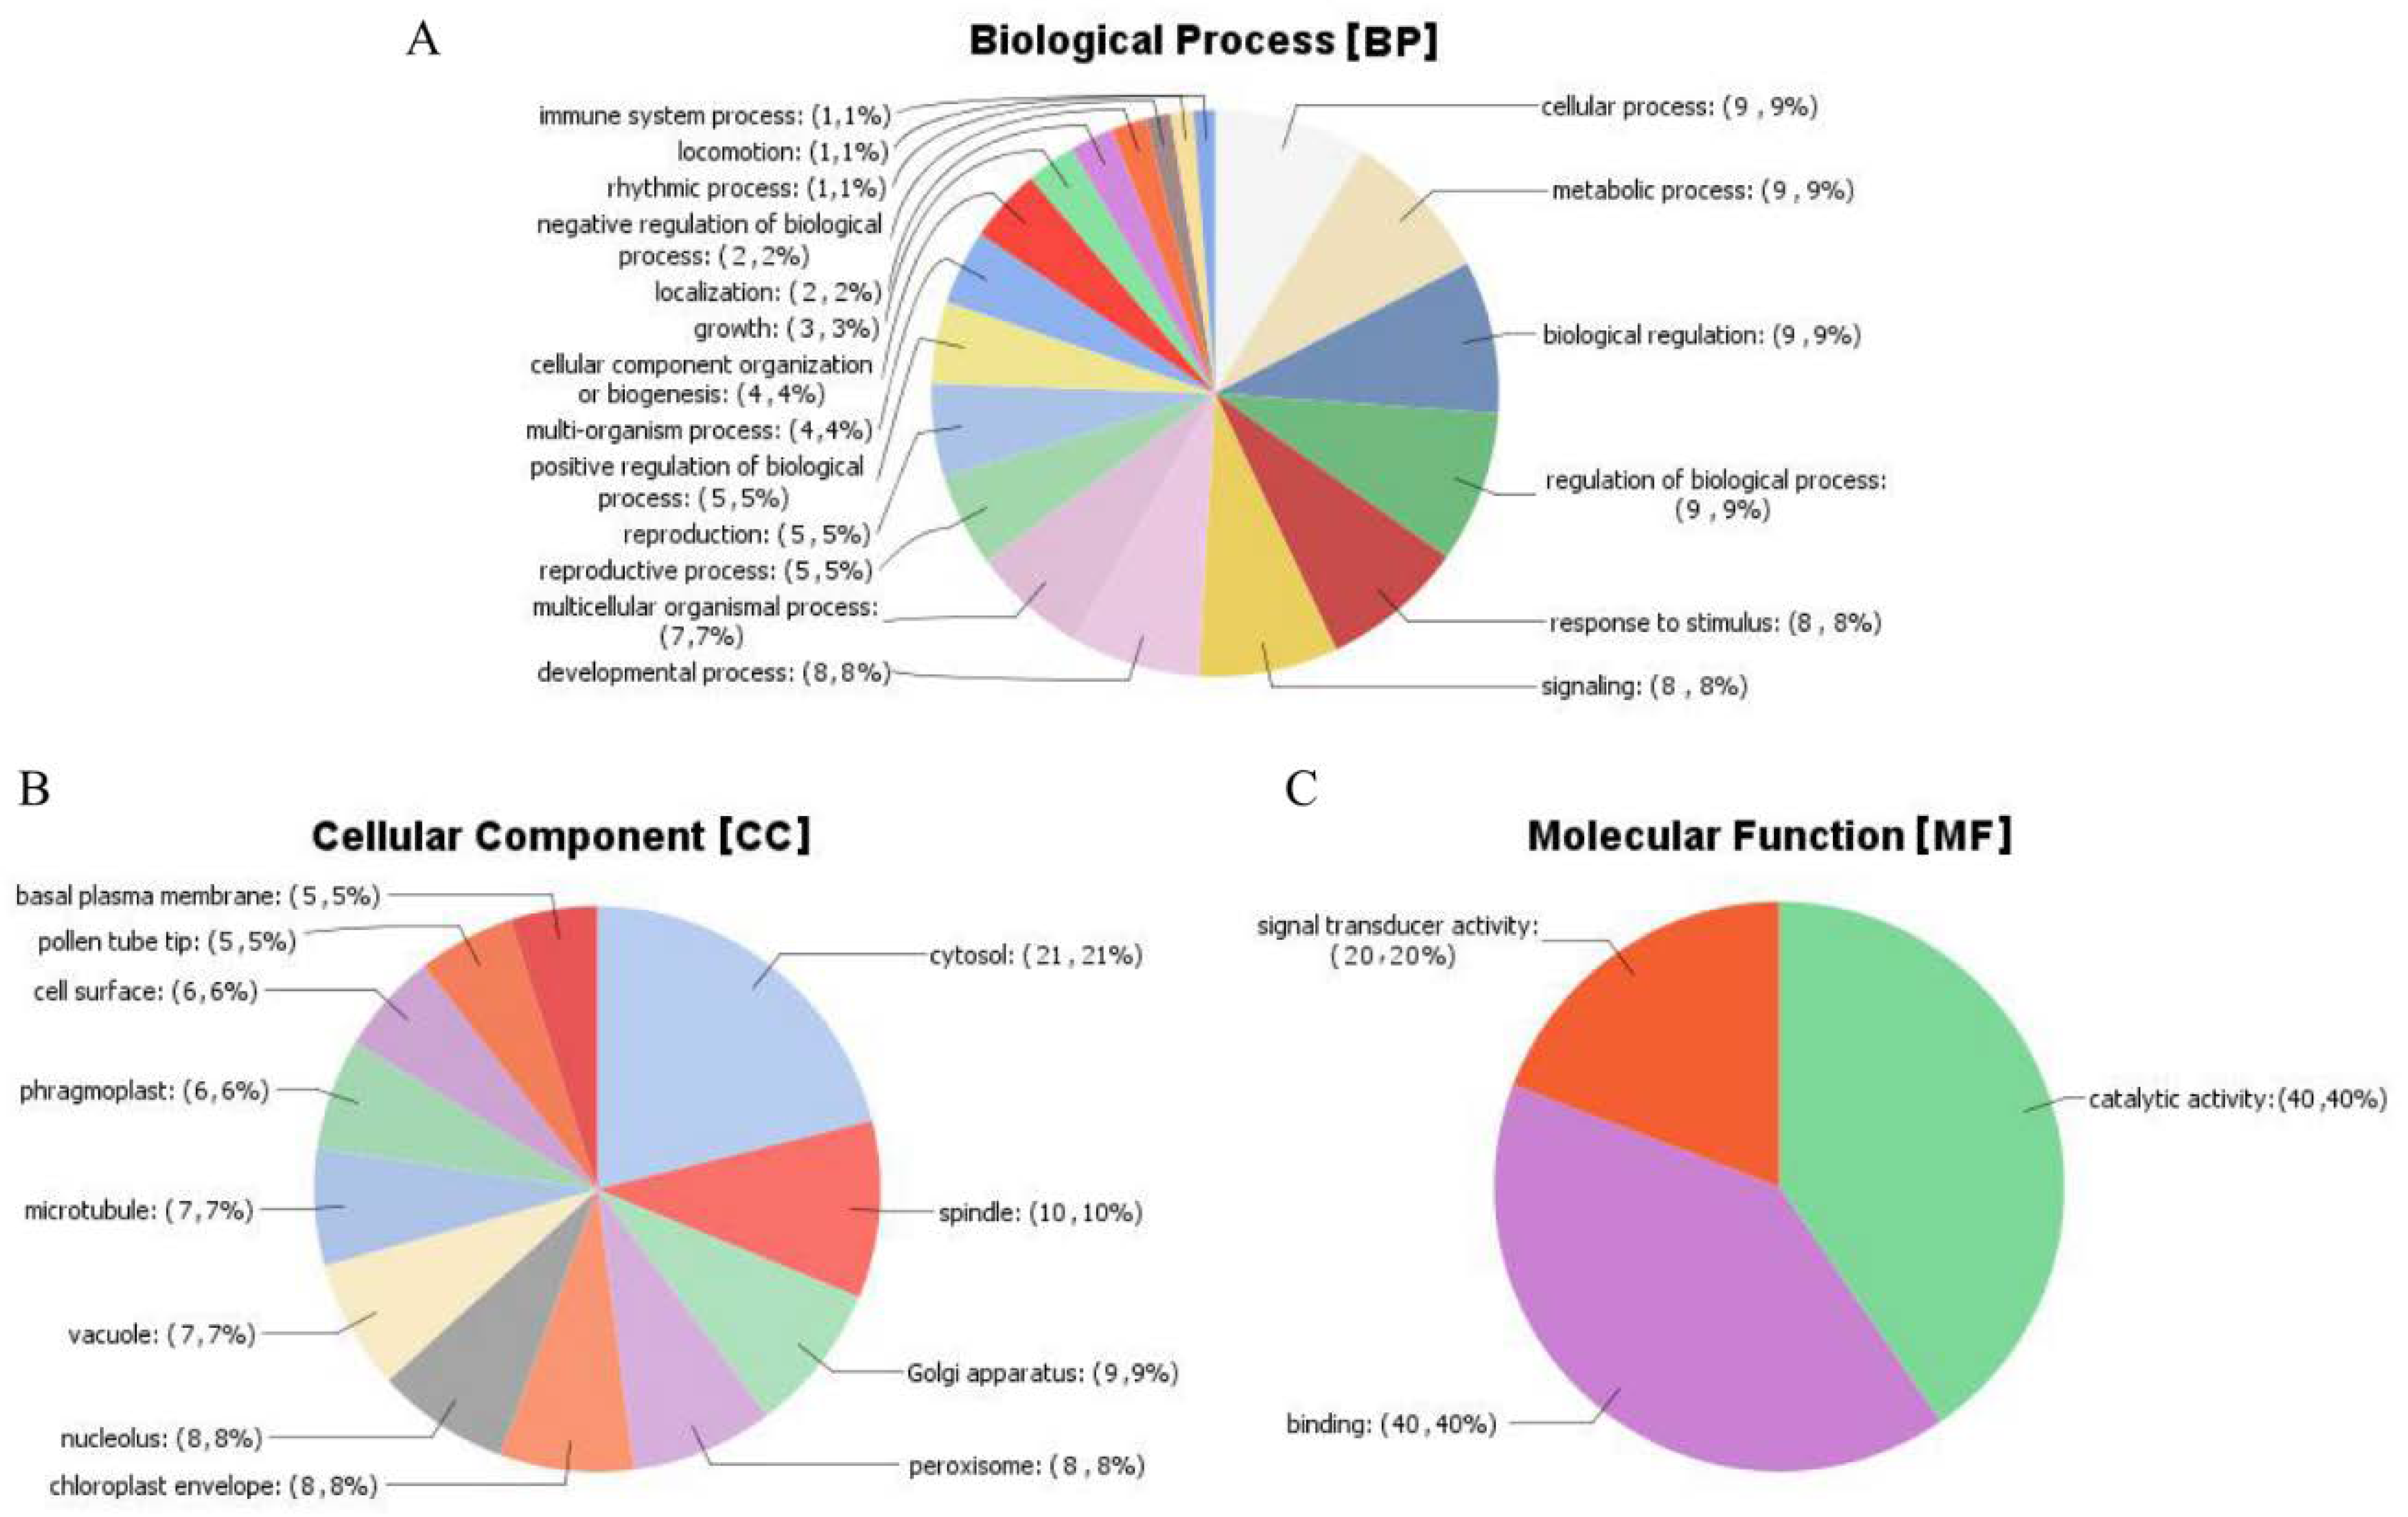
2.12. Gene Ontology (GO) Analysis of the Mined Genes

To understand the functions of these differentially expressed probe sets, we performed gene ontology (GO) analysis using Blast2GO online tool (Available online: https://www.blast2go.com/). GO functional annotation describes the genes in to three groups, as genes with roles in the cellular components (CC), molecular functions (MF), and biological processes (BP). The analysis of the mined genes showed that all the genes were involved in all the three GO functional annotations. The highest GO functions were detected for the following genes: Gh_A11G1297 (41 GO functions), Gh_D11G1445 (39 GO functions), Gh_D11G2830 (35 GO functions), Gh_A09G0713 (34 GO functions), Gh_D06G2142, Gh_D01G1809, Gh_A09G0712, and Gh_A01G1558 with 33 GO functions each. Among all the 271 genes, Gh_D03G0962 and Gh_A03G0665 had the least number of GO functions annotation, of six each. Interestingly, in all the 6 GO functional annotations, all the three GO functional terms were detected. For the majority of the genes, their GO functional annotations ranged from 7 to 34 (Supplementary Table S7), an indication that the gene subfamily, serine/threonine protein kinases, are playing vital roles within the plant. Environmental stresses such as drought, salinity, cold among others requires the plant not only adopt morphological changes but molecular and biological processes are vital for plant survival under various abiotic stress factors. The highest GO functional annotation was detected for biological process (BP) with 236 functions, then cellular component (CC) with 60 functions, while molecular function (MF) had the least functions of 54 (Figure 7).
In -biological process (BP), various functions with direct correlation to stress factors such as GO:0009738 (abscisic acid-activated signaling pathway); GO:0009864 (induced systemic resistance, jasmonic acid mediated signaling pathway), GO:0035556 (intracellular signal transduction); GO:0032270 (positive regulation of cellular protein metabolic process), GO:1901002 (positive regulation of response to salt stress), GO:0080136 (priming of cellular response to stress), GO:2000037 (regulation of stomatal complex patterning), GO:0000226 (microtubule cytoskeleton organization), GO:0000278 (mitotic cell cycle), GO:0006468 (protein phosphorylation), GO:0007049 (cell cycle), GO:0006397 (miRNA processing), GO:0007093 (mitotic cell cycle checkpoint), GO:0006470 (protein dephosphorylation), GO:0051304 (chromosome separation), GO:0007059 (chromosome segregation), GO:0055085 (transmembrane transport), and GO:0032465 (regulation of cytokinesis). Extracellular and intracellular signals detections are vital for the plant in order to initiate precise cellular responses such as programmed cell death (PCD) in case of stress conditions. Signaling to programmed cell death result in major reorganization of cellular components. The plant cytoskeleton is known to play a major role in cellular organization [63,64]. Microtubule cytoskeleton organization function was detected for two genes, Gh_A08G1143 and Gh_D08G1426. The two genes were located in the two homologous chromosomes, chrA08 of At_sub genome and chr23 (D08) of the Dt_sub genome. Given that cotton is an important crop for its natural fibers, the fibers are cells, and therefore their growth to broad spectrum of sizes and shape, is largely influenced by the microtubule cytoskeletons just like it does in the coordination of growth of other cells within the plant [65].
In relation to molecular functions (MF), various functions were detected, such as GO:0008641 (ubiquitin-like modifier activating enzyme activity), GO:0004871 (signal transducer activity), GO:0003700 (DNA binding transcription factor activity), GO:0004672 (protein kinase activity), GO:0004540 (ribonuclease activity), GO:0005524 (ATP binding), GO:0004712 (protein serine/threonine/tyrosine kinase activity), GO:0004725 (protein tyrosine phosphatase activity), GO:0005488 (binding), GO:0005515 (protein binding), GO:0004674 (protein serine/threonine kinase activity), GO:0016772 (transferase activity transferring phosphorus-containing groups), GO:0004713 (protein tyrosine kinase activity), and GO:0046873 (metal ion transmembrane transporter activity). The molecular functions detected point to various mechanisms adopted by the plants in order to increase their tolerance levels to various stress factors. The majority of the molecular functions play critical roles in the signal pathways, for instance protein tyrosine kinase activity has been found to be involved in abscisic acid signaling pathways [66]. Abscisic acid (ABA) is an important plant phytohormone, it regulates several aspects of plant development and adaptation to stress, more drought [67].
Finally, the following GO functional annotations were detected for cellular component (CC), such as GO:0005634 (nucleus), GO:0005654 (nucleoplasm), GO:0005730 (nucleolus), GO:0005737 (cytoplasm), GO:0005773 (vacuole), GO:0005776 (autophagosome), GO:0005777 (peroxisome), GO:0009507 (chloroplast), GO:0009534 (chloroplast thylakoid), GO:0012505 (endomembrane system), and GO: 0016020 (membrane), among others. The cellular membrane integrity is important for the normal functioning of the cell. Plants, being sessile, are exposed to many types of biotic and abiotic stresses. Plants sense these stimuli and transduce the signal into downstream biological responses often through the plasma membrane, which is generally the source for signaling lipids. These are usually generated by modifying enzymes like phospholipases, lipid kinases, or phosphatases. Lipid signaling molecules accumulate transiently and have a fast turnover [68], thus enhancing tolerance to various stress factors. Any damage to the membrane affects the delicate osmotic balance in the cell eventually leading to plant death. The detection of cellular component function provided fundamental information on some of the vital genes which could have been introgressed from the tolerant donor parent to the BC2F2 generations.

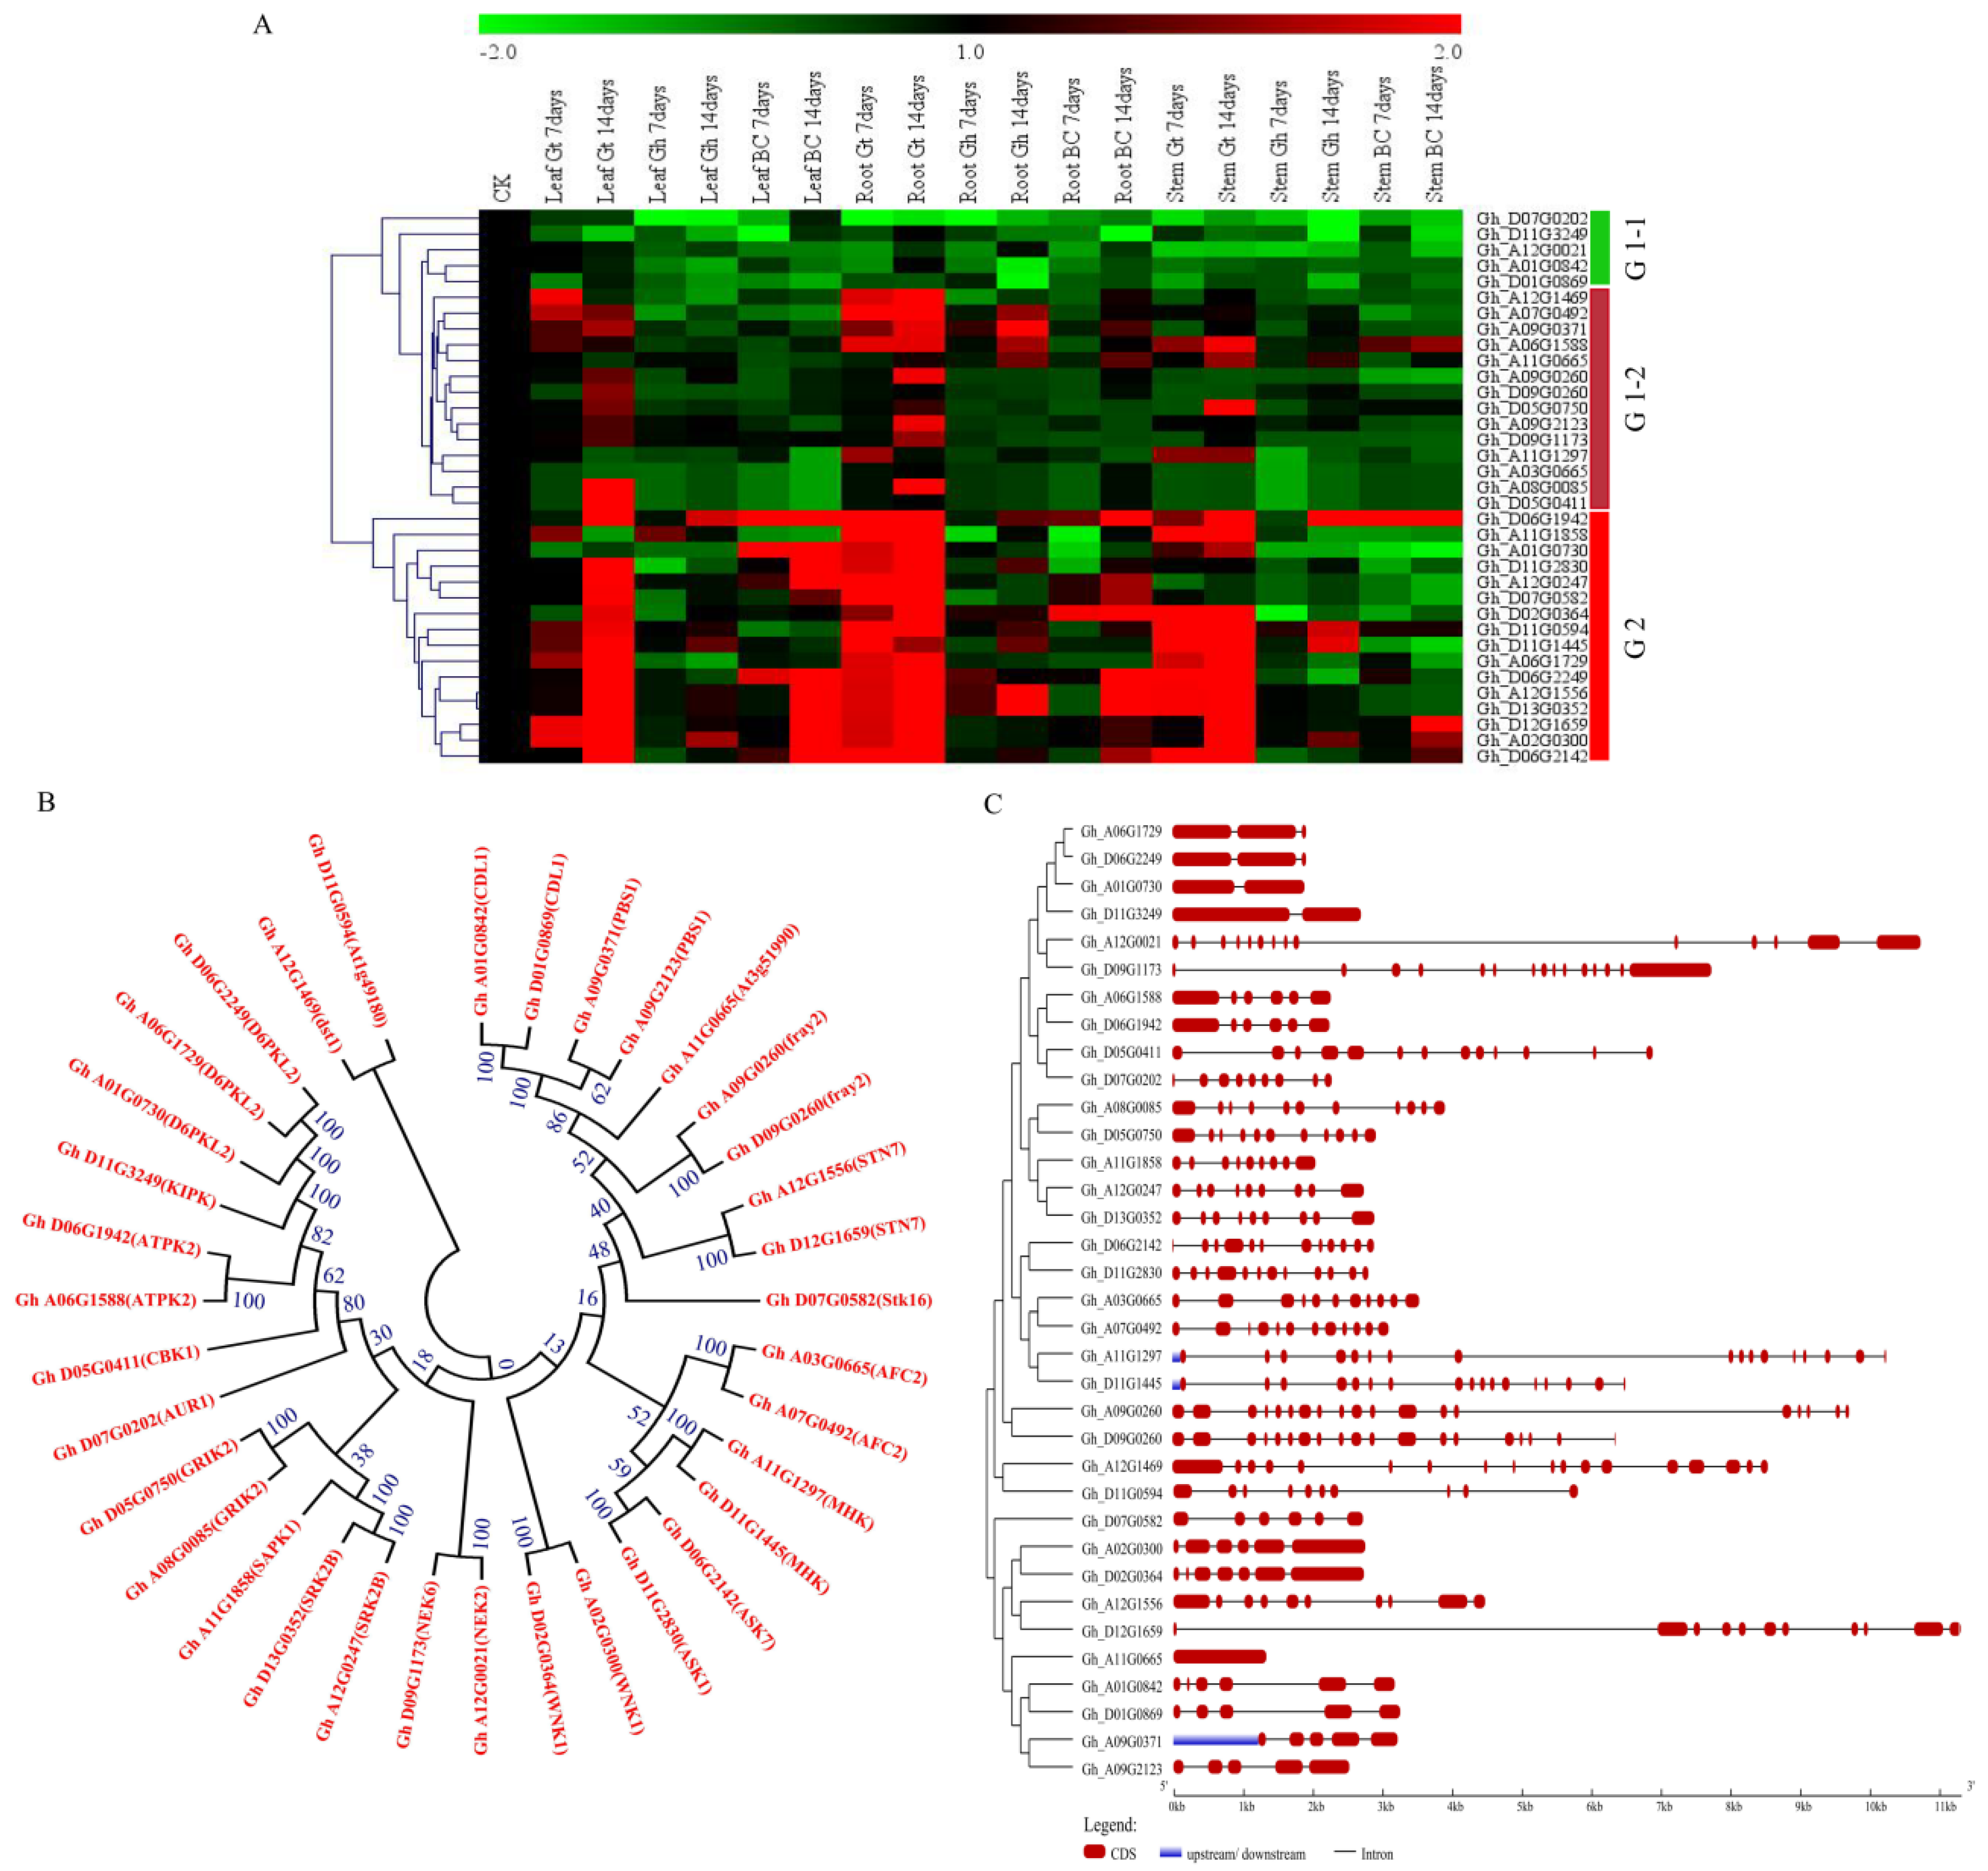
2.13. qRT-PCR Validation of the Candidate Genes

In response to various abiotic stresses, plants continuously need to adjust their transcriptome profile [69]. The expression levels of the various transcriptome enable us to understand the possible roles played by the various genes under stress condition. In this research work, the top ranked genes, as per the RNA sequence data, were analyzed by determining their expression levels in the root, stem, and leaves of the drought susceptible cultivar, G. hirsutum, drought tolerant G. tomentosum, and their first backcross filial generation, BC2F1. Based on the expression profile, the genes were clustered into two groups, Group 1 (19 genes) were mainly partially up regulated in the various tissues of G. tomentosum, but all were down regulated in both G. hirsutum and BC2F1 generation. The group 2 (16 genes) were highly up regulated in all the tissues of the drought tolerant genotype, G. tomentosum, but were partially up regulated in the tissues of drought susceptible parent, G. hirsutum, but relatively up regulated in BC2F1 compared to G. hirsutum. (Figure 8A). We further analyzed the structure and phylogenetic tree relationship of the 35 genes, in order to understand the expression behaviors of the paralogous gene pairs; generally genes of the same functional domain were cladded together, for instance Gh_A01G0842 and its homolog pair in Dt_sub genome Gh_D01G0869, were cladded together with 100% similarity (Figure 8B). Though it is important to note that not all the paired genes were homologous to each other, for instance Gh_A03G0665 and Gh_A07G0492, but were all members of Serine/threonine-protein kinase AFC2. All the genes were found to be interrupted by introns, except Gh_A11G0665 (Figure 8C). Introns have been found to be playing an important role in gene expression. Significantly higher level of gene expression has been observed in intron-containing transgenes than from otherwise identical intronless constructs [70]. In general, more genes were found to up regulated in various tissues of the tolerant genotype, G. tomentosum as opposed to the expression levels in both G. hirsutum and BC2F1, a similar observation has been reported in which tolerant genotypes have shown the ability to induct more stress related genes compared to the less tolerant genotypes in various crops such as barley [71].

3. Discussion

The use of backcross population is vital as compared to the real inbred lines of the F2 populations. In this research work, we successfully developed a backcross population between an elite upland cotton, G. hirsutum and a wild type G. tomentosum. We developed the backcross in order to solve the problem of hybrid sterility and the difficulty of using wild genotypes for trait mapping and genotype improvements [72]. A backcross population was developed through a two tire-backcross of a wild donor parent, G. tomentosum crossed to an adapted recurrent parent, G. hirsutum. The backcross generation developed had a much smaller portion of the wild genome present in each line; the effects of agronomically-unadapted alleles were reduced, allowing estimates of the value of wild alleles in the context of cultivated germplasm. Similar approaches have been used successfully in various crops such as barley [73], wheat, and maize [72] among other plants.
In the past decade, several successive molecular maps of cotton have been constructed using diverse DNA molecular markers and mapping populations. The major mapping populations used were the inter- and intra-specific populations mainly of inbred lines of the F2 generations, such as F2 generations developed between G. hirsutum and G. mustelinum [74], G. hirsutum and the Hawaiian endemic, G. tomentosum [75], among many others. The significant distinguishing feature of the linkage map constructed in this work, compared with previous maps, is that it was developed from a more recent and precise mapping technique known as genotyping by sequence (GBS). The mapped developed had a map size of 4191.259 cM covering all the chromosomes with an average marker distance of 0.3849 cM. The percentage proportions of marker distance of less than 1cM compared to the total of markers generated was 82%, which translated to 8921 out of the 10,888 markers used. And therefore, the map developed qualifies as a fine map, which would meet the needs for marker assisted selection (MAS). In addition, the mapping coverage in relation to the reference genome, G. hirsutum across the 26 linkage groups ranged from 97.3 to 100%. The highest coverage per chromosome was observed in At_chr07, At_chr08, Dt_chr03, and Dt_chr07, while the lowest coverage was in Dt_chr05. The overall genome coverage was 99.6%, with 99.4% and 99.7% coverage in the At and Dt_sub genomes respectively. The map generated was not only suitable for MAS but an important tool in mining various genes with significant roles both in growth and development.
The ever-changing environmental conditions have posed a great challenge not only to cotton production but to other crops too. The loss caused by drought and salt stress combined currently stands at 60% of the total economic loss in the agricultural sector [76]. Cotton production has continued to decline as a result of abiotic stress factors, the problem is much more compounded due to narrow genetic base of the cultivated cotton due to intensive section and interbreeding over a period of time [77]. The application of cotton wild progenitors will help to solve the bottleneck of narrow genetic base and in turn change the response dynamics of cultivated cotton to various environmental stress factors. Due to excellent reference genome coverage of the map developed, we carried out gene mining per linkage group, and obtained a total of 32,892 genes, with the lowest number of genes mined in At_chr04 (1210 genes), while the highest number of genes mined were obtained in Dt_chr05 (3600 genes). All the genes mined were found to be distributed in 6141 domains. Due to the huge number of genes domains obtained in this research, we further analysed the domains in order to determine the frequency of each domain per the linkages, the domain with the highest frequency was termed as the dominant domain. The dominant domain was the Pkinase (PF00069) with a total of 1069 genes. In the Pkinase domain (PF00069), we identified 44 different sub domains. The sub domain with the highest number of genes was found to serine/threonine-protein kinase (271 genes), in which of interest were those involved in abiotic stress tolerance. The various serine/threonine-protein kinases types detected were; Serine/threonine-protein kinase 16/38 (seven genes), AFC1 (seven genes), AGC1-7 (two genes), At3g07070 (six genes), ATG1a (five genes), AtPK2/AtPK19 (eight genes), Aurora-1/3 (four genes), BLUS1 (ten genes), CBK1 (six genes), CDL1 (ten genes), D6PKL2 (16 genes), dst1 (four genes), fray2 (17 genes), GRIK2 (four genes), KIPK (11 genes), mph1 (three genes), Nek2/5/6/7 (20 genes), OSR1 (one gene), PBS1 (23 genes), PEPKR2 (four genes), ppk15 (four genes), Prpf4b (one gene), RUK (two genes), SAPK1/2/3/7/8 (8 genes), spk-1 (one gene), SRK2B/E/G/H (12 genes), SRK2I (three genes), SRPK (three genes), STN7/8 (four genes), svkA (four genes), TIO (one gene), Tnni3k (one gene), TOUSLED (three genes), trc (six genes), UCNL (five genes), WAG1 (four genes), WNK1/8 (eight genes), IRE1B (two genes), At1g28390/ At5g23170 (four genes), CCR1/4 (four genes), and ASK1/7/8/10 (14 genes). Plants respond to environmental stresses such as drought, salinity, and cold by activation of complex intracellular signaling cascades that regulate physiological and biochemical acclimation. In multicellular organisms, protein kinases are key elements involved in signal transduction responsive to metabolism, biotic, and abiotic stresses [78]. Results obtained were in agreement to previous publications, in which sucrose non-fermenting 1 (SNF1)-type serine-threonine protein kinase SAPK4 has been found to regulate stress-responsive gene expression in rice [79]. In addition, the PBS1 genes have been found to be involved in defense mechanisms against diseases in plants [80]. The use of the wild cotton progenitors is significant in solving various abiotic and biotic stress pandemics in plants; Kirungu et al. [81] applied simple sequence repeat (SSR) markers in mapping an F2 population developed from two wild cotton of the D genome, they were able to find vital genes such as the NAC genes, which have been previously shown to be involved in enhancing various stress factors in plants. And therefore, the detection of the myriad genes of the serine/threonine protein kinases, of being the most abundant domain, could offer reprieve in solving the problem of drought stress in cotton breeding strategies.
In carrying out deep analysis of the genes of the dominant sub domains of the Pkinases, we characterized the genes through miRNA target predictions, cis element analysis, GO functional annotations, and RNA sequence analysis. The genes were found to be targeted by various miRNAs, such as ghr-miR156c (five genes), ghr-miR164 (6 genes), ghr-miR390a (19 genes), ghr-miR7491 (21 genes), and ghr-miR7511 (12 genes) among others. The microRNAs, such as miR164, have been found to be playing an important role in drought stress conditions, and have been closely associated to the LEA genes, which do accumulate in high levels in seeds under dehydrated conditions [82]. Similarly, various cotton miRNAs such as miR164, miR172, miR396, miR1520, miR6158, ghr-n24, ghr-n56, and ghr-n59, among which some were detected in this research, have been found to be associated to some of the top ranked genes related to drought and salinity, such as NAC, MYB, and MAPK [83]. The cotton miRNA such as ghr-miR164 targeted the following genes, Gh_A01G1666 (NEK7), Gh_A09G1167 (NEK6), Gh_D01G1916 (NEK7), Gh_D08G0686 (NEK2), Gh_D09G1173 (NEK6), and Gh_D10G1380 (BLUS1), while ghr-miR396a targeted four genes which were Gh_A07G1048 (TOUSLED), Gh_D05G0400 (Tnni3k), Gh_D05G0835 (KIPK) and Gh_A11G2021 (ppk15). The NIMA-related kinases (NEKs) genes have been identified in eukaryotic organisms, including human beings, the NEK genes are classified into 11 groups, NEK1 to NEK11. A number of the NEK gene family members have been found to play significant roles in cell cycle control. In particular, NEK2, NEK6, NEK7, and NEK9 contribute to the establishment of the microtubule-based mitotic spindle, whereas NEK1, NEK10, and NEK11 have been implicated in the DNA damage response [84]. Roles for NEKs in other aspects of mitotic processes, such as nuclear envelope breakdown, spindle assembly checkpoint signaling, chromatin condensation, and cytokinesis have also been pointed out. Environmental stresses such as drought and salt stress, leads to over production of oxidants such as H2O2, which has degrading effect on the DNA, the detection of NEK associated genes, could be involved in the DNA repair.
Gene ontology (GO), provides critical information on various functions, the genes could be involved in within the cell. It basically classifies the genes into three functional groups, biological process (BP), molecular function (MF), and cellular component (CC). Among the serine/threonine genes, various functions were detected for biological and molecular process, whereas only a single function was detected for the cellular component, which was the membrane. The various functions detected were highly correlated to various biotic and abiotic stress tolerances in plants. The results obtained for GO annotations were further supported by the results obtained for the cis elements analysis. The cis elements regulate the gene functions and there are known cis elements, such as the MYBs, LTRE, and ABRE, which play significant roles in enhancing drought tolerance in plants [85]. The detection of these cis elements among others clearly shows the important roles played by the mined genes, in enhancing tolerance to various biotic and abiotic stresses.
RNA sequence data revealed differential expression pattern among the 271 genes of the serine/threonine protein kinases. The majority of the genes were found to be up regulated under salt and drought stress conditions, more so group 1 and 3. The highly up regulated gene among the entire 271 genes was Gh_A12G1556, STN7 (serine/threonine-protein kinases STN7, chloroplastic). The STN7 kinase catalyzes the phosphorylation of the globally most common membrane proteins in plant chloroplasts [86]. Recent discoveries have shown that different biotic and abiotic stresses have detrimental effects on plant growth and development, affecting chloroplast functions. Photosynthesis is significantly impaired in response to abiotic stresses, such as drought, salinity, cold, high light stress, and heat. Photosynthesis also responds rapidly to pathogen infection [87]. Increased levels of hydrogen peroxide (H2O2) and reactive oxygen (ROS) due stress effects destroys the photosynthetic apparatus, therefore the primary response is the regulation of ROS resulting from photosynthesis [88]. Increased levels of reactive oxygen causes massive damage to the cell, affecting the cell membrane stability and in extreme conditions leads to cell death [89]. Cell membrane stability (CMS) under drought stress condition is critical for plants to maintain its various physiochemical activities and thus a physiological trait used for determining drought stress tolerance in plants [90]. Plants have internal repair mechanisms whenever the chloroplast is damaged. The chloroplasts have repair mechanism for the photosynthetic core proteins, most importantly the D1 protein of the photosystem II (PSII) [91]. The role of STN7 in enhancing stress tolerance has been investigated in the model plant, Arabidopsis thaliana, in which STN7 was found to be regulated by oxidative and or salt stress [92]. Similarly, water deficit has been found to accelerate the phosphorylation process of the photosystem II (PSII) core and D1 protein synthesis in Pisum sativum [93]. Moreover, phosphorylations of the thylakoid proteins and related non-photochemical quenching (NPQ) have been proposed to be an adaptive mechanism of chloroplasts to abiotic stress [94].

4. Materials and Methods

4.1. Development of Plant Materials

Backcross Inbred Lines (BILs) was developed using G. hirsutum-CRI-12 (G09091801-2) and G. tomentosum-AD3-00 (P0601211) as the recurrent and donor parents respectively. The maternal parental line, accession number CRI-12 forms over 90% of cotton being currently cultivated in China, but its production is being limited due to its low tolerance to drought and salt stresses. It is mostly preferred due its high production and relatively superior fiber quality. G. hirsutum accession number CRI-12 was developed by our research institute, cotton research institute (CRI), Chinese Academy of Agricultural Sciences, thus the code CRI. The accession AD3-00 (P0601211) of G. tomentosum was used as the male donor parent, it was collected from its natural habitat from the dry and rocky coastal areas of the Hawaiian Islands [16]. G. hirsutum was crossed with G. tomentosum, and F1 was then crossed with the recurrent parent, G. hirsutum twice. BC2F1 was then selfed to obtain BC2F2; over 400 lines were eventually developed. Two hundred backcross progenies were used in this study; the 200 lines were selected due to insufficient amount of seeds. The lines were developed in Sanya Island, Hainan province, China. The region has a tropic monsoon climate with mean annual temperature range of 22–27 °C with annual precipitation between 1500 and 2600 mm.

4.2. Sample Collection, Extraction, Quantification and Quality Determination of DNA

Tender leaves of the 200 backcross population (BC2F2) and the two parental lines were collected and frozen in liquid nitrogen, before being stored under –80 °C in preparation for DNA extraction. The DNA extraction kit, obtained from TaKaRa MiniBEST Plant Genomic (TAKARA BIO Inc., Beijing, China) was used for DNA extraction. The kit contained 70 µL 50× DTT Buffer, 500 µL, 28 mL buffer HS1, 1.8 mL Buffer KAC, 28 mL Buffer GB, and 28 mL Buffer WA, 24 mL buffer WB and elution buffer of 14 mL. We carried out pre-preparation by adding 56 mL of absolute ethanol (100%) to buffer WB, mixed before use, 500 µL of HS1 with 10 µL of 50× DTT buffer was prepared for each sample in 1.5 mL tubes. Each sample of approximately 100 mg of leaf tissues was vortexed in liquid nitrogen in to fine powder, then immediately added to the marked tubes containing a mixture of HS1 and 50× DTT Buffers, 10 µL RNaseA was immediately added, mixed and the tubes incubated in water bath at 56 °C for 10 min. In each sample tube, 62.5 µL of buffer KAC was mixed with 12.5% of Buffer HS1 by volume, the mixture was then vortexed for one minute, then put in ice for 5 min, after which, centrifuged at 12,000 rpm for 5 min. The supernatant was then transferred into a new tube, and an equal amount of buffer GB was added, and then mixed. The mixture was then transferred to spin column and centrifuged at 12,000 rpm for 1 min. The flow through was discarded. On to the spin column, 500 µL of Buffer WA was added, and centrifuged at 12,000 rpm for one minute. The flow through was then discarded. On the same spin column, 700 µL of buffer WB was added, and then centrifuged at 12,000 rpm for 1 min, the procedure was repeated twice. The spin column was then transferred to collecting tube, and centrifuged for 2 min. The spin column was then transferred into a 1.5 mL tube, 50 µL of preheated elution buffer was added, and then left for 5 min before centrifuging at 12,000 rpm 2 min, and this was to dissolve the DNA. We determined the degradation and contamination of DNA by running the DNA samples through 1% agarose gels. The purity of DNA was determined by using the Nano Photometer® spectrophotometer (IMPLEN, Westlake Village, CA, USA). The ratio of absorbance at 260 nm and 280 nm was used to assess the purity of DNA. The DNA samples with the ratio of ~1.8 were then qualified as pure [95]. The concentration of DNA was done using Qubit® DNA Assay Kit in Qubit® 2.0 Fluorimeter (Life Technologies, Camarillo, CA, USA). The Qubit® dsDNA HS (High Sensitivity) Assay Kits make DNA quantitation easy and accurate, the kit was used as per the procedure [96].

4.3. The GBS Library Preparation, Sequencing, and SNP Genotyping

The Illumina platform offers increased sequencing depth and a robust paired-end sequencing technology that recovers DNA sequence from the both ends of a single DNA template [97]. After the Illumina HiSeqTM 2500, California, United Sates of America, sequencing data (raw data) is down, quality control of the down data was performed, and the low-quality data was filtered to obtain high quality data (Clean Data). The quality filtering methods for Illumina reads generally rely upon machine-reported Q-scores and empirically defined thresholds to eliminate noise [98]. Varying the stringency of these thresholds changes the sensitivity and specificity of the outcome, without guaranteeing an accurate base call using sequencing data with burrows wheeler aligner (BWA) software [99]. Comparison of the sequence to the published reference genome of G. hirsutum was done in order to obtain the position of the sequences in bam file format by use of GATK software [100]. Correction of bam files, detection of SNP, and small Indel were carried out using the vcfutils tool of the Samtools software [99] to obtain high-quality mutation sites. The principle of genetics requires that the markers are coded according to the parental alleles, and the markers were filtered to obtain high-quality molecular markers.
The sequencing through GBS was carried out, as outlined by Elshire et al. [101], by incorporating three PCR plates of 96 wells across the 200 barcodes for library preparation and sequencing. For SNP determination, the raw sequence data for the mapping population of 200 BC2F2 and two parental lines were analyzed through GATK software GBS pipeline [102] by integrating G. hirsutum sequence as the reference genome [103]. The reference genome was downloaded from Cotton research institute website (Available online: http://mascotton.njau.edu.cn/info/1054/1118.htm). For alignment, the Burrows–Wheeler Aligner (BWA) mem [104] with default parameters was employed. The output consisted of variant call format (VCF) file version 4.1 [105] including SNPs present in at least 40% of the progeny and with a minor allele frequency (MAF) 0.1. Subsequently, the VCF was filtered using vcf tools version. 1.12 [105] and GATK software [100]. Ninety three thousand three hundred and eighty four (93,384) raw SNPs were identified in 200 BC2F2 population by using GATK software [100]; a custom filtering process was applied for alignment. The filtering was based on maintaining sites with read depth range of 6% and 75% completeness by site across progeny and by progeny across sites. Results were obtained in hapmap file format. Finally, through the use of a custom perl script marker heterozygous in the BC2F1 generations, with a co-dominant segregation ratio of 1:2:1 among the BC2F2 population, a chi-squared (χ2) goodness-of-fit test at α ≤ 0.01 was determined. The whole data obtained was then reformatted and transferred to JoinMap® 4.1 for linkage group determination. Twenty six (26) linkage groups were generated, being the parental lines were tetraploid cotton, with 26 chromosomes.

4.4. Linkage Map Construction

Markers were arranged based on their LOD scores, pairwise recombination fractions and linkage group length [106]. Linkage analysis was done with JoinMap 4.0 [107] with a recombination frequency set at 0.40 with LOD score of 2.5 for the BIL population, this was a somewhat more stringent threshold than that the value used for the relatively smaller genomes, though appropriate for the approximately 4500 cM genome of cotton. The Kosambi mapping function was used to convert the recombination frequencies to map distances [108]. Linkages at distances of >35 Kosambi cM, were considered non-significant.

4.5. Gene Mining and Functional Characterization

20 kb up and down stream regions were applied for mining of genes, similar method has been used in mining of genes in diploid cotton [81]. The mined genes were analysed and their various functional annotation determined. We carried out functional annotation through Blast2GO pro-software version 4.1.1 (Available online: https://www.blast2go.com), phylogentic tree and gene structures analysis of the key genes by the use of gene structure displayer server (Available online: http://gsds.cbi.pku.edu.cn/).

4.6. miRNA Target and Promoter Analysis

MicroRNAs (miRNAs) are small RNA molecules, which function as regulators of gene expression in a range of developmental and signaling pathways in plants and animals. A number of studies have shown that abiotic stresses trigger aberrant expression of many miRNAs, thus indicating that miRNAs may be a new target for genetically improving plant tolerance to certain stresses [54].
In order to determine if the mined genes were targeted by any known miRNAs, we carried out the prediction of miRNAs which could be targeting the mined genes. The miRNA sequences were downloaded from miRBase (Available online: http://www.mirbase.org), the plant miRNA database (Available online: http://bioin formatics.cau.edu.cn/PMRD/), and EST database (Available online: http://www.ncbi.nlm.nih.gov/nucest). The genes targeted by miRNAs were predicted by searching 5′ and 3′ untranslated regions (UTRs) and the coding sequence (CDS) of all the mined genes for complementary sequences of the cotton miRNAs using the psRNATarget server with default parameters (Available online: http://plantgrn.noble.org/psRNATarget/?Function=3).
In addition, we also carried out cis promoter analysis, the promoter sequences (2 kb upstream of the translation start site) of all the mined genes, which were obtained from the cotton genome project (Available online: http://cgp.genomics.org.cn/page/species/index.jsp). Transcriptional response elements of the mined genes promoters were predicted using an online tool the PLACE database (Available online: http://www.dna.affrc.go.jp/PLACE/signals can.html).

4.7. RNA Sequence Analysis of the Mined Genes and qRT-PCR Validation of Key Genes under Drought Stress Condition

The mined genes were further analyzed by extracting their RNA sequences from cotton genome database (Available online: http://mascotton.njau.edu.cn) in reference to salt and drought stresses expression profiles at varying time intervals. The reads per kilobase of exon per million reads mapped (FPKM) data was then transformed into log10 and a heatmap constructed. The top 35 highly expressed key genes were later used for qRT-PCR validation under drought stress condition. Primer premier 5 (Available online: http://www.premierbiosoft.com/primerdesign/) was used to design the genes specific primers with melting temperatures of 55–60 °C, primer lengths of 18–25 bp, and amplicon lengths of 101–221 bp (Supplementary Table S8). Ghactin gene forward sequence “ATCCTCCGTCTTGACCTTG” and reverse sequence “TGTCCGTCAGGCAACTCAT” were used as the reference gene for the qRT-PCR analysis. The tissues used were mainly obtained from the two parental lines, drought resistant male donor genotype, G. tomentosum, the drought sensitive recurrent female genotype, G. hirsutum and their first backcross filial generation BC2F1 progenies. The three cotton genotypes were grown in a greenhouse, and at three true leaves stage, water was totally withdrawn, the moisture level was monitored daily by use of soil moisture sensor, Em50 DECAGON, Pullman, WA, USA. When soil is used as opposed to hydroponic set up for carrying out drought stress tolerance screening in plants, longer stress exposure is always suitable for obtaining samples for carrying out gene expression analysis [82]. The condition in the greenhouse was set with temperature at 23 ± 1 °C and a 14 h light/10 h dark photoperiod. The soil water potential was maintained at −20 kPa under the controlled plants, while drought treated plants, water was totally withdrawn. Soil is known to be well watered when the soil water potential is above −30 kPa [109]. Roots, leaves, and stem tissues were collected at 0, 7 and 14 days of post drought stress treatments for RNA extraction. The RNA extraction kit, EASYspin plus plant RNA kit, by Aid Lab., Beijing, China (Available online: www.aidlab.cn), was employed in the extraction of RNA from the samples. The concentration and quality of each extracted RNA samples was determined by using a NanoDrop 2000 spectrophotometer (Thermo Fisher, Waltham, MA, USA) and gel electrophoresis. The RNA samples which met the criterion 260/280 ratio of 1.8–2.1, 260/230 ratio ≥ 2.0, were used for further analyses. The first strand cDNA synthesis was done with TranScriptAll-in-One First-Strand cDNA Synthesis SuperMix for qRT-PCR (Roche Diagnostics GmbH, Mannheim, Germany), it was used as per the manufacturer’s instructions. The Fast Start Universal SYBR green Master (Rox) (Roche, Mannheim, Germany) was used to carry out qRT-PCR analysis in accordance with the manufacturer’s instructions. The qRT-PCR reactions samples were prepared in a total volume of 20 μL, containing 10 μL of SYBR green master mix, 2 μL of cDNA template, 6 μL of ddH2O, and 2 μL of each primer.

5. Conclusions

The development and mapping of the backcross population developed from the two tetraploid cottons of diverse origin provided vital information on how the wild cotton progenitors can be exploited to solve the impasse of low and poor yield in cotton due to effects of abiotic and biotic stress factor. The broadening of genetic diversity of the elite cotton cultivars is paramount, if we have to meet the ever-growing demand for food and clothing. Advancement in the spinning industries too has worsened the situation, as very high-quality fibres are required. Gossypium hirsutum, an upland cotton, is the most preferred tetraploid cotton, due to its high yielding and comparatively good fibre qualities, but its production is threatened by its narrow genetic base, as a result of intensive selection and inbreeding. The development of the BC2F2 population between G. hirsutum and G. tomentosum provides an excellent germplasm, which can be utilised in solving the problem of narrow genetic base. The map developed in this study through GBS markers was the very first fine genetic map developed between the two germplasm, the map covered a total map size of 4,191.259 cM, with 10,888 SNPs being distributed across the 26 linkage groups, generating an average marker distance of 0.3849 cM. The total SNPs generated in this study had Q30 range of 93.75% to 95.84%, an indication that the sequencing process was of high threshold, with error minimised to zero level. The map generated enabled us to mine a total of 32,892 genes, being distributed across 6141 gene domains. In the analysis of the various gene domains, Pkinase (PF00069) was found to be the most dominant group with a total of 1069 genes. The dominant domain was further analysed, and the serine/threonine-protein kinases were found to the majority genes, with a total of 271 genes, belonging to different sub classes such as the NEK and STN genes among others. In the analysis of the RNA sequence data, the genes were found to exhibit differential expression under salt and drought stress conditions, in which 16 genes were found to be the candidate genes with greater role under drought stress condition as revealed by both RNA sequence and qRT-PCR validation results. The candidate genes are Gh_A02G0364 (Enoyl-CoA delta isomerase 3), Gh_A06G1729 (Serine/threonine-protein kinase D6PKL2), Gh_D13G0352 (Serine/threonine-protein kinase SRK2B), Gh_A12G0247 (Serine/threonine-protein kinase SRK2B), Gh_D06G2142 (Shaggy-related protein kinase eta), Gh_A02G0300 (Serine/threonine-protein kinase WNK1), Gh_A12G1659 (Kelch domain-containing protein 3). Gh_A12G1556 (Serine/threonine-protein kinase STN7, chloroplastic Klhdc3), Gh_D06G2249 (Serine/threonine-protein kinase D6PKL2), Gh_D11G1445 (Serine/threonine-protein kinase MHK), Gh_D11G0594 (Serine/threonine-protein kinase ATG1t), Gh_D07G0582 (Serine/threonine-protein kinase Stk16), Gh_D11G2830 (Shaggy-related protein kinase alpha ASK1). Gh_A01G0730 (Serine/threonine-protein kinase D6PKL2), Gh_A11G1858 (Serine/threonine-protein kinase SAPK1), and Gh_D06G1942 (Serine/threonine-protein kinase AtPK2/AtPK19) were found to be highly up regulated under drought stress condition, and thus can be exploited further in the development of robust cotton genotypes with improved performance under water deficit condition.

Supplementary Materials

Supplementary materials can be found at https://www.mdpi.com/1422-0067/19/6/1614/s1.

Author Contributions

R.O.M., K.W. and F.L. designed the experiment, R.O.M., P.L., J.N.K., Y.X., Y.H., Q.D., Y.H. and L.D. implemented and collected the data. R.O.M. analyzed the results and prepared the manuscript. J.N.K., L.P., L.D., Y.X., Y.H., F.L., X.W., X.C. and K.W. revised the manuscript. All authors reviewed and approved the final manuscript.

Acknowledgments

This research program was financially sponsored by the National Natural Science Foundation of China (31671745, 31530053) and the National key research and development plan (2016YFD0100306).

Conflicts of Interest

The authors declare no conflicts of interest.

Abbreviations

GBSGenotyping by sequencing
WGSWhole genome shotgun
GOGene ontology
PCDProgrammed cell death
ABAAbscisic acid
MASMarker assisted selection
MPSMassively parallel sequencing
NGSNext generation sequencing

References

  1. Renny-Byfield, S.; Page, J.T.; Udall, J.A.; Sanders, W.S.; Peterson, D.G.; Arick, M.A.; Grover, C.E.; Wendel, J.F. Independent Domestication of Two Old World Cotton Species. Genome Biol. Evol. 2016, 8, 1940–1947. [Google Scholar] [CrossRef] [PubMed]
  2. Bowman, D.T. Public Cotton Breeders—Do We Need Them? J. Cotton Sci. 1999, 3, 139–152. [Google Scholar]
  3. Abdurakhmonov, I.Y.; Kohel, R.J.; Yu, J.Z.; Pepper, A.E.; Abdullaev, A.A.; Kushanov, F.N.; Salakhutdinov, I.B.; Buriev, Z.T.; Saha, S.; Scheffler, B.E.; et al. Molecular diversity and association mapping of fiber quality traits in exotic G. hirsutum L. germplasm. Genomics 2008, 92, 478–487. [Google Scholar] [CrossRef] [PubMed]
  4. Dabbert, T.A.; Gore, M.A. Challenges and Perspectives on Improving Heat and Drought Stress Resilience in Cotton. Breed. Genet. 2014, 409, 393–409. [Google Scholar]
  5. Zhang, J.; Percy, R.G.; McCarty, J.C. Introgression genetics and breeding between Upland and Pima cotton: A review. Euphytica 2014, 198, 1–12. [Google Scholar] [CrossRef]
  6. Peng, Z.; He, S.; Gong, W.; Sun, J.; Pan, Z.; Xu, F.; Lu, Y.; Du, X. Comprehensive analysis of differentially expressed genes and transcriptional regulation induced by salt stress in two contrasting cotton genotypes. BMC Genom. 2014, 15, 760. [Google Scholar] [CrossRef] [PubMed]
  7. Upadhyaya, H.D.; Yadav, D.; Dronavalli, N.; Gowda, C.L.L.; Singh, S. Mini core germplasm collections for infusing genetic diversity in plant breeding programs. Electron. J. Plant Breed. 2010, 1, 1294–1309. [Google Scholar]
  8. Petrov, P.; Petrova, A.; Dimitrov, I.; Tashev, T.; Olsovska, K.; Brestic, M.; Misheva, S. Relationships between leaf morpho-anatomy, water status and cell membrane stability in leaves of wheat seedlings subjected to severe soil drought. J. Agron. Crop Sci. 2017, 219–227. [Google Scholar] [CrossRef]
  9. Ullah, A.; Sun, H.; Yang, X.; Zhang, X. Drought coping strategies in cotton: Increased crop per drop. Plant Biotechnol. J. 2017, 15, 271–284. [Google Scholar] [CrossRef] [PubMed]
  10. Maxted, N.; Kell, S.; Toledo, Á.; Dulloo, E.; Heywood, V.; Hodgkin, T.; Hunter, D.; Guarino, L.; Jarvis, A.; Ford-Lloyd, B. A global approach to crop wild relative conservation: Securing the gene pool for food and agriculture. Kew Bull. 2010, 65, 561–576. [Google Scholar] [CrossRef]
  11. Atwell, B.J.; Wang, H.; Scafaro, A.P. Could abiotic stress tolerance in wild relatives of rice be used to improve Oryza sativa? Plant Sci. 2014, 215–216, 48–58. [Google Scholar] [CrossRef] [PubMed]
  12. Valkoun, J.J. Wheat pre-breeding using wild progenitors. Euphytica 2001, 119, 17–23. [Google Scholar] [CrossRef]
  13. Fang, D.D.; Jenkins, J.N.; Deng, D.D.; McCarty, J.C.; Li, P.; Wu, J. Quantitative trait loci analysis of fiber quality traits using a random-mated recombinant inbred population in Upland cotton (Gossypium hirsutum L.). BMC Genom. 2014, 15, 397. [Google Scholar] [CrossRef] [PubMed]
  14. Yu, J.; Zhang, K.; Li, S.; Yu, S.; Zhai, H.; Wu, M.; Li, X.; Fan, S.; Song, M.; Yang, D.; et al. Mapping quantitative trait loci for lint yield and fiber quality across environments in a Gossypium hirsutum × Gossypium barbadense backcross inbred line population. Theor. Appl. Genet. 2013, 126. [Google Scholar] [CrossRef] [PubMed]
  15. Lacape, J.M.; Gawrysiak, G.; Cao, T.V.; Viot, C.; Llewellyn, D.; Liu, S.; Jacobs, J.; Becker, D.; Barroso, P.A.V.; de Assunção, J.H.; et al. Mapping QTLs for traits related to phenology, morphology and yield components in an inter-specific Gossypium hirsutum × G. barbadense cotton RIL population. Field. Crops Res. 2013, 144, 256–267. [Google Scholar] [CrossRef]
  16. DeJoode, D.R.; Wendel, J.F. Genetic Diversity and Origin of the Hawaiian Islands Cotton, Gossypium tomentosum. Am. J. Bot. 1992, 79, 1311–1319. [Google Scholar] [CrossRef]
  17. Lehman, A.; Pender, R.; Morden, C.; Wieczorek, A.M. Assessment of Persistence of Hybrids between Alien Pima Cotton, Gossypium barbadense (Malvaceae), and Endemic Hawaiian Cotton, G. tomentosum, in Hawai’i1. Pac. Sci. 2014, 68, 85–96. [Google Scholar] [CrossRef]
  18. Oluoch, G.; Zheng, J.; Wang, X.; Khan, M.K.R.; Zhou, Z.; Cai, X.; Wang, C.; Wang, Y.; Li, X.; Wang, H.; et al. QTL mapping for salt tolerance at seedling stage in the interspecific cross of Gossypium tomentosum with Gossypium hirsutum. Euphytica 2016, 209, 223–235. [Google Scholar] [CrossRef]
  19. Hou, M.; Cai, C.; Zhang, S.; Guo, W.; Zhang, T.; Zhou, B. Construction of microsatellite-based linkage map and mapping of nectarilessness and hairiness genes in Gossypium tomentosum. J. Genet. 2013, 92, 445–459. [Google Scholar] [CrossRef] [PubMed]
  20. Khan, M.K.R.; Chen, H.; Zhou, Z.; Ilyas, M.K.; Wang, X.; Cai, X.; Wang, C.; Liu, F.; Wang, K. Genome Wide SSR High Density Genetic Map Construction from an Interspecific Cross of Gossypium hirsutum × Gossypium tomentosum. Front. Plant Sci. 2016, 7. [Google Scholar] [CrossRef] [PubMed]
  21. Mackay, I.J.; Caligari, P.D.S. Efficiencies of F2 and backcross generations for bulked segregant analysis using dominant markers. Crop Sci. 2000, 40, 626–630. [Google Scholar] [CrossRef]
  22. Hospital, F. Selection in backcross programmes. Philos. Trans. R. Soc. B Biol. Sci. 2005, 360, 1503–1511. [Google Scholar] [CrossRef] [PubMed]
  23. Miah, G.; Rafii, M.Y.; Ismail, M.R.; Puteh, A.B.; Rahim, H.A.; Latif, M.A. Recurrent parent genome recovery analysis in a marker-assisted backcrossing program of rice (Oryza sativa L.). C. R. Biol. 2015, 338, 83–94. [Google Scholar] [CrossRef] [PubMed]
  24. Kim, K.S.; Diers, B.W.; Hyten, D.L.; Rouf Mian, M.A.; Shannon, J.G.; Nelson, R.L. Identification of positive yield QTL alleles from exotic soybean germplasm in two backcross populations. Theor. Appl. Genet. 2012, 125, 1353–1369. [Google Scholar] [CrossRef] [PubMed]
  25. Zhang, S.; Ni, D.; Yi, C.; Wang, X.; Wang, Z.Y.; Yang, J. Lowering grain amylose content in backcross offsprings of indica rice variety 057 by molecular marker-assisted selection. Rice Sci. 2005, 12, 157–162. [Google Scholar]
  26. Li, J.Z.; Huang, X.Q.; Heinrichs, F.; Ganal, M.W.; Röder, M.S. Analysis of QTLs for yield components, agronomic traits, and disease resistance in an advanced backcross population of spring barley. Genome 2006, 49, 454–466. [Google Scholar] [CrossRef] [PubMed]
  27. Mutlu, N.; Miklas, P.; Reiser, J.; Coyne, D. Backcross breeding for improved resistance to common bacterial blight in pinto bean (Phaseolus vulgaris L.). Plant Breed. 2005, 124, 282–287. [Google Scholar] [CrossRef]
  28. Behera, T.K.; Staub, J.E.; Behera, S.; Delannay, I.Y.; Chen, J.F. Marker-assisted backcross selection in an interspecific Cucumis population broadens the genetic base of cucumber (Cucumis sativus L.). Euphytica 2011, 178, 261–272. [Google Scholar] [CrossRef]
  29. Tucker, T.; Marra, M.; Friedman, J.M. Massively Parallel Sequencing: The Next Big Thing in Genetic Medicine. Am. J. Hum. Genet. 2009, 85, 142–154. [Google Scholar] [CrossRef] [PubMed]
  30. De Summa, S.; Malerba, G.; Pinto, R.; Mori, A.; Mijatovic, V.; Tommasi, S. GATK hard filtering: Tunable parameters to improve variant calling for next generation sequencing targeted gene panel data. BMC Bioinform. 2017, 18. [Google Scholar] [CrossRef] [PubMed]
  31. Kosman, E.; Leonard, K.J. Similarity coefficients for molecular markers in studies of genetic relationships between individuals for haploid, diploid, and polyploid species. Mol. Ecol. 2005, 14, 415–424. [Google Scholar] [CrossRef] [PubMed]
  32. Ajawatanawong, P.; Baldauf, S.L. Evolution of protein indels in plants, animals and fungi. BMC Evol. Biol. 2013, 13. [Google Scholar] [CrossRef] [PubMed]
  33. Bansal, V.; Libiger, O. A probabilistic method for the detection and genotyping of small indels from population-scale sequence data. Bioinformatics 2011, 27, 2047–2053. [Google Scholar] [CrossRef] [PubMed]
  34. Montgomery, S.B.; Goode, D.L.; Kvikstad, E.; Albers, C.A.; Zhang, Z.D.; Mu, X.J.; Ananda, G.; Howie, B.; Karczewski, K.J.; Smith, K.S.; et al. The origin, evolution, and functional impact of short insertion-deletion variants identified in 179 human genomes. Genome Res. 2013, 23, 749–761. [Google Scholar] [CrossRef] [PubMed]
  35. Li, S.; Li, R.; Li, H.; Lu, J.; Li, Y.; Bolund, L.; Schierup, M.H.; Wang, J. SOAPindel: Efficient identification of indels from short paired reads. Genome Res. 2013, 23, 195–200. [Google Scholar] [CrossRef] [PubMed] [Green Version]
  36. Jiang, Y.; Wang, Y.; Brudno, M. PRISM: Pair-read informed split-read mapping for base-pair level detection of insertion, deletion and structural variants. Bioinformatics 2012, 28, 2576–2583. [Google Scholar] [CrossRef] [PubMed]
  37. Abyzov, A.; Urban, A.E.; Snyder, M.; Gerstein, M. CNVnator: An approach to discover, genotype, and characterize typical and atypical CNVs from family and population genome sequencing. Genome Res. 2011, 21, 974–984. [Google Scholar] [CrossRef] [PubMed]
  38. Hanada, K.; Zhang, X.; Borevitz, J.O.; Li, W.H.; Shiu, S.H. A large number of novel coding small open reading frames in the intergenic regions of the Arabidopsis thaliana genome are transcribed and/or under purifying selection. Genome Res. 2007, 17, 632–640. [Google Scholar] [CrossRef] [PubMed]
  39. Li, F.; Fan, G.; Lu, C.; Xiao, G.; Zou, C.; Kohel, R.J.; Ma, Z.; Shang, H.; Ma, X.; Wu, J.; et al. Genome sequence of cultivated Upland cotton (Gossypium hirsutum TM-1) provides insights into genome evolution. Nat. Biotechnol. 2015, 33, 524–530. [Google Scholar] [CrossRef] [PubMed]
  40. Han, K.; Jeong, H.J.; Yang, H.B.; Kang, S.M.; Kwon, J.K.; Kim, S.; Choi, D.; Kang, B.C. An ultra-high-density bin map facilitates high-throughput QTL mapping of horticultural traits in pepper (Capsicum annuum). DNA Res. 2016, 23, 81–91. [Google Scholar] [CrossRef] [PubMed]
  41. Yu, J.; Kohel, R.J.; Smith, C.W. The construction of a tetraploid cotton genome wide comprehensive reference map. Genomics 2010, 95, 230–240. [Google Scholar] [CrossRef] [PubMed]
  42. Pascual, L.; Desplat, N.; Huang, B.E.; Desgroux, A.; Bruguier, L.; Bouchet, J.P.; Le, Q.H.; Chauchard, B.; Verschave, P.; Causse, M. Potential of a tomato MAGIC population to decipher the genetic control of quantitative traits and detect causal variants in the resequencing era. Plant Biotechnol. J. 2015, 13, 565–577. [Google Scholar] [CrossRef] [PubMed]
  43. Yuan, D.; Tang, Z.; Wang, M.; Gao, W.; Tu, L.; Jin, X.; Chen, L.; He, Y.; Zhang, L.; Zhu, L.; et al. The genome sequence of Sea-Island cotton (Gossypium barbadense) provides insights into the allopolyploidization and development of superior spinnable fibres. Sci. Rep. 2016, 5, 17662. [Google Scholar] [CrossRef] [PubMed]
  44. Dahab, A.A.; Saeed, M.; Hamza, N.B.; Babiker, B. Linkage disequilibrium and association mapping of drought tolerance in cotton (Gossypium hirsutum L.) germplasm population from diverse regions of Pakistan. Afr. J. Biotechnol. 2016, 15, 2603–2612. [Google Scholar] [CrossRef]
  45. Sciences, P.; Saleem, M.A.; Malik, T.A.; Shakeel, A.; Ashraf, M. QTL Mapping for Some Important Drought Tolerant Traits in Upland. J. Anim. Plant Sci. 2015, 25, 502–509. [Google Scholar]
  46. Rong, J.; Feltus, F.A.; Waghmare, V.N.; Pierce, G.J.; Chee, P.W.; Draye, X.; Saranga, Y.; Wright, R.J.; Wilkins, T.A.; May, O.L.; et al. Meta-analysis of polyploid cotton QTL shows unequal contributions of subgenomes to a complex network of genes and gene clusters implicated in lint fiber development. Genetics 2007, 176, 2577–2588. [Google Scholar] [CrossRef] [PubMed]
  47. Scheeff, E.D.; Bourne, P.E. Structural Evolution of the Protein Kinase–Like Superfamily. PLoS Comput. Biol. 2005, 1, e49. [Google Scholar] [CrossRef] [PubMed]
  48. Hanks, S.K.; Hunter, T. Protein kinases 6. The eukaryotic protein kinase superfamily: Kinase (catalytic) domain structure and classification. FASEB J. 1995, 9, 576–596. [Google Scholar] [CrossRef] [PubMed]
  49. Manning, G.; Whyte, D.B.; Martinez, R.; Hunter, T.; Sudarsanam, S. The protein kinase complement of the human genome. Science 2002, 298, 1912–1934. [Google Scholar] [CrossRef] [PubMed]
  50. Shen, X.; Guo, W.; Zhu, X.; Yuan, Y.; Yu, J.Z.; Kohel, R.J.; Zhang, T. Molecular mapping of QTLs for fiber qualities in three diverse lines in Upland cotton using SSR markers. Mol. Breed. 2005, 15, 169–181. [Google Scholar] [CrossRef]
  51. Boss, I.W.; Renne, R. Viral miRNAs: Tools for immune evasion. Curr. Opin. Microbiol. 2010, 13, 540–545. [Google Scholar] [CrossRef] [PubMed]
  52. Jones-Rhoades, M.W.; Bartel, D.P.; Bartel, B. MicroRNAs and Their Regulatory Roles in Plants. Annu. Rev. Plant Biol. 2006, 57, 19–53. [Google Scholar] [CrossRef] [PubMed]
  53. Khan, G.A.; Declerck, M.; Sorin, C.; Hartmann, C.; Crespi, M.; Lelandais-Brière, C. MicroRNAs as regulators of root development and architecture. Plant Mol. Biol. 2011, 77, 47–58. [Google Scholar] [CrossRef] [PubMed]
  54. Kumar, R. Role of microRNAs in biotic and abiotic stress responses in crop plants. Appl. Biochem. Biotechnol. 2014, 174, 93–115. [Google Scholar] [CrossRef] [PubMed]
  55. Sunkar, R.; Li, Y.F.; Jagadeeswaran, G. Functions of microRNAs in plant stress responses. Trends Plant Sci. 2012, 17, 196–203. [Google Scholar] [CrossRef] [PubMed]
  56. Zhao, B.; Liang, R.; Ge, L.; Li, W.; Xiao, H.; Lin, H.; Ruan, K.; Jin, Y. Identification of drought-induced microRNAs in rice. Biochem. Biophys. Res. Commun. 2007, 354, 585–590. [Google Scholar] [CrossRef] [PubMed]
  57. Marone, D.; Russo, M.A.; Laidò, G.; De Leonardis, A.M.; Mastrangelo, A.M. Plant nucleotide binding site-leucine-rich repeat (NBS-LRR) genes: Active guardians in host defense responses. Int. J. Mol. Sci. 2013, 14, 7302–7326. [Google Scholar] [CrossRef] [PubMed]
  58. Yoon, E.K.; Yang, J.H.; Lim, J.; Kim, S.H.; Kim, S.K.; Lee, W.S. Auxin regulation of the microRNA390-dependent transacting small interfering RNA pathway in Arabidopsis lateral root development. Nucleic Acids Res. 2009, 38, 1382–1391. [Google Scholar] [CrossRef] [PubMed]
  59. Crombach, A.; Hogeweg, P. Evolution of evolvability in gene regulatory networks. PLoS Comput. Biol. 2008, 4. [Google Scholar] [CrossRef] [PubMed]
  60. Hernandez-Garcia, C.M.; Finer, J.J. Identification and validation of promoters and cis-acting regulatory elements. Plant Sci. 2014, 217–218, 109–119. [Google Scholar] [CrossRef] [PubMed]
  61. Yamaguchi-Shinozaki, K.; Shinozaki, K. Organization of cis-acting regulatory elements in osmotic- and cold-stress-responsive promoters. Trends Plant Sci. 2005, 10, 88–94. [Google Scholar] [CrossRef] [PubMed]
  62. Rao, D.E.; Chaitanya, K.V. Photosynthesis and antioxidative defense mechanisms in deciphering drought stress tolerance of crop plants. Biol. Plant. 2016, 60, 201–218. [Google Scholar] [CrossRef]
  63. Williams, B.; Verchot, J.; Dickman, M.B. When supply does not meet demand-ER stress and plant programmed cell death. Front. Plant Sci. 2014, 5. [Google Scholar] [CrossRef] [PubMed]
  64. Gechev, T.S.; Van Breusegem, F.; Stone, J.M.; Denev, I.; Laloi, C. Reactive oxygen species as signals that modulate plant stress responses and programmed cell death. BioEssays 2006, 28, 1091–1101. [Google Scholar] [CrossRef] [PubMed]
  65. Preuss, M.L.; Delmer, D.P.; Liu, B. The cotton kinesin-like calmodulin-binding protein associates with cortical microtubules in cotton fibers. Plant Physiol. 2003, 132, 154–160. [Google Scholar] [CrossRef] [PubMed]
  66. Ghelis, T.; Bolbach, G.; Clodic, G.; Habricot, Y.; Miginiac, E.; Sotta, B.; Jeannette, E. Protein Tyrosine Kinases and Protein Tyrosine Phosphatases Are Involved in Abscisic Acid-Dependent Processes in Arabidopsis Seeds and Suspension Cells. Plant Physiol. 2008, 148, 1668–1680. [Google Scholar] [CrossRef] [PubMed]
  67. Iuchi, S.; Kobayashi, M.; Taji, T.; Naramoto, M.; Seki, M.; Kato, T.; Tabata, S.; Kakubari, Y.; Yamaguchi-Shinozaki, K.; Shinozaki, K. Regulation of drought tolerance by gene manipulation of 9-cis-epoxycarotenoid dioxygenase, a key enzyme in abscisic acid biosynthesis in Arabidopsis. Plant J. 2001, 27, 325–333. [Google Scholar] [CrossRef] [PubMed]
  68. Testerink, C.; Munnik, T. Phosphatidic acid: A multifunctional stress signaling lipid in plants. Trends Plant Sci. 2005, 10, 368–375. [Google Scholar] [CrossRef] [PubMed]
  69. Debnath, M.; Pandey, M.; Bisen, P.S. An Omics Approach to Understand the Plant Abiotic Stress. OMICS 2011, 15, 739–762. [Google Scholar] [CrossRef] [PubMed]
  70. Duncker, B.P.; Davies, P.L.; Walker, V.K. Introns boost transgene expression in Drosophila melanogaster. Mol. Gen. Genet. 1997, 254, 291–296. [Google Scholar] [CrossRef] [PubMed]
  71. Guo, P.; Baum, M.; Grando, S.; Ceccarelli, S.; Bai, G.; Li, R.; Von Korff, M.; Varshney, R.K.; Graner, A.; Valkoun, J. Differentially expressed genes between drought-tolerant and drought-sensitive barley genotypes in response to drought stress during the reproductive stage. J. Exp. Bot. 2009, 60, 3531–3544. [Google Scholar] [CrossRef] [PubMed]
  72. Tanksley, S.D.; Nelson, J.C. Advanced backcross QTL analysis: A method for the simultaneous discovery and transfer of valuable QTLs from unadapted germplasm into elite breeding lines. Theor. Appl. Genet. 1996, 92, 191–203. [Google Scholar] [CrossRef] [PubMed]
  73. Yun, S.J.; Gyenis, L.; Bossolini, E.; Hayes, P.M.; Matus, I.; Smith, K.P.; Steffenson, B.J.; Tuberosa, R.; Muehlbauer, G.J. Validation of quantitative trait loci for multiple disease resistance in barley using advanced backcross lines developed with a wild barley. Crop Sci. 2006, 46, 1179–1186. [Google Scholar] [CrossRef]
  74. Wang, B.; Liu, L.; Zhang, D.; Zhuang, Z.; Guo, H.; Qiao, X.; Wei, L.; Rong, J.; May, O.L.; Paterson, A.H.; et al. A Genetic Map between Gossypium hirsutum and the Brazilian Endemic G. mustelinum and Its Application to QTL Mapping. G3 2016, 6, 1673–1685. [Google Scholar] [CrossRef] [PubMed]
  75. Waghmare, V.N.; Rong, J.; Rogers, C.J.; Pierce, G.J.; Wendel, J.F.; Paterson, A.H. Genetic mapping of a cross between Gossypium hirsutum (cotton) and the Hawaiian endemic, Gossypium tomentosum. Theor. Appl. Genet. 2005, 111, 665–676. [Google Scholar] [CrossRef] [PubMed]
  76. Zhu, J.-K. Salt and drought stress signal transduction in plants. Annu. Rev. Plant Biol. 2002, 53, 247–273. [Google Scholar] [CrossRef] [PubMed]
  77. Chakravarthy, V.S.K.; Reddy, T.P.; Reddy, V.D.; Rao, K.V. Current status of genetic engineering in cotton (Gossypium hirsutum L.): An assessment. Crit. Rev. Biotechnol. 2012, 8551, 1–18. [Google Scholar] [CrossRef] [PubMed]
  78. Kulik, A.; Wawer, I.; Krzywińska, E.; Bucholc, M.; Dobrowolska, G. SnRK2 Protein Kinases—Key Regulators of Plant Response to Abiotic Stresses. OMICS 2011, 15, 859–872. [Google Scholar] [CrossRef] [PubMed]
  79. Diédhiou, C.J.; Popova, O.V.; Dietz, K.J.; Golldack, D. The SNF1-type serine-threonine protein kinase SAPK4 regulates stress-responsive gene expression in rice. BMC Plant Biol. 2008, 8. [Google Scholar] [CrossRef] [PubMed]
  80. Swiderski, M.R.; Innes, R.W. The Arabidopsis PBS1 resistance gene encodes a member of a novel protein kinase subfamily. Plant J. 2001, 26, 101–112. [Google Scholar] [CrossRef] [PubMed]
  81. Kirungu, J.N.; Deng, Y.; Cai, X.; Magwanga, R.O.; Zhou, Z.; Wang, X.; Wang, Y.; Zhang, Z.; Wang, K.; Liu, F. Simple sequence repeat (SSR) genetic linkage map of D genome diploid cotton derived from an interspecific cross between Gossypium davidsonii and Gossypium klotzschianum. Int. J. Mol. Sci. 2018, 19, 204. [Google Scholar] [CrossRef] [PubMed]
  82. Magwanga, R.O.; Lu, P.; Kirungu, J.N.; Lu, H.; Wang, X.; Cai, X.; Zhou, Z.; Zhang, Z.; Salih, H.; Wang, K.; et al. Characterization of the late embryogenesis abundant (LEA) proteins family and their role in drought stress tolerance in Upland cotton. BMC Genet. 2018, 19. [Google Scholar] [CrossRef] [PubMed]
  83. Nuruzzaman, M.; Sharoni, A.M.; Kikuchi, S. Roles of NAC transcription factors in the regulation of biotic and abiotic stress responses in plants. Front. Microbiol. 2013, 4. [Google Scholar] [CrossRef] [PubMed]
  84. De Souza, E.E.; Meirelles, G.V.; Godoy, B.B.; Perez, A.M.; Smetana, J.H.C.; Doxsey, S.J.; McComb, M.E.; Costello, C.E.; Whelan, S.A.; Kobarg, J. Characterization of the human NEK7 interactome suggests catalytic and regulatory properties distinct from those of NEK6. J. Proteome Res. 2014, 13, 4074–4090. [Google Scholar] [CrossRef] [PubMed]
  85. Fujita, Y.; Fujita, M.; Satoh, R.; Maruyama, K.; Parvez, M.M.; Seki, M.; Hiratsu, K.; Ohme-Takagi, M.; Shinozaki, K.; Yamaguchi-Shinozaki, K. AREB1 is a transcription activator of novel ABRE-dependent ABA signaling that enhances drought stress tolerance in Arabidopsis. Plant Cell 2005, 17, 3470–3488. [Google Scholar] [CrossRef] [PubMed]
  86. Tikkanen, M.; Grieco, M.; Kangasjarvi, S.; Aro, E.-M. Thylakoid Protein Phosphorylation in Higher Plant Chloroplasts Optimizes Electron Transfer under Fluctuating Light. Plant Physiol. 2010, 152, 723–735. [Google Scholar] [CrossRef] [PubMed]
  87. Gururani, M.A.; Venkatesh, J.; Tran, L.S.P. Regulation of photosynthesis during abiotic stress-induced photoinhibition. Mol. Plant 2015, 8, 1304–1320. [Google Scholar] [CrossRef] [PubMed]
  88. Foyer, C.H. Redox Homeostasis and Antioxidant Signaling: A Metabolic Interface between Stress Perception and Physiological Responses. Plant Cell 2005, 17, 1866–1875. [Google Scholar] [CrossRef] [PubMed]
  89. Sharma, P.; Jha, A.B.; Dubey, R.S.; Pessarakli, M. Reactive Oxygen Species, Oxidative Damage, and Antioxidative Defense Mechanism in Plants under Stressful Conditions. J. Bot. 2012, 2012, 1–26. [Google Scholar] [CrossRef]
  90. Rahman, M.; Ullah, I.; Ahsraf, M.; Stewart, J.M.; Zafar, Y. Genotypic variation for drought tolerance in cotton. Agron. Sustain. Dev. 2002, 28, 439–447. [Google Scholar] [CrossRef]
  91. Edelman, M.; Mattoo, A.K. D1-protein dynamics in photosystem II: The lingering enigma. Photosynth. Res. 2008, 98, 609–620. [Google Scholar] [CrossRef] [PubMed]
  92. Chen, Y.; Hoehenwarter, W. Changes in the Phosphoproteome and Metabolome link Early Signaling Events to Rearrangement of Photosynthesis and Central Metabolism in Salinity and Oxidative Stress Response in Arabidopsis. Plant Physiol. 2015. [Google Scholar] [CrossRef] [PubMed]
  93. Giardi, M.T.; Cona, A.; Geiken, B.; Kucera, T.; Masojidek, J.; Mattoo, A.K. Long-term drought stress induces structural and functional reorganization of photosystem II. Planta 1996, 199, 118–125. [Google Scholar] [CrossRef]
  94. Betterle, N.; Ballottari, M.; Baginsky, S.; Bassi, R. High Light-Dependent Phosphorylation of Photosystem II Inner Antenna CP29 in Monocots Is STN7 Independent and Enhances Nonphotochemical Quenching. Plant Physiol. 2015, 167, 457–471. [Google Scholar] [CrossRef] [PubMed]
  95. Wilfinger, W.W.; Mackey, K.; Chomczynski, P. 260/280 and 260/230 Ratios NanoDrop ® ND-1000 and ND-8000 8-Sample Spectrophotometers. BioTechniques 1997, 22, 474–481. [Google Scholar] [CrossRef] [PubMed]
  96. Invitrogen QubitTM dsDNA HS Assay Kits. Thermo Fish. 2015. Available online: https://www.thermofisher.com/order/catalog/product/Q32851 (accessed on 5 March 2018).
  97. Bartram, A.K.; Lynch, M.D.J.; Stearns, J.C.; Moreno-Hagelsieb, G.; Neufeld, J.D. Generation of multimillion-sequence 16S rRNA gene libraries from complex microbial communities by assembling paired-end Illumina reads. Appl. Environ. Microbiol. 2011, 77, 3846–3852. [Google Scholar] [CrossRef] [PubMed]
  98. Bokulich, N.A.; Subramanian, S.; Faith, J.J.; Gevers, D.; Gordon, J.I.; Knight, R.; Mills, D.A.; Caporaso, J.G. Quality-filtering vastly improves diversity estimates from Illumina amplicon sequencing. Nat. Methods 2013, 10, 57–59. [Google Scholar] [CrossRef] [PubMed]
  99. Li, H.; Handsaker, B.; Wysoker, A.; Fennell, T.; Ruan, J.; Homer, N.; Marth, G.; Abecasis, G.; Durbin, R. The Sequence Alignment/Map (SAM) Format and SAMtools 1000 Genome Project Data Processing Subgroup. Bioinformatics 2009, 25, 2078–2079. [Google Scholar] [CrossRef]
  100. McKenna, A.; Hanna, M.; Banks, E.; Sivachenko, A.; Cibulskis, K.; Kernytsky, A.; Garimella, K.; Altshuler, D.; Gabriel, S.; Daly, M.; et al. The genome analysis toolkit: A MapReduce framework for analyzing next-generation DNA sequencing data. Genome Res. 2010, 20, 1297–1303. [Google Scholar] [CrossRef] [PubMed]
  101. Elshire, R.J.; Glaubitz, J.C.; Sun, Q.; Poland, J.A.; Kawamoto, K.; Buckler, E.S.; Mitchell, S.E. A robust, simple genotyping-by-sequencing (GBS) approach for high diversity species. PLoS ONE 2011, 6. [Google Scholar] [CrossRef] [PubMed]
  102. Glaubitz, J.C.; Casstevens, T.M.; Lu, F.; Harriman, J.; Elshire, R.J.; Sun, Q.; Buckler, E.S. TASSEL-GBS: A high capacity genotyping by sequencing analysis pipeline. PLoS ONE 2014, 9. [Google Scholar] [CrossRef] [PubMed]
  103. Paten, B.; Novak, A.; Haussler, D. Mapping to a Reference Genome Structure. arXiv, 2014; arXiv:1404.5010. [Google Scholar]
  104. Li, H.; Durbin, R. Fast and accurate short read alignment with Burrows-Wheeler transform. Bioinformatics 2009, 25, 1754–1760. [Google Scholar] [CrossRef] [PubMed]
  105. Danecek, P.; Auton, A.; Abecasis, G.; Albers, C.A.; Banks, E.; DePristo, M.A.; Handsaker, R.E.; Lunter, G.; Marth, G.T.; Sherry, S.T.; et al. The variant call format and VCFtools. Bioinformatics 2011, 27, 2156–2158. [Google Scholar] [CrossRef] [PubMed]
  106. Abreu, P.C.; Greenberg, D.A.; Hodge, S.E. Direct Power Comparisons between Simple LOD Scores and NPL Scores for Linkage Analysis in Complex Diseases. Am. J. Hum. Genet. 1999, 65, 847–857. [Google Scholar] [CrossRef] [PubMed]
  107. Van Ooijen, J.W.; Voorrips, R.E. JoinMap 3.0—A Software for the Calculation of Genetic Linkage Maps Completely; Plant Research International: Wageningen, The Netherlands, 2001; pp. 1–51. [Google Scholar]
  108. Kosambi, D.D. the Estimation of Map Distances From Recombination Values. Ann. Eugen. 1943, 12, 172–175. [Google Scholar] [CrossRef]
  109. Donovan, L.; Linton, M.; Richards, J. Predawn plant water potential does not necessarily equilibrate with soil water potential under well-watered conditions. Oecologia 2001, 129, 328–335. [Google Scholar] [CrossRef] [PubMed]
Figure 1. Sample Base Composition and the Error Rate Distribution. (A) The x-axis is the base of the reads base, the y-axis represent the order of bases from 5′ to 3′ on reads; the ordinate is all reads on the test. The percentage of bases A, C, G, T, and N, respectively, and different bases are represented by different colors. (B) The x-axis is the reads base sitting position, which represents the order of bases from 5′ to 3′ on reads; the y-axis are all the reads with average error rate in (%).
Ijms 19 01614 g001
Figure 2. Indel Detection and Annotation. (A) Indel size distribution, the y-axis is the length distribution of the Indel (a positive value indicates the length of the insertion; a negative value indicates the length of the missing segment), and the x-axis is the number of Indels corresponding to the length; (B) Indel location information statistics.
Ijms 19 01614 g002
Figure 3. High Density Genetic Map Construction. (A) Genetic map. The x-axis: map size in centiMorgans (cM), y-axis: the linkage groups. (B) Recombination map of 200 BC2F2. Red: G. hirsutum blue: G. tomentosum.
Ijms 19 01614 g003
Figure 4. Reorganization and collinearity analysis. (A) Marker Chain Diagram of chr01, each row and column are markers arranged in map order. Each small square in the upper left part of the graph represents two Markers, left bar: the average marker distance, right bar: the LOD values. (B) Syntenic analysis. The x-axis is the physical distance of each chromosome, and the y-axis is the genetic length of each linkage group, where marker is represented in the form of a scatter. Genome and genetic map collinearity. The more diagonal the mark, the better the collinearity between the genetic map and the genome.
Ijms 19 01614 g004
Figure 5. The 26 linkage groups of the tetraploid cotton in which all the genes were mapped. Pink: are the various genes, Black: the flanking GBS markers. The positions are in mega base pairs.
Ijms 19 01614 g005
Figure 6. Relative expression levels of the transcriptome factors found to be targeted by ghr-miR390a. The axis x: the genes, y: the expression levels.
Ijms 19 01614 g006
Figure 7. GO functional analysis of the major classes of genes of the family serine/threonine protein kinases. (A) Biological processes (BP), (B) cellular components (CC) and (C) molecular functions (MF).
Ijms 19 01614 g007
Figure 8. qRT-PCR validation, phylogenetic tree and structural analysis of the 35 highly up regulated genes as determined through RNA sequestration. (A) The heat map was visualized using Mev.exe program. (shown by log2 values) in control, and in treated samples seven and 14 days after drought treatment. BC–BC2F1 (offspring), Gt–Gossypium tomentosum and Gh–Gossypium hirsutum. Red—up regulated, Green—down regulated and black-no expression. (B) Phylogenetic relationship of the 35 genes, values represent percentage similarity. (C) Gene structure.
Ijms 19 01614 g008
Table 1. Genetic map characteristics.
LinkagesMarkers (P. map)Markers (G. map)G. map Size (cM)Largest Gap (cM)Smallest Gap (cM)<1 cM1–5 cM5–10 cM10–20 cM>20 cMRatio
LG1_chrA012306772185.460119.8280.170676720100.99
LG2_chrA022368707133.63262.14720.152770510001
LG3_chrA0322170183.624260.95220.746444194020.63
LG4_chrA042057803184.73081.33360.170480020001
LG5_chrA05778285180.184410.54780.3584247350200.87
LG6_chrA0619388135.790215.32780.437348362100.55
LG7_chrA071572474146.55894.58680.230746760000.99
LG8_chrA081664542164.453513.58210.197953640100.99
LG9_chrA091054230176.13393.89880.6234190390000.83
LG10_chrA101139380184.01432.2270.3827361180000.95
LG11_chrA111650480182.838720.46510.261247440010.99
LG12_chrA12353113131.59138.11540.651871401000.63
LG13_chrA131285354159.9969.81160.327135012000.99
At_sub Total16,64063182149.00960.95220.152750602079530.8
LG14_chrD0119845151.7771145.87270.1047424300010.96
LG15_chrD0223785129.866132.00470.7545460212010.71
LG16_chrD0316179131.413317.514840.86149944312100.56
LG17_chrD04365129151.03768.61380.84135998273000.76
LG18_chrD0510970173.994578.088680.57059533340100.47
LG19_chrD062419947158.72060.811080.1224949900000.53
LG20_chrD07393164159.84835.94770.61716596661000.59
LG21_chrD081918824178.45120.856010.16405782300011
LG22_chrD09852293149.2598101.11460.13135629100010.99
LG23_chrD101854705137.66822.34340.13619970040000.99
LG24_chrD11691218186.89992.00930.714943173440000.79
LG25_chrD121593558133.58511.54440.17889955520000.99
LG26_chrD131230455199.728717.68840.30054344670100.98
Dt_sub total12,02045722042.25145.87270.10474238612368340.84
At/Dt Totals28,66010,8884191.259145.87270.104742892144317870.82
P. map: physical map; G. map: genetic map; Ratio: number of markers less than (<) 1 cM divided by total number of markers within the chromosome.
Table 2. Gene mining within the SNP markers for all the linkage groups based on their physical position in mega base pairs (Mb).
Chr.Number of MarkersCover Length (Mb)Chr. Length (Mb)Coverage (%)Density (marker/Mb)Genes in Reference Genome/chrMined Genes/Chro.% of Mined Genes/Chro.Number of Domains
LG1_chrA01230699.8502699.884710023.12162194690800
LG2_chrA02236883.2766983.44790699.828.41824169292.8673
LG3_chrA03221100.2122100.2630599.92.212187186085771
LG4_chrA04205762.7619362.91377299.832.81491121081.2102
LG5_chrA0577891.982292.04702399.98.464026290072997
LG6_chrA06193102.9532103.1704499.81.872119178884.4757
LG7_chrA07157278.1553878.25101899.920.12369207887.7831
LG8_chrA081664103.6089103.6263410016.12571223386.9869
LG9_chrA09105474.8615274.99993199.814.12532216885.6873
LG10_chrA101139100.6926100.866699.811.32357217692.3897
LG11_chrA11165093.3057393.31619210017.73305294789.2993
LG12_chrA1235387.3965987.48486699.94.042733249891.4938
LG13_chrA13128578.0203179.96112197.616.52356182977.6777
At-sub Total16,6401157.0771160.2399.714.432,03217,10685.93007
LG14_chrD0119860.9151661.45600999.13.252383206386.6800
LG15_chrD0223767.2222667.28455399.93.532448235696.2845
LG16_chrD0316146.671346.6906561003.451860163287.7681
LG17_chrD0436551.2702751.4541399.67.122040176586.5121
LG18_chrD0510960.243661.93304797.31.813942361091.61128
LG19_chrD06241964.0911364.29464399.737.72394223193.2844
LG20_chrD0739355.2931555.3126111007.112503219187.5854
LG21_chrD08191865.8338165.89413599.929.12765262194.8951
LG22_chrD0985250.9076150.99543699.816.72493240196.3921
LG23_chrD10185462.7854863.37466699.129.52646237889.9888
LG24_chrD1169165.5436166.08777499.210.53539325091.81038
LG25_chrD12159358.9427859.10983799.7272838258190.9931
LG26_chrD13123059.879460.53429898.920.52551236792.8922
Dt-sub total12,020769.6774.499.415.634,40215,78691.23134
At/Dt Totals28,6601926.71934.799.614.966,43432,89288.56141
Chr: chromosome; Mb: mega base pair; Dt: Dt_sub genome; At: At_sub genome.
Table 3. Cis elements detected for the mined genes of the serine threonine domain.
Factor or Site NameSignal SequenceFunctionNumber of Genes
MYCATERD1CATGTGwater-stress responsiveness123
AGCBOXNPGLBAGCCGCCstress signal-response factors32
ASF1MOTIFCAMVTGACGResponse to abiotic and biotic stress123
AUXREPSIAA4KGTCCCATResponse to abiotic and biotic stress16
ATHB1ATCONSENSUSCAATWATTGResponse to abiotic and biotic stress10
ATHB5ATCORECAATNATTGResponse to abiotic and biotic stress10
AUXRETGA1GMGH3TGACGTAAResponse to abiotic and biotic stress3
ACGTATERD1ACGTEarly responsive to dehydration214
CCAATBOX1CCAATPromoter of heat shock protein251
MYBST1GGATAPlant MYB binding site233
MYBPZMCCWACCPlant MYB binding site176
MYBPLANTMACCWAMCPlant MYB binding site79
GCCCOREGCCGCCpathogen-responsive genes65
CPBCSPORTATTAGNADPH-protochlorophyllide reductase127
CCA1ATLHCB1AAMAATCTmyb-related transcription factor24
MYB2CONSENSUSATYAACKGMYB recognition site/dehydration-responsive236
MYBCOREATCYCB1AACGGMyb core/M-phase-specific expression207
MYBGAHVTAACAAAMyb binding site79
LTRECOREATCOR15CCGACLow-temperature-responsive element171
LTRE1HVBLT49CCGAAALow-temperature-responsive element159
LTREATLTI78ACCGACALow-temperature-responsive element30
INRNTPSADBYTCANTYYLight-responsive transcription229
EBOXBNNAPACANNTGLight-responsive and tissue-specific activation 260
GT1COREGGTTAALight-dependent transcriptional activation91
IBOXCOREGATAALight regulation248
IBOXGATAAGLight regulation158
IBOXCORENTGATAAGRLight regulation135
GLMHVCHORDRTGASTCATInvolved in the nitrogen response 10
GMHDLGMVSPBCATTAATTAGInvolved in the nitrogen response 2
TAAAGSTKST1TAAAGGuard cell-specific gene expression254
GT1CONSENSUSGRWAAWGT-1 binding site in many light-regulated genes260
AGATCONSENSUSTTWCCWWWWNNGGWWFunction in flower development3
BOXIIPCCHSACGTGGCEssential for light regulation9
CRTDREHVCBF2GTCGACRegulation of low-temperature responsive genes33
CTRMCAMV35STCTCTCTCTRegulation of low-temperature responsive genes13
ABRELATERD1ACGTGEarly responsive to dehydration157
ABREOSRAB21ACGTSSSCEarly responsive to dehydration3
DRECRTCOREATRCCGACDrought/high-light/cold responsive109
DRE1COREZMRAB17ACCGAGADrought response102
BIHD1OSTGTCADisease resistance responses242
MYB1ATWAACCADehydration-responsive gene236
MYB2ATTAACTGDehydration-responsive gene120
MYB1LEPRGTTAGTTDehydration-responsive gene29
MYB26PSGTTAGGTTDehydration-responsive gene10
CBFHVRYCGACDehydration-responsive element (DRE)179
MYCCONSENSUSATCANNTGDehydration-responsive260
MYBCORECNGTTRDehydration/Water stress258
MYCATRD22CACATGDehydration/Water stress123
MYBATRD22CTAACCADehydration/Water stress19
AGMOTIFNTMYB2AGATCCAADefense-related gene49
CARGATCONSENSUSCCWWWWWWGGComponent of the vernalization (low-temperature) 32
TBOXATGAPBACTTTGChloroplast glyceraldehyde-3-phosphate dehydrogenase(GADPH)187
GATABOXGATAChlorophyll a/b binding protein/light regulations260
CMSRE1IBSPOATGGACGGCarbohydrate Metabolite Signal Responsive Element 118
TCA1MOTIFTCATCTTCTTSalicylic acid/stress induced26
ACGTABREMOTIFA2OSEMACGTGKCABA-responsive expression 27
ABREATCONSENSUSYACGTGGCABA-responsive elements (ABREs) 5
ABRECE1HVA22TGCCACCGGABA-responsive elements (ABREs) 3
ABREATRD22RYACGTGGYRABA-responsive elements (ABREs) 2
ABREBZMRAB28TCCACGTCTCABA-responsive elements (ABREs) 2
ABREDISTBBNNAPAGCCACTTGTCABA-responsive elements (ABREs) 1
WRKY71OSTGACA transcriptional repressor of the gibberellin signaling pathway260
E2F1OSPCNAGCGGGAAAInvolved in transcriptional activation in actively dividing cells and tissue5
DPBFCOREDCDC3ACACNNGAbscisic acid response gene 202
R: G A (puRine); Y: T C (pYrimidine); K: G T (Keto); M: A C (aMino); S: G C (Strong); W: A T (Weak) and N: A G C T (aNy).

