Article

cPKCγ-Modulated Sequential Reactivation of mTOR Inhibited Autophagic Flux in Neurons Exposed to Oxygen Glucose Deprivation/Reperfusion

Department of Neurobiology and Center of Stroke, Beijing Institute for Brain Disorders, Capital Medical University, Beijing 100069, China
*
Author to whom correspondence should be addressed.
Int. J. Mol. Sci. 2018, 19(5), 1380; https://doi.org/10.3390/ijms19051380
Submission received: 26 March 2018 / Revised: 24 April 2018 / Accepted: 3 May 2018 / Published: 6 May 2018

Abstract

:
We have reported that conventional protein kinase Cγ (cPKCγ)-modulated neuron-specific autophagy improved the neurological outcome of mice following ischemic stroke through the Akt-mechanistic target of rapamycin (mTOR) pathway. However, its detailed molecular mechanism remains unclear. In this study, primary cortical neurons from postnatal one-day-old C57BL/6J cPKCγ wild-type (cPKCγ+/+) and knockout (cPKCγ−/−) mice suffering oxygen glucose deprivation/reperfusion (OGD/R) were used to simulate ischemia/reperfusion injury in vitro. A block of autophagic flux was observed in cPKCγ+/+ neurons under OGD/R exposure, characterized by accumulation of p62. Immunofluorescent results showed a decrease in colocalization between LC3 and Atg14 or Stx17 in cPKCγ+/+ neurons when compared with cPKCγ−/− neurons after OGD/R. However, the colocalization between LC3 and Lamp2 was barely decreased, indicating the presence of autolysosomes. The larger lysotracker-positive structures were also significantly increased. These results suggest that cPKCγ-induced inhibition of autophagy occurred at the stages of autophagosome formation, Stx17 anchoring, and the degradation of autolysosomes in particular. In addition, cPKCγ-modulated phosphorylation of mTOR at Ser 2481 was dependent on the site of Ser 2448, which may have blocked autophagic flux. cPKCγ-modulated sequential reactivation of mTOR inhibited autophagic flux in neurons exposed to OGD/R, which may provide endogenous interventional strategies for stroke, especially ischemia/reperfusion injury.

Graphical Abstract

1. Introduction

Given that recombinant tissue plasminogen activator (rtPA) thrombolysis is a recommended form of therapy for acute ischemic stroke, the mechanism of ischemia and ischemia/reperfusion injury has become a popular topic of research. Classical or conventional protein kinase Cγ (cPKCγ) is selectively expressed in neurons of the central nervous system. Studies have demonstrated that cPKCγ or its interaction partners have played a neuroprotective role in hypoxia-ischemia models in vitro and in vivo [1]. In addition, we also found that autophagy is induced in ischemic injury through the Akt-mTOR pathway, while the level of autophagy in cPKCγ wild-type mice is significantly lower than in knockout mice after reperfusion [2]. However, the detailed molecular mechanism underlying cPKCγ-modulated autophagy and their mediated neuroprotection against ischemic injuries remain unclear.
Autophagy (macroautophagy), which is characterized by the formation of double-membrane autophagosomes that fuse with lysosomes, is a conserved lysosome-based pathway that degrades aggregated proteins, damaged organelles, or intracellular pathogens [3]. Autophagic flux is defined as the process of formation and maturation of autolysosomes and degradation of the sequestered cargo. Autophagy is often monitored by means of the autophagy-related marker protein, microtubule-associated protein 1 light chain 3 (LC3) II in mammals [4]. LC3 II labels both phagophores and unclosed autophagosomes [5]; therefore, it may be not accurate to use LC3 II as a surrogate marker for completed autophagosomes in autophagy analysis. Moreover, a growing body of evidence suggests that LC3 also interacts with many non-autophagy-related proteins affecting other cellular pathways, and autophagy can proceed independently of it [5,6]. p62/sequestosome 1 (SQSTM1), which was the first-reported mammalian selective receptor required for aggrephagy, is specifically degraded by autophagy [7,8]. Therefore, the combined study of LC3 conversion and p62 levels can monitor the integrity of autophagic flux and measure autophagy levels.
Numerous researchers have focused on the late stage of autophagy (autolysosome formation and degradation) on the basis of studies which focused on the early stage (autophagy initiation and autophagosome formation) [9,10,11,12]. Studies have shown that, with the occurrence of autophagy, mTOR can be reactivated to induce autophagic lysosome reformation (ALR) and negative feedback inhibition of autophagy under certain conditions [9,13]. In this study, we used oxygen glucose deprivation/reperfusion (OGD/R) treatment of primary cortical neurons to simulate ischemia/reperfusion injury in vitro to understand whether cPKCγ-modulated mTOR activation can block autophagy flux and its possible mechanism.

2. Results

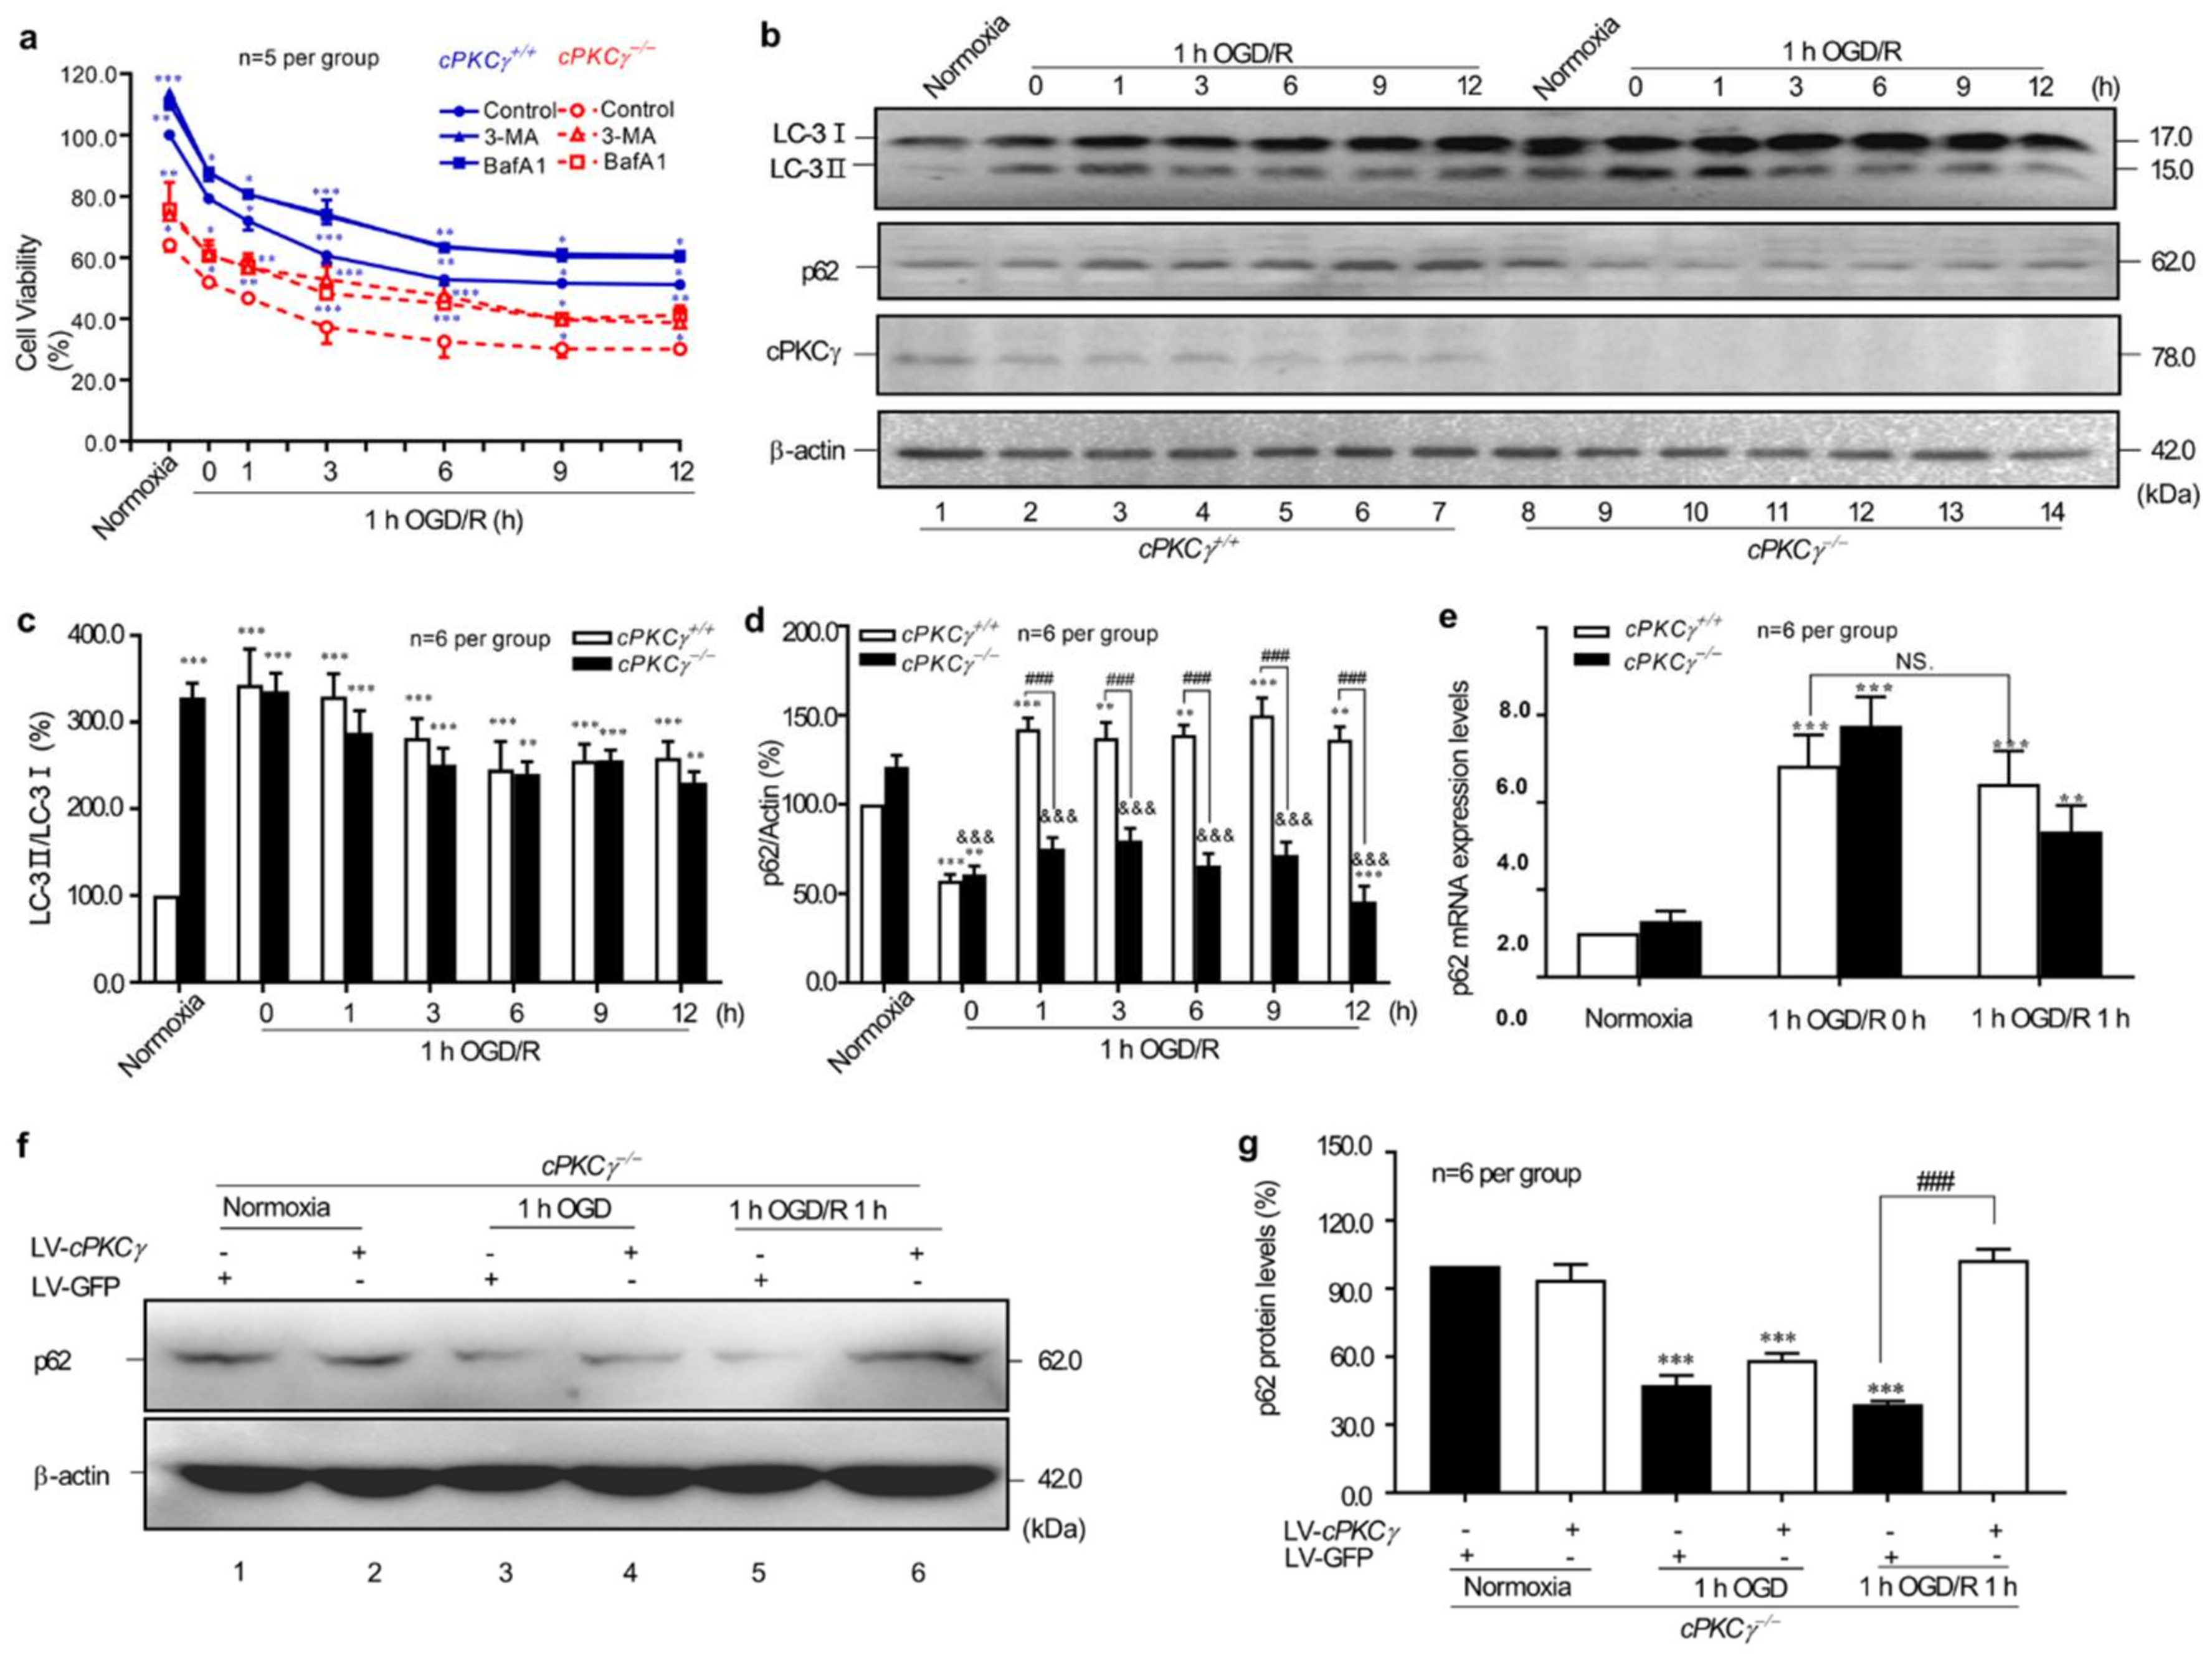
2.1. cPKCγ Gene Knockout Reduces the Survival of Primary Cortical Neurons after 1 h OGD/R 0–12 h Treatments through Excessive Autophagy

As shown in Figure 1a, the viability of primary cortical neurons significantly decreased when compared with that of the baseline (normoxia, serum, and glucose-rich condition) from wild-type (WT, cPKCγ+/+) mice after 1 h OGD/R 0–12 h exposures. In addition, we found that the cPKCγ gene knockout (KO, cPKCγ−/−) could enhance these ischemic injuries of neurons even in the normoxic condition or 1 h OGD/R 0–12 h treatments.
To determine the role of autophagy in neuronal ischemic injury, both autophagy inhibitors 6-Amino-3-methylpurine (3-MA) and Bafilomycin A1 (BafA1) were applied. The results of Figure 1a showed that the neuronal survival rates of both groups were significantly improved under the conditions of normoxia and 1 h OGD/R 1–12 h treatments after 1 h preincubation of 3-MA (5 mM) or BafA1 (100 nM). These results suggested that both autophagy and cPKCγ knockout could enhance neuronal ischemic injuries under OGD/R conditions.

2.2. cPKCγ Partly Blocks Autophagic Flux in Neurons after 1 h OGD/R 0–12 h Treatments

To further validate the effect of cPKCγ on autophagy, the changes of LC3 conversion and p62 expression levels were observed in 1 h OGD/R 0–12 h-treated neurons. In Figure 1b,c, the ratio of LC3 II/LC3 I in cPKCγ−/− neurons was higher than that of cPKCγ+/+ neurons under normoxic condition; in the condition of 1 h OGD/R 0–12 h, the ratio of LC3 II/LC3 I in both groups maintained a high level, and no significant difference in LC3 I cleavage was observed between cPKCγ−/− and cPKCγ+/+ neurons. Unlike the changes of LC3 I cleavage, the p62 expression levels significantly decreased in both groups following 1 h OGD/R 0 h exposure (Figure 1c,d). The p62 expression levels significantly increased in cPKCγ+/+ neurons, but the low levels of p62 were maintained in cPKCγ−/− neurons after 1 h OGD/R 1–12 h treatments. These higher conversion ratios of LC3 I to LC3 II, in combination with the decrease in p62 expression levels, suggested the existence of higher levels of autophagic flux in cPKCγ−/− neurons after 1 h OGD/R 0–12 h treatments.
Interestingly, p62 protein accumulated in cPKCγ+/+ neurons after 1 h OGD/R 1–12 h, but this was not a consequence of higher p62 mRNA expression (Figure 1e). These results supported the hypothesis that it was not an increase in transcription but rather a reduction in degradation through autophagic pathways. In addition, we also found that Lentivirus-based cPKCγ transfection into cPKCγ−/− neurons could reverse the decrease in p62 protein levels after 1 h OGD/R 1 h treatments (Figure 1f,g). Collectively, these results suggest that cPKCγ may inhibit autophagic flux in neurons exposed to 1 h OGD/R 0–12 h.

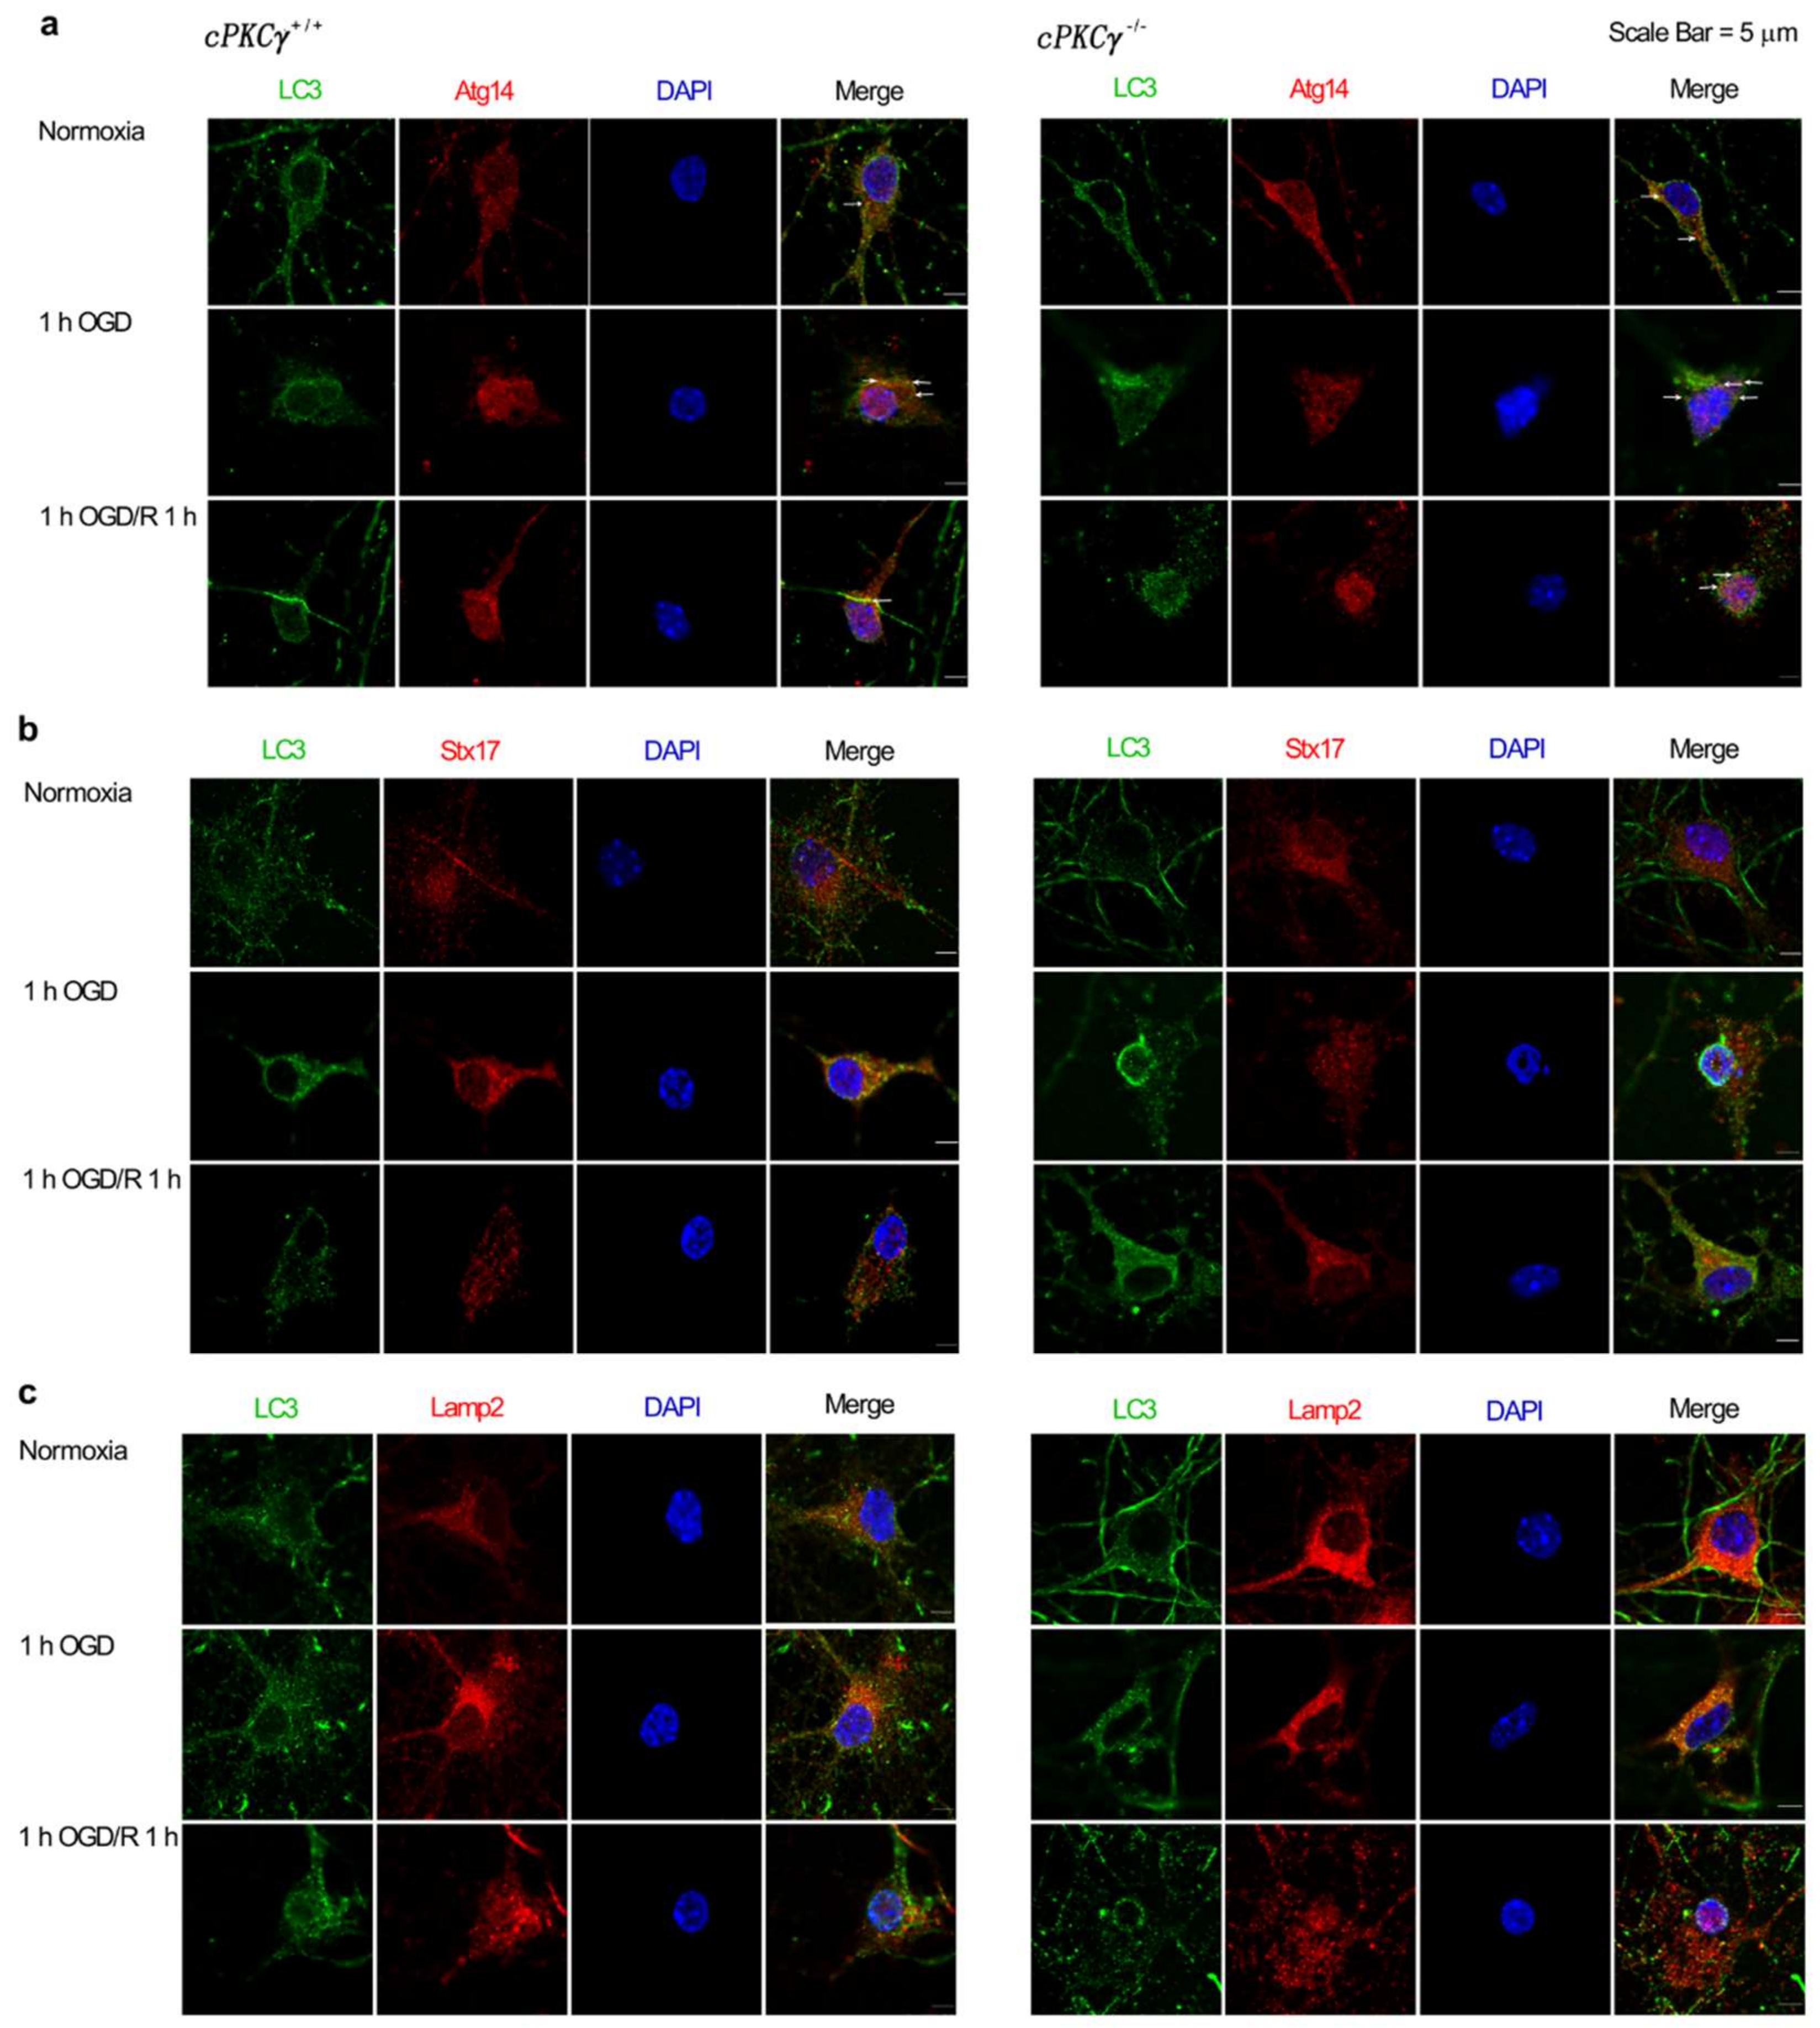
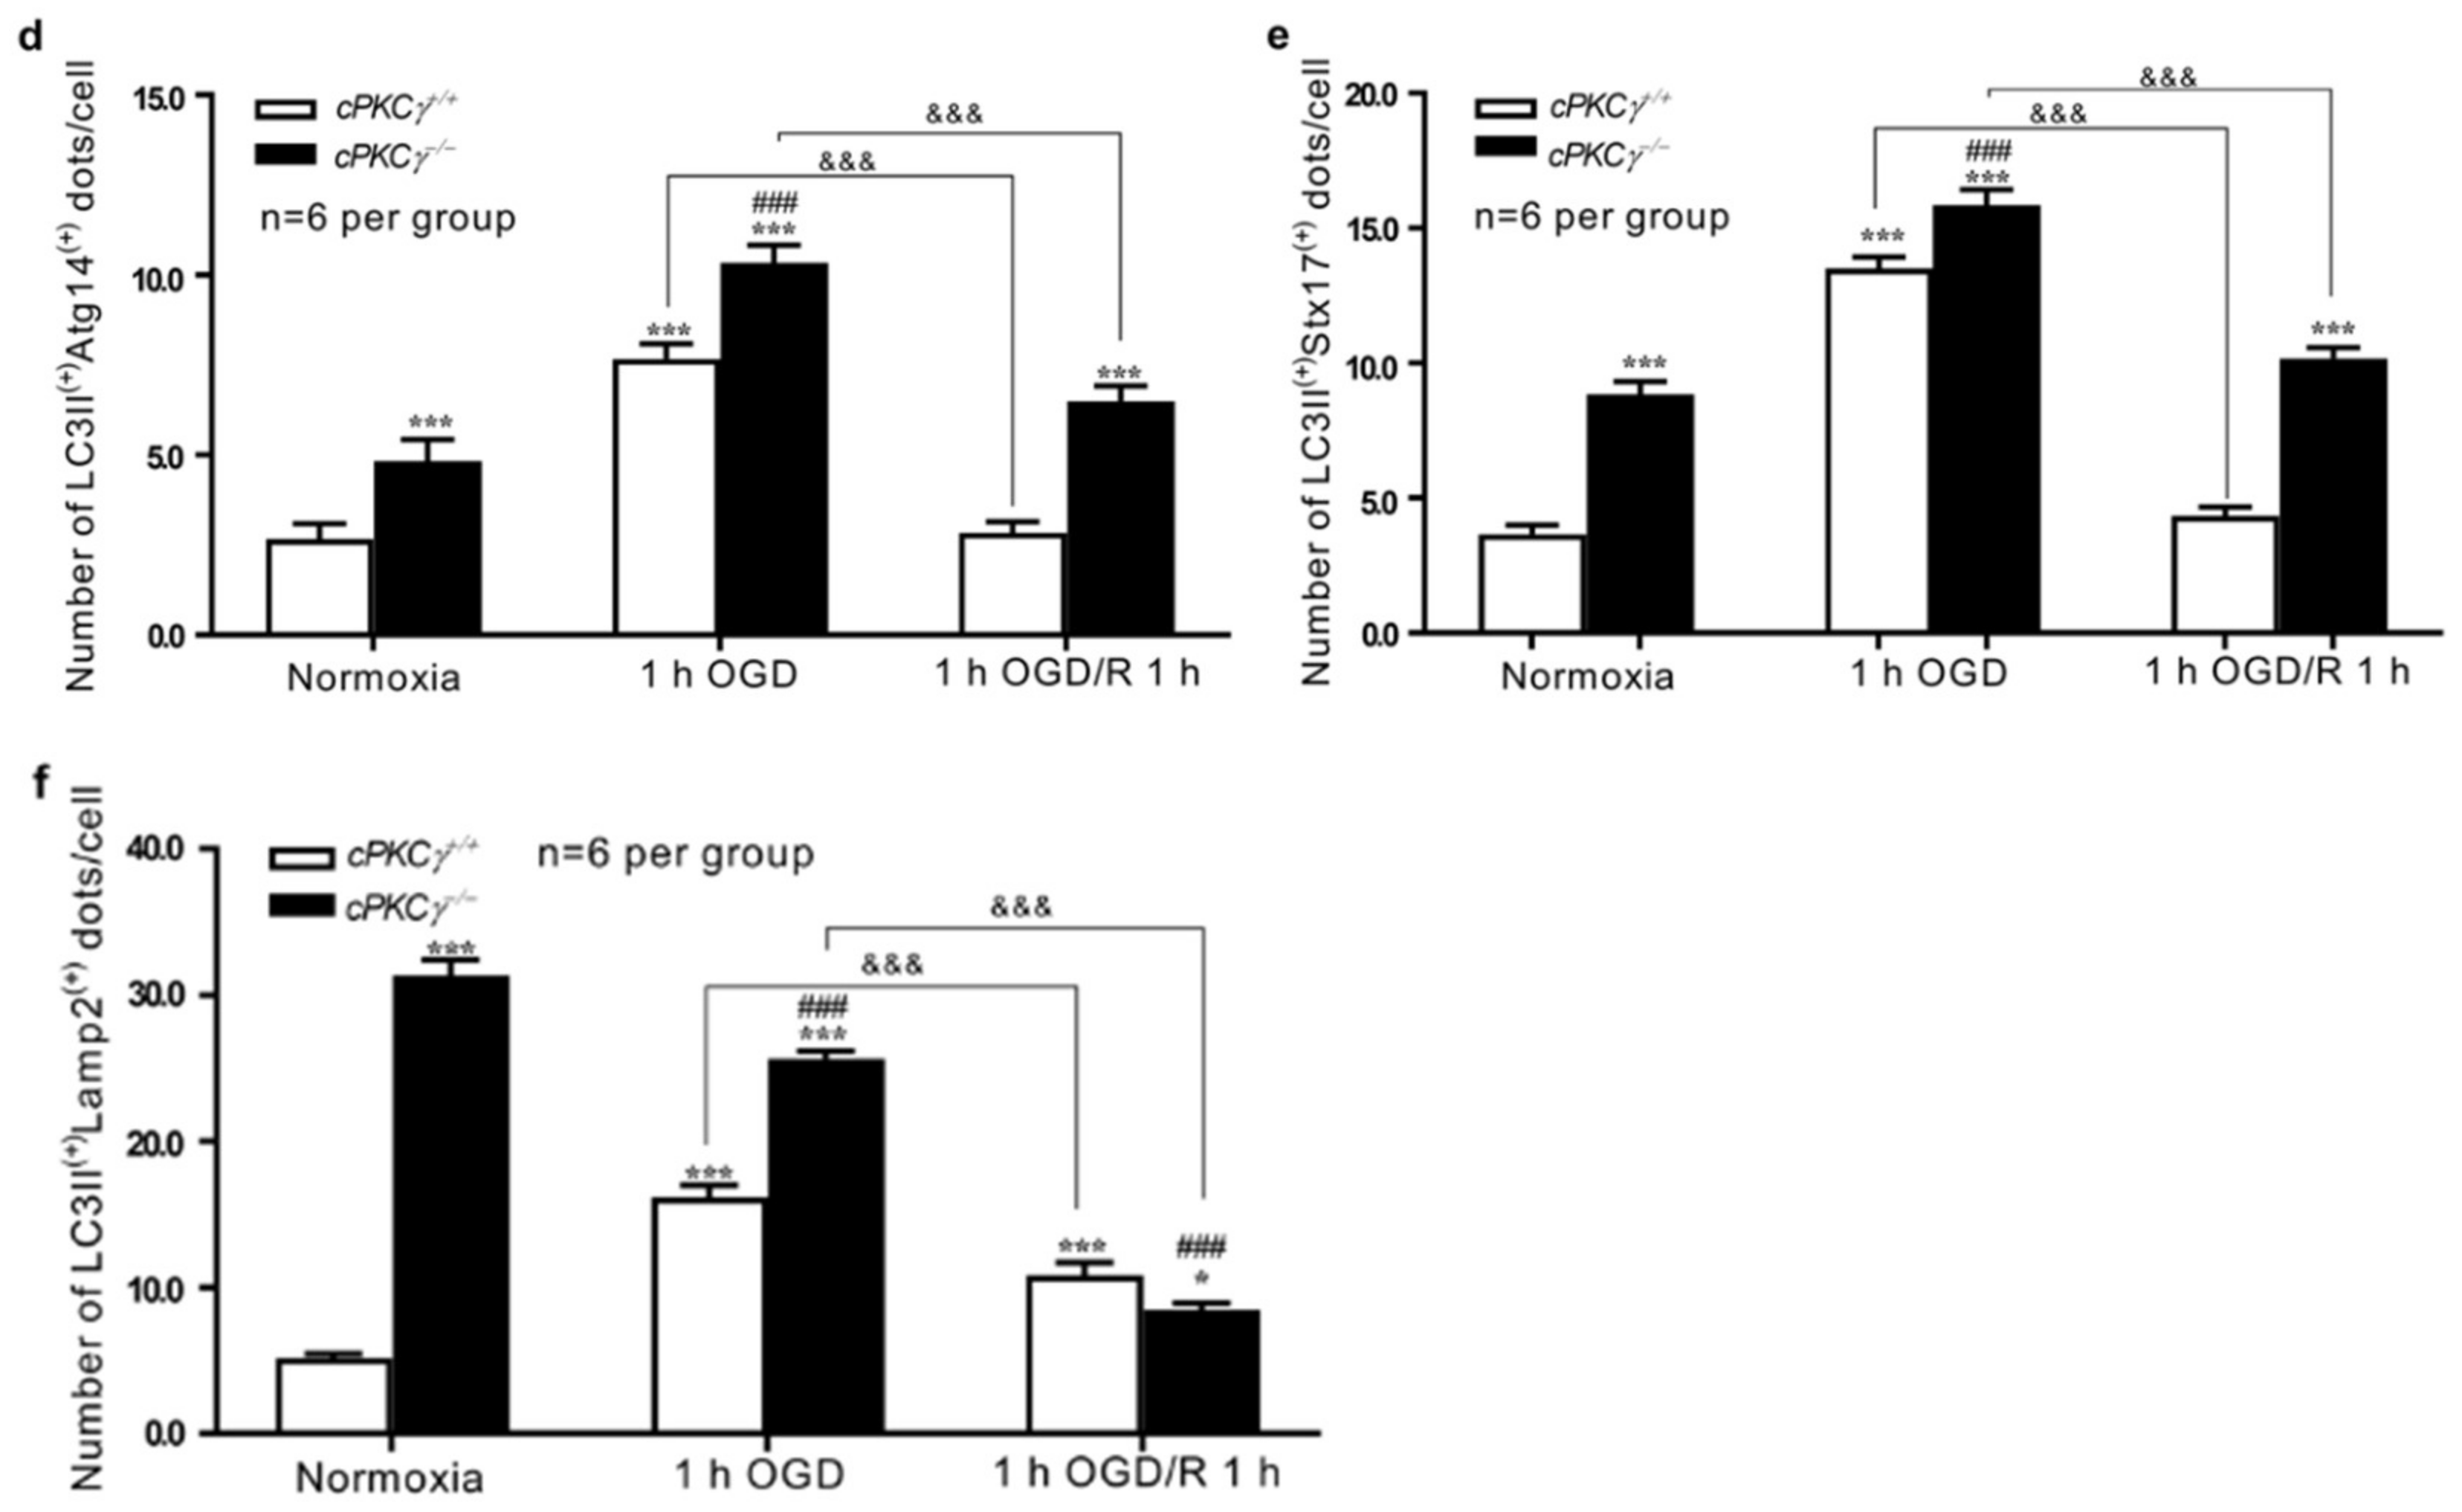
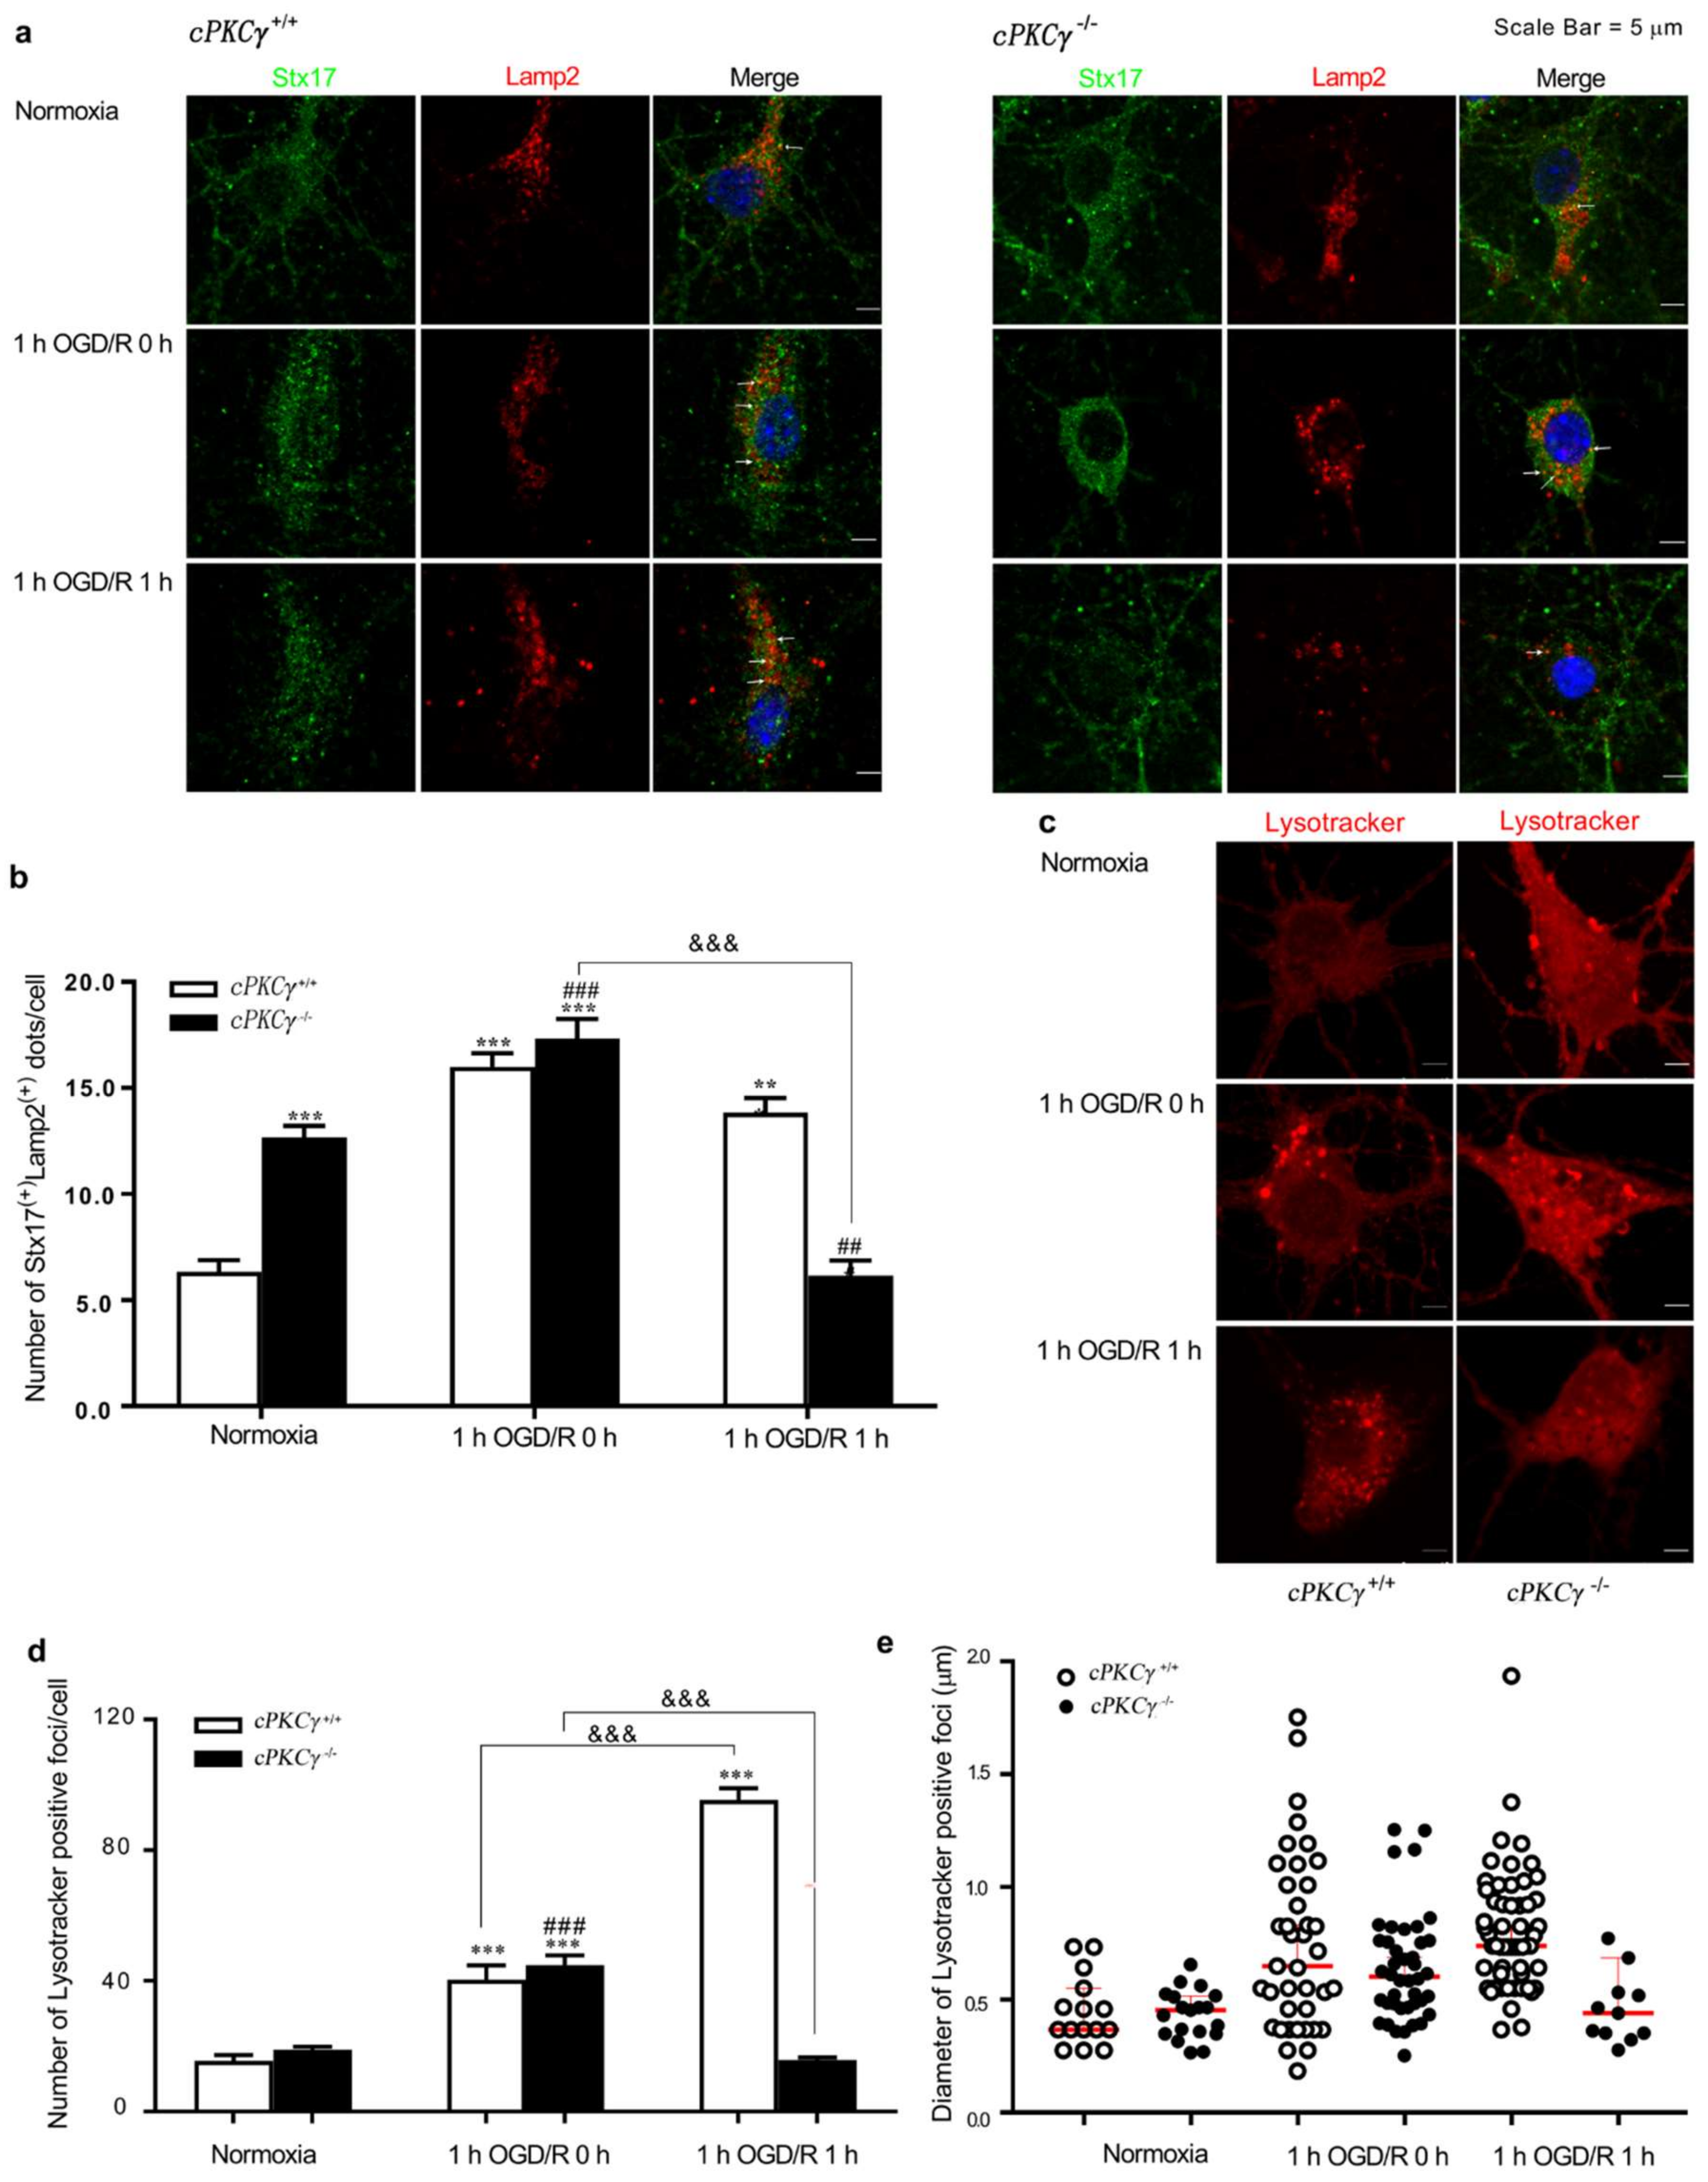
2.3. Effects of cPKCγ on Autolysosome Formation and Degradation in Neurons after 1 h OGD/R 0–1 h Treatments

Autophagy related 14 (Atg14) is an autophagosomal precursor marker. Syntaxin 17(Stx17), contained in soluble N-ethylmaleimide-sensitive factor-attachment protein receptors (SNARE) complex, was required for autophagosome tether and fusion with lysosomes. As a lysosome marker, lysosome-associated membrane protein 2 (Lamp2) will co-localize with LC3 after the formation of autolysosomes. To determine the effect of cPKCγ on autophagosome and autolysosome formations and degradations in 1 h OGD/R 0–1 h-treated neurons, the co-immunofluorescent staining of LC3 with Atg14, Stx17, or Lamp2 was observed. The colocalizations between LC3 and Atg14, Stx17, or Lamp2 were increased in cPKCγ+/+ and cPKCγ−/− neurons after 1 h OGD/R 0 h exposure, indicating higher autophagy levels (Figure 2). However, the colocalizations between LC3 and Atg14 or Stx17 were only reduced in cPKCγ+/+ neurons after 1 h OGD/R 1 h exposure, suggesting the over-activated autophagic flux had been alleviated (Figure 2a,b,d,e). Interestingly, the colocalizations between LC3 and Lamp2 were barely decreased in cPKCγ+/+ neurons exposed to 1 h OGD/R 1 h, indicating the presence of numerous autolysosomes (Figure 2c,f). These results suggested that cPKCγ may inhibit autophagosome formation, Stx17 anchoring, and aberrant autolysosome degradation in neurons after 1 h OGD/R 1 h exposure.
There were also more Lamp2-positive foci that colocalized with Stx17 in cPKCγ+/+ neurons after 1 h OGD/R 1 h exposure compared with normoxic conditions (Figure 3a,b), suggesting the accumulation of autolysosomes. In addition, we found that the number and diameter of lysotracker-positive foci per cell, which were probably acidic autolysosomes, significantly increased in cPKCγ+/+ neurons after 1 h OGD/R 0–1 h treatments when compared with that of normoxic conditions (Figure 3c–e). These results suggest that cPKCγ may be involved in the blocking of autophagic flux, predominantly in autolysosome degradation.

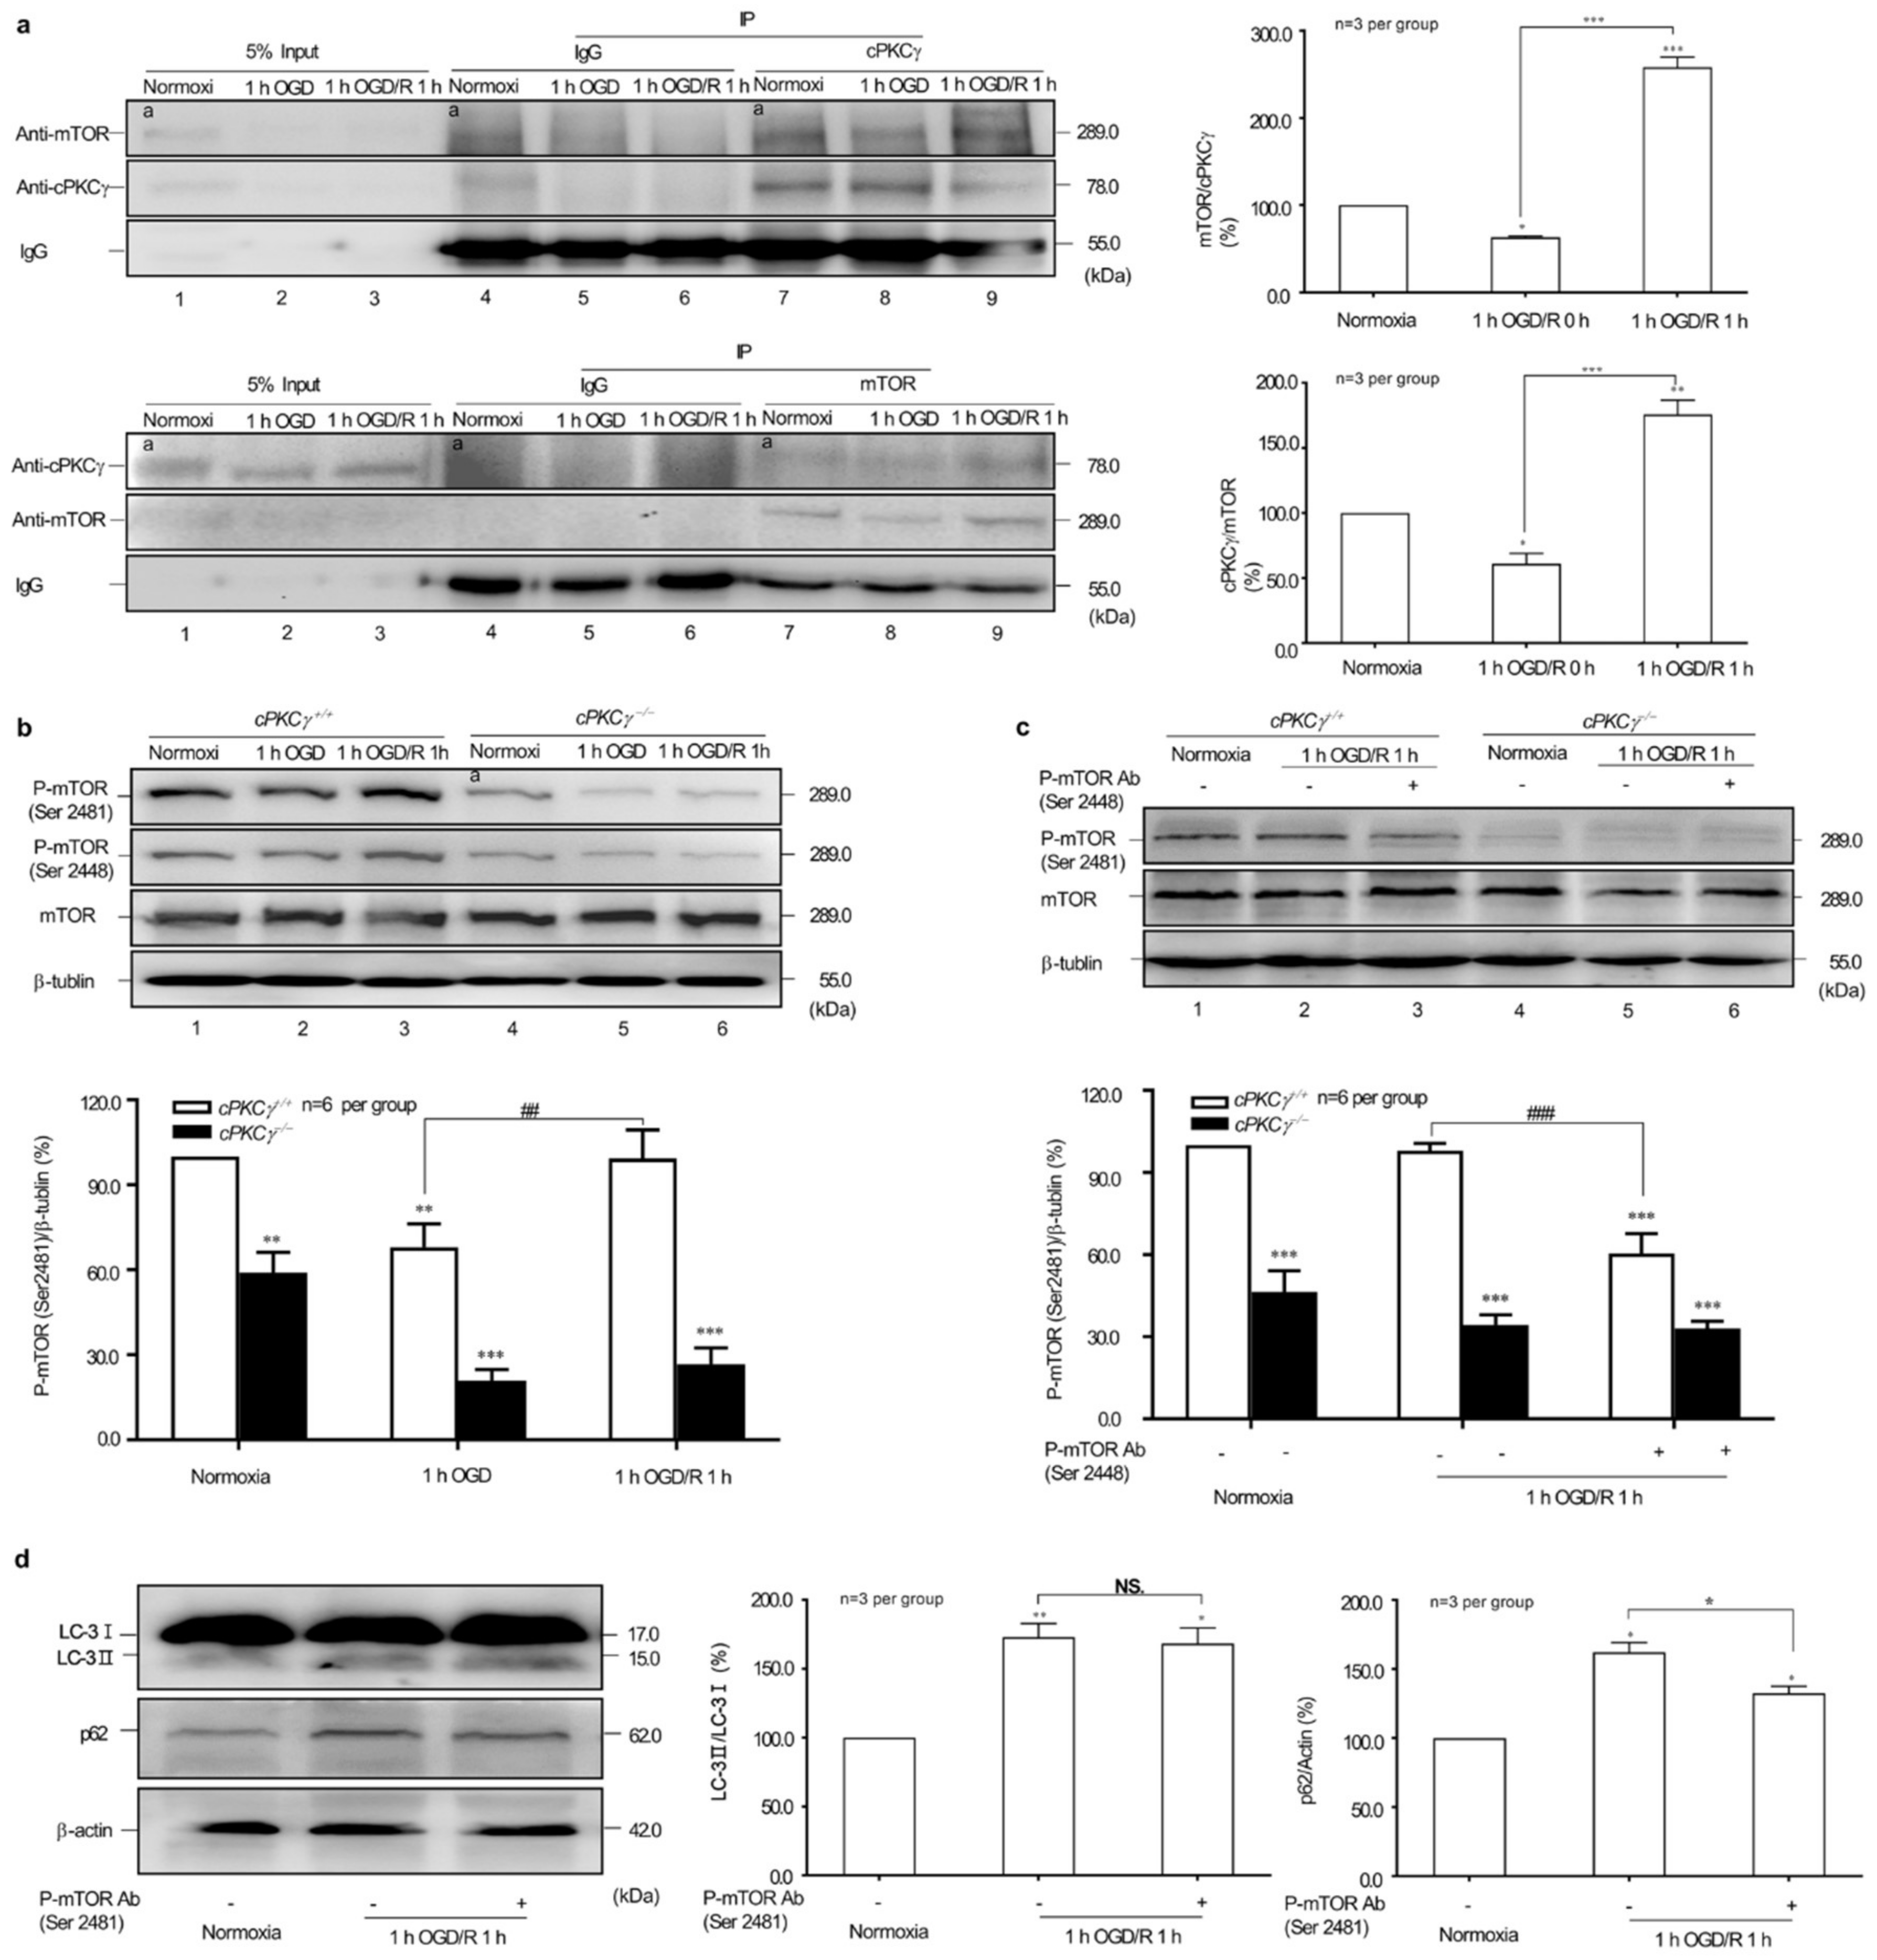
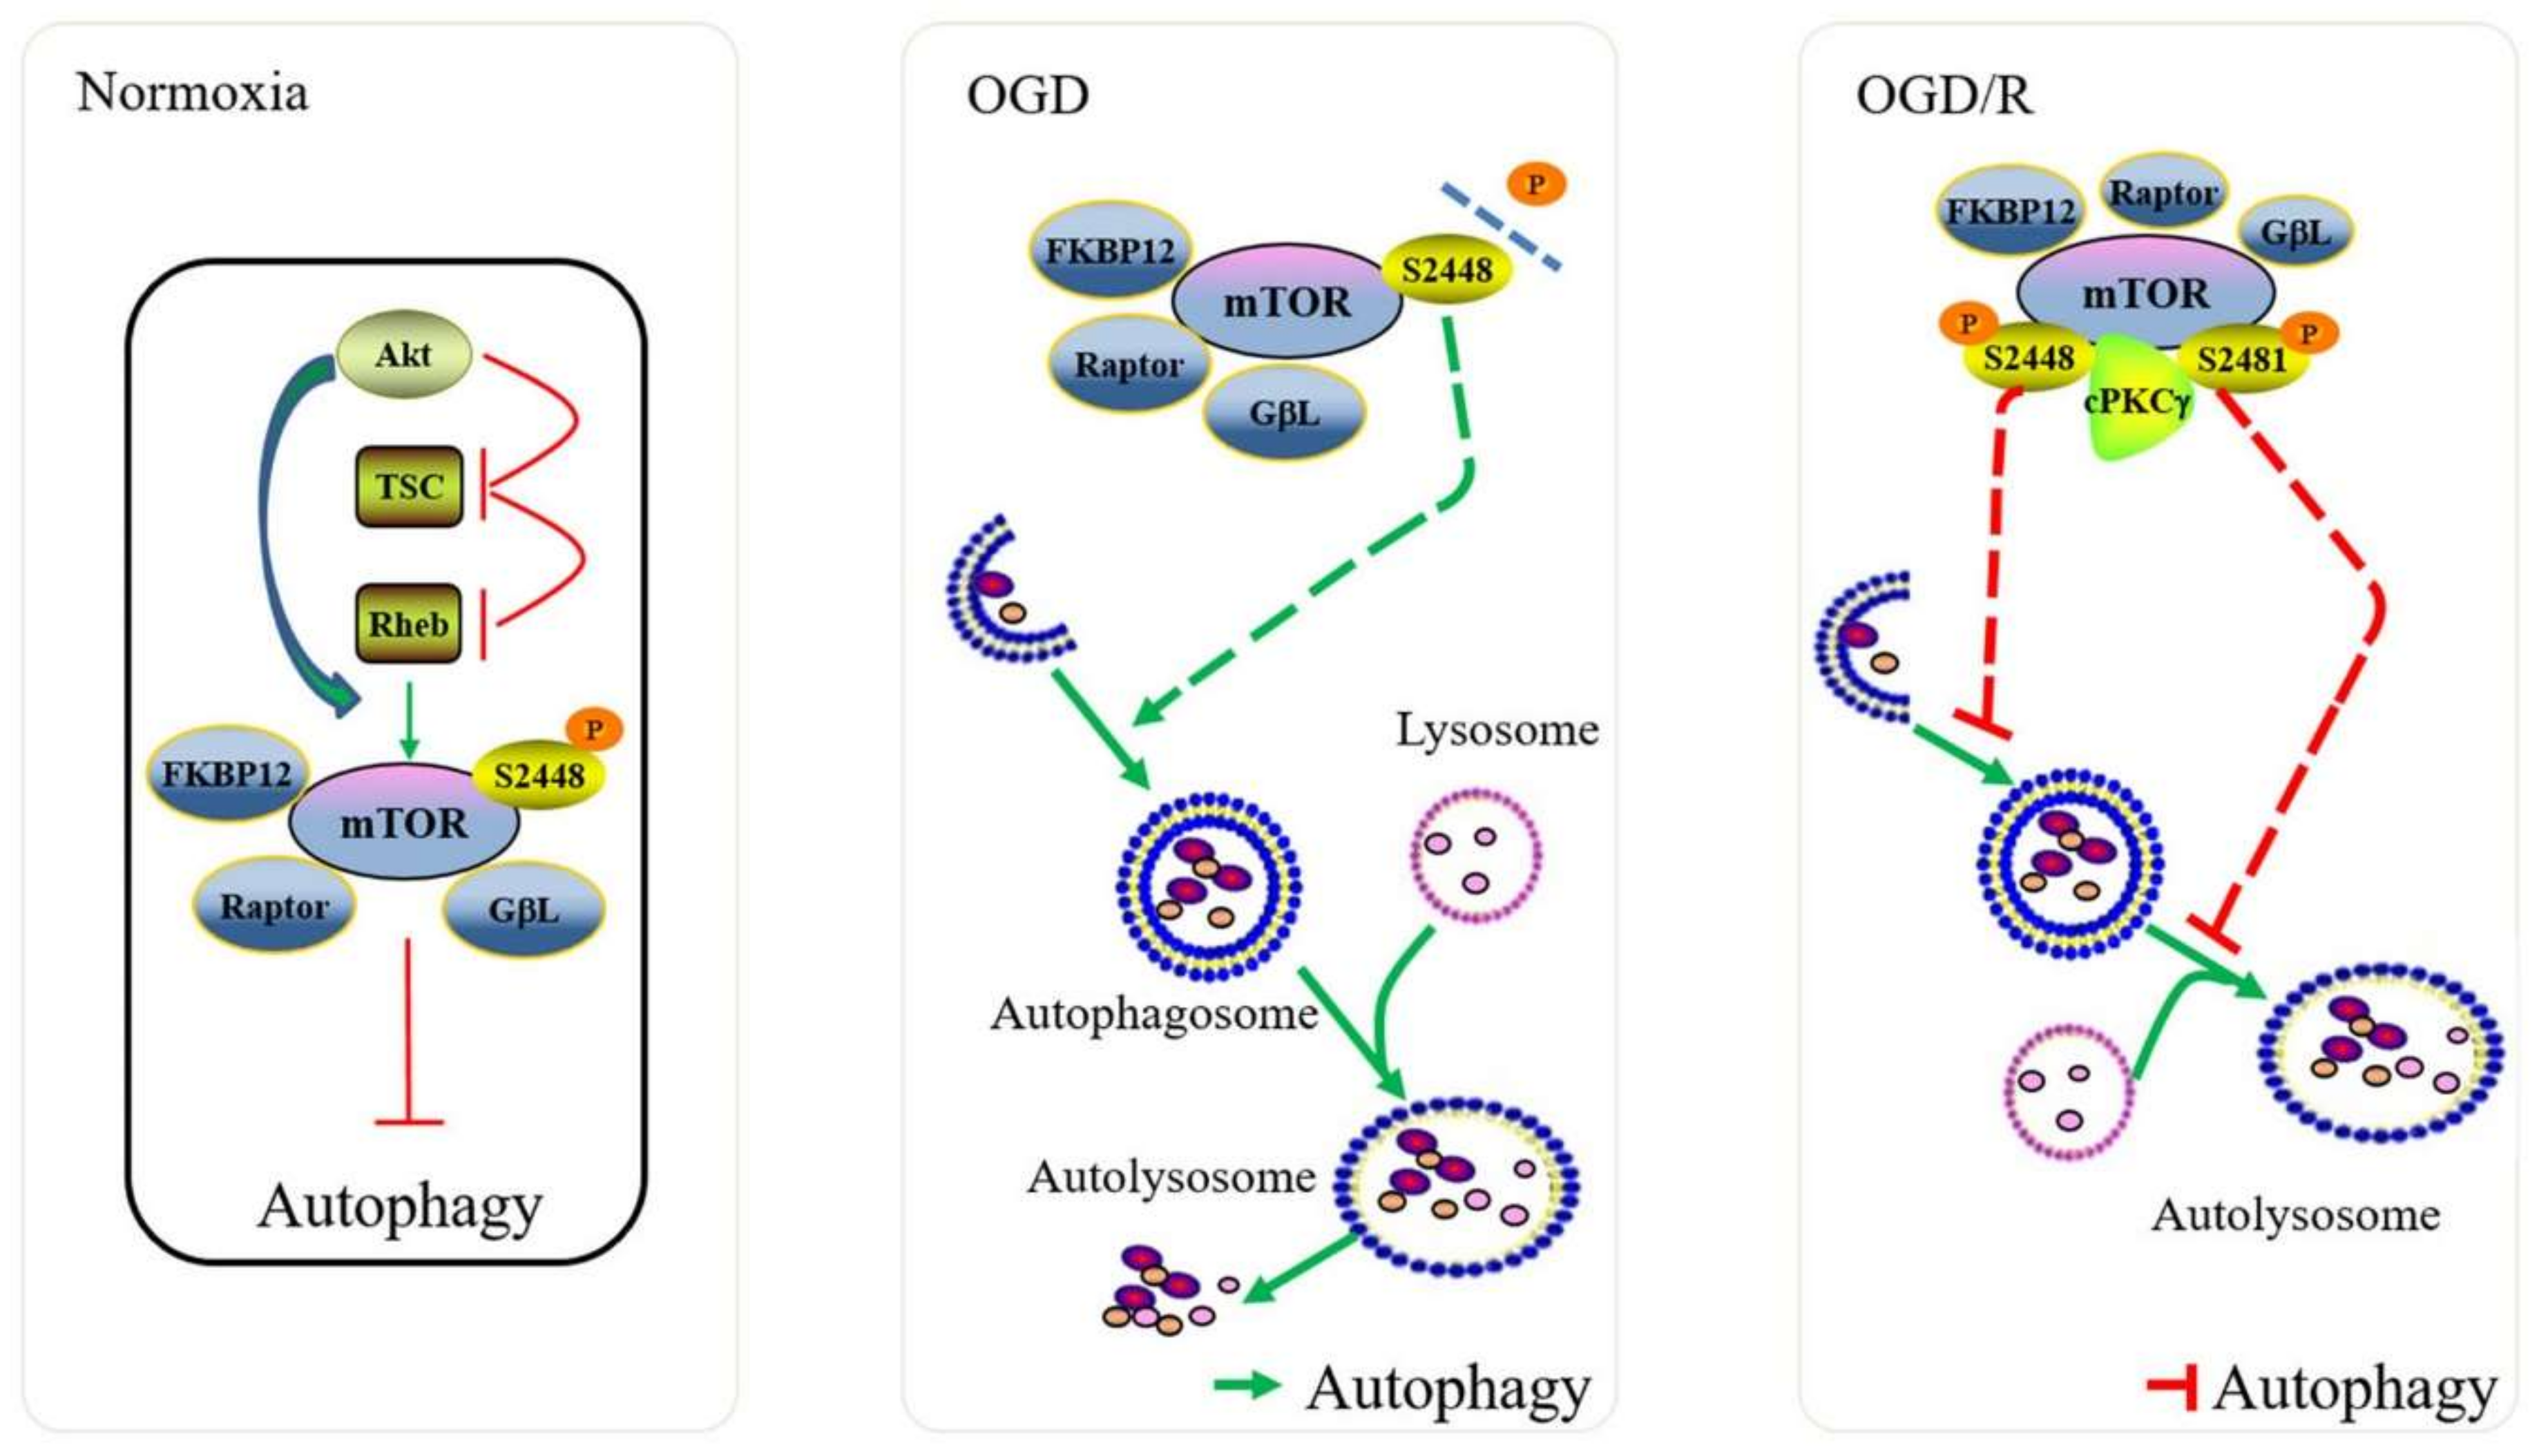
2.4. Effects of cPKCγ on mTOR Reactivation in 1 h OGD/R 1 h-Treated Neurons

To elucidate the possible molecular mechanism of cPKCγ on blocking autophagic flux, the coimmunoprecipitation of cPKCγ with mTOR was first conducted in 1 h OGD/R 0–1 h-treated neurons. cPKCγ and mTOR could reciprocally coimmunoprecipitate in neurons under normoxic and especially 1 h OGD/R 1 h conditions (Figure 4a). These results suggested that there was a specific interaction between cPKCγ and mTOR in neurons.
To determine the essential biological role of cPKCγ in mTOR phosphorylation and reactivation, the phosphorylated status of mTOR at Serine (Ser) 2481 and 2448 sites were observed both in cPKCγ+/+ and cPKCγ−/− neurons. The results showed that the phosphorylation levels of mTOR at Ser 2481 were decreased significantly in cPKCγ−/− neurons when compared with that of cPKCγ+/+ neurons at conditions of normoxia and 1 h OGD/R 0–1 h treatments (Figure 4b). Similar changes in cPKCγ-dependent phosphorylation of mTOR at Ser 2448 were also observed in neurons, suggesting that the reactivation of mTOR was partly dependent on cPKCγ. In addition, we found that the levels of P-mTOR at Ser 2481 decreased significantly in 1 h OGD/R 1 h-treated cPKCγ+/+ (not cPKCγ−/−) neurons by adding antibodies against Ser 2448 site of P-mTOR (Figure 4c). These results suggested that cPKCγ may have modulated the phosphorylation of mTOR Ser 2481 through its effect on the Ser 2448 site in 1 h OGD/R 1 h-treated neurons.
To explore the effect of phosphorylated mTOR at Ser 2481 on autophagy, we monitored the LC3II/LC3I ratio and the p62 protein levels in neurons after Ser 2481 P-mTOR antibody neutralization treatment. The p62 accumulation in 1 h OGD/R 1 h-treated neurons was reversed by adding antibodies against Ser 2481 site of P-mTOR (Figure 4c). Combined with the similar LC3II/LC3I ratio, we can conclude that the phosphorylation of mTOR Ser 2481 may contribute to the impairment of autophagic flux.

3. Discussion

Autophagy is a double-edged sword in the process of death of nervous system cells [14,15,16]. Basal autophagy is particularly important for the removal of excess proteins in neurons that have no dividing properties, but the abnormal basal autophagy was linked to neurodegenerative diseases [17]. We have reported that a low level of autophagy was maintained in neurons of cPKCγ+/+ mice at baseline and a higher level of autophagy in neurons of cPKCγ−/− mice [2]. In this study, we further found that the LC3 conversion in cPKCγ−/− neurons was higher than that in cPKCγ+/+ neurons, and the phosphorylation level of mTOR at Ser 2481, as the auto-phosphorylation site described above, was lower than that of wild-type under the conditions of normoxia and 1 h OGD/R 0–1 h treatments. The p62 accumulation was associated with autophagy inhibition (reduction of autophagosome formation and restriction of autolysosome degradation) in cPKCγ+/+ neurons after 1 h OGD/R 1 h treatments. The inhibition of autophagic flux was attenuated with lower phosphorylation levels of mTOR at Ser 2481 in cPKCγ−/− neurons after 1 h OGD/R 1 h. In addition, we found that cPKCγ could reciprocally coimmunoprecipitate with mTOR, especially under conditions of 1 h OGD/R 1 h. The phosphorylation levels of mTOR at Ser 2481 were affected by the neutralization of antibody against P-Ser 2448 mTOR. These results suggest that cPKCγ-modulated mTOR phosphorylation and reactivation might be involved in blocking autophagic flux during 1 h OGD/R 1 h treatments.
mTOR forms the catalytic subunit of two structurally and functionally distinct complexes classified as the mTOR complex (mTORC) 1 and mTORC2 [18]. Studies have shown that initiation of autophagy is controlled by the ULK1-Atg13-FIP200 complex, which is inhibited by mTOR kinase under nutrient replete conditions [19]. mTOR phosphorylation and reactivation can inhibit autophagy. In this study, the colocalization of LC3 with Atg14 or Stx17 was reduced in cPKCγ+/+ neurons after 1 h OGD/R 1 h treatments, suggesting the involvement of cPKCγ in regulating autophagosome formation and its subsequent steps.
In recent years, several researchers have focused on the following aspect about mTOR in autophagy: mTOR may be re-phosphorylated and inhibit autophagy after prolonged nutrient starvation or reperfusion but is dependent on amino acids [13,20]. The reoxygenation and nutrient-rich conditions in our study may give sufficient exogenous amino acids to cells for activating mTOR. The reactivated mTOR attenuated autophagy and directly triggered ALR [9]. Interestingly, proto-lysosome budding from autolysosomes in ALR only contained autolysosomal membrane components and lacked components from autophagosomes [9]. In this study, p62 protein accumulated, and the number of acidified vesicle structures whose diameters were significantly larger than baseline recordings were increased in neurons after 1 h OGD/R 1 h injury. Therefore, we speculate that, as the ALR process occurs in OGD/R, p62 protein may remain in the autolysosomes pre- or post-budding rather than being quickly degraded by hydrolysis. Further investigation is required to better understand the fate of the proteins that escape from enzymatic hydrolysis of the autolysosome.
In summary, cPKCγ participates in the inhibition of autophagic flux in neurons after 1 h OGD/R 1 h treatment, which is characterized by p62 accumulation, reduction of autophagosome formation, or restriction of autolysosome degradation. One possible mechanism involves cPKCγ-mediated phosphorylation of mTOR at Ser 2481, dependent on Ser 2448, that triggers mTOR reactivation following inhibition of autophagy (Figure 5). The specific mechanisms of cPKCγ-dependent mTOR reactivation and its effects on blocking autophagic flux predominantly in the mature autolysosome phase merits additional study. Understanding the regulation of cPKCγ on autophagic flux may reveal a new horizon in PKC study and may eventually provide endogenous interventional strategies for stroke, especially ischemia/reperfusion injury.

4. Materials and Methods

All animal procedures were performed in strict accordance with the recommendations in the Guide for the Care and Use of Laboratory Animals of the National Institutes of Health. All experimental protocols were approved by experimental animal ethics committee of Capital Medical University (AEEI-2014-114; 4 December 2014).

4.1. Cell Culture and Transfection

The primary cortical neurons were prepared from wild-type and transgenic (genotype cPKCγ−/−) C57BL/6J mice. The postnatal <24 h mice were disinfected with methanol and decapitated promptly. The cortex was separated, cut into small pieces of 0.2 cm3, and cultured in Dulbecco’s Modified Eagle Medium (G11995500BT, Gibco, Beijing, China), which contained 10% horse serum (16050-122, Gibco, Grand Island, NY, USA), 10% fetal bovine serum (10099-141, Gibco, Grand Island, USA), 1% penicillin-streptomycin solution (15070063, Life Technologies, Carlsbad, ON, Canada), and 0.25% l-glutamine (25030-081, Gibco, Grand Island, USA) for 4 h. Subsequently, the neurons were cultured in Neurobasal Medium (21103-040, Gibco, Grand Island, USA) containing 2% B27 supplement (17504-044, Gibco, Grand Island, USA) that was changed completely every 72 h. Cell transfection was performed using lentiviral vectors containing cPKCγ gene (Genepharma, Suzhou, China), according to protocols provided by the manufacturer.

4.2. Oxygen Glucose Deprivation/Reperfusion (OGD/R) of Primary Cortical Neurons

The OGD/R model was used to simulate ischemia/reperfusion injury in vitro. As described above, a portion of the neurons cultured for eight days were subjected to OGD/R [21]. The terms of OGD treatment were glucose-free DMEM (11966-025, Gibco, Grand Island, USA) and 5% CO2/2% O2/93% N2 for 1 h. The terms of reperfusion treatment were Neurobasal Medium, which contained 2% B27 supplement and 5% CO2/21% O2/74% N2 for 1, 3, 6, 9, or 12 h, respectively.

4.3. Antibodies

Anti-Atg14 (5504S, Cell Signaling, Danvers, MA, USA), Anti-LAMP2 (PRS3627, Sigma-Aldrich, St. Louis, MO, USA), Anti-LAMP2 (ab13524, Abcam, Cambridge, UK), Anti-LC3 (SAB1305552, Sigma-Aldrich), Anti-LC3 (66139-1-lg, Proteintech, Rosemont, IL, USA), Anti-mTOR (#2972, Cell Signaling), Anti-Phospho-mTOR (Ser2481) (#2974S, Cell Signaling), Anti-Phospho-mTOR (Ser2448) (#5536, Cell Signaling), Anti-p62 (ab155686, Abcam), Anti-STX17 (HPA001204, Sigma-Aldrich).

4.4. Cell Viability Test

The survival rate of primary cortical neurons was detected by CellTiter 96 Aqueous One Solution Cell Proliferation Assay (G3580, Promega, Madison, WI, USA) according to the manufacturer’s instructions.

4.5. Immunoprecipitation Assays

Whole cell lysates used for immunoprecipitation were prepared in IP buffer A (50 mM Tris-HCl (pH 7.5), 2 mM EDTA, 2 mM EGTA, 1 mM DTT, 50 mM KF, 5 M iodoacetamide, and a protease inhibitor mixture( and then incubated with specific or IgG antibody at 4 °C overnight. Washed Protein G beads and the lysates were transferred into a spin column from Protein G Immunoprecipitation Kit (1002008482, Sigma-Aldrich, St. Louis, MO, USA) and incubated at 4 °C overnight. The buffer (48 L Glycine, 2 L Tris-HCl (pH 8.0), 10 L loading buffer) was added to the beads and centrifuged. The flow-through was collected and heated at 95 °C for 5 min and processed for immunoblotting.

4.6. Immunofluorescence

Cells were fixed using 4% paraformaldehyde for 30 min at 25 °C, washed four times with PBS, and then blocked with buffer (8% goat serum + 0.2% Triton X100 (101875278, Sigma-Aldrich, St. Louis, MO, USA) in PBS) for 90 min at 37 °C. Cells were stained using desired antibodies at 4 °C overnight, washed with PBS, incubated with secondary antibodies for 1 h, and then mounted using ProLong Gold antifade Mountant with DAPI (P36934, Life Technologies, Carlsbad, ON, Canada). Lysotracker red DND-99 (L7528, Invitrogen, Eugene, OR, USA; 50 nM added for 30 min before fixation) were used to stain the acid structure, especially lysosomes for detection by confocal microscopy at 577/590 nm (Excitation/Emission). Cells were imaged using a Leica SP8 microscope with 63 × 1.4 Numerical Aperture (NA) oil objective lens (Leica, Wetzlar, Germany).

4.7. RNA Extraction and Real-Time Quantitative PCR

The neurons were disrupted in QIAzol Lysis Reagent (1023537, Qiagen, Hiden, Germany), and total RNA was extracted and quantified using the RNeasy Lipid Tissue Mini Kit (1023539, Qiagen, Hiden, Germany). RNA was reverse transcribed into cDNA by using Transcriptor First Strand cDNA Synthesis Kit (04896866001, Roche Life Sciences, Indianapolis, IN, USA). The following primers were used: p62 forward 5′-TGTGGAACATGGAGGGAAGAG-3′, p62 reverse 5′-TGTGCCTGTGCTGGAACTTTC-3′, ywhaz (as control) forward 5′-GAAGACGGAAGGTGCTGAG-3′, ywhaz reverse 5′-GACTTTGCTTTCTGGTTGC-3′. Real-time quantitative PCR was performed in a 20 μL reaction volume (1 μg cDNA, 1 μL primer, 10 μL Power SYBER Green PCR Master Mix (Life Technologies, Warrington, UK)), and 8 μL RNA-free water on the Applied Biosystems 7500 fast real-time PCR system (Life Technologies, Foster City, CA, USA). Triplicate reactions were performed for each sample and data were analyzed using delta-delta method (ratio, 2−(ΔCT sample − ΔCT control)) to compare relative mRNA levels. Real-time quantitative PCR cycling conditions were as follows: denaturation at 50 °C for 2 min and 95 °C for 10 min, followed by 40 cycles at 95 °C for 15 s, annealing/extension at 60 °C for 1 min.

4.8. Immunoblotting

Whole cell lysates used for immunoblotting were prepared in buffer (50 mM Tris-HCl (pH 7.5), 2 mM EDTA, 2 mM EGTA, 1 mM DTT, 50 mM KF, 2% SDS, and a protease inhibitor mixture) on ice and subjected to sodium dodecyl sulfate polyacrylamide gel electrophoresis (SDS-PAGE). The blots were blocked in 5% milk (Skim milk powder, LP0031, Oxiod, Hampshire, UK), incubated with primary antibody for 1–24 h. Membranes were washed three times for 10 min with TBS-0.05% Tween (pH 7.5), incubated with secondary antibodies for 1 h, washed again, and imaged by using Fusion-Capt Advance software on FUSION FX (Vilber Lourmat, Collégien, France).

4.9. Statistical Analysis

Data were expressed as mean ± SEM. Statistical analysis was performed using two-way analysis of variance (ANOVA), followed by the Bonferroni multiple comparison test with the software GraphPad Prism version 7.00 (GraphPad Software, La Jolla, CA, USA). A value of p < 0.05 was considered statistically significant.

Author Contributions

J.L. conceived and designed the experiments; R.H. performed the experiments and wrote the paper; S.H., N.Z., Q.D., and T.L. analyzed the data.

Acknowledgments

This work was supported by the National Natural Science Foundation of China (31771292, 31571162, 31471142 and 31671205) and grants from the Beijing Natural Science Foundation (7141001).

Conflicts of Interest

The authors declare no conflict of interest.

Abbreviations

cPKCγConventional Protein Kinase Cγ
rtPArecombinant tissue Plasminogen Activator
LC3Microtubule-associated Protein 1 Light Chain 3
MCAO/RMiddle Cerebral Artery Occlusion/Reperfusion
mTORMechanistic Target of Rapamycin
OGD/ROxygen Glucose Deprivation/Reperfusion
SQSTM1Sequestosome 1
ALRAutophagic Lysosome Reformation
BafA1Bafilomycin A1
3-MA6-Amino-3-methylpurine

References

  1. Zhang, N.; Yin, Y.; Han, S.; Jiang, J.; Yang, W.; Bu, X.; Li, J. Hypoxic preconditioning induced neuroprotection against cerebral ischemic injuries and its cpkcgamma-mediated molecular mechanism. Neurochem. Int. 2011, 58, 684–692. [Google Scholar] [CrossRef] [PubMed]
  2. Wei, H.; Li, Y.; Han, S.; Liu, S.; Zhang, N.; Zhao, L.; Li, S.; Li, J. Cpkcgamma-modulated autophagy in neurons alleviates ischemic injury in brain of mice with ischemic stroke through akt-mtor pathway. Transl. Stroke Res. 2016, 7, 497–511. [Google Scholar] [CrossRef] [PubMed]
  3. Klionsky, D.J.; Codogno, P.; Cuervo, A.M.; Deretic, V.; Elazar, Z.; Fueyo-Margareto, J.; Gewirtz, D.A.; Kroemer, G.; Levine, B.; Mizushima, N.; et al. A comprehensive glossary of autophagy-related molecules and processes. Autophagy 2010, 6, 438–448. [Google Scholar] [CrossRef] [PubMed]
  4. Yoshii, S.R.; Mizushima, N. Monitoring and measuring autophagy. Int. J. Mol. Sci. 2017, 18. [Google Scholar] [CrossRef] [PubMed]
  5. Boya, P.; Reggiori, F.; Codogno, P. Emerging regulation and functions of autophagy. Nat. Cell Biol. 2013, 15, 713–720. [Google Scholar] [CrossRef] [PubMed]
  6. Subramani, S.; Malhotra, V. Non-autophagic roles of autophagy-related proteins. EMBO Rep. 2013, 14, 143–151. [Google Scholar] [CrossRef] [PubMed]
  7. Pankiv, S.; Clausen, T.H.; Lamark, T.; Brech, A.; Bruun, J.A.; Outzen, H.; Overvatn, A.; Bjorkoy, G.; Johansen, T. P62/sqstm1 binds directly to atg8/lc3 to facilitate degradation of ubiquitinated protein aggregates by autophagy. J. Biol. Chem. 2007, 282, 24131–24145. [Google Scholar] [CrossRef] [PubMed]
  8. Rogov, V.; Dotsch, V.; Johansen, T.; Kirkin, V. Interactions between autophagy receptors and ubiquitin-like proteins form the molecular basis for selective autophagy. Mol. Cell 2014, 53, 167–178. [Google Scholar] [CrossRef] [PubMed]
  9. Yu, L.; McPhee, C.K.; Zheng, L.; Mardones, G.A.; Rong, Y.; Peng, J.; Mi, N.; Zhao, Y.; Liu, Z.; Wan, F.; et al. Termination of autophagy and reformation of lysosomes regulated by mtor. Nature 2010, 465, 942–946. [Google Scholar] [CrossRef] [PubMed]
  10. Diao, J.; Liu, R.; Rong, Y.; Zhao, M.; Zhang, J.; Lai, Y.; Zhou, Q.; Wilz, L.M.; Li, J.; Vivona, S.; et al. Atg14 promotes membrane tethering and fusion of autophagosomes to endolysosomes. Nature 2015, 520, 563–566. [Google Scholar] [CrossRef] [PubMed]
  11. Wartosch, L.; Gunesdogan, U.; Graham, S.C.; Luzio, J.P. Recruitment of vps33a to hops by vps16 is required for lysosome fusion with endosomes and autophagosomes. Traffic 2015, 16, 727–742. [Google Scholar] [CrossRef] [PubMed]
  12. Zhen, Y.; Li, W. Impairment of autophagosome-lysosome fusion in the buff mutant mice with the vps33a(d251e) mutation. Autophagy 2015, 11, 1608–1622. [Google Scholar] [CrossRef] [PubMed]
  13. Efeyan, A.; Zoncu, R.; Chang, S.; Gumper, I.; Snitkin, H.; Wolfson, R.L.; Kirak, O.; Sabatini, D.D.; Sabatini, D.M. Regulation of mtorc1 by the rag gtpases is necessary for neonatal autophagy and survival. Nature 2013, 493, 679–683. [Google Scholar] [CrossRef] [PubMed]
  14. Clarke, P.G.; Puyal, J. Autophagic cell death exists. Autophagy 2012, 8, 867–869. [Google Scholar] [CrossRef] [PubMed]
  15. Wang, C.; Liu, C.; Gao, K.; Zhao, H.; Zhou, Z.; Shen, Z.; Guo, Y.; Li, Z.; Yao, T.; Mei, X. Metformin preconditioning provide neuroprotection through enhancement of autophagy and suppression of inflammation and apoptosis after spinal cord injury. Biochem. Biophys. Res. Commun. 2016, 477, 534–540. [Google Scholar] [CrossRef] [PubMed]
  16. Kim, M.; Ho, A.; Lee, J.H. Autophagy and human neurodegenerative diseases—A fly’s perspective. Int. J. Mol. Sci. 2017, 18. [Google Scholar] [CrossRef]
  17. Tammineni, P.; Cai, Q. Defective retrograde transport impairs autophagic clearance in alzheimer disease neurons. Autophagy 2017, 982–984. [Google Scholar] [CrossRef] [PubMed]
  18. Aylett, C.H.; Sauer, E.; Imseng, S.; Boehringer, D.; Hall, M.N.; Ban, N.; Maier, T. Architecture of human mtor complex 1. Science 2016, 351, 48–52. [Google Scholar] [CrossRef] [PubMed]
  19. Zachari, M.; Ganley, I.G. The mammalian ulk1 complex and autophagy initiation. Essays Biochem. 2017, 61, 585–596. [Google Scholar] [CrossRef] [PubMed]
  20. Chen, Y.; Yu, L. Autophagic lysosome reformation. Exp. Cell Res. 2013, 319, 142–146. [Google Scholar] [CrossRef] [PubMed]
  21. Papadakis, M.; Hadley, G.; Xilouri, M.; Hoyte, L.C.; Nagel, S.; McMenamin, M.M.; Tsaknakis, G.; Watt, S.M.; Drakesmith, C.W.; Chen, R.; et al. Tsc1 (hamartin) confers neuroprotection against ischemia by inducing autophagy. Nat. Med. 2013, 19, 351–357. [Google Scholar] [CrossRef] [PubMed]
Figure 1. cPKCγ-mediated blocking of autophagic flux alleviates OGD/R induced neuronal injuries. (a) The viability of neurons under 1 h OGD/R 0–12 h exposure from cPKCγ+/+ mice was significantly higher than that from cPKCγ−/− mice with the same treatment. Autophagy inhibitor 3-MA (5 mM) or BafA1 (100 nM) reversed the decrease; (b) Representative results; (c) The exposure of 1 h OGD/R 0–12 h could increase the LC3II/LC3I ratio in the both groups; (d) The protein levels of p62 were decreased in neurons under 1 h OGD exposure from both cPKCγ+/+ and cPKCγ−/− mice. However, 1 h OGD/R 1–12 h exposure only reversed the reduced protein levels of p62 in cPKCγ+/+ neurons; (e) The mRNA levels of p62 were increased in neurons after 1 h OGD/R 0–1 h injury; (f,g) showed that lentiviral transfection of cPKCγ into cPKCγ−/− neurons partly reversed the decrease in p62 protein levels induced by 1 h OGD/R 1 h exposure. (* p < 0.05, **p < 0.01, and *** p < 0.001 versus corresponding control (a) or Normoxia group of cPKCγ+/+ neurons (ce,g); ### p < 0.001 versus corresponding group with the same treatment; &&& p < 0.001 versus Normoxia group of cPKCγ−/− neurons).
Ijms 19 01380 g001
Figure 2. Effects of cPKCγ on autophagosome and autolysosome formation. (a,d) and (b,e) showed the colocalizations between LC3 and Atg14 or Stx17 were increased in cPKCγ+/+ and cPKCγ−/− neurons after 1 h OGD/R 0 h exposure, indicating higher levels of autophagosome formation and Stx17 anchoring. However, the colocalizations were reduced in cPKCγ+/+ neurons (not in cPKCγ−/− neurons) after 1 h OGD/R 1 h exposure; (c,f) The colocalization of LC3 and Lamp2 was increased in cPKCγ+/+ neuron exposed to 1 h OGD/R 0–1 h. (* p < 0.05 and *** p < 0.001 versus Normoxia group of cPKCγ+/+ neurons; ### p < 0.001 versus Normoxia group of cPKCγ−/− neurons; &&& p < 0.001 versus corresponding group; Arrows, representative colocalization; Scale bar, 5 μm).
Ijms 19 01380 g002aIjms 19 01380 g002b
Figure 3. Effects of cPKCγ on autolysosome degradation. (a,b) showed the colocalization of Stx17 with Lamp2 was increased in cPKCγ+/+ and cPKCγ−/− neurons after 1 h OGD/R 0 h exposure, indicating higher levels of autolysosome formation. The colocalization of Stx17 and Lamp2 was also increased in cPKCγ+/+ neuron exposed to 1 h OGD/R 1 h, suggesting an autophagic flux blockage in the autolysosome phase; (ce) showed the number and diameter of Lysotracker-positive structures were significantly increased in neurons of cPKCγ+/+ neuron exposed to 1 h OGD/R 0–1 h. (** p < 0.01 and *** p < 0.001 versus Normoxia group of cPKCγ+/+ neurons; ## p < 0.01 and ### p < 0.001 versus Normoxia group of cPKCγ−/− neurons; &&& p < 0.001 versus corresponding group; n = 6 per group; Arrows, representative co-localization; Scale bar, 5 μm).
Ijms 19 01380 g003
Figure 4. cPKCγ reactivates mTOR and alleviates autophagy in neurons under 1 h OGD/R 1 h exposure. (a) The representative result revealed that cPKCγ and mTOR could be coimmunoprecipitated from the samples of non-treated cortical neurons or 1 h OGD/R 0–1 h-treated neurons; (b) The phosphorylation levels of mTOR at Ser 2481 and 2448 in the neurons from cPKCγ+/+ mice were decreased in cPKCγ+/+ neurons under 1 h OGD exposure and increased after reperfusion. The phosphorylation levels of mTOR at site of Ser 2481 and 2448 were significantly lower in cPKCγ−/− neurons at conditions of normoxia and 1 h OGD/R 0–1 h treatments; (c) Neutralizing antibody against p-mTOR at Ser 2448 offset the increase of phosphorylation levels of mTOR at Ser 2481 induced by 1 h OGD/R 1 h exposure; (d) Neutralizing antibody against p-mTOR at Ser 2481 unblocked autophagic flux and reduced the p62 accumulation. (* p < 0.05, ** p < 0.01 and *** p < 0.001 versus Normoxia group; ## p < 0.01 and ### p < 0.001 versus corresponding group; NS p > 0.05 versus corresponding group).
Ijms 19 01380 g004
Figure 5. Reactivation of mTOR blocks autophagic flux and inhibits the degradation of autolysosome in neurons under 1 h OGD/R 1 h exposure. Initiation of autophagy was controlled by the ULK1, which was inhibited by mTOR kinase under nutrient replete conditions [2]. In this study, a low level of autophagy was maintained in neurons of cPKCγ+/+ mice under normoxic condition. The levels of autophagy were increased in harmony with dephosphorylation of mTOR in cPKCγ+/+ neurons after 1 h OGD treatment, whereas reperfusion was associated with Ser 2481 P-mTOR phosphorylation and reactivation. The reactived mTOR blocked autophagic flux mostly in the autolysosome degradation in neurons exposed to 1 h OGD/R 1 h.
Ijms 19 01380 g005

