Article

Identification and Evolution of TGF-β Signaling Pathway Members in Twenty-Four Animal Species and Expression in Tilapia

Key Laboratory of Freshwater Fish Reproduction and Development (Ministry of Education), Key Laboratory of Aquatic Science of Chongqing, School of Life Sciences, Southwest University, Chongqing 400715, China
*
Author to whom correspondence should be addressed.
These authors contributed equally to this work.
Int. J. Mol. Sci. 2018, 19(4), 1154; https://doi.org/10.3390/ijms19041154
Submission received: 9 February 2018 / Revised: 24 March 2018 / Accepted: 4 April 2018 / Published: 11 April 2018
(This article belongs to the Section Biochemistry)

Abstract

:
Transforming growth factor β (TGF-β) signaling controls diverse cellular processes during embryogenesis as well as in mature tissues of multicellular animals. Here we carried out a comprehensive analysis of TGF-β pathway members in 24 representative animal species. The appearance of the TGF-β pathway was intrinsically linked to the emergence of metazoan. The total number of TGF-β ligands, receptors, and smads changed slightly in all invertebrates and jawless vertebrates analyzed. In contrast, expansion of the pathway members, especially ligands, was observed in jawed vertebrates most likely due to the second round of whole genome duplication (2R) and additional rounds in teleosts. Duplications of TGFB2, TGFBR2, ACVR1, SMAD4 and SMAD6, which were resulted from 2R, were first isolated. Type II receptors may be originated from the ACVR2-like ancestor. Interestingly, AMHR2 was not identified in Chimaeriformes and Cypriniformes even though they had the ligand AMH. Based on transcriptome data, TGF-β ligands exhibited a tissue-specific expression especially in the heart and gonads. However, most receptors and smads were expressed in multiple tissues indicating they were shared by different ligands. Spatial and temporal expression profiles of 8 genes in gonads of different developmental stages provided a fundamental clue for understanding their important roles in sex determination and reproduction. Taken together, our findings provided a global insight into the phylogeny and expression patterns of the TGF-β pathway genes, and hence contribute to the greater understanding of their biological roles in the organism especially in teleosts.

1. Introduction

The evolution of animals was accompanied by an increase in systematic complexity including highly specialized tissues and organs. Gene duplication has been suggested to be a primary mechanism for the increase of organismal complexity and the generation of evolutionary novelty [1]. Whole genome duplication (WGD) is one of the important mechanisms which can rapidly generate duplicate copies of genes in species evolution [2]. Many families of genes such as nuclear receptors (NRs), Wnt-protein ligands and GPCRs are known to have evolved through WGDs [3,4]. Despite being controversial, it is widely accepted that three rounds of WGD occurred during vertebrate evolution. The first two rounds of duplication events (1R and 2R) occurred early in the vertebrate lineage, while the third event (3R) only occurred in teleosts [5,6,7,8]. Some teleosts, such as rainbow trout and common carp [9,10], even have undergone the fourth round of genome duplication (4R) (Figure 1). After duplication, divergence both in expression patterns and protein sequences (namely subfunctionalization and neofunctionalization) can be responsible for the retention of gene duplicates [11,12]. However, massive gene loss typically followed WGDs, and in most cases only a single copy of the duplicated genes will be retained [13]. Thus, it is hard to interpret molecular phylogenies due to gene loss among distantly related lineages.
The transforming growth factor β (TGF-β) signaling pathway consists of extracellular ligands (including TGF-β-like group and BMP-like group), cell surface receptors (including type I and type II serine-threonine kinase receptors), and intracellular smad proteins (including receptor-regulated smad (R-SMAD), common-smad (Co-SMAD), and inhibitory smad (I-SMAD)) [14,15]. TGF-β ligands comprise a secretion signal peptide, a ~250-residue prodomain, and a ~110-residue growth factor domain which encompasses 6–9, and usually 7, conserved cysteines. 6 of the characteristic cysteine residues form 3 intramolecular disulfide bonds, and the seventh cysteine forms a intermolecular disulfide bond linking two monomers into a dimer [16,17]. This dimer binds to specific tetrameric type II/type I kinase receptor complexes, which stabilizes and activates type I receptors. The activated type I receptors then transduce the signals by phosphorylating the R-SMADs. In general, TGF-β-like group generally phosphorylate SMAD2 and SMAD3, whereas BMP-like group generally induce phosphorylation of SMAD1, SMAD5 and SAMD8 [18,19]. The activated R-SMADs form hetero-oligomeric complexes with Co-SMAD (SMAD4), which are translocated to the nucleus where they regulate the expression of target genes. I-SMADs (SMAD6 and SMAD7) can inhibit R-SMAD activation by type I receptors.
The TGF-β pathway members are conserved in organisms ranging from Nematoda and Arthropoda to Mammalia [20]. As for ligands, there are 9 genes in Mnemiopsis leidyi [21], 7 in Drosophila melanogaster [22], 5 in Caenorhabditis elegans [23], and at least 30 in mammals [17,24]. Two functional classes of receptors, type I and type II, which are encoded by 7 (ALK1-ACVRL1, ALK2-ACVR1, ALK3-BMPR1A, ALK4-ACVR1B, ALK5-TGFBR1, ALK6-BMPR1B, ALK7-ACVR1C) and 5 (BMPR2, ACVR2A, ACVR2B, AMHR2, and TGFBR2) genes in mammals, respectively [25,26]. Drosophila species contain three type I and two type II receptors. Extensive research on the repertoires of smads has been reported in zebrafish (12), medaka (12), fugu (13) and the green spotted puffer (14) [27]. However, to date, the origin and evolution of whole TGF-β pathway members in the animal kingdom are still unclear because of scant analysis of this pathway in representative animal species due to lack of genome data. Recently, genomes of representative species have been sequenced and opened, such as sea lamprey (a jawless cyclostomata) [28], elephant shark (a chondrichthyan) [29], coelacanth (an early sarcopterygian) [30], spotted gar (a non-teleost actinopterygian) [31] and many teleosts. The completion of genome sequencing of these species provides new resources for tracing the evolution of this pathway.
TGF-β pathway members create the networks that establish multicellular animal body plans. They specify anteroposterior, dorsoventral (bilateral), left–right axes, details of individual organs and regulate development and homeostasis [32,33,34,35,36]. The influence of the TGF-β pathway members on fertility and reproduction in organisms as diverse as flies and humans is impressive [37]. Additionally, several recent studies have suggested that TGF-β pathway members were involved in sex determination in fishes. These included gsdf [38,39,40,41], bmp15 [42], amhr2 [43] and Y-linked duplicates of the amh (amhy) [44,45], gsdf (gsdfY) [46] and gdf6 (gdf6Y) [47].
However, to date, analyses of this pathway have so far been restricted to ligands, receptors or smads alone in one or several species. Expression data are available only for single or a subfamily of the TGF-β in a particular tissue or at a single stage of development [48,49]. The expression profiles of most of the TGF-β pathway genes in multiple tissues are still lacking. Moreover, other than studies in human and model organisms, little is known about the evolution and expression of TGF-β pathway members in other species, especially in teleosts. To address these issues, we isolated TGF-β pathway members from 24 representative animal species, performed phylogenetic analyses of the ligands, receptors and smads, and analyzed the spatial-temporal gene expression profiles in different tissues especially gonads of a teleost, the Nile tilapia.

2. Results

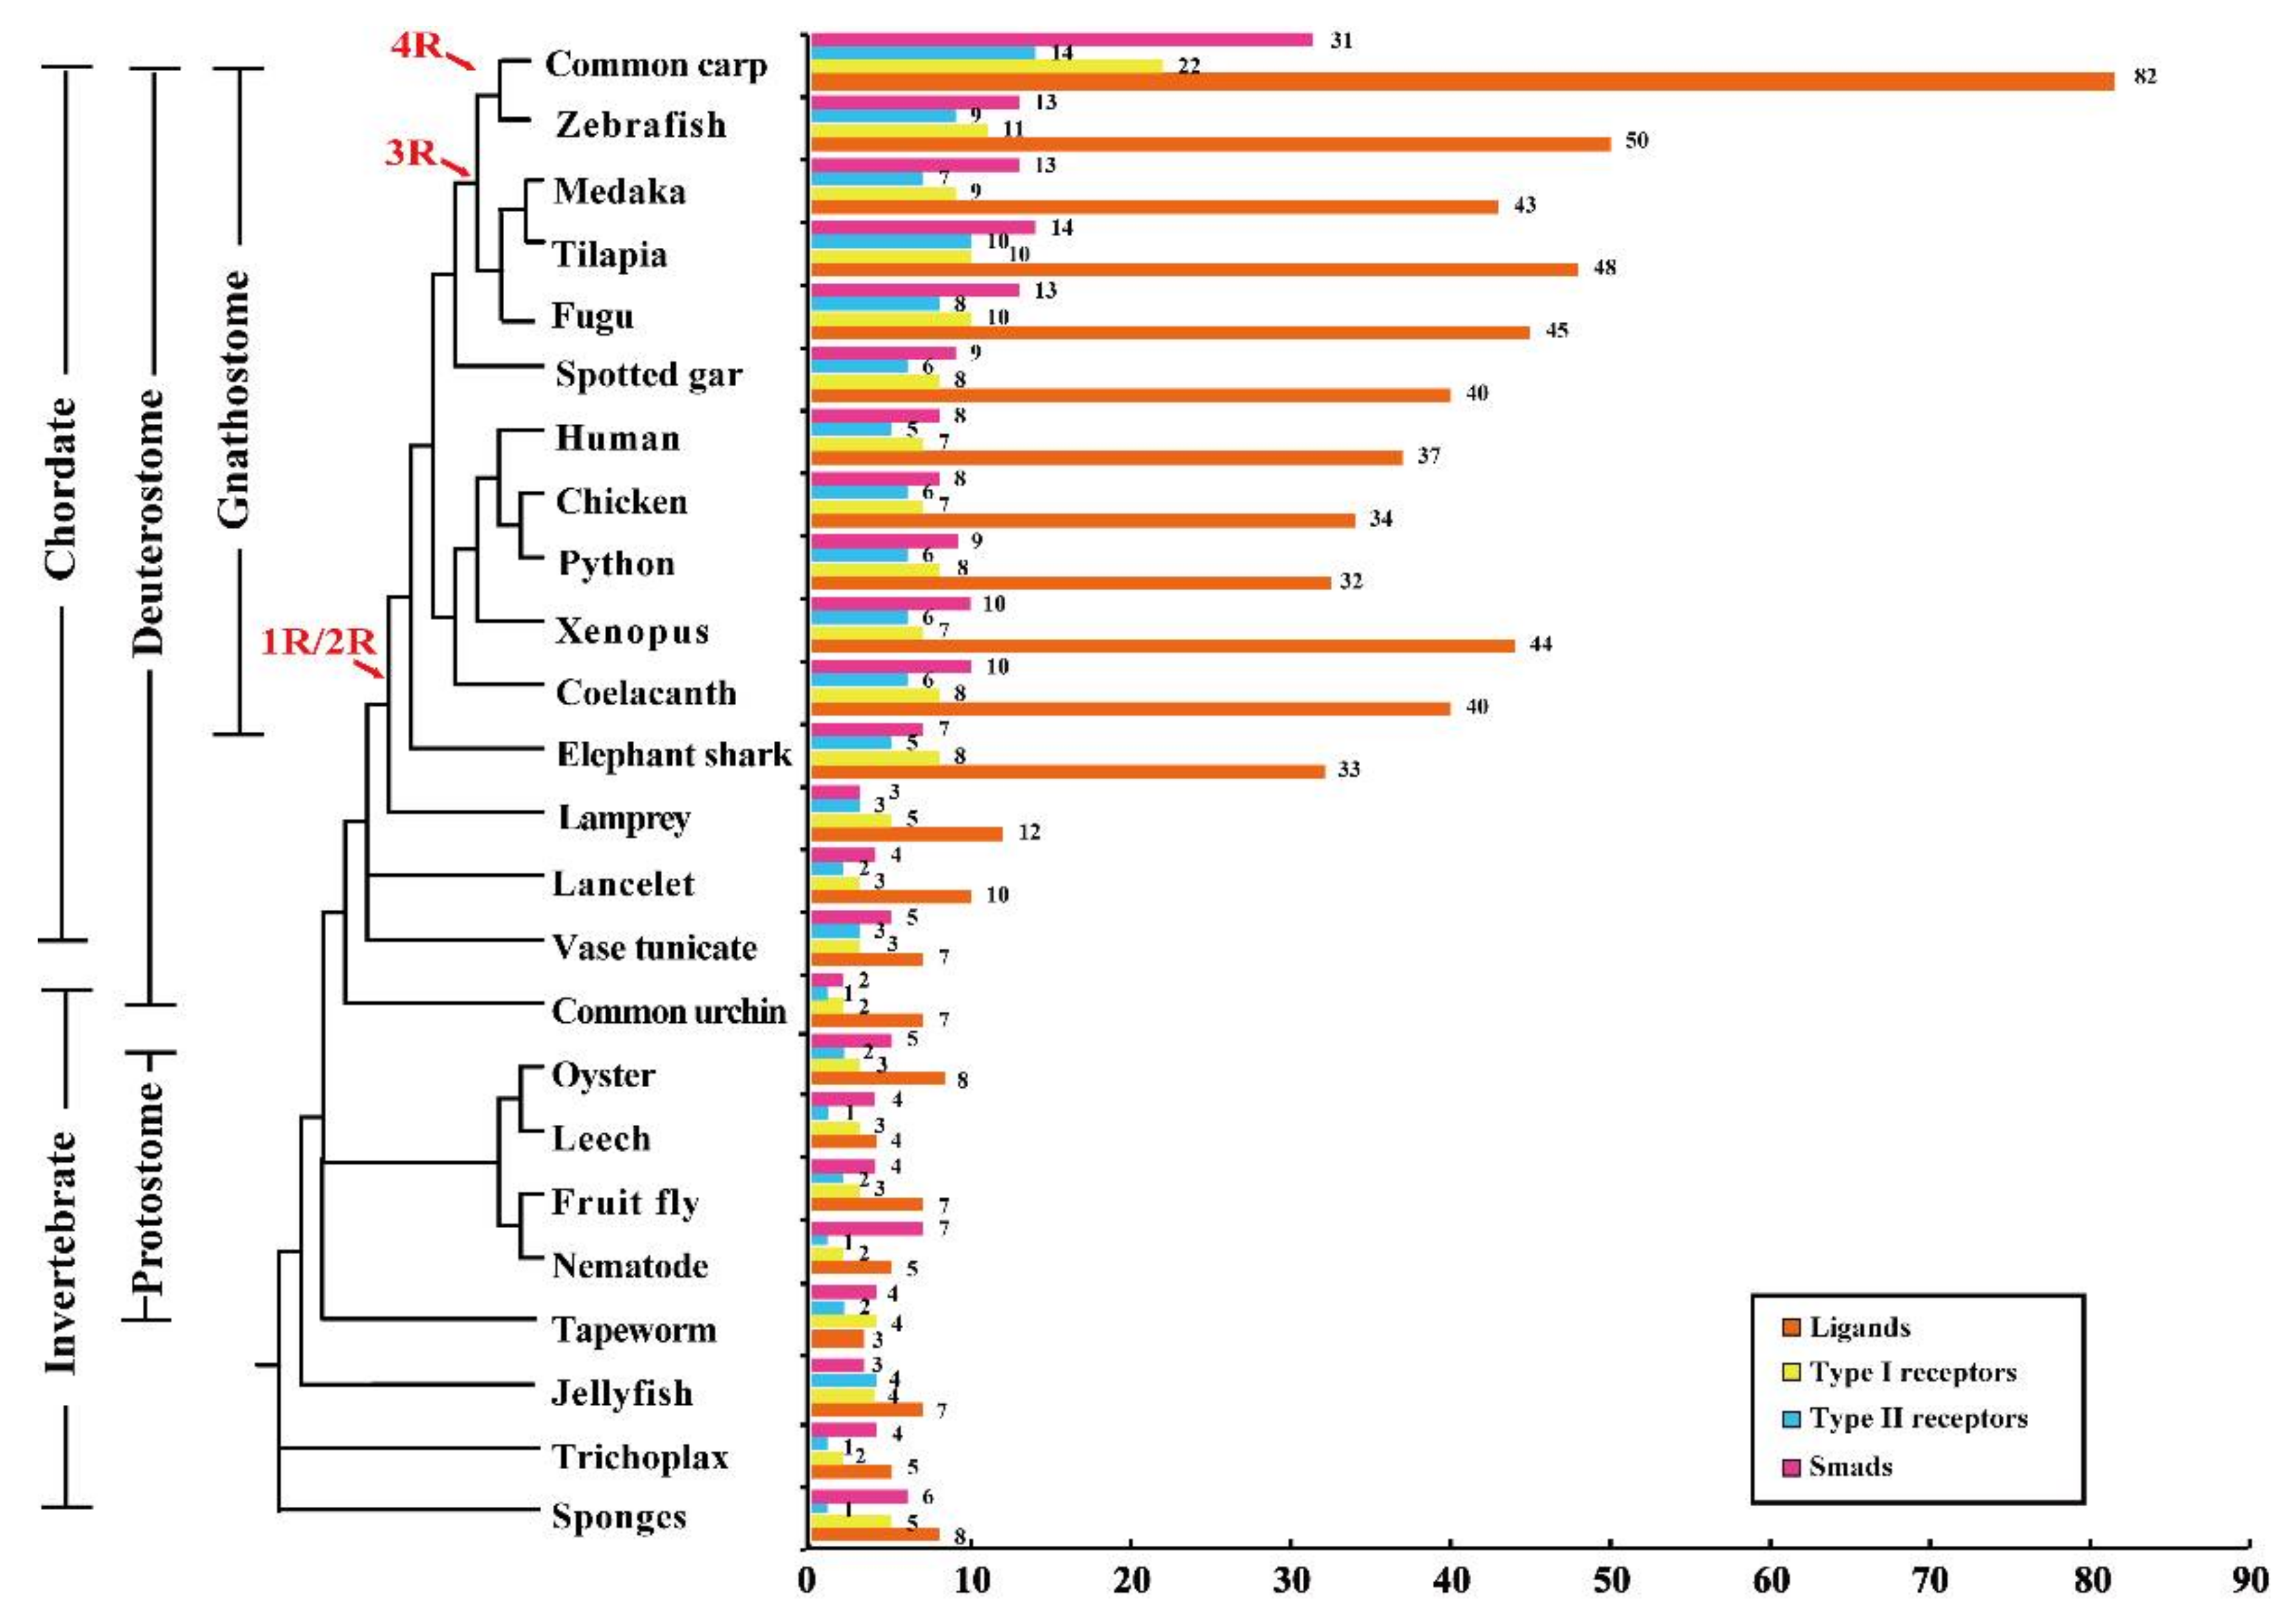
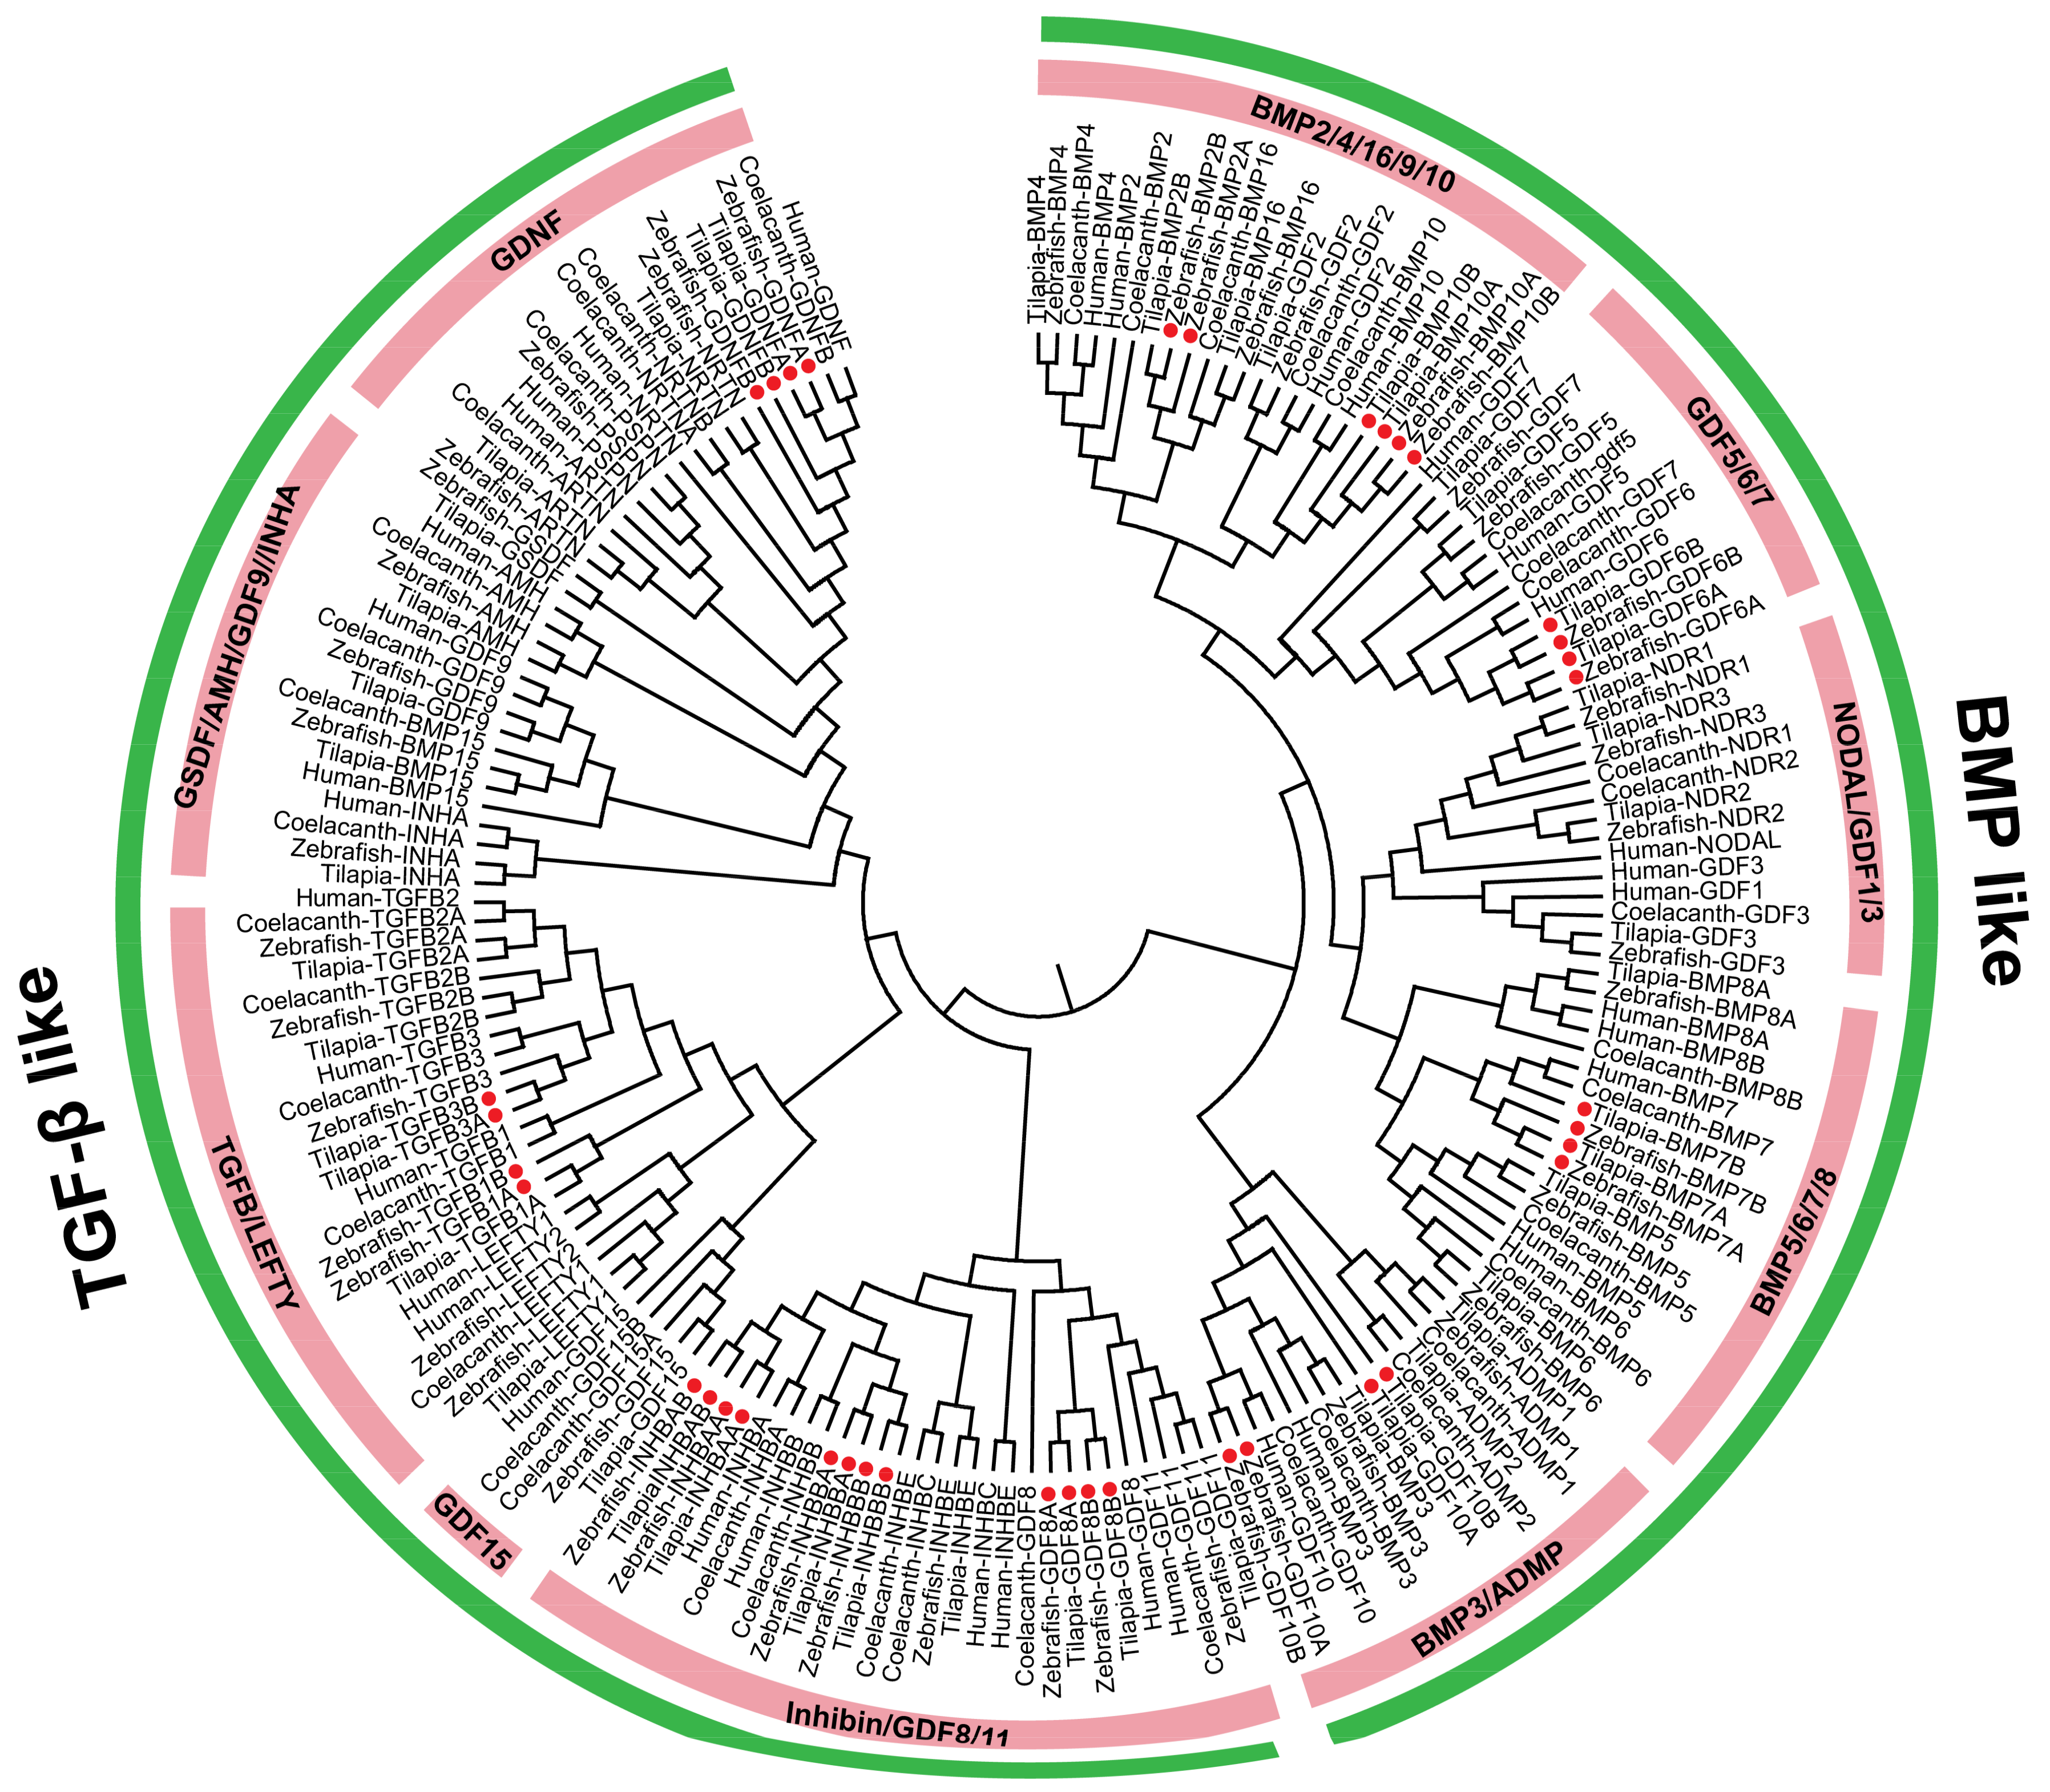
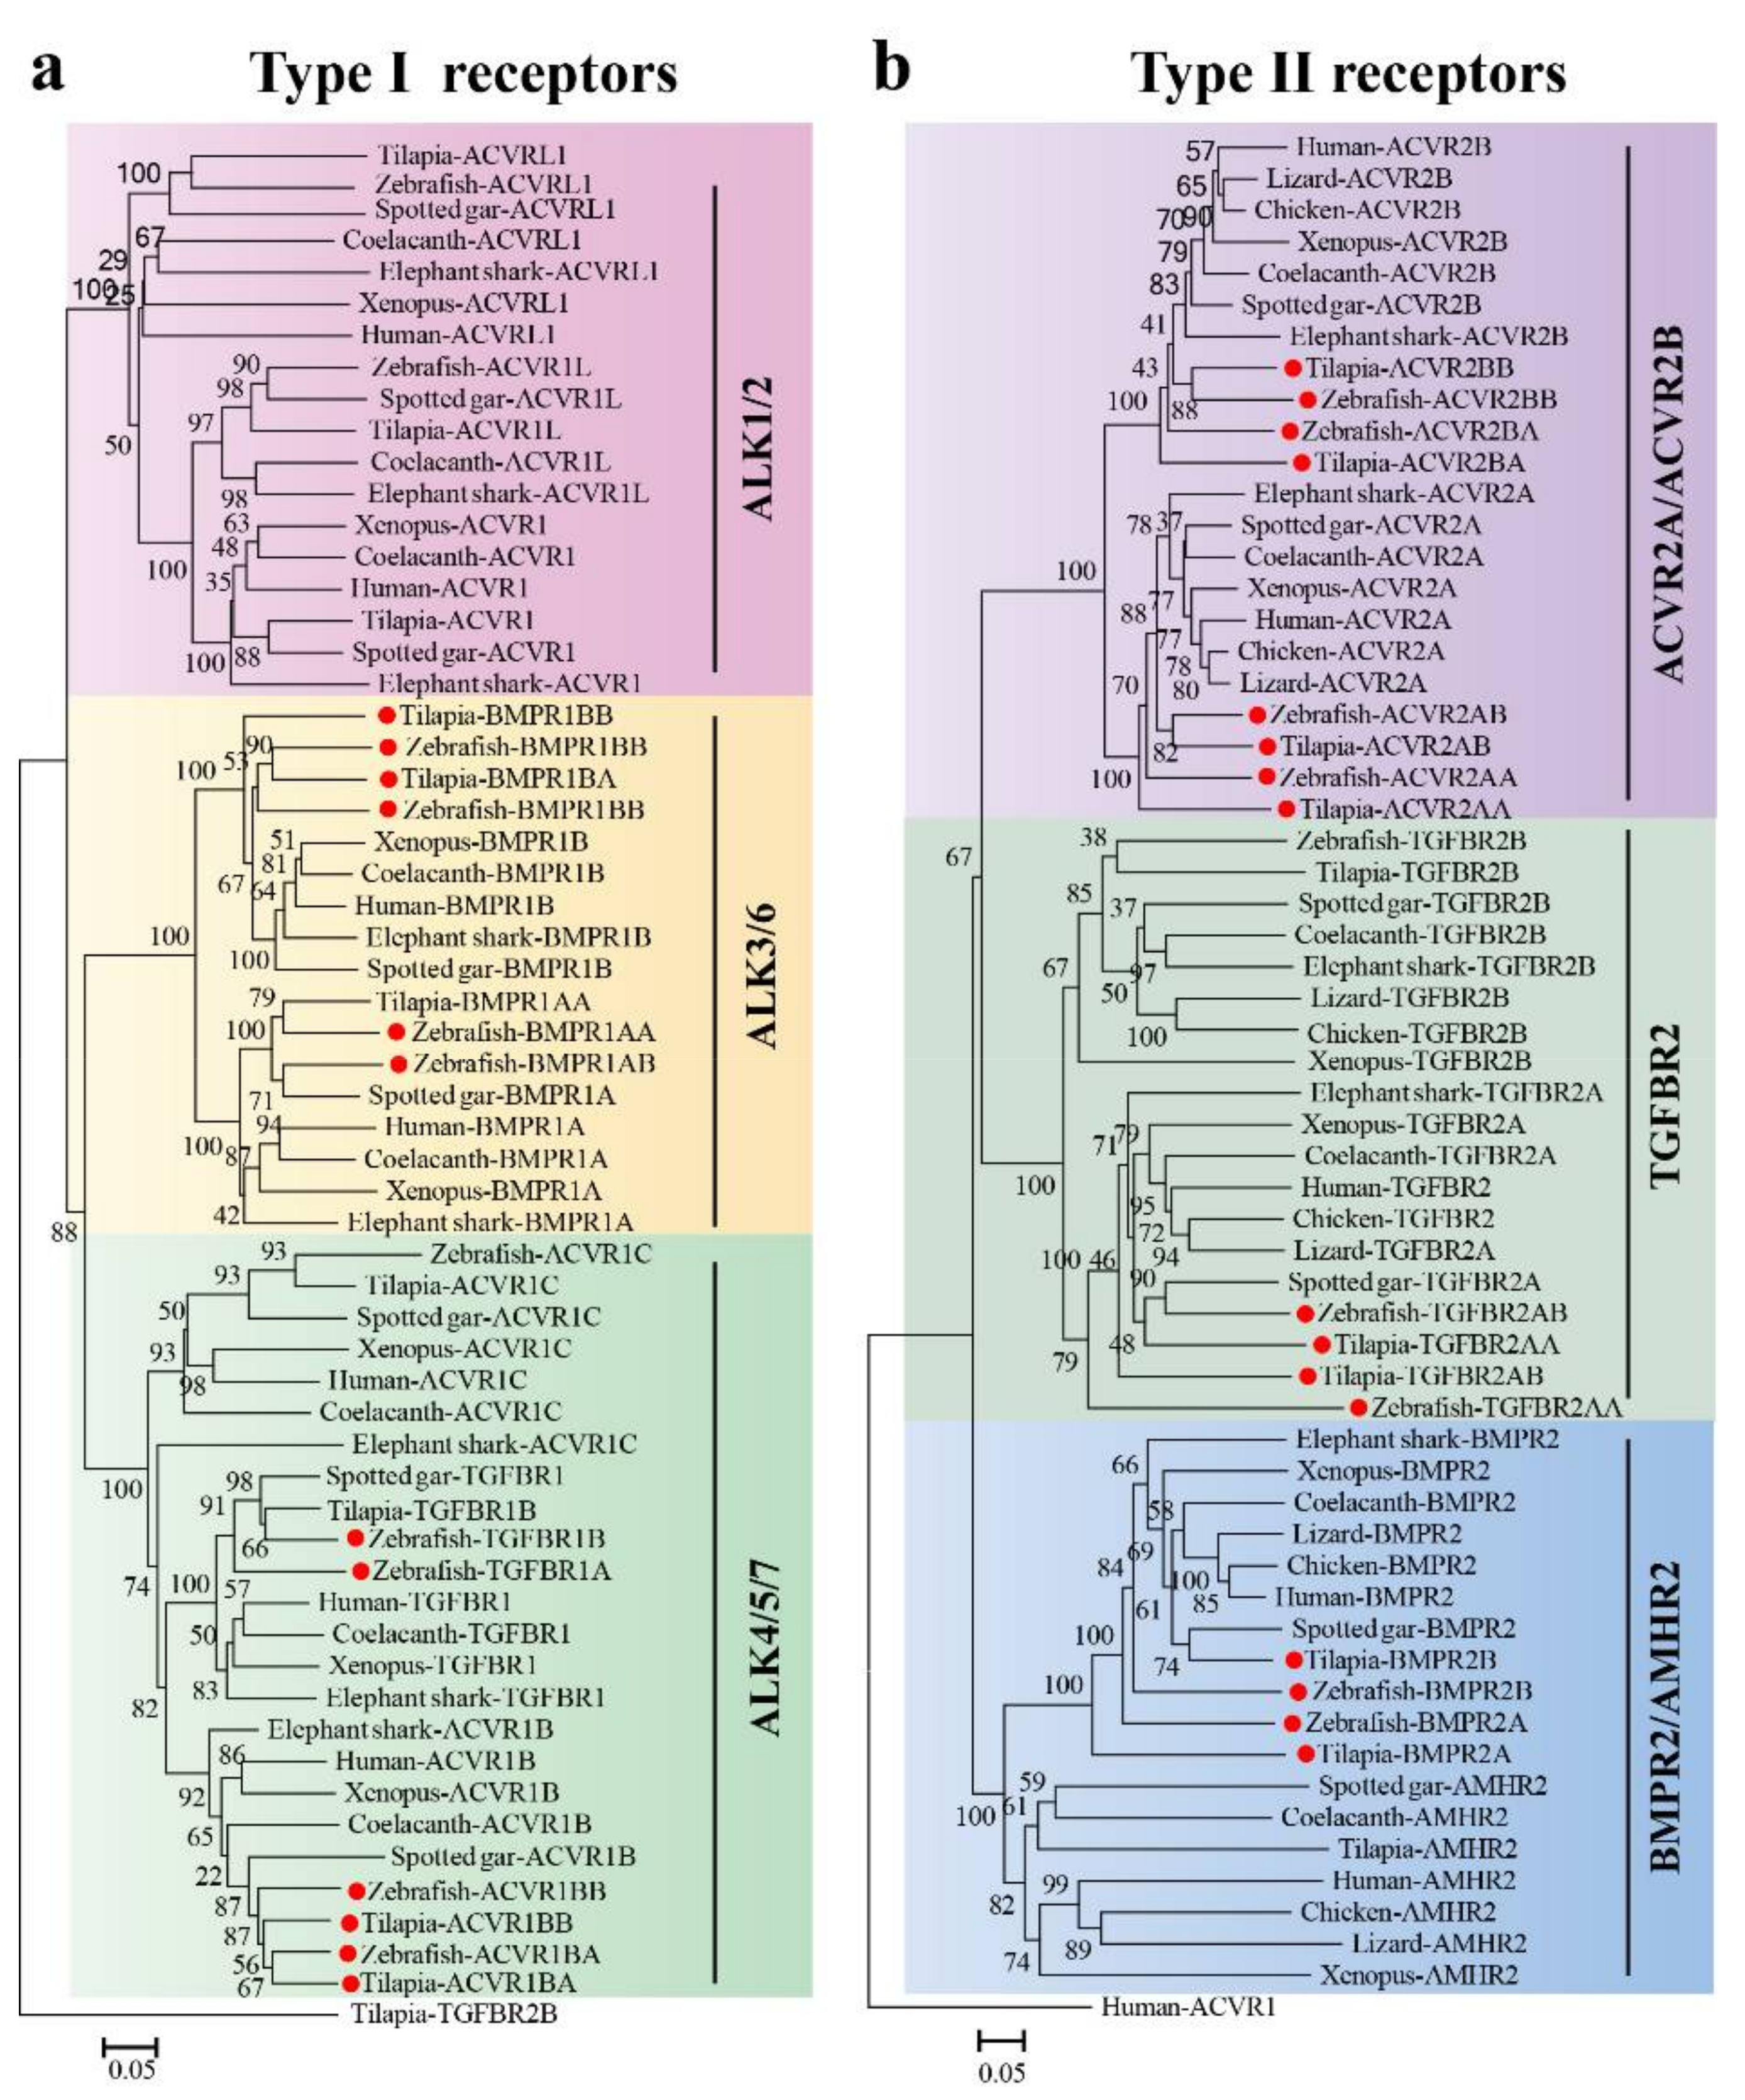
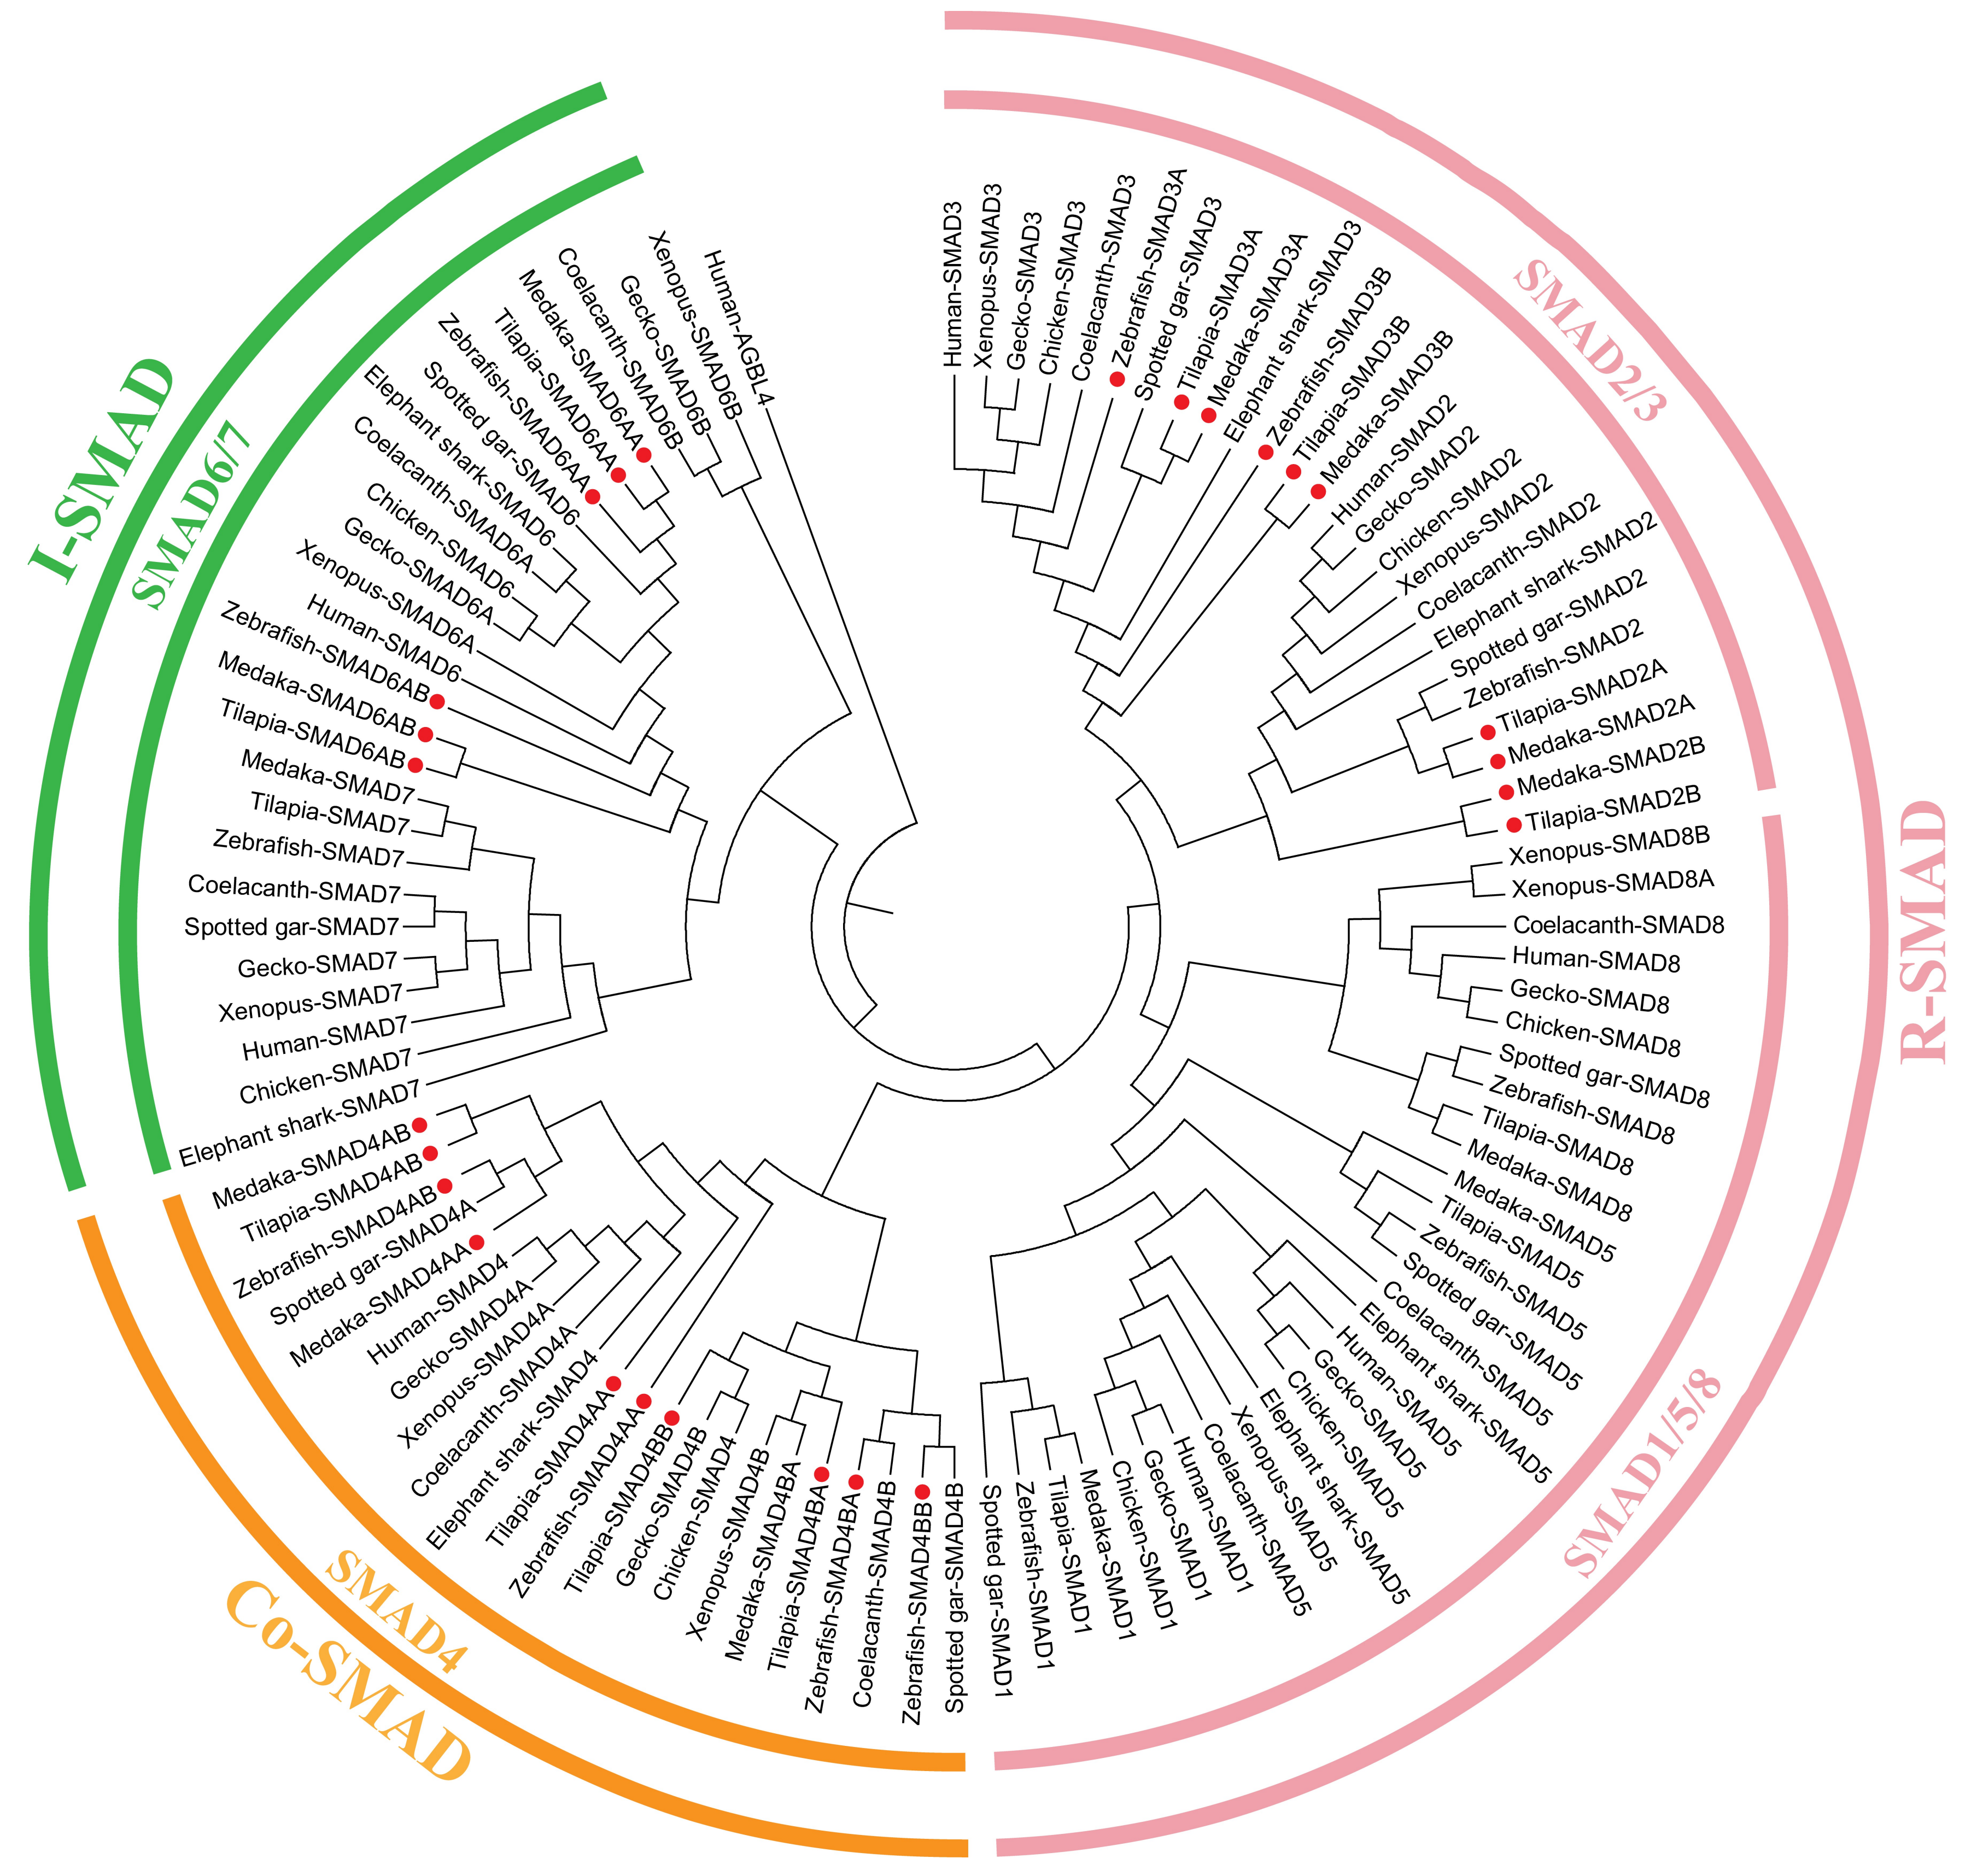
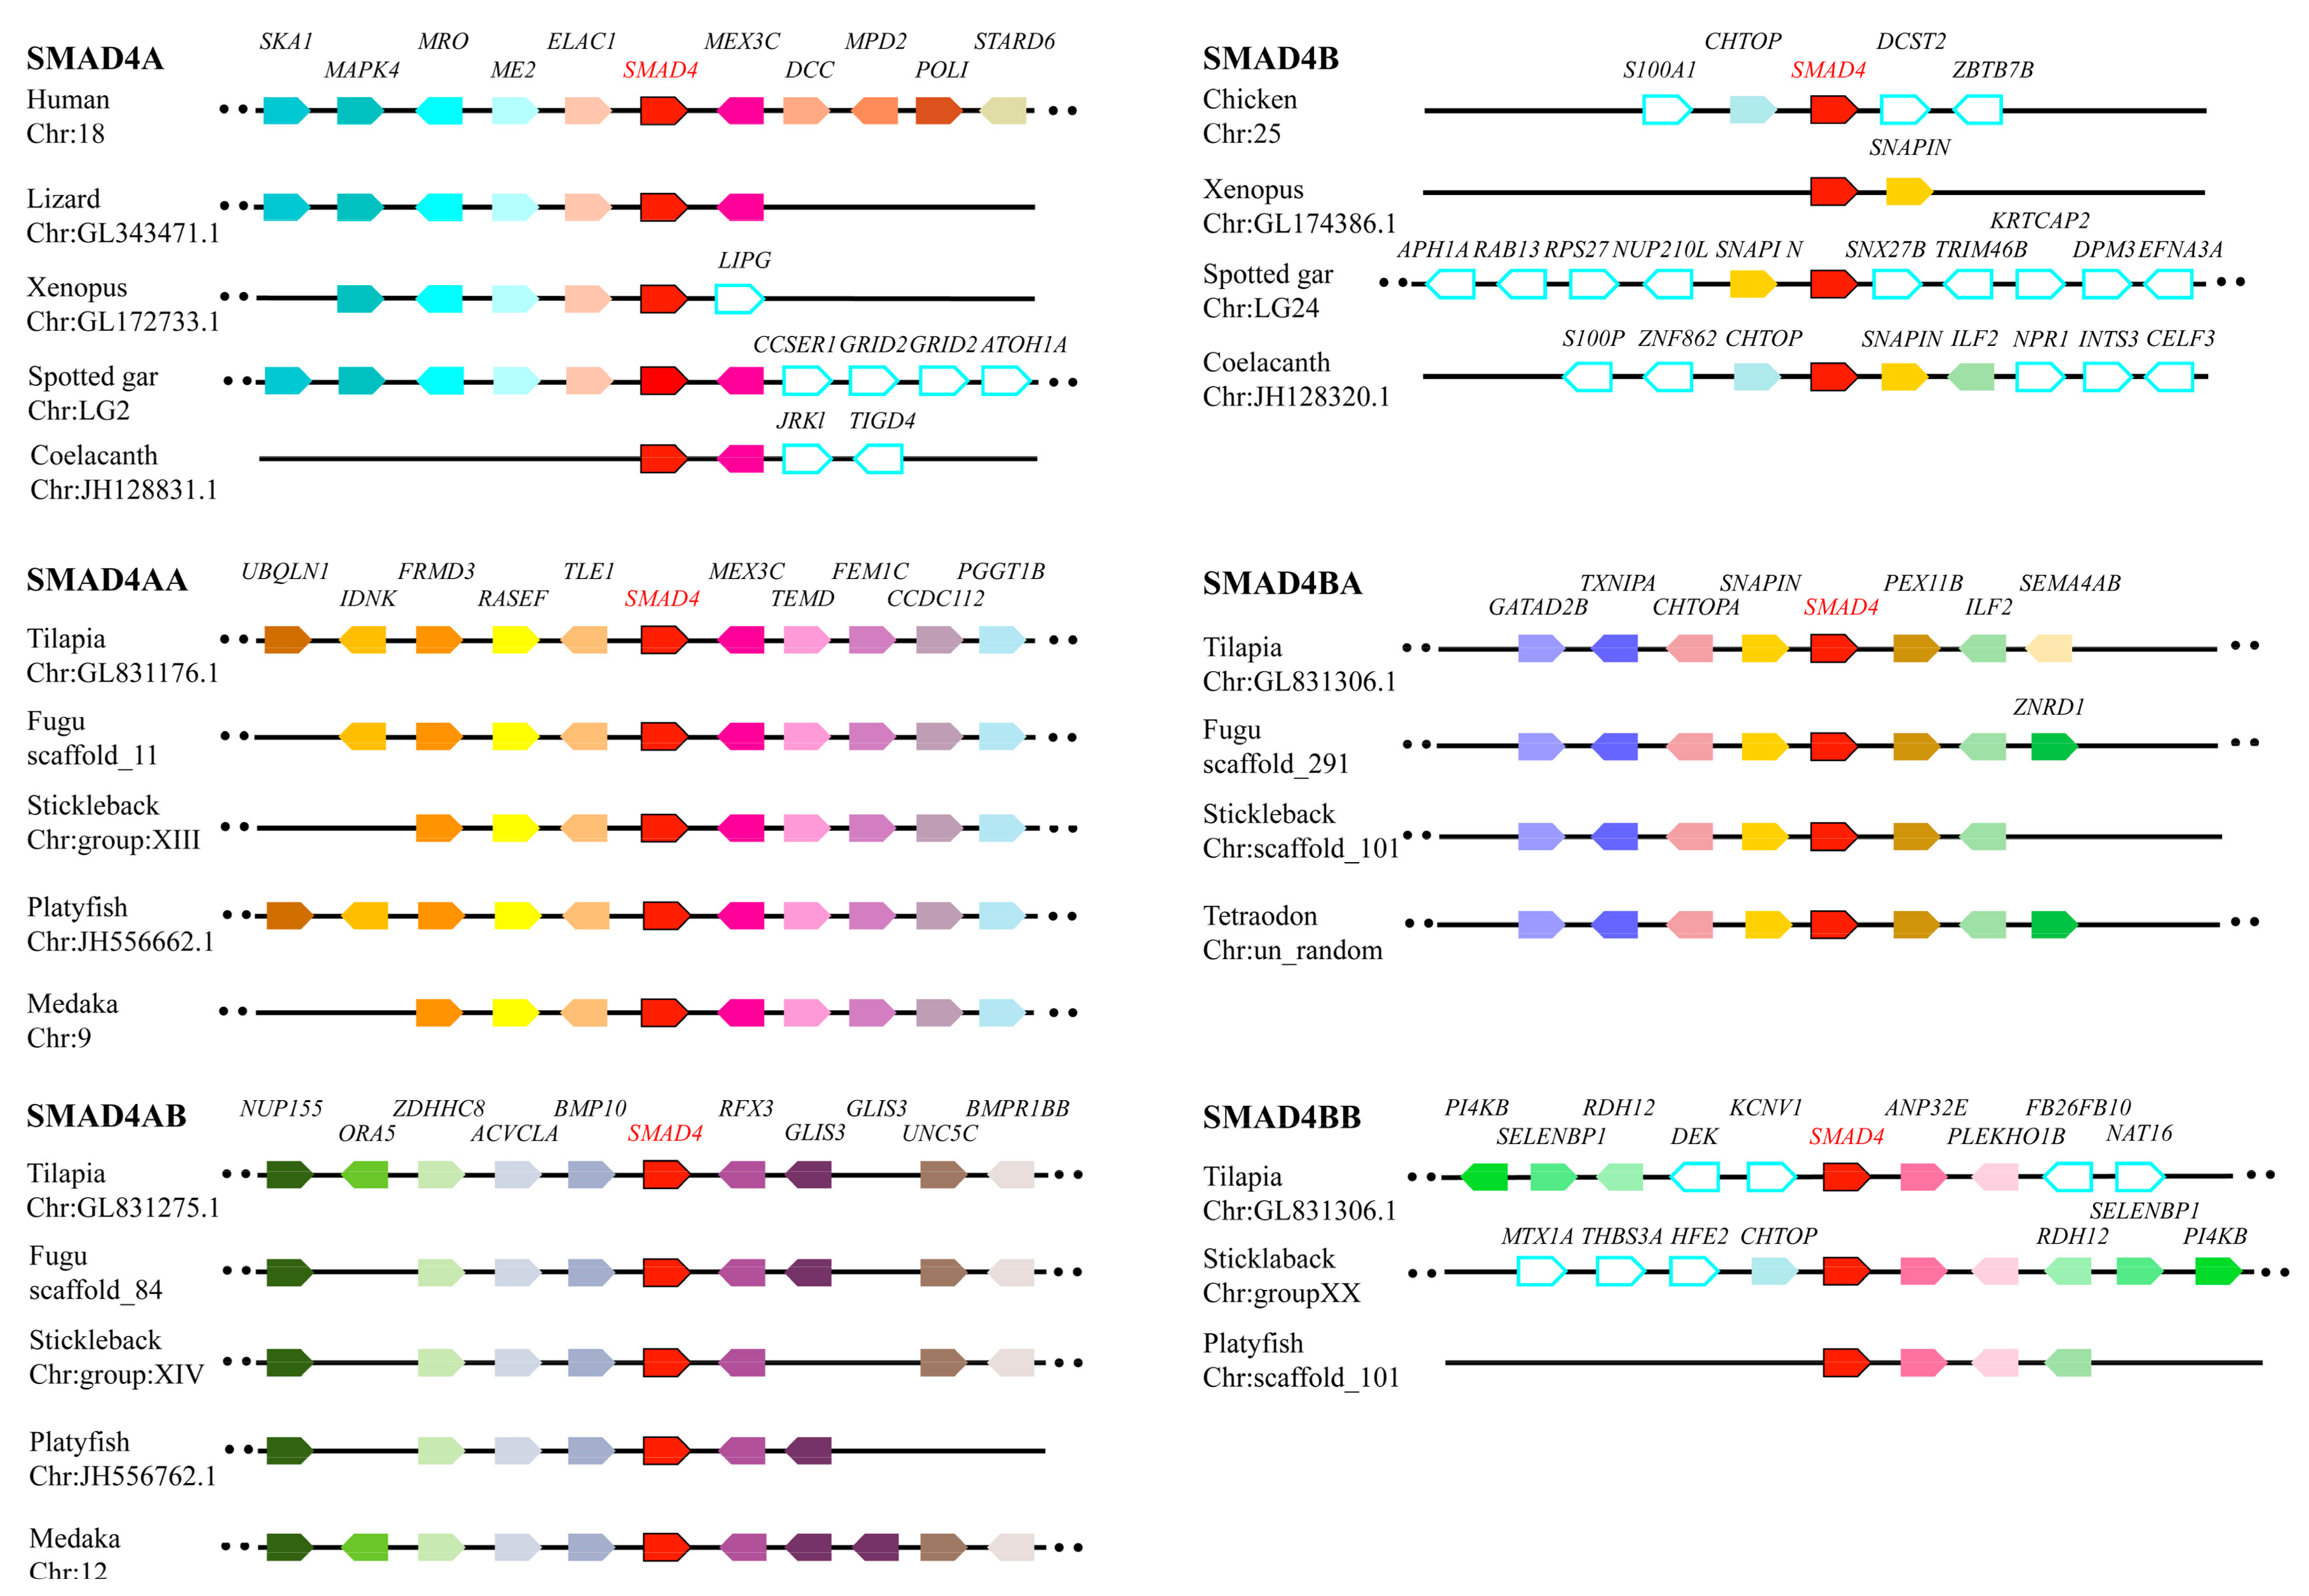
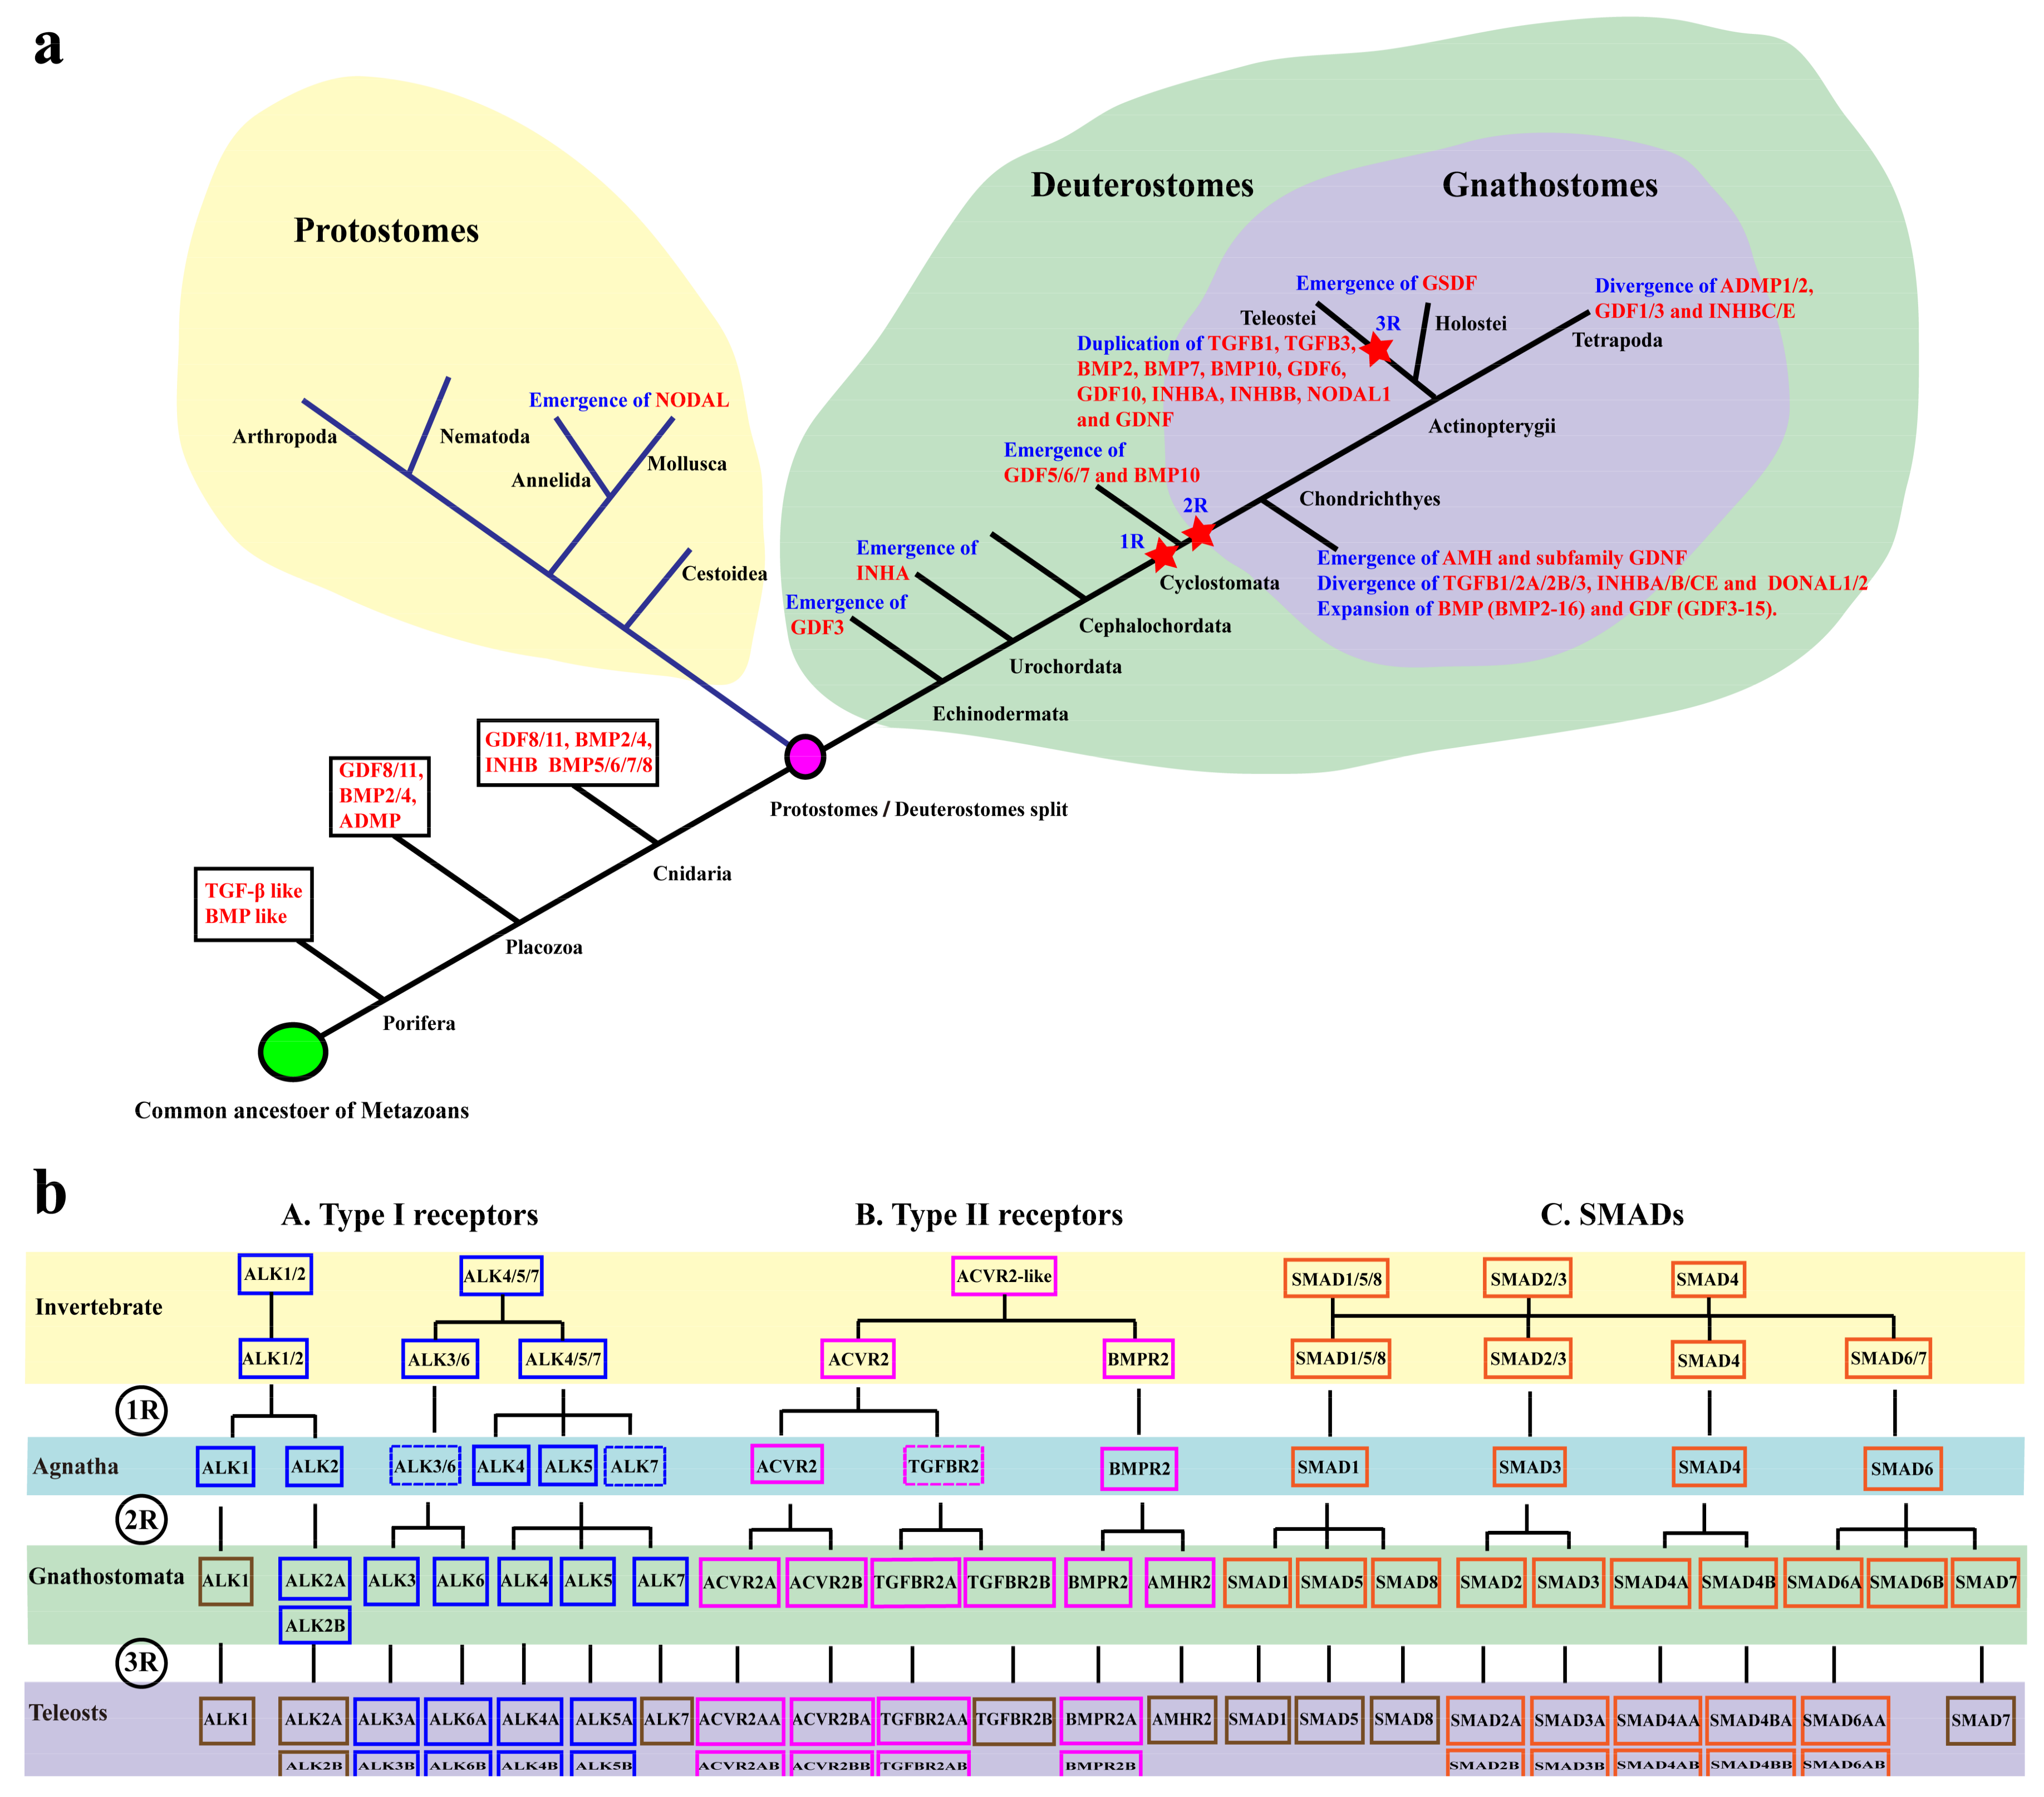
2.1. TGF-β Pathway Genes across Different Animals

Comparative analyses of the TGF-β pathway genes in 24 representative animal species revealed that the complete functional TGF-β pathway, including multiple ligands, receptors and smads, appeared in the sponge Amphimedon queenslandica, an early diverging metazoan (Figure 1 and Table S1). In invertebrates and jawless vertebrates, the total number of TGF-β ligands, receptors and smads changed slightly. Jawed vertebrates (gnathostomes) had an expanded set of ligands, receptors and smads most likely due to 2R event. Duplications of TGF-β members were also observed from 3R in teleosts and 4R in common carp although many TGF-β pathway members were lost after duplication. Additionally, the number of TGF-β ligands greatly exceeded the number of two type receptors and smads in jawed vertebrates. The accession numbers of all TGF-β pathway members we analyzed are listed in Table S2. Genomic distribution of TGF-β pathway members in tilapia was shown in Figure S1.
TGF-β ligands were clustered into TGF-β-like and BMP-like clades from phylogenetic tree we generated based on mature TGF-β peptide domains. Each clade can be subdivided into many different small groups (Figure 2). There are about 43–50 ligands in teleosts, of which 11 genes (TGFB1, TGFB3, BMP2, BMP7, BMP10, GDF6, GDF8, GDF10, INHBA, INHBB and GDNF) marked with red dots retained two copies in teleosts which were originated from 3R. Additionally, there were 5 genes (NDR1, BMP8, ADMP, TGFB2 and NRTN) which had two copies in some 2R species. For instance, duplication of TGFB2 was found for the first time in the elephant shark, coelacanth, and python (Figure S2a). Additionally, BMP16, a relative of BMP2/4, was first identified in whale shark in this study (Figure S2b).
TGF-β type I receptors can be divided into ALK1/2, ALK3/6 and ALK4/5/7 subfamilies (Figure 3a). In teleosts, we isolated 9–11 potential type I receptors. ALK3/4/5/6 had two copies in teleosts, while only one in tetrapods. Moreover, ACVR1L, a copy gene of ALK2, was isolated in the shark, coelacanth, and spotted gar in this study. Type II receptors can be divided into TGFBR2, ACVR2A/ACVR2B and BMPR2/AMHR2 subfamilies (Figure 3b). In teleosts, we identified 7–10 type II receptors. All orthologous genes of mammals have two copies in teleosts except AMHR2. In addition, AMHR2 was not found in Chimaeriformes (elephant shark, whale shark) and Cypriniformes, at least in Cyprinidae (zebrafish, common carp, grass carp and bluntnose black bream) genomes which had the corresponding ligand AMH (Figure S3). In addition, duplication of TGFBR2 (TGFBR2B) was found not only in teleosts but also in birds, amphibians, reptiles, cartilage, and bony fishes.
In teleosts, smads were clustered into 3 subfamilies with 6–7 R-SMADs, 3–4 Co-SMADs and 3 I-SMADs (Figure 4). Duplications of SMAD2/3 derived from 3R event, while SMAD1/5/7/8 had only one copy in all species analyzed except xenopus in which two SMAD8 were identified. Phylogeny analysis of SMAD4 indicated that it has undergone 2R event to form 2 copies in coelacanth, spotted gar and xenopus, and have 4 in teleosts derived from 3R (Figure S2c). To further elucidate the SMAD4 evolutionary history, we characterized and compared the adjacent genomic regions of each SMAD4 paralogous gene loci in representative vertebrate species including tetrapods (human, chicken, lizard, and xenopus), sarcopterygians (coelacanth) and actinopterygians (spotted gar, tilapia, zebrafish, medaka, fugu, stickleback, platyfish and tetraodon) (Figure 5). Synteny analysis indicated that two SMAD4, namely SMAD4A and SMAD4B, were conserved in coelacanth, spotted gar and xenopus. Human and lizard retained SMAD4A, while chicken retained SMAD4B. The genomic regions of SMAD4A and SMAD4B have been duplicated in teleosts, likely due to the teleost 3R. Conserved synteny of 3R-duplicated genes in this region include MEX3C and SNAPIN. Furthermore, duplication of SMAD6 (SMAD6B) was found in coelacanth, xenopus, python, and gecko. SMAD6B in these species were clustered together but branched from SMAD6A of the vertebrates (Figure S2d).

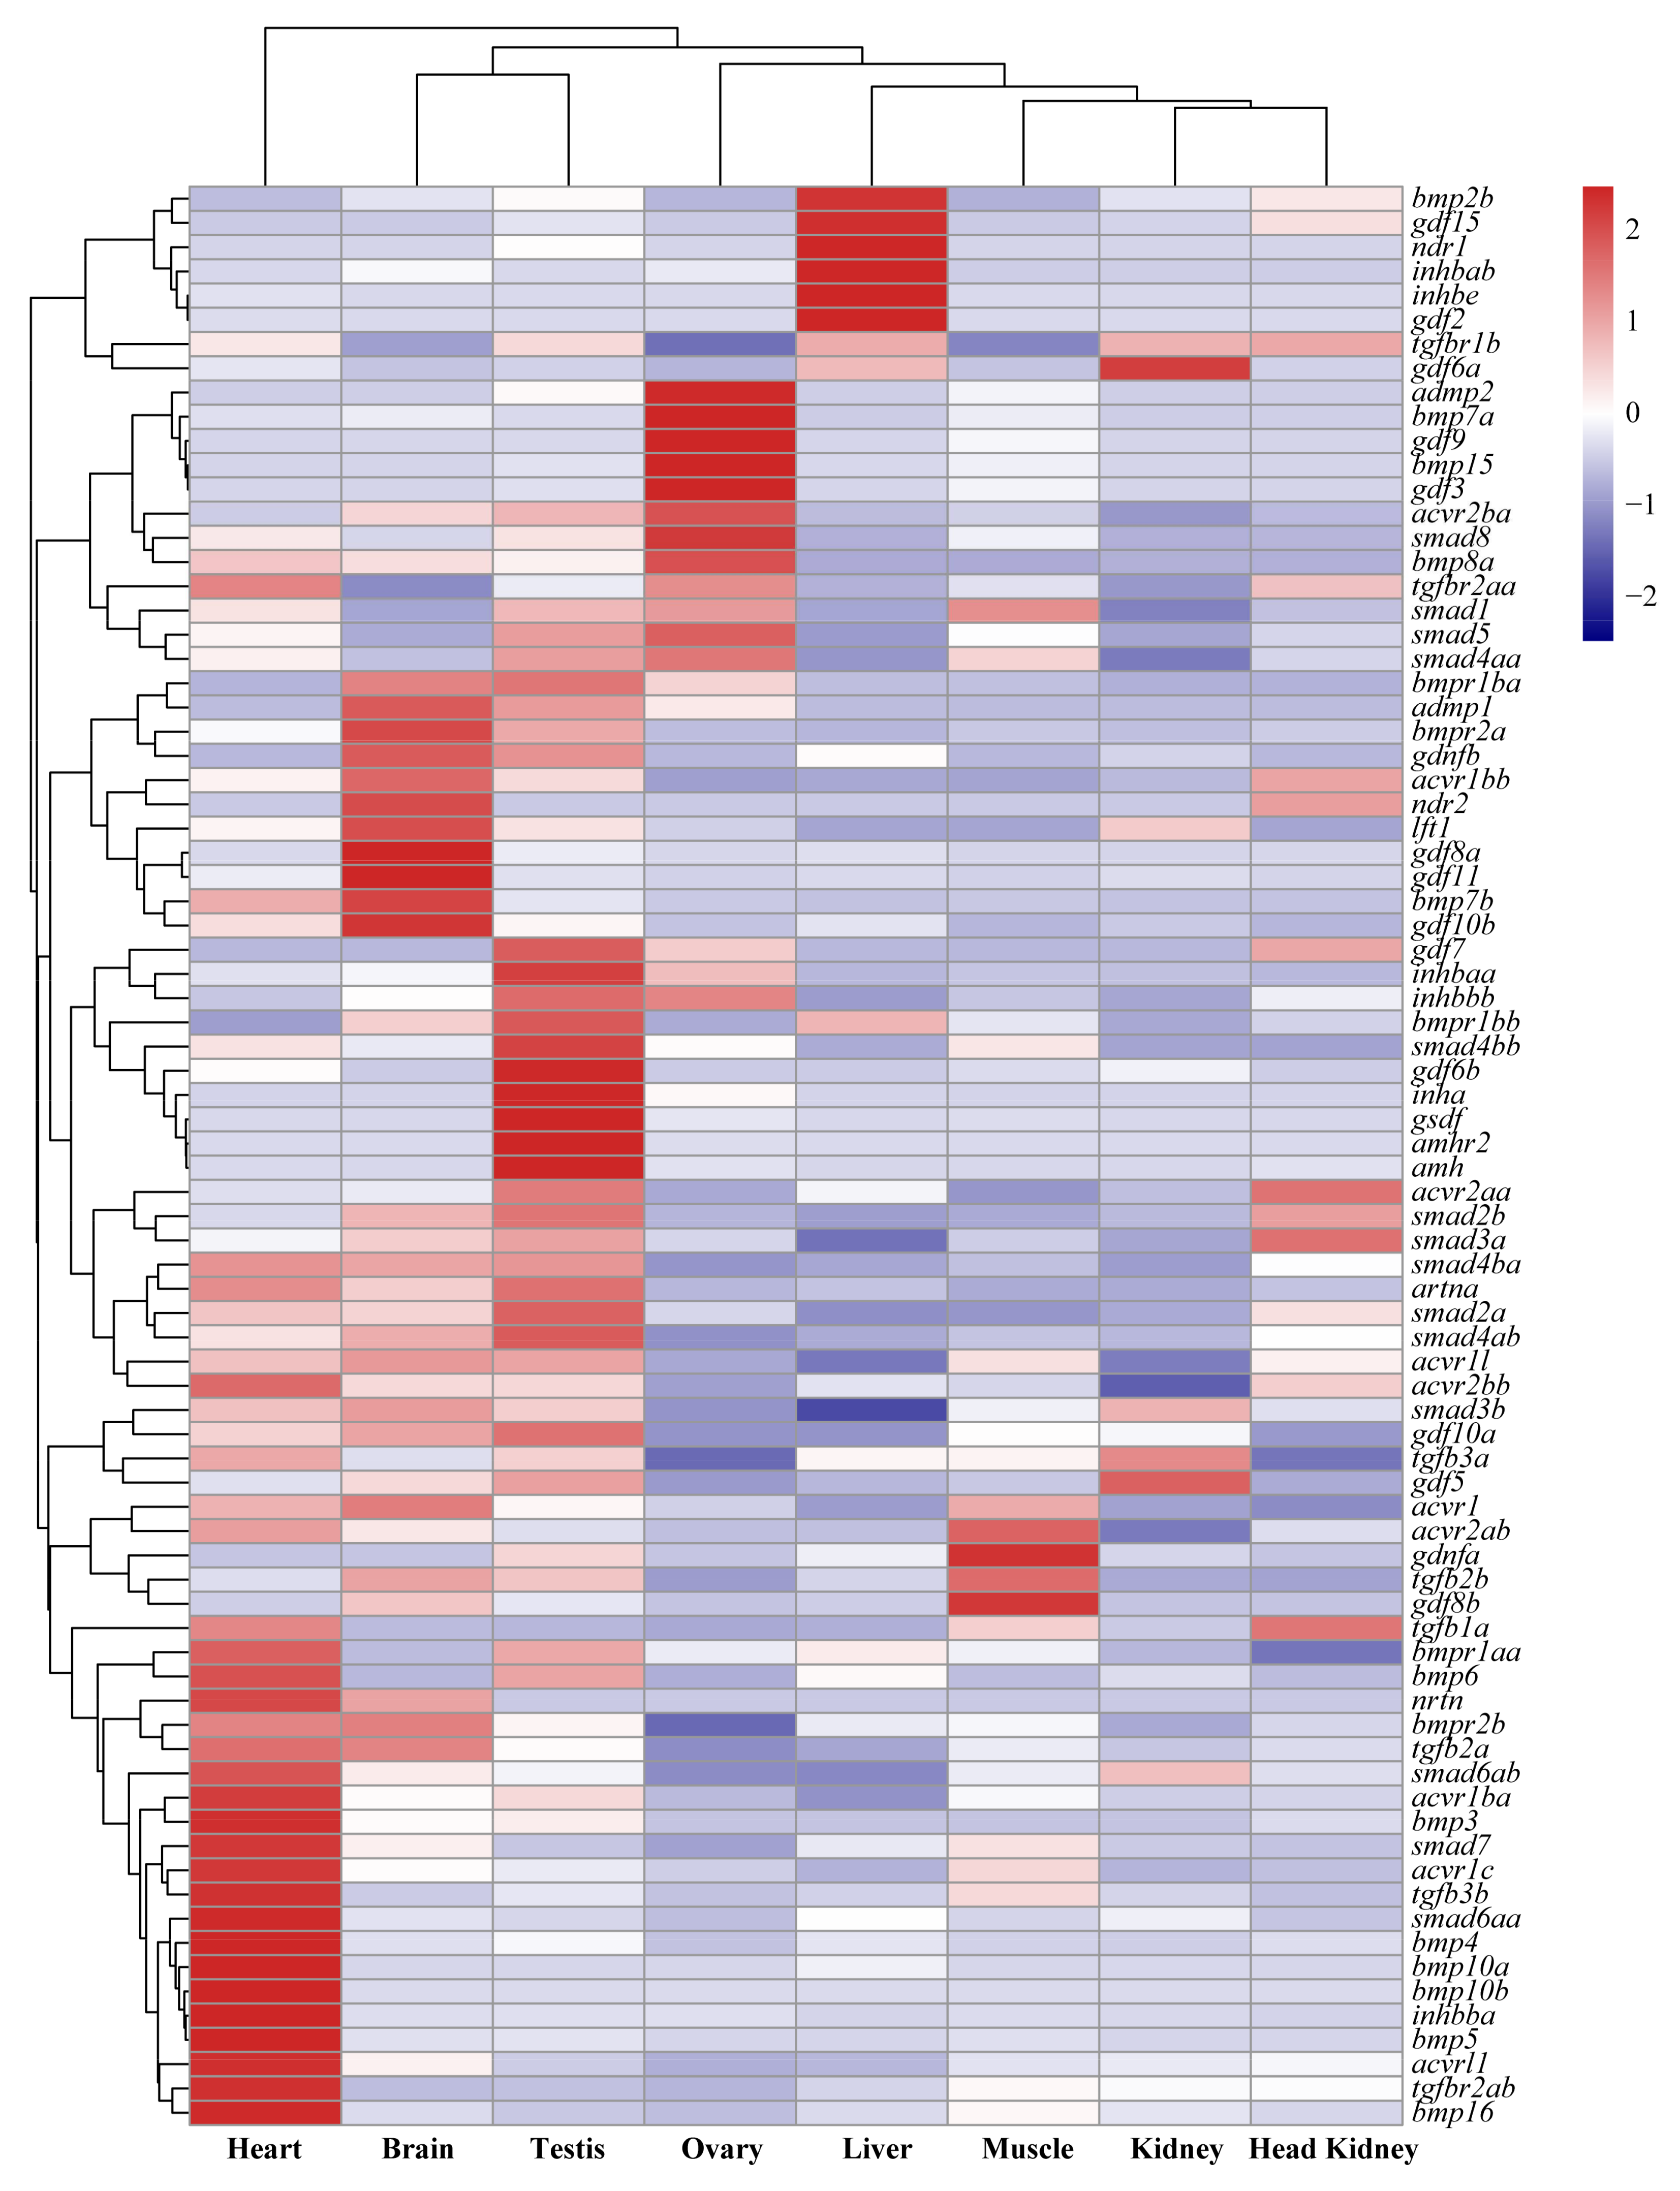
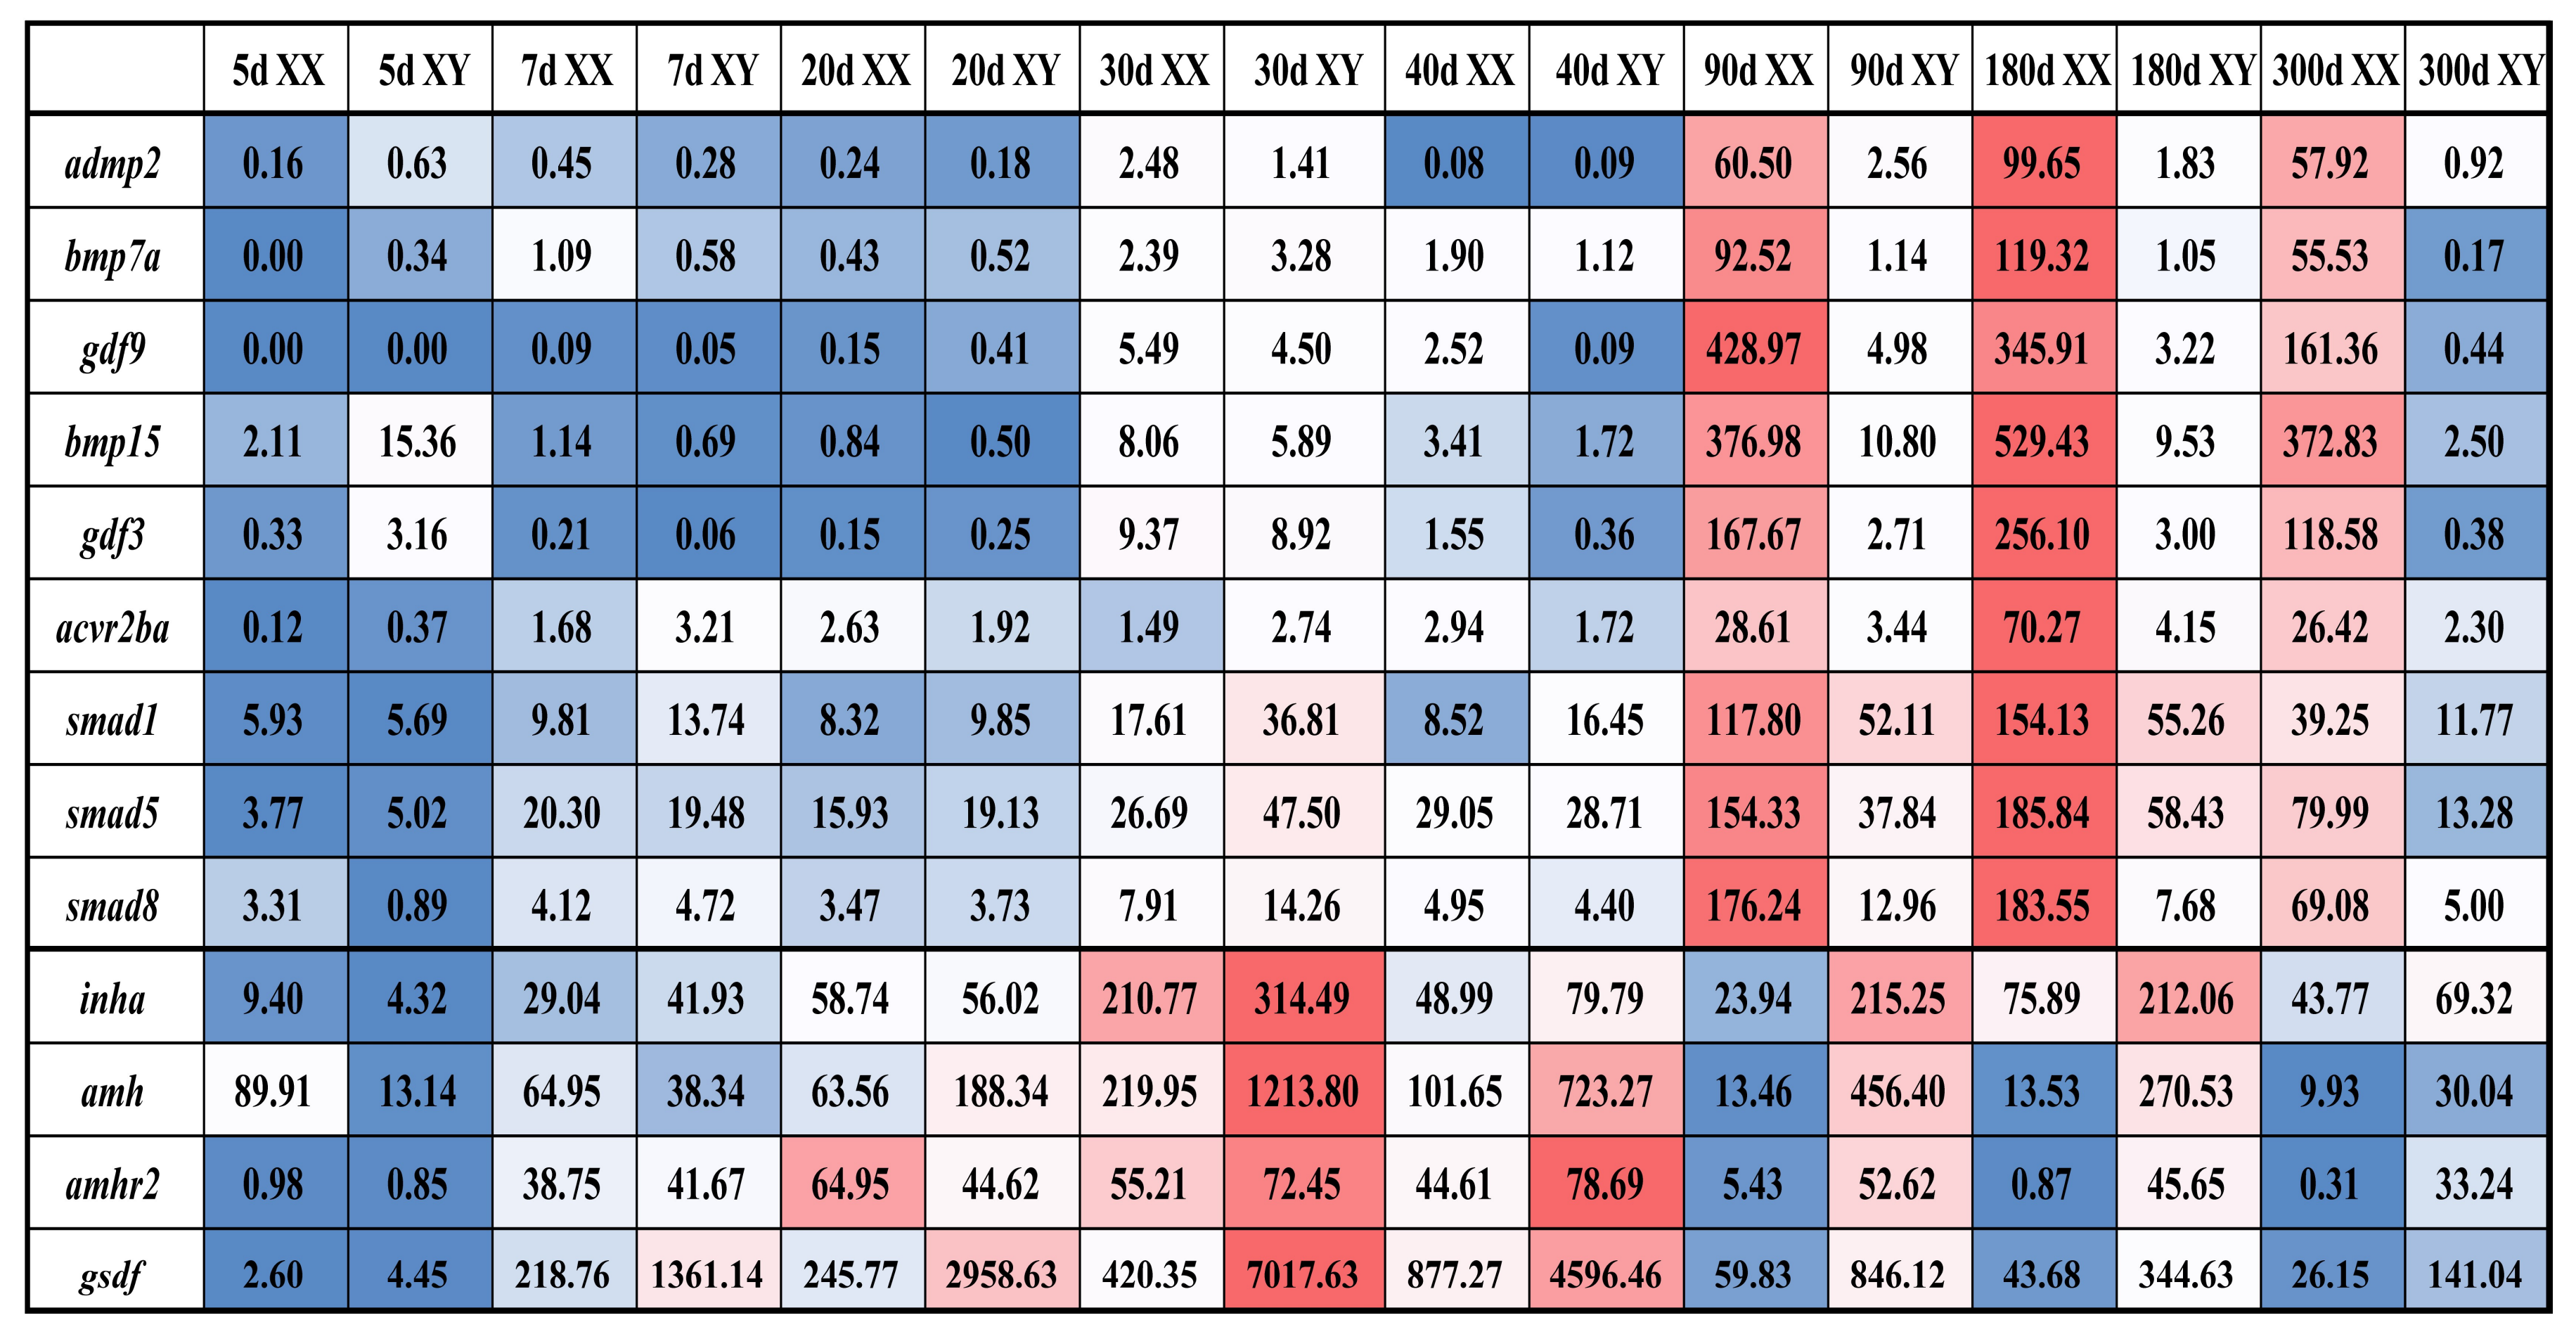
2.2. Tissue Distribution and Temporal Expression of TGF-β Pathway Members in the Tilapia Gonads

A hierarchical cluster analysis based on transcriptome data of 8 adult tissues indicated that of the 80 identified TGF-β superfamily members in tilapia, 25 were expressed at background level in all 8 tissues according to the threshold we set. Most of smads and two types of receptors were expressed in multiple tissues, while TGF-β ligands exhibited a tissue-specific expression pattern with 8 ligands in the heart, 5 in the ovary, 4 in the testis and 3 in the liver (Figure 6).
Based on transcriptome data, 13 genes highly expressed in gonads were selected for analysis of their temporal expression patterns at different developmental stages (Figure 7). The expression levels of 9 ovary-enriched genes (admp2, bmp7a, gdf9, bmp15, gdf3, acvr2ba, smad1, smad5, smad8) were found to peak at 180 dah (days after hatching), followed by 90 and 300 dah, always higher in XX than XY gonads, while at relatively low level at early stages of gonad development (5, 7, 20, 30 and 40 dah) with little difference between XX and XY gonads. Expression of 4 testis-enriched genes (inha, gsdf, amh and amhr2) was gradually elevated from 5 dah, significantly elevated from 20 dah and peaked at 30 dah. At the later stages, their expression levels were gradually decreased.

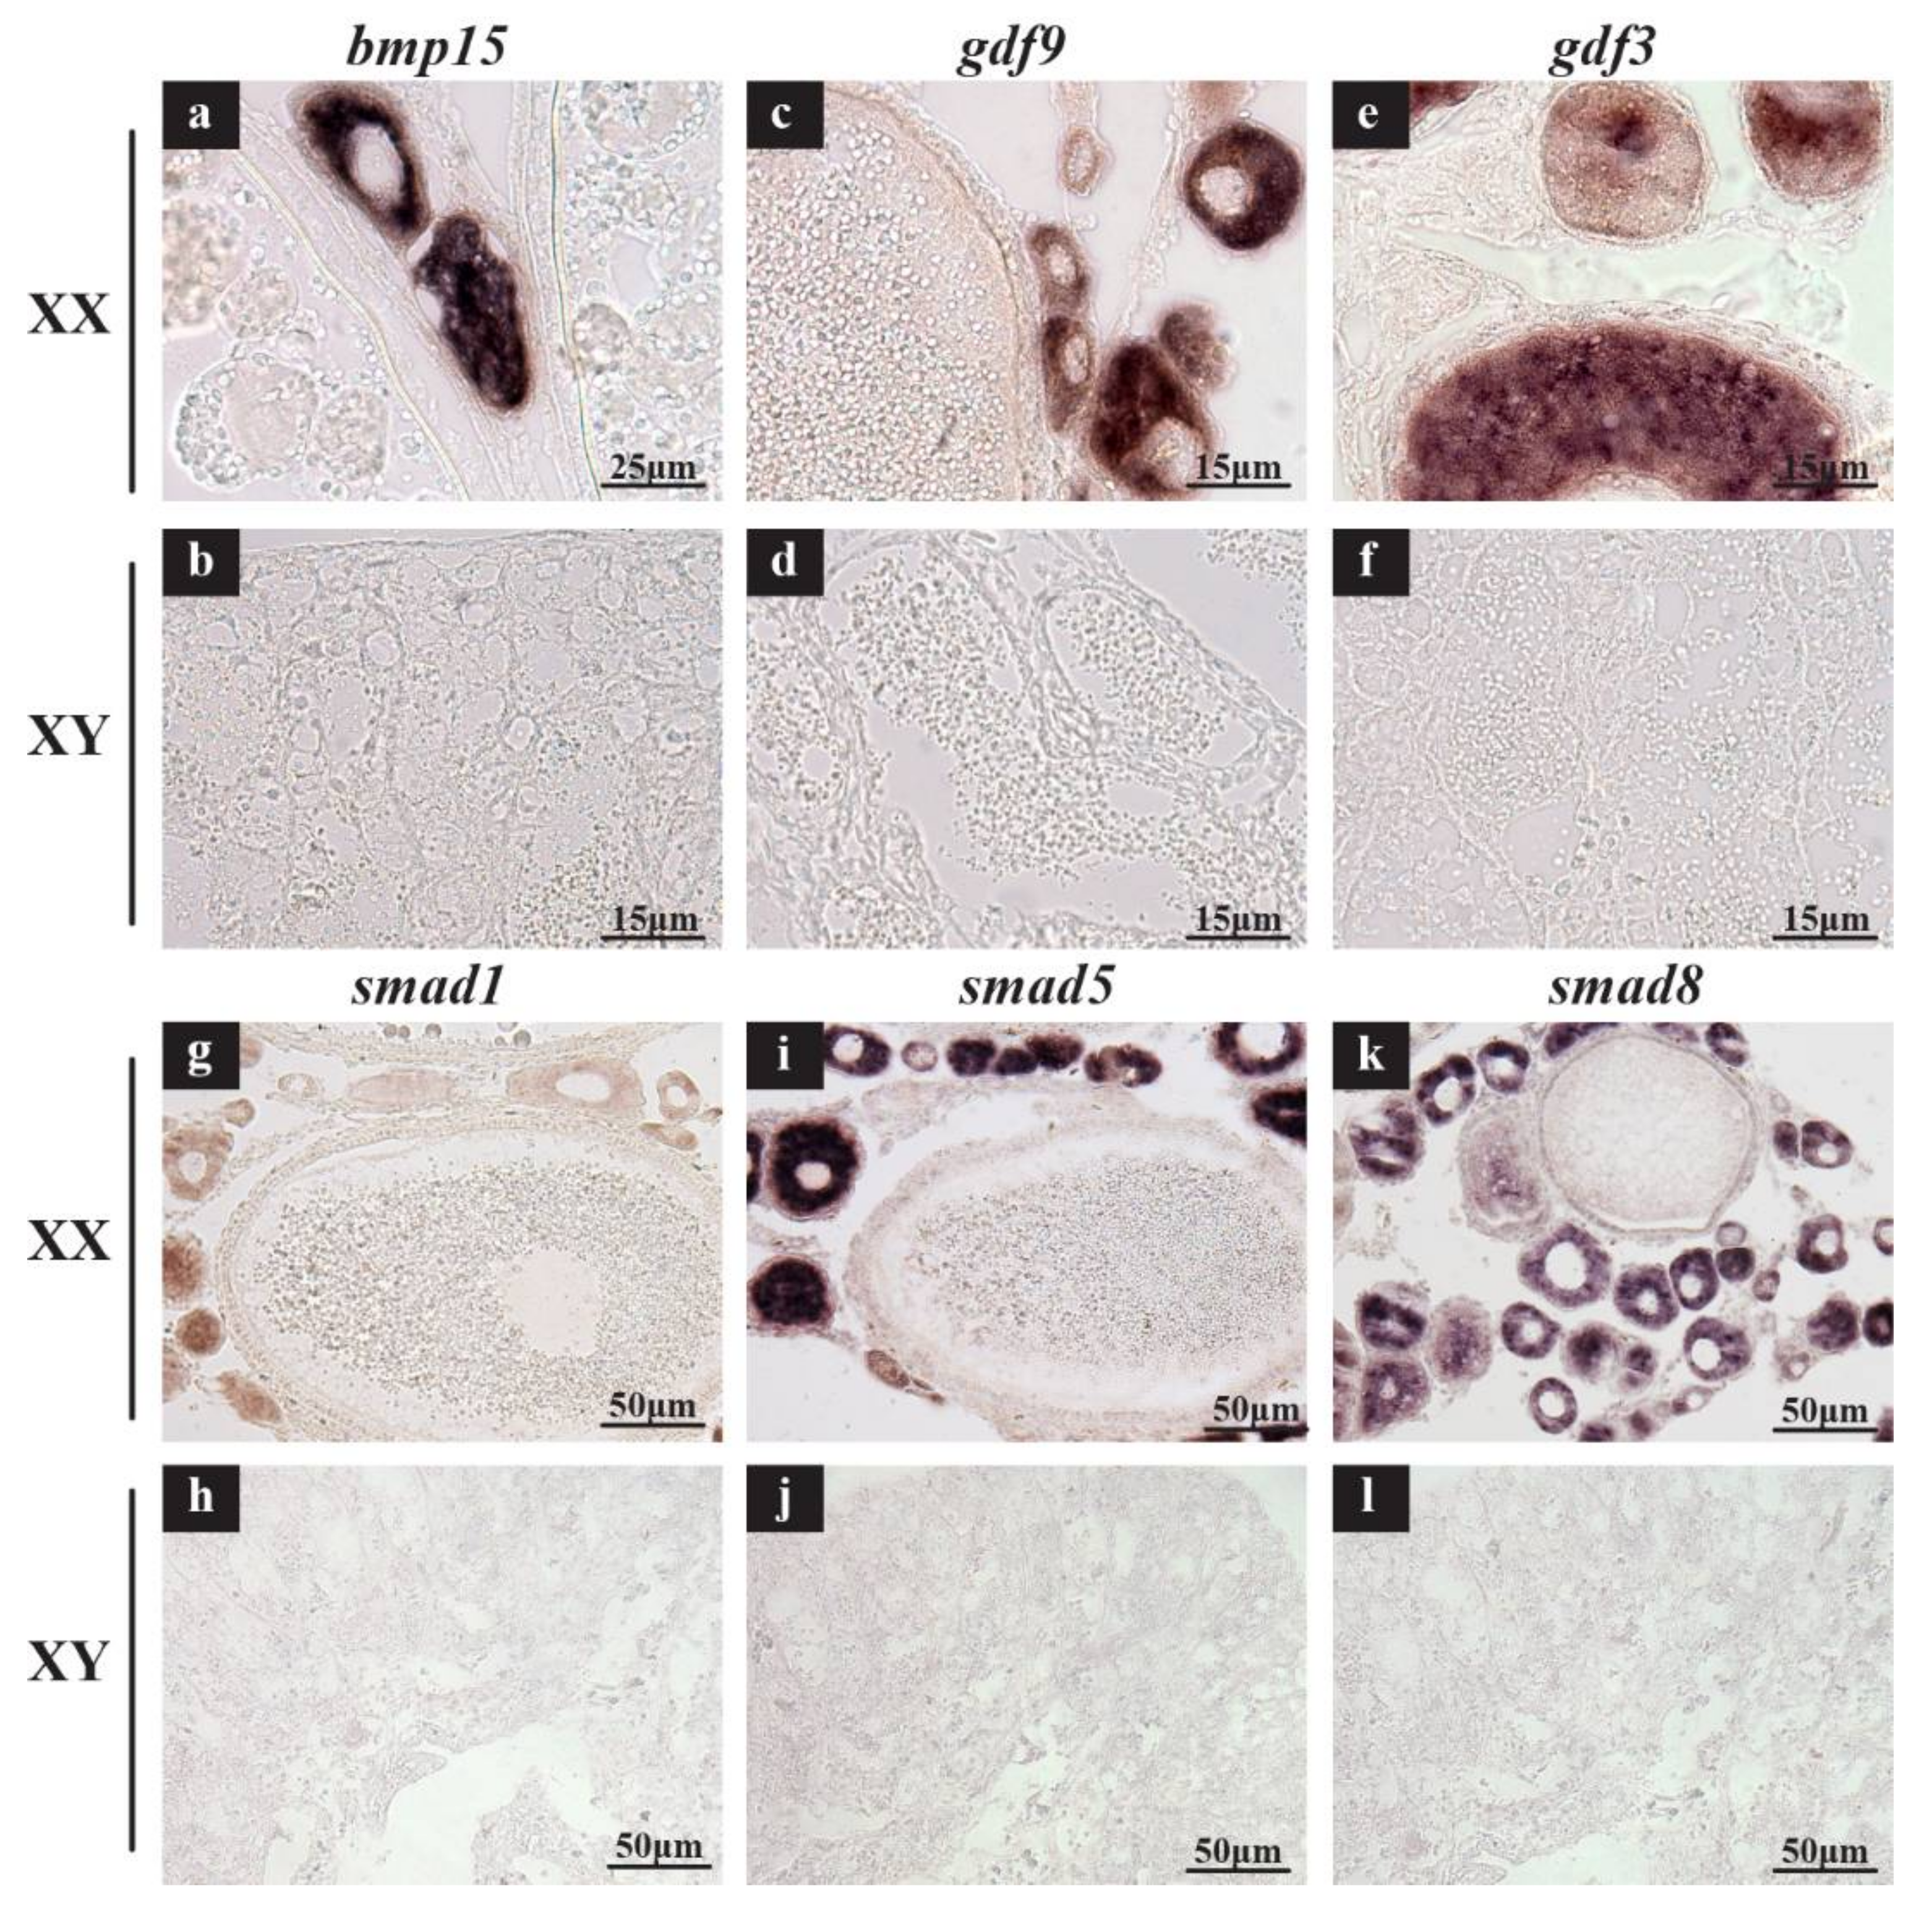
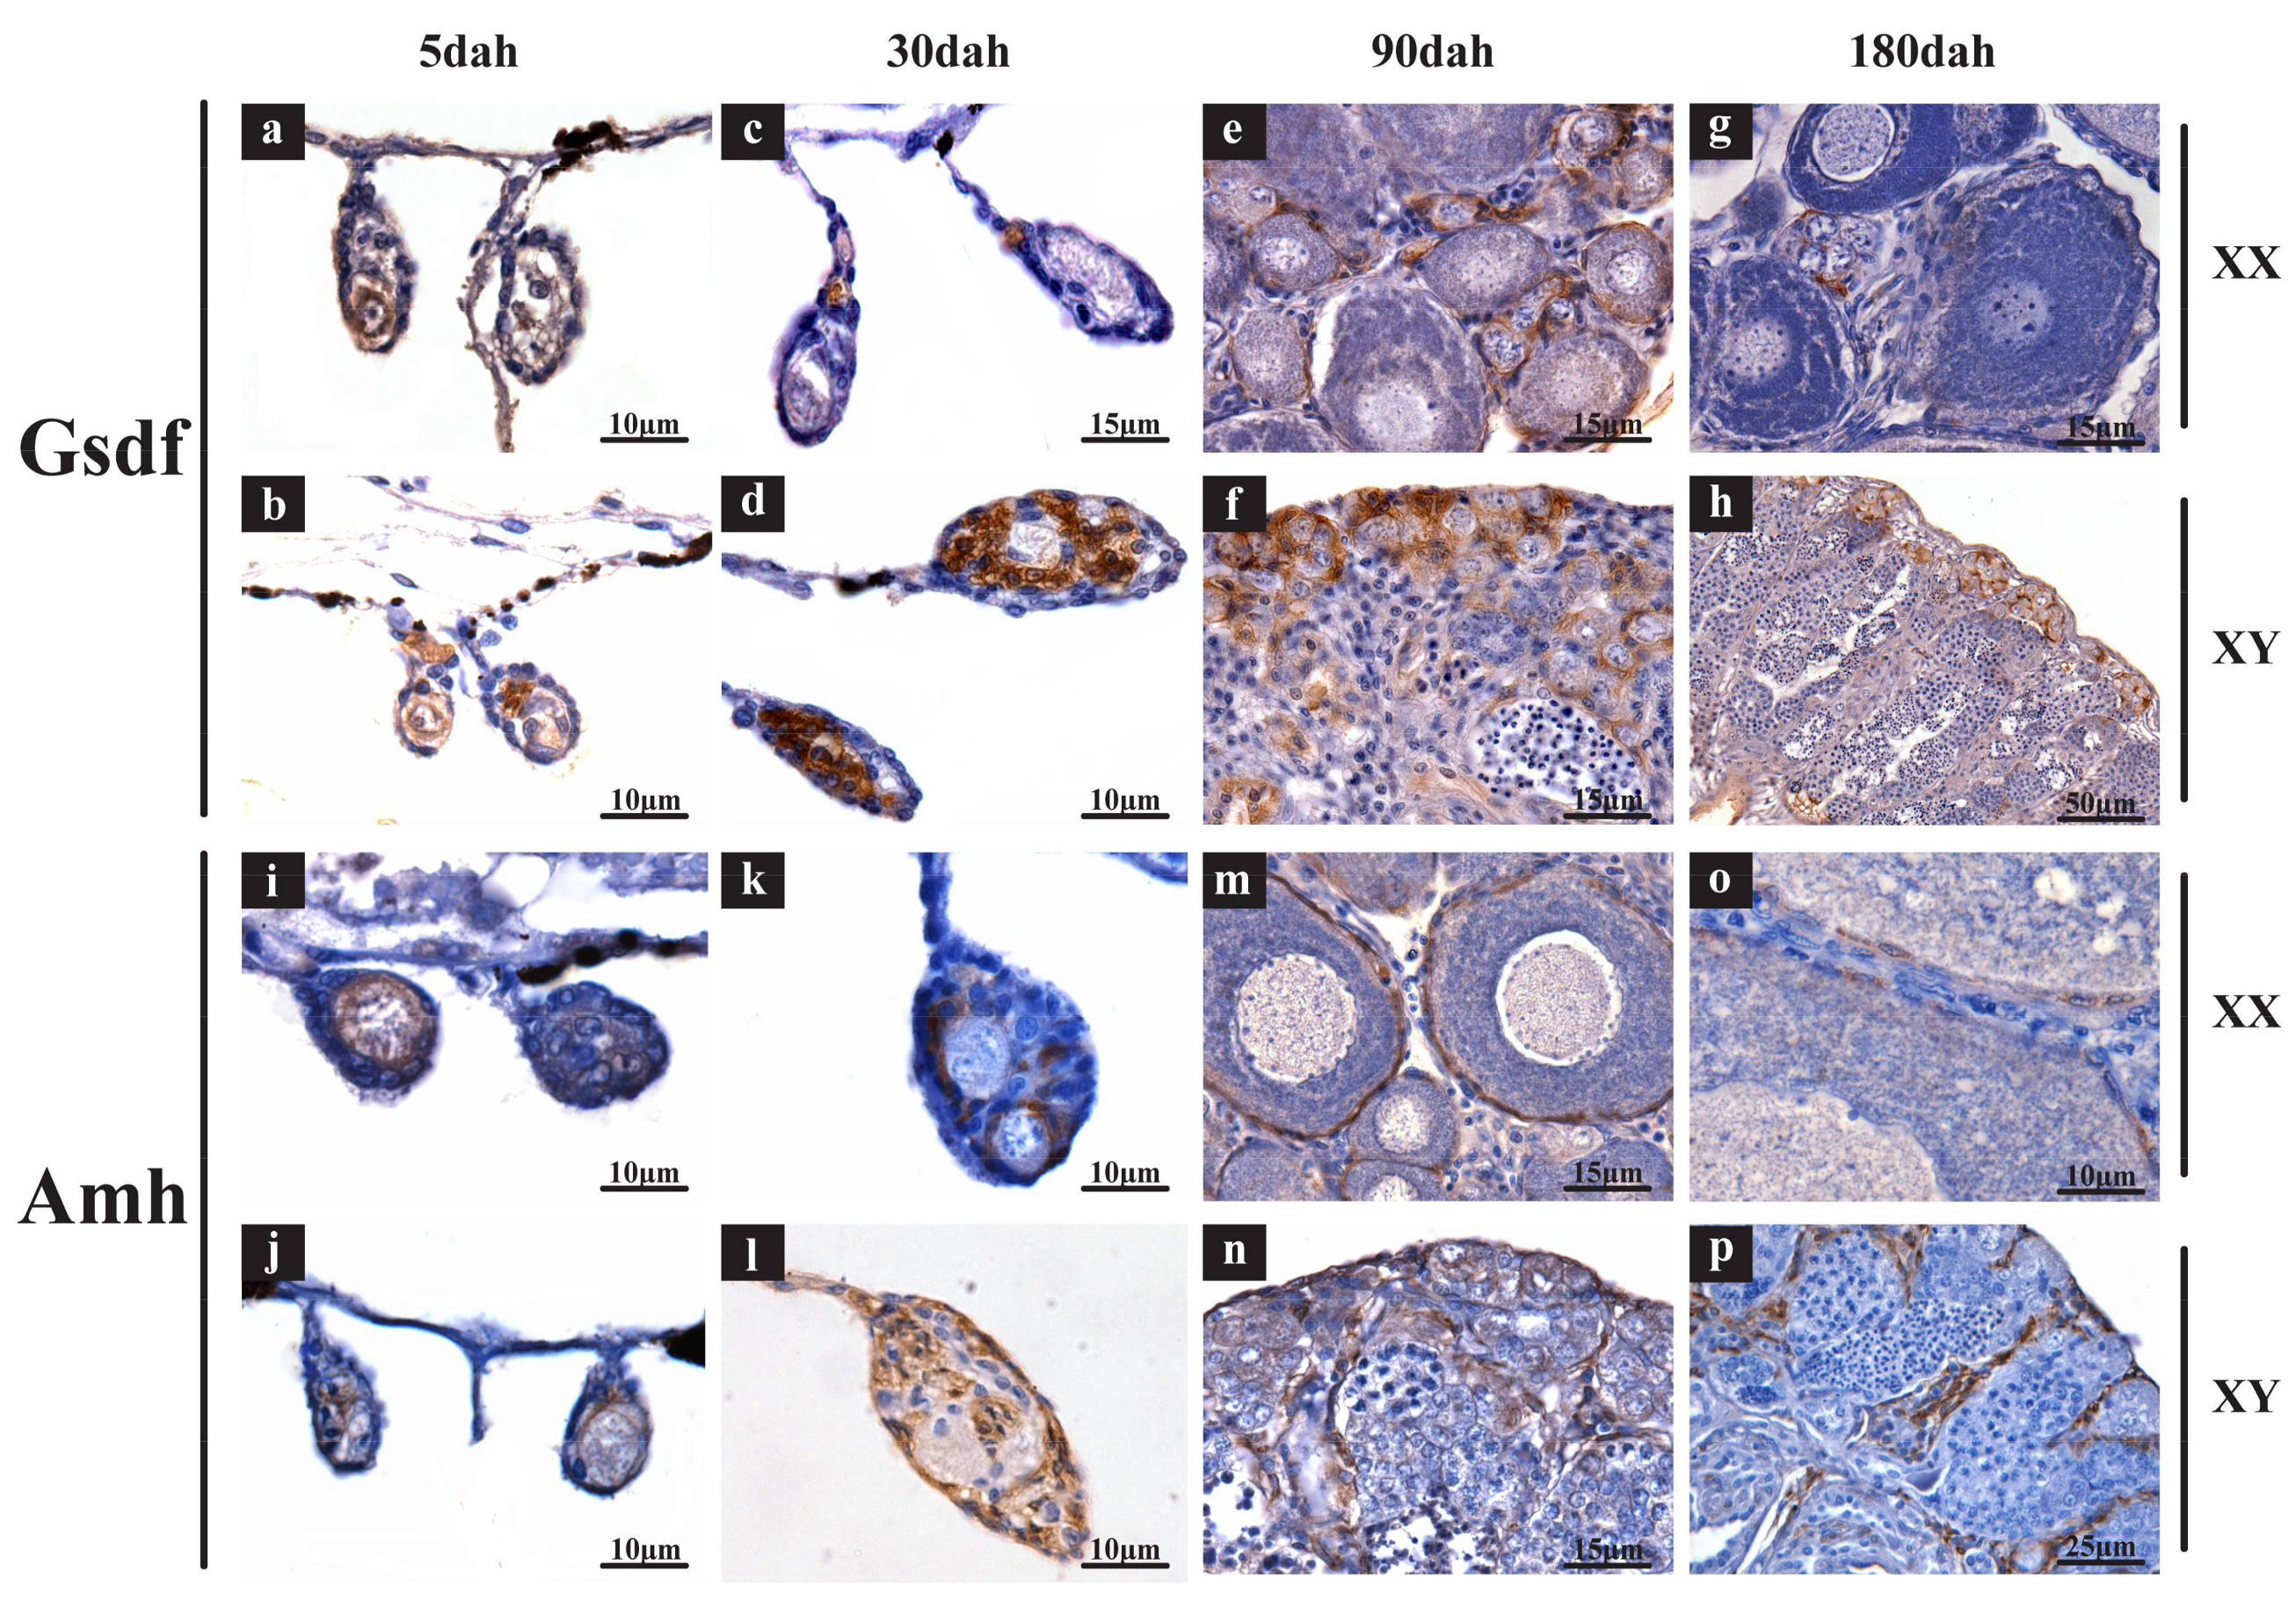
2.3. Validation of Expression Profile of TGF-β Pathway Members by qPCR and Cellular Location by In Situ Hybridization (ISH) and Immunohistochemistry (IHC)

To verify the accuracy of transcriptome data, two genes were selected for qPCR validation of their expression. Additionally, ISH and IHC were performed for several highly expressed genes to detect their cellular location in gonads. Consistently, by qPCR, the expression levels of bmp15 and gdf9 were gradually elevated during gonadal development with much higher expression in XX than XY gonads at all stages (Figure S4). By ISH, strong signals (brown) of bmp15, gdf9, gdf3, smad1, smad5 and smad8 were observed in the cytoplasm of oocytes in the ovary (Figure 8a,c,e,g,i,k), while no signal of these genes was observed in any cells of the testis (Figure 8b,d,f,h,j,l). Slides did not show a positive signal in the negative controls of all genes hybridized with sense probes (Figure S5). By IHC, Gsdf-specific immunostaining was clearly observed in the somatic cells neighboring oogonia of the XX gonads and Sertoli cells neighboring spermatogonia of the XY gonads at 5, 30, 90 and 180 dah (Figure 9a–h). The Amh proteins were located in granulosa cells in the ovary at all stages and somatic cells surrounding germ cells in the testis at 5 dah, and later stages in myoid cells and Sertoli cells (Figure 9i–p). Negative controls with the primary antibody replaced with normal rabbit serum were shown in Figure S6.

3. Discussion

The growing number of sequenced species genomes provides more resources for understanding the evolution of gene families and developmental signaling pathways. Here, we focused on the TGF-β pathway members, which play important roles in developmental specification, to retrace their origin and evolution, in particular gene duplications and losses. We also examined the expressions of all TGF-β pathway members in the eight different tissues and their ontogenic expression in XX/XY gonads of tilapia.

3.1. Evolution of the TGF-β Signaling Pathway

As has been proposed in the previous literature [21], our results supported that the appearance of the TGF-β pathway was intrinsically linked to the emergence of metazoan. In this study, we examined TGF-β pathway members in the genomes of 9 species of invertebrates and 15 species of chordates. We found that the diversity and total number of TGF-β ligands, receptors and smads only varied slightly in all invertebrates and jawless vertebrates. In contrast, expansion of the pathway members, especially ligands, was observed in jawed vertebrates (gnathostomata) most likely due to 2R event. 3R in teleosts and 4R in common carp were also observed although many TGF-β pathway members were lost after duplication with only a single copy maintained. To be exact, expansion of TGF-β ligands occurred at the early emergence of gnathostomes with retention rates approximately 70%, while it occurred at 3R in teleosts with retention rates of only approximately 20% (Figure 10a). Jawed vertebrates comprise more than 99% of living vertebrate species, including humans. Significant expansion of TGF-β pathway members may set the stage for the generation of key vertebrate evolutionary novelties (like complex brains, heart, blood, bone, cartilage, musculature, and adipose tissue). Three TGFβ isoforms are important for heart development [50,51]. Divergence of TGFB1/2/3 in the jawed vertebrates (Figure 10a) has contributed to the formation of genuine heart. Significant expansion of BMPs/GDFs (BMP2–16, GDF1–15) (Figure 10a) is related not only to bone and cartilage development (such as BMP2, BMP4 and BMP7) [52], but also to muscle growth (GDF8) [53] and gonadal development and reproduction (BMP15, GDF9) [42,54]. In addition, a novel subfamily of TGF-β ligands, GDNF, found in the jawed vertebrates (Figure 10a) is crucial for the development of vertebrate nervous system [55]. Additionally, the number of TGF-β ligands greatly exceeded the number of type I and II receptors and smads in jawed vertebrates. This could be best explained by the fact that there are more constraints on intracellular relative to the extracellular components of the signaling pathway [56]. The TGF-β ligands also radiated more than other extracellular protein families (Wnt and Notch families) of parallel importance in developmental specification. The evolutionary success of the TGF-β ligands is in part a result of its large and complex prodomain. This enables complex regulation of biological function during signaling in extracellular environments that can be layered onto cell-surface and intracellular signaling in control of agonism and antagonism [57].
In previous studies, researchers found BMP16, a BMP2/4 relative, retained in the genomes of teleosts, was a product of 3R [58]. Subsequently, its presence was reported in a large number of Neopterygii species except in Chondrichthyes and Chondrostei [59]. In the present study, we successfully isolated BMP16 in whale shark, further supported its 2R origin. Duplication of TGFB2 (TGFB2B), which was considered to be unique to teleosts in previous study [60], was also found in the elephant shark, coelacanth, and python. In line with synergy evolution, the copy of its type II receptor TGFBR2 (TGFBR2B) were not only detected in teleosts but also in elephant shark, coelacanth, spotted gar and tetrapods except mammals. Acvr1l, a novel type I receptor first identified in zebrafish [61], was found in the shark, coelacanth, spotted gar and other teleosts as well. Two SMAD4 genes were found in coelacanth, spotted gar and xenopus, and synteny analyses support their origin from genome duplication. Duplication of SMAD6 (SMAD6B) was also found in coelacanth, xenopus, python, and gecko. These phylogeny and synteny analyses results demonstrated that the duplication of the genes mentioned above all occurred from 2R. Orthologs of most TGF-β genes in vertebrates can be identified in invertebrates even though they experienced several rounds of WGD during evolution. For instance, the origin of the type I receptor can be traced to ALK1/2 and ALK4/5/7 in invertebrates, sequentially ALK4/5/7 underwent duplication forming ALK3/6, then they underwent 2R and 3R event. Only one type II receptor gene (ACVR2) was found in the early metazoan sponge and trichoplax indicating that it may be the ancestor-like molecule of type II receptors. Additionally, there were four kinds of smads, including SMAD1/5/8, SMAD2/3, SMAD4 and SMAD6/7 in invertebrates, then a whole SMAD family (SMAD1–8) generated after 2R (Figure 10b). However, some genes arose de novo at different stages of vertebrate evolution, such as AMH and subfamily GDNF in gnathostomes and GSDF in actinopterygians (Figure 10a).

3.2. Roles of TGF-β Pathway Members in Heart, Liver, Especially in Gonads

In the present study, transcriptomic analyses revealed that the majority of TGF-β superfamily members expressed in at least one tissue in tilapia, indicating their essential roles in physiological processes and homeostasis. tgfb1a, tgfb3b, tgfbr2, bmp4, bmp10a, bmp10b, bmp16 and smad7 were preferentially expressed in heart as reported in previous studies [58,65,66,67,68,69,70]. We also found inhbba, bmp5 and bmp6 were prominently expressed in heart. Gdf8b was found to be mainly expressed in the muscle. In mice, the physiological role of Gdf8, also known as myostatin, was to prevent overgrowth of muscle tissue [71]. Bmp9, expressed exclusively in the liver of tilapia, was reported to be required for liver cancer cell growth [72]. Our results also demonstrated that inhbe was prominently expressed in liver, which was consistent with the results in mouse and rat [73,74]. Overexpression of inhbe in the mouse liver can inhibit regenerative deoxyribonucleic acid synthesis of hepatic cells [75]. It was worth noting that most smads and receptors were expressed in multiple tissues while ligands exhibited a tissue-specific expression. Combining the diversity of ligands, it is possible that different ligands worked for different tissues, while the intracellular components were shared.
In tilapia gonads, bmp15, gdf9, gdf3, admp2, acvr2ba, bmp7a, smad1, smad5 and smad8 were identified as highly expressed genes in ovary, while gsdf, inha, amh and amhr2 were identified as highly expressed genes in testis. Generally, there are four key biological events occur during gonadal development of the tilapia: sex determination and differentiation at 5 dah, initiation of germ cell meiosis in ovary at 30 dah, initiation of germ cell meiosis in testis at 90 dah, and vitellogenesis in ovary and sperm maturation in testis at 180 dah [76]. Most XX-enriched genes were expressed in the germ cells of the ovary (bmp15, gdf9, gdf3 and smad1/5/8) and their expressions peaked at 180 dah indicating they are important for oogenesis. For instance, BMP15 and GDF9 are oocyte-specific growth factors which play important roles in granulosa cell development and fertility in animal models [77]. Deletion of Gdf9 results in arrest of folliculogenesis at the primary follicle stage and complete infertility in female mice [78] because the cuboidal granulosa cells fail to proliferate [54]. Admp2 and acvr2ba are also expressed highly in the ovary, indicating their possible participation in ovary development. Generally, SMAD1/5/8 are regarded as the main responsible smads for downstream mediation of BMP signaling. Existing studies have been focused on the functional role of SMAD1/5/8 as a whole, with little research exploring the role of a single smad. Their high expression in ovary from our study implied potential roles in ovary development. Targeted mutation in ovary can help elucidate the roles of these smads. Expressions of the XY-enriched genes started from 5 dah and peaked at 30 dah indicating their possible roles in male sex determination and differentiation. Some have suggested that in vertebrates, only a small number of genes, such as genes belonging to the Dmrt or Sox family, can be recruited to become the master genes of sex determination [38,79,80,81]. However, several novel sex-determining genes coding for TGF-β pathway members were recently identified in teleosts. These included a tandem duplicate of amh on the Y chromosome (amhy) in tilapia (Oreochromis niloticus) [45], a Y-linked duplicate of the amh (amhy) in pejerrey (Odontesthes hatcheri) [44], gsdf (gsdfY) in medaka (Oryzias luzonensis) [46] and gdf6 (gdf6Y) in killifish (Nothobranchius furzeri) [47]. Even in Oryzias latipes and Oryzias dancena which use Dmy and Sox3Y as sex-determining gene, respectively, mutation of gsdf and amhr2 also induced sex reversal [43,82]. Overexpressing gsdf, a ray-finned fish-specific gene, in medaka and tilapia developing gonads converted XX individuals into functional males [38,39], while knockout of gsdf in XY fish of these two species resulted in male to female sex reversal [40,41] suggesting a conserved role of gsdf in testicular development. Additionally, in zebrafish whose sex-determining gene has not yet been identified, female deficiency of bmp15 switched sex and became fertile males [42]. These data highlight the significant role for TGF-β signaling pathway in teleost sex determination. Additionally, transcriptome data in tilapia showed that inha was exclusively expressed in the gonads, with higher expression in the testis than ovary. One possible role of inha in the ovary might be a mediator between GTH (gonadotropic hormone, including FSH and LH) and gdf9 to control oogenesis as already proved in zebrafish [83]. However, its role in the testis need further investigations. AMH functions primarily through the type II receptor AMHR2 [84]. Previous reports suggested that AMH/AMHR2 signaling plays an important role in fish sex determination [43,45,85]. Interestingly enough, AMHR2 was not identified in Chimaeriformes (elephant shark, whale shark) and Cypriniformes, at least in Cyprinidae (zebrafish, common carp, grass carp, bluntnose black bream), even though they had the ligand AMH, which indicated that AMHR2 probably first appeared in Osteichthyes and was lost secondarily in Cyprinidae after 2R. We speculated that another type II receptor, most likely BMPR2, might be recruited as AMH receptor in these species. It is worth noting that zebrafish has different sex determination mechanism compared to the other teleosts which may be attributed to the absence of AMHR2.
In this study, the temporal and spatial expression profiles from transcriptome data were validated by examination of eight TGF-β pathway genes, bmp15, gdf9, gdf3, smad1, smad5, smad8, gsdf and amh by qPCR, ISH and IHC. All displayed similar ontogeny expression patterns as those from transcriptome data. In addition, gsdf and amh were identified as XY-enriched genes in this study, which were consistent with the results reported previously in medaka and tilapia [40,45]. The tissue distribution of TGF-βs and Inhibins in tilapia agreed well with that reported in mammals [86,87,88]. Furthermore, the expression profiles of TGF-β family members based on the gonadal transcriptome data from our group [76] and from adult fish downloaded from NCBI [89] were quite similar. All these results provided useful data for further study of the function of this signaling pathway in the animal kingdom, especially in teleosts.

4. Materials and Methods

4.1. Identification of TGF-β Pathway Members in Representative Animal Species

We examined the genomes of 24 representative animal species (sponges, trichoplax, jellyfish, tapeworm, nematode, leech, oyster, fruit fly, common urchin, vase tunicate, lancelet, lamprey, elephant shark, coelacanth, spotted gar, tilapia, medaka, fugu, zebrafish, common carp, western clawed frog, Burmese python, chicken and human) to identify TGF-β pathway members in each species. The genomic sequences of all species are available at the NCBI and Ensembl database. All members were identified by tblastn (E = 2 × 10⁻⁵) against genome sequences, using zebrafish and human TGF-β members as the query sequences.

4.2. Phylogenetic Analyses and Genomic Distribution

The amino acid sequences of TGF-β pathway members were aligned by Clustal X with default parameters using the multiple alignment software BioEdit (Carlsbad, USA) [90]. Phylogenetic trees were generated by the maximum likelihood (ML) method using the program MEGA 6.0 software (Tempe, USA) [91] with a bootstrap of 1000 replicates to assess the confidence in the phylogeny [92].
Genomic distribution of TGF-β pathway members was performed using UCSC Blat search (Available online: http://genome.ucsc.edu/cgi-bin/hgBlat) [93]. Position and orientation of smad4 and its adjacent genes on chromosome were determined using Genomicus (Available online: http://www.genomicus.biologie.ens.fr/genomicus-89.01/cgi-bin/search.pl) [94].

4.3. Expression Analyses of Tilapia TGF-β Pathway Members in Adult Tissues and Gonads at Different Developmental Stages

The transcriptomes of brain, heart, liver, ovary, testis, kidney, muscle and head kidney of adult tilapia were downloaded from the NCBI database (Accession codes: PRJNA78915 and SRR1916191) [4,89]. A normalized measure of FPKM (fragments per kilobase of exon per million fragments mapped) was used to normalize the expression profiles of TGF-β pathway members. TGF-β pathway members with a threshold of RPKM value ≥ 1.25 in each tissue or the total FPKM ≥ 10 in all eight tissues were used to determine a reasonable expression [95]. Bidirectional hierarchical clustering analyses were performed using the pheatmap package (Available online: https://cran.r-project.org/web/packages/pheatmap/index.html) in R language to cluster gene expression values and tissues [96,97]. Tissue distribution (FPKM) of TGF-β pathway members in eight adult tissues of tilapia are listed in Table S3.
Eight pairs of XX and XY gonadal transcriptomes from tilapia at eight developmental stages, 5, 7, 20, 30, 40, 90, 180, 300 dah (days after hatching) were sequenced in our previous study [88]. TGF-β pathway members with RPKM < 1.25 in each sample or the total FPKM < 20 in 16 transcriptomes from eight developmental stages were considered arbitrarily as background expression. Standards and identification of XX/XY-enriched genes of the TGF-β pathway members were performed as described previously [95]. Two-tailed Student’s t-test was used to compare the expression difference of TGF-β pathway members between testis and ovary, and p < 0.05 was considered statistically significant.

4.4. Validation of Expression Profile of TGF-β Pathway Members by qPCR and Cellular Location by ISH and IHC

Ontogeny expression of bmp15 and gdf9 was examined by qPCR. Gonads were dissected from XX and XY tilapia at 5, 30, 90, 180 dah (about 2–200 gonads were collected at each time point depending on the gonad size). Three replicates were uesd for each stage. The mRNAs were extracted and reverse transcribed into cDNA according to the protocol described previously [98]. qPCR examination was carried out according to the manufacturer’s protocol of The SYBR Green I Master Mix (TaKaRa, Dalian, China). Three genes (β-actin, gapdh and eef1a1a) of tilapia were used as internal controls to normalize the expression of the two genes. The Data are presented as mean ± SD. Statistical significance was defined by one-way analysis of variance (ANOVA) followed by post hoc test using the statistical package GraphPad Prism (GraphPad Software, Inc., La Jolla, USA), and p < 0.05 was considered statistically significant.
Bmp15, gdf9, gdf3 and smad1/5/8 were XX-enriched genes from our transcriptome data. To ascertain which population of cells in gonads expressed these genes, ISH was performed using tilapia ovaries and testes at 180 dah. The fixation, embedding, sectioning of dissected gonads and ISH were performed as described previously [99]. Probes of sense and antisense digoxigenin (DIG)-labeled RNA strands were transcribed in vitro from linearized pGEM-T easy-bmp15/gdf9/gdf3/smad1/smad5/smad8 cDNA using a RNA labeling kit (Roche, Mannheim, Germany).
Gsdf and amh were XY-enriched genes from our transcriptome data. To locate the cellular expression pattern of the two genes in the developing gonads, IHC was performed using tilapia ovaries and testes at 5, 30, 90 and 180 dah. Gonads were collected and fixed in Bouin’s solution overnight, and then dehydrated, embedded in paraffin and sectioned at 5 μm thickness. Gsdf and Amh polyclonal antibodies for tilapia prepared by our group were used to examine their respective expression in tilapia gonads at 1:1000 and 1:500 dilution, respectively [41,45]. For the negative control, the primary antibody was replaced with normal rabbit serum. The sections were incubated with a second antibody (goat anti-rabbit IgG) conjugated with horseradish peroxidase (Bio-Rad, Hercules, CA, USA) at 1:2000. Immunoreactive signals were visualized using diaminobenzidine (Sigma, Burlington, MA, USA) as substrate. An Olympus BX51 light microscope (Olympus, Tokyo, Japan) was used to image the stained sections. Sequences of primers and probes used for qPCR and ISH, respectively, are listed in Table S4.

5. Conclusions

In summary, we have performed a detailed mining of TGF-β signaling pathway across 24 animal species genomes. As shown in Figure 10, the TGF-β signaling pathway appeared in the earliest-diverged multicellular animals. The total number of TGF-β ligands, receptors and smads changed slightly in invertebrates and jawless vertebrates. In contrast, expansion of the pathway members, especially ligands, was observed in jawed vertebrates due to 2R event. Duplications of TGF-β members were also observed from 3R in teleosts. Type II receptors may be originated from the ACVR2-like ancestor. Additionally, transcriptome data showed that most smads and receptors were expressed in multiple tissues while the ligands exhibited a tissue-specific expression especially in heart and gonads. Combining the diversity of ligands, it is possible that the intracellular components were shared by different ligands. Taken together, these results present a thorough overview of TGF-β signaling pathway and provide a new perspective on the origin, evolution, and expression of this family in the animal kingdom, especially in vertebrates.

Supplementary Materials

Supplementary materials can be found at https://www.mdpi.com/1422-0067/19/4/1154/s1.

Acknowledgments

This work was supported by grants 31630082 and 31502147 from the National Natural Science Foundation of China; grant cstc2015jcyjB80001 from the Natural Science Foundation Project of Chongqing, Chongqing Science and Technology Commission.

Author Contributions

Deshou Wang, Shuqing Zheng and Juan Long together conceived and designed the experiments; Shuqing Zheng, Juan Long and Zhilong Liu analyzed the data, performed the experiments, interpreted the results, and drafted the manuscript; Wenjing Tao critiqued the manuscript for important intellectual content; Deshou Wang drafted and critically edited the manuscript. All authors read and approved the final manuscript.

Conflicts of Interest

The authors declare no conflict of interest.

Abbreviations

WGDwhole genome duplication
TGF-βtransforming growth factor β
BMPbone morphogenetic proteins
GDFgrowth and differentiation factor
1Rfirst round of genome duplication
2Rsecond round of genome duplication
3Rthird round of genome duplication
4Rfourth round of genome duplication
SMADcomposite name from Sma (Caenorhabditis elegans) and Mad (Drosophila melanogaster)
R-SMADreceptor-regulated smad
Co-SMADcommon smad
I-SMADinhibitory smad
ALKactivating receptor-like kinase
Gsdfgonadal soma-derived factor
Amhanti-Müllerian hormone
RNA-seqRNA sequencing
SRASequence Read Archive
FPKMfragments per kilobase of exon per million fragments mapped
ISHin situ hybridization
qPCRquantitative real time polymerase chain reaction
RT-PCRreverse transcription PCR

References

  1. Ohno, S. Evolution by Gene Duplication; Springer: Berlin/Heidelberg, Germany, 1970. [Google Scholar]
  2. Magadum, S.; Banerjee, U.; Murugan, P.; Gangapur, D.; Ravikesavan, R. Gene duplication as a major force in evolution. J. Genet. 2013, 92, 155–161. [Google Scholar] [CrossRef] [PubMed]
  3. Huminiecki, L.; Heldin, C.H. 2R and remodeling of vertebrate signal transduction engine. BMC Biol. 2010, 8, 146. [Google Scholar] [CrossRef] [PubMed]
  4. Cheng, Y.Y.; Tao, W.J.; Chen, J.L.; Sun, L.N.; Zhou, L.Y.; Song, Q.; Wang, D.S. Genome-wide identification, evolution and expression analysis of nuclear receptor superfamily in Nile tilapia, Oreochromis niloticus. Gene 2015, 569, 141–152. [Google Scholar] [CrossRef] [PubMed]
  5. Hoegg, S.; Brinkmann, H.; Taylor, J.S.; Meyer, A. Phylogenetic timing of the fish-specific genome duplication correlates with the diversification of teleost fish. J. Mol. Evol. 2004, 59, 190–203. [Google Scholar] [CrossRef] [PubMed]
  6. Escriva, H.; Manzon, L.; Youson, J.; Laudet, V. Analysis of lamprey and hagfish genes reveals a complex history of gene duplications during early vertebrate evolution. Mol. Biol. Evol. 2002, 19, 1440–1450. [Google Scholar] [CrossRef] [PubMed]
  7. Kuraku, S.; Meyer, A.; Kuratani, S. Timing of genome duplications relative to the origin of the vertebrates: Did cyclostomes diverge before or after? Mol. Biol. Evol. 2009, 26, 47–59. [Google Scholar] [CrossRef] [PubMed]
  8. Chiu, C.H.; Dewar, K.; Wagner, G.P.; Takahashi, K.; Ruddle, F.; Ledje, C.; Bartsch, P.; Scemama, J.L.; Stellwag, E.; Fried, C.; et al. Bichir HoxA cluster sequence reveals surprising trends in ray-finned fish genomic evolution. Genome Res. 2004, 14, 11–17. [Google Scholar] [CrossRef] [PubMed]
  9. Berthelot, C.; Brunet, F.; Chalopin, D.; Juanchich, A.; Bernard, M.; Noel, B.; Bento, P.; Da Silva, C.; Labadie, K.; Alberti, A.; et al. The rainbow trout genome provides novel insights into evolution after whole-genome duplication in vertebrates. Nat. Commun. 2014, 5, 3657. [Google Scholar] [CrossRef] [PubMed]
  10. Xu, P.; Zhang, X.; Wang, X.; Li, J.; Liu, G.; Kuang, Y.; Xu, J.; Zheng, X.; Ren, L.; Wang, G.; et al. Genome sequence and genetic diversity of the common carp, Cyprinus carpio. Nat. Genet. 2014, 46, 1212–1219. [Google Scholar] [CrossRef] [PubMed]
  11. Dehal, P.; Boore, J.L. Two rounds of whole genome duplication in the ancestral vertebrate. PLoS Biol. 2005, 3, e314. [Google Scholar] [CrossRef] [PubMed] [Green Version]
  12. Ogino, Y.; Kuraku, S.; Ishibashi, H.; Miyakawa, H.; Sumiya, E.; Miyagawa, S.; Matsubara, H.; Yamada, G.; Baker, M.E.; Iguchi, T. Neofunctionalization of androgen receptor by gain-of-function mutations in teleost fish lineage. Mol. Biol. Evol. 2016, 33, 228–244. [Google Scholar] [CrossRef] [PubMed]
  13. Rabier, C.E.; Ta, T.; Ane, C. Detecting and locating whole genome duplications on a phylogeny: A probabilistic approach. Mol. Biol. Evol. 2014, 31, 750–762. [Google Scholar] [CrossRef] [PubMed]
  14. Newfeld, S.J.; Wisotzkey, R.G.; Kumar, S. Molecular evolution of a developmental pathway: Phylogenetic analyses of transforming growth factor-beta family ligands, receptors and Smad signal transducers. Genetics 1999, 152, 783–795. [Google Scholar] [PubMed]
  15. Sawatari, E.; Shikina, S.; Takeuchi, T.; Yoshizaki, G. A novel transforming growth factor-beta superfamily member expressed in gonadal somatic cells enhances primordial germ cell and spermatogonial proliferation in rainbow trout (Oncorhynchus mykiss). Dev. Biol. 2007, 301, 266–275. [Google Scholar] [CrossRef] [PubMed]
  16. Schlunegger, M.P.; Grutter, M.G. An unusual feature revealed by the crystal structure at 2.2 A resolution of human transforming growth factor-beta 2. Nature 1992, 358, 430–434. [Google Scholar] [CrossRef] [PubMed]
  17. Morikawa, M.; Derynck, R.; Miyazono, K. TGF-β and the TGF-β family: Context-dependent roles in cell and tissue physiology. Cold Spring Harb. Perspect. Biol. 2016, 8, a021873. [Google Scholar] [CrossRef] [PubMed]
  18. Feng, X.H.; Derynck, R. Specificity and versatility in TGF-β signaling through Smads. Annu. Rev. Cell Dev. Biol. 2005, 21, 659–693. [Google Scholar] [CrossRef] [PubMed]
  19. Hata, A.; Chen, Y.G. TGF-β signaling from receptors to smads. Cold Spring Harb. Perspect. Biol. 2016, 8, a022061. [Google Scholar] [CrossRef] [PubMed]
  20. Patterson, G.I.; Padgett, R.W. TGF beta-related pathways. Roles in Caenorhabditis elegans development. Trend. Genet. 2000, 16, 27–33. [Google Scholar] [CrossRef]
  21. Pang, K.; Ryan, J.F.; Baxevanis, A.D.; Martindale, M.Q. Evolution of the TGF-β signaling pathway and its potential role in the ctenophore, Mnemiopsis leidyi. PLoS ONE 2011, 6, e24152. [Google Scholar] [CrossRef] [PubMed]
  22. Upadhyay, A.; Moss-Taylor, L.; Kim, M.J.; Ghosh, A.C.; O’Connor, M.B. TGF-β family signaling in Drosophila. Cold Spring Harb. Perspect. Biol. 2017, 9, a022152. [Google Scholar] [CrossRef] [PubMed]
  23. Savage-Dunn, C.; Padgett, R.W. The TGF-β family in Caenorhabditis elegans. Cold Spring Harb. Perspect. Biol. 2017, 9, a022178. [Google Scholar] [CrossRef] [PubMed]
  24. Schmierer, B.; Hill, C.S. TGFβ-SMAD signal transduction: Molecular specificity and functional flexibility. Nat. Rev. Mol. Cell Biol. 2007, 8, 970–982. [Google Scholar] [CrossRef] [PubMed]
  25. Huminiecki, L.; Goldovsky, L.; Freilich, S.; Moustakas, A.; Ouzounis, C.; Heldin, C.H. Emergence, development and diversification of the TGF-β signalling pathway within the animal kingdom. BMC Evol. Biol. 2009, 9, 28. [Google Scholar] [CrossRef] [PubMed]
  26. Heldin, C.H.; Moustakas, A. Signaling receptors for TGF-β family members. Cold Spring Harb. Perspect. Biol. 2016, 8, a022053. [Google Scholar] [CrossRef] [PubMed]
  27. Du, X.; Liu, Y.; Liu, J.; Zhang, Q.; Wang, X. Evolution history of duplicated smad3 genes in teleost: Insights from Japanese flounder, Paralichthys olivaceus. PeerJ 2016, 4, e2500. [Google Scholar] [CrossRef] [PubMed]
  28. Smith, J.J.; Kuraku, S.; Holt, C.; Sauka-Spengler, T.; Jiang, N.; Campbell, M.S.; Yandell, M.D.; Manousaki, T.; Meyer, A.; Bloom, O.E.; et al. Sequencing of the sea lamprey (Petromyzon marinus) genome provides insights into vertebrate evolution. Nat. Genet. 2013, 45, 415. [Google Scholar] [CrossRef] [PubMed]
  29. Venkatesh, B.; Lee, A.P.; Ravi, V.; Maurya, A.K.; Lian, M.M.; Swann, J.B.; Ohta, Y.; Flajnik, M.F.; Sutoh, Y.; Kasahara, M.; et al. Elephant shark genome provides unique insights into gnathostome evolution. Nature 2014, 505, 174–179. [Google Scholar] [CrossRef] [PubMed]
  30. Amemiya, C.T.; Alfoldi, J.; Lee, A.P.; Fan, S.; Philippe, H.; Maccallum, I.; Braasch, I.; Manousaki, T.; Schneider, I.; Rohner, N.; et al. The African coelacanth genome provides insights into tetrapod evolution. Nature 2013, 496, 311–316. [Google Scholar] [CrossRef] [PubMed] [Green Version]
  31. Braasch, I.; Gehrke, A.R.; Smith, J.J.; Kawasaki, K.; Manousaki, T.; Pasquier, J.; Amores, A.; Desvignes, T.; Batzel, P.; Catchen, J.; et al. The spotted gar genome illuminates vertebrate evolution and facilitates human-teleost comparisons. Nat. Genet. 2016, 48, 427–437. [Google Scholar] [CrossRef] [PubMed]
  32. Massague, J.; Blain, S.W.; Lo, R.S. TGFbeta signaling in growth control, cancer, and heritable disorders. Cell 2000, 103, 295–309. [Google Scholar] [CrossRef]
  33. Chang, H.; Brown, C.W.; Matzuk, M.M. Genetic analysis of the mammalian transforming growth factor-beta superfamily. Endocr. Rev. 2002, 23, 787–823. [Google Scholar] [CrossRef] [PubMed]
  34. Ikushima, H.; Miyazono, K. TGFβ signalling: A complex web in cancer progression. Nat. Rev. Cancer. 2010, 10, 415–424. [Google Scholar] [CrossRef] [PubMed]
  35. Matus, D.Q.; Pang, K.; Marlow, H.; Dunn, C.W.; Thomsen, G.H.; Martindale, M.Q. Molecular evidence for deep evolutionary roots of bilaterality in animal development. Proc. Natl. Acad. Sci. USA 2006, 103, 11195–11200. [Google Scholar] [CrossRef] [PubMed]
  36. Zinski, J.; Tajer, B.; Mullins, M.C. TGF-β family signaling in early vertebrate development. Cold Spring Harb. Perspect. Biol. 2017. [Google Scholar] [CrossRef] [PubMed]
  37. Monsivais, D.; Matzuk, M.M.; Pangas, S.A. The TGF-β family in the reproductive tract. Cold Spring Harb. Perspect. Biol. 2017, 9, a022251. [Google Scholar] [CrossRef] [PubMed]
  38. Takehana, Y.; Matsuda, M.; Myosho, T.; Suster, M.L.; Kawakami, K.; Shin, I.T.; Kohara, Y.; Kuroki, Y.; Toyoda, A.; Fujiyama, A.; et al. Co-option of Sox3 as the male-determining factor on the Y chromosome in the fish Oryzias dancena. Nat. Commun. 2014, 5, 4157. [Google Scholar] [CrossRef] [PubMed]
  39. Kaneko, H.; Ijiri, S.; Kobayashi, T.; Izumi, H.; Kuramochi, Y.; Wang, D.S.; Mizuno, S.; Nagahama, Y. Gonadal soma-derived factor (gsdf), a TGF-β superfamily gene, induces testis differentiation in the teleost fish Oreochromis niloticus. Mol. Cell. Endocrinol. 2015, 415, 87–99. [Google Scholar] [CrossRef] [PubMed]
  40. Zhang, X.; Guan, G.; Li, M.; Zhu, F.; Liu, Q.; Naruse, K.; Herpin, A.; Nagahama, Y.; Li, J.; Hong, Y. Autosomal gsdf acts as a male sex initiator in the fish medaka. Sci. Rep. 2016, 6, 19738. [Google Scholar] [CrossRef] [PubMed]
  41. Jiang, D.N.; Yang, H.H.; Li, M.H.; Shi, H.J.; Zhang, X.B.; Wang, D.S. gsdf is a downstream gene of dmrt1 that functions in the male sex determination pathway of the Nile tilapia. Mol. Reprod. Dev. 2016, 83, 497–508. [Google Scholar] [CrossRef] [PubMed]
  42. Dranow, D.B.; Hu, K.; Bird, A.M.; Lawry, S.T.; Adams, M.T.; Sanchez, A.; Amatruda, J.F.; Draper, B.W. BMP15 is an oocyte-produced signal required for maintenance of the adult female sexual phenotype in zebrafish. PLoS Genet. 2016, 12, e1006323. [Google Scholar] [CrossRef] [PubMed]
  43. Morinaga, C.; Saito, D.; Nakamura, S.; Sasaki, T.; Asakawa, S.; Shimizu, N.; Mitani, H.; Furutani-Seiki, M.; Tanaka, M.; Kondoh, H. The hotei mutation of medaka in the anti-Mullerian hormone receptor causes the dysregulation of germ cell and sexual development. Proc. Natl. Acad. Sci. USA 2007, 104, 9691–9696. [Google Scholar] [CrossRef] [PubMed]
  44. Hattori, R.S.; Murai, Y.; Oura, M.; Masuda, S.; Majhi, S.K.; Sakamoto, T.; Fernandino, J.I.; Somoza, G.M.; Yokota, M.; Strussmann, C.A. A Y-linked anti-Mullerian hormone duplication takes over a critical role in sex determination. Proc. Natl. Acad. Sci. USA 2012, 109, 2955–2959. [Google Scholar] [CrossRef] [PubMed]
  45. Li, M.; Sun, Y.; Zhao, J.; Shi, H.; Zeng, S.; Ye, K.; Jiang, D.; Zhou, L.; Sun, L.; Tao, W.; et al. A tandem duplicate of anti-Mullerian hormone with a missense SNP on the Y chromosome is essential for male sex determination in Nile tilapia, Oreochromis niloticus. PLoS Genet. 2015, 11, e1005678. [Google Scholar] [CrossRef] [PubMed]
  46. Myosho, T.; Otake, H.; Masuyama, H.; Matsuda, M.; Kuroki, Y.; Fujiyama, A.; Naruse, K.; Hamaguchi, S.; Sakaizumi, M. Tracing the emergence of a novel sex-determining gene in medaka, Oryzias luzonensis. Genetics 2012, 191, 163–170. [Google Scholar] [CrossRef] [PubMed]
  47. Reichwald, K.; Petzold, A.; Koch, P.; Downie, B.R.; Hartmann, N.; Pietsch, S.; Baumgart, M.; Chalopin, D.; Felder, M.; Bens, M.; et al. Insights into sex chromosome evolution and aging from the genome of a short-lived fish. Cell 2015, 163, 1527–1538. [Google Scholar] [CrossRef] [PubMed]
  48. Namwanje, M.; Brown, C.W. Activins and Inhibins: Roles in development, physiology, and disease. Cold Spring Harb. Perspect. Boil. 2016, 8, a021881. [Google Scholar] [CrossRef] [PubMed]
  49. Katagiri, T.; Watabe, T. Bone morphogenetic proteins. Cold Spring Harb. Perspect. Biol. 2016, 8, a021899. [Google Scholar] [CrossRef] [PubMed]
  50. Camenisch, T.D.; Molin, D.G.; Person, A.; Runyan, R.B.; Gittenberger-de Groot, A.C.; McDonald, J.A.; Klewer, S.E. Temporal and distinct TGFβ ligand requirements during mouse and avian endocardial cushion morphogenesis. Dev. Biol. 2002, 248, 170–181. [Google Scholar] [CrossRef] [PubMed]
  51. Boyer, A.S.; Ayerinskas, I.I.; Vincent, E.B.; McKinney, L.A.; Weeks, D.L.; Runyan, R.B. TGFβ2 and TGFβ3 have separate and sequential activities during epithelial-mesenchymal cell transformation in the embryonic heart. Dev. Biol. 1999, 208, 530–545. [Google Scholar] [CrossRef] [PubMed]
  52. Bandyopadhyay, A.; Tsuji, K.; Cox, K.; Harfe, B.D.; Rosen, V.; Tabin, C.J. Genetic analysis of the roles of BMP2, BMP4, and BMP7 in limb patterning and skeletogenesis. PLoS Genet. 2006, 2, e216. [Google Scholar] [CrossRef] [PubMed] [Green Version]
  53. Lee, S.J.; McPherron, A.C. Regulation of myostatin activity and muscle growth. Proc. Natl. Acad. Sci. USA 2001, 98, 9306–9311. [Google Scholar] [CrossRef] [PubMed]
  54. Elvin, J.A.; Yan, C.; Wang, P.; Nishimori, K.; Matzuk, M.M. Molecular characterization of the follicle defects in the growth differentiation factor 9-deficient ovary. Mol. Endocrinol. 1999, 13, 1018–1034. [Google Scholar] [CrossRef] [PubMed]
  55. Airaksinen, M.S.; Holm, L.; Hatinen, T. Evolution of the GDNF family ligands and receptors. Brain Behav. Evol. 2006, 68, 181–190. [Google Scholar] [CrossRef] [PubMed]
  56. Herpin, A.; Lelong, C.; Favrel, P. Transforming growth factor-β-related proteins: An ancestral and widespread superfamily of cytokines in metazoans. Dev. Comp. Immunol. 2004, 28, 461–485. [Google Scholar] [CrossRef] [PubMed]
  57. Hinck, A.P.; Mueller, T.D.; Springer, T.A. Structural biology and evolution of the TGF-β family. Cold Spring Harb. Perspect. Biol. 2016, 8, a022103. [Google Scholar] [CrossRef] [PubMed]
  58. Feiner, N.; Begemann, G.; Renz, A.J.; Meyer, A.; Kuraku, S. The origin of bmp16, a novel Bmp2/4 relative, retained in teleost fish genomes. BMC Evol. Biol. 2009, 9, 277. [Google Scholar] [CrossRef] [PubMed]
  59. Marques, C.L.; Fernández, I.; Rosa, J.; Viegas, M.N.; Cancela, M.L.; Laizé, V. Spatiotemporal expression and retinoic acid regulation of bone morphogenetic proteins 2, 4 and 16 in Senegalese sole. J. Appl. Ichthyol. 2014, 30, 713–720. [Google Scholar] [CrossRef]
  60. Funkenstein, B.; Olekh, E.; Jakowlew, S.B. Identification of a novel transforming growth factor-β (TGF-β6) gene in fish: Regulation in skeletal muscle by nutritional state. BMC Mol. Biol. 2010, 11, 37. [Google Scholar] [CrossRef] [PubMed]
  61. Yelick, P.C.; Abduljabbar, T.S.; Stashenko, P. zALK-8, a novel type I serine/threonine kinase receptor, is expressed throughout early zebrafish development. Dev. Dyn. 1998, 211, 352–361. [Google Scholar] [CrossRef]
  62. Grande, C.; Martin-Duran, J.M.; Kenny, N.J.; Truchado-Garcia, M.; Hejnol, A. Evolution, divergence and loss of the Nodal signalling pathway: New data and a synthesis across the Bilateria. Int. J. Dev. Biol. 2014, 58, 521–532. [Google Scholar] [CrossRef] [PubMed]
  63. Zhu, J.; Braun, E.L.; Kohno, S.; Antenos, M.; Xu, E.Y.; Cook, R.W.; Lin, S.J.; Moore, B.C.; Guillette, L.J., Jr.; Jardetzky, T.S.; et al. Phylogenomic analyses reveal the evolutionary origin of the inhibin alpha-subunit, a unique TGFβ superfamily antagonist. PLoS ONE 2010, 5, e9457. [Google Scholar] [CrossRef] [PubMed]
  64. Cerny, R.; Cattell, M.; Sauka-Spengler, T.; Bronner-Fraser, M.; Yu, F.; Medeiros, D.M. Evidence for the prepattern/cooption model of vertebrate jaw evolution. Proc. Natl. Acad. Sci. USA 2010, 107, 17262–17267. [Google Scholar] [CrossRef] [PubMed]
  65. Wang, F.; Reece, E.A.; Yang, P. Oxidative stress is responsible for maternal diabetes-impaired transforming growth factor β signaling in the developing mouse heart. Am. J. Obstet. Gynecol. 2015, 212, 650-e1. [Google Scholar] [CrossRef] [PubMed]
  66. Wu, T.; Ling, Q.Y.; Zhong, C.; Wang, T.X.; Wang, L.L.; Wang, X.Y.; Su, Z.L.; Zong, G.J. Expression of BMP4 in myocardium and vascular tissue of obese mice. J. Inflamm. 2015, 12, 8. [Google Scholar] [CrossRef] [PubMed]
  67. Neuhaus, H.; Rosen, V.; Thies, R.S. Heart specific expression of mouse BMP-10 a novel member of the TGF-β superfamily. Mech. Dev. 1999, 80, 181–184. [Google Scholar] [CrossRef]
  68. Chen, H.; Shi, S.; Acosta, L.; Li, W.; Lu, J.; Bao, S.; Chen, Z.; Yang, Z.; Schneider, M.D.; Chien, K.R.; et al. BMP10 is essential for maintaining cardiac growth during murine cardiogenesis. Development 2004, 131, 2219–2231. [Google Scholar] [CrossRef] [PubMed]
  69. Langlois, D.; Hneino, M.; Bouazza, L.; Parlakian, A.; Sasaki, T.; Bricca, G.; Li, J.Y. Conditional inactivation of TGF-β type II receptor in smooth muscle cells and epicardium causes lethal aortic and cardiac defects. Transgenic Res. 2010, 19, 1069–1082. [Google Scholar] [CrossRef] [PubMed]
  70. Tang, S.; Snider, P.; Firulli, A.B.; Conway, S.J. Trigenic neural crest-restricted Smad7 over-expression results in congenital craniofacial and cardiovascular defects. Dev. Biol. 2010, 344, 233–247. [Google Scholar] [CrossRef] [PubMed]
  71. McPherron, A.C.; Lawler, A.M.; Lee, S.J. Regulation of skeletal muscle mass in mice by a new TGF-β superfamily member. Nature 1997, 387, 83–90. [Google Scholar] [CrossRef] [PubMed]
  72. Herrera, B.; Garcia-Alvaro, M.; Cruz, S.; Walsh, P.; Fernandez, M.; Roncero, C.; Fabregat, I.; Sanchez, A.; Inman, G.J. BMP9 is a proliferative and survival factor for human hepatocellular carcinoma cells. PLoS ONE 2013, 8, e69535. [Google Scholar] [CrossRef] [PubMed] [Green Version]
  73. Fang, J.; Wang, S.Q.; Smiley, E.; Bonadio, J. Genes coding for mouse activin βC and βE are closely linked and exhibit a liver-specific expression pattern in adult tissues. Biochem. Biophys. Res. Commun. 1997, 231, 655–661. [Google Scholar] [CrossRef] [PubMed]
  74. Vejda, S.; Cranfield, M.; Peter, B.; Mellor, S.L.; Groome, N.; Schulte-Hermann, R.; Rossmanith, W. Expression and dimerization of the rat activin subunits βC and βE: Evidence for the formation of novel activin dimers. J. Mol. Endocrinol. 2002, 28, 137–148. [Google Scholar] [CrossRef] [PubMed]
  75. Chabicovsky, M.; Herkner, K.; Rossmanith, W. Overexpression of activin βC or activin βE in the mouse liver inhibits regenerative deoxyribonucleic acid synthesis of hepatic cells. Endocrinology 2003, 144, 3497–3504. [Google Scholar] [CrossRef] [PubMed]
  76. Tao, W.; Yuan, J.; Zhou, L.; Sun, L.; Sun, Y.; Yang, S.; Li, M.; Zeng, S.; Huang, B.; Wang, D. Characterization of gonadal transcriptomes from Nile tilapia (Oreochromis niloticus) reveals differentially expressed genes. PLoS ONE 2013, 8, e63604. [Google Scholar] [CrossRef] [PubMed]
  77. Yan, C.; Wang, P.; DeMayo, J.; DeMayo, F.J.; Elvin, J.A.; Carino, C.; Prasad, S.V.; Skinner, S.S.; Dunbar, B.S.; Dube, J.L.; et al. Synergistic roles of bone morphogenetic protein 15 and growth differentiation factor 9 in ovarian function. Mol. Endocrinol. 2001, 15, 854–866. [Google Scholar] [CrossRef] [PubMed]
  78. Dong, J.; Albertini, D.F.; Nishimori, K.; Kumar, T.R.; Lu, N.; Matzuk, M.M. Growth differentiation factor-9 is required during early ovarian folliculogenesis. Nature 1996, 383, 531–535. [Google Scholar] [CrossRef] [PubMed]
  79. Matsuda, M.; Nagahama, Y.; Shinomiya, A.; Sato, T.; Matsuda, C.; Kobayashi, T.; Morrey, C.E.; Shibata, N.; Asakawa, S.; Shimizu, N.; et al. DMY is a Y-specific DM-domain gene required for male development in the medaka fish. Nature 2002, 417, 559–563. [Google Scholar] [CrossRef] [PubMed]
  80. Nanda, I.; Kondo, M.; Hornung, U.; Asakawa, S.; Winkler, C.; Shimizu, A.; Shan, Z.; Haaf, T.; Shimizu, N.; Shima, A.; et al. A duplicated copy of DMRT1 in the sex-determining region of the Y chromosome of the medaka, Oryzias latipes. Proc. Natl. Acad. Sci. USA 2002, 99, 11778–11783. [Google Scholar] [CrossRef] [PubMed]
  81. Graves, J.A. How to evolve new vertebrate sex determining genes. Dev. Dyn. 2013, 242, 354–359. [Google Scholar] [CrossRef] [PubMed]
  82. Imai, T.; Saino, K.; Matsuda, M. Mutation of Gonadal soma-derived factor induces medaka XY gonads to undergo ovarian development. Biochem. Biophys. Res. Commun. 2015, 467, 109–114. [Google Scholar] [CrossRef] [PubMed]
  83. Poon, S.K.; So, W.K.; Yu, X.; Liu, L.; Ge, W. Characterization of inhibin alpha subunit (inha) in the zebrafish: Evidence for a potential feedback loop between the pituitary and ovary. Reproduction 2009, 138, 709–719. [Google Scholar] [CrossRef] [PubMed]
  84. Josso, N.; di Clemente, N.; Gouedard, L. Anti-Mullerian hormone and its receptors. Mol. Cell. Endocrinol. 2001, 179, 25–32. [Google Scholar] [CrossRef]
  85. Kamiya, T.; Kai, W.; Tasumi, S.; Oka, A.; Matsunaga, T.; Mizuno, N.; Fujita, M.; Suetake, H.; Suzuki, S.; Hosoya, S.; et al. A trans-species missense SNP in Amhr2 is associated with sex determination in the tiger pufferfish, Takifugu rubripes (fugu). PLoS Genet. 2012, 8, e1002798. [Google Scholar] [CrossRef] [PubMed]
  86. Pangas, A.S.; Woodruff, K.T. Activin signal transduction pathways. Trends Endocr. Metab. 2000, 11, 309–314. [Google Scholar] [CrossRef]
  87. Woodruff, T.K. Regulation of cellular and system function by activin. Biochem. Pharmacol. 1998, 55, 953–963. [Google Scholar] [CrossRef]
  88. DePaolo, L.V. Inhibins, activins, and follistatins: The saga continues. Proc. Soc. Exp. Biol. Med. 1997, 214, 328–339. [Google Scholar] [CrossRef] [PubMed]
  89. Brawand, D.; Wagner, C.E.; Li, Y.I.; Malinsky, M.; Keller, I.; Fan, S.; Simakov, O.; Ng, A.Y.; Lim, Z.W.; Bezault, E.; et al. The genomic substrate for adaptive radiation in African cichlid fish. Nature 2014, 513, 375–381. [Google Scholar] [CrossRef] [PubMed] [Green Version]
  90. Hall, T.A. BioEdit: A user-friendly biological sequence alignment editor and analysis program for Windows 95/98/NT. Nucleic Acids Symp. Ser. 1999, 41, 95–98. [Google Scholar]
  91. Tamura, K.; Stecher, G.; Peterson, D.; Filipski, A.; Kumar, S. MEGA6: Molecular evolutionary genetics analysis version 6.0. Mol. Biol. Evol. 2013, 30, 2725–2729. [Google Scholar] [CrossRef] [PubMed]
  92. Felsenstein, J. Confidence Limits on Phylogenies: An approach using the bootstrap. Evol. Dev. 1985, 39, 783–791. [Google Scholar] [CrossRef] [PubMed]
  93. Tyner, C.; Barber, G.P.; Casper, J.; Clawson, H.; Diekhans, M.; Eisenhart, C.; Fischer, C.M.; Gibson, D.; Gonzalez, J.N.; Guruvadoo, L.; et al. The UCSC genome browser database: 2017 update. Nucleic Acids Res. 2017, 45, D626–D634. [Google Scholar] [PubMed]
  94. Muffato, M.; Louis, A.; Poisnel, C.E.; Roest Crollius, H. Genomicus: A database and a browser to study gene synteny in modern and ancestral genomes. Bioinformatics 2010, 26, 1119–1121. [Google Scholar] [CrossRef] [PubMed]
  95. Yuan, J.; Tao, W.; Cheng, Y.; Huang, B.; Wang, D. Genome-wide identification, phylogeny, and gonadal expression of fox genes in Nile tilapia, Oreochromis niloticus. Fish Physiol. Biochem. 2014, 40, 1239–1252. [Google Scholar] [CrossRef] [PubMed]
  96. Szekely, G.J.; Rizzo, M.L. Hierarchical clustering via joint between-within distances: Extending ward's minimum variance method. J. Classif. 2005, 22, 151–183. [Google Scholar] [CrossRef]
  97. Deza, M.M.; Deza, E. Encyclopedia of Distances; Springer: Berlin/Heidelberg, Germany, 2009; Volume 24, pp. 1–583. [Google Scholar]
  98. Zhang, X.; Wang, H.; Li, M.; Cheng, Y.; Jiang, D.; Sun, L.; Tao, W.; Zhou, L.; Wang, Z.; Wang, D. Isolation of Doublesex- and Mab-3-related transcription factor 6 and its involvement in spermatogenesis in tilapia. Biol. Reprod. 2014, 91, 136. [Google Scholar] [CrossRef] [PubMed]
  99. Kobayashi, T.; Kajiura-Kobayashi, H.; Nagahama, Y. Differential expression of vasa homologue gene in the germ cells during oogenesis and spermatogenesis in a teleost fish, tilapia, Oreochromis niloticus. Mech. Dev. 2000, 99, 139–142. [Google Scholar] [CrossRef]
Figure 1. Phylogenetic relationship of 24 representative animals analyzed and numbers of transforming growth factor β (TGF-β) pathway gene. 1R, 2R, 3R and 4R indicate the four rounds of WGD that occurred during vertebrate evolution. The complete TGF-β pathway was first appeared in sponges, and the pathway members are universally present in all metazoans.
Ijms 19 01154 g001
Figure 2. Phylogenetic tree of TGF-β ligands from tilapia, zebrafish, coelacanth, and human. The TGF-β ligands were clustered into TGF-β-like and BMP-like clades, with each clade can be subdivided into many different small groups. The ML method was used to construct the tree by MEGA 6.0 software. The amino acid sequences of TGF-β peptide domains were aligned using the multiple alignment software Bioedit. Red dots indicate genes which retained two copies in teleosts after 3R events. GenBank accession numbers of the sequences used are listed in Table S2a.
Ijms 19 01154 g002
Figure 3. Phylogenetic trees of TGF-β type I (a) and type II (b) receptors. The trees were constructed using the same method as described in Figure 2. (a) Type I receptors from elephant shark, coelacanth, spotted gar, xenopus, human, zebrafish and tilapia were clustered into ALK1/2, ALK3/6 and ALK4/5/7 three branches, tilapia TGFBR2B was used as an outgroup; (b) Type II receptors from elephant shark, coelacanth, spotted gar, xenopus, lizard, chicken, human, zebrafish and tilapia were clustered into ACVR2A/ACVR2B, TGFBR2 and BMPR2/AMHR2 three branches, human ACVR1 was used as an outgroup. Red dots indicate genes which retained two copies in teleosts after 3R events. GenBank accession numbers of the sequences used are listed in Table S2b,c.
Ijms 19 01154 g003
Figure 4. Phylogenetic tree of smads. The tree was constructed using the same method as described in Figure 2. Smads from elephant shark, coelacanth, spotted gar, xenopus, gecko, chicken, human, zebrafish, and tilapia were clustered into R-SMAD (SMAD1/5/8, SMAD2/3), Co-SMAD (SMAD4) and I-SMAD (SMAD6/7) branches, human AGBL4 was used as an outgroup. Red dots indicate genes which retained two copies in teleosts after 3R events. GenBank accession numbers of the sequences used are listed in Table S2d.
Ijms 19 01154 g004
Figure 5. Syntenic analysis of SMAD4 genomic region. Genomic regions flanking SMAD4 copies were analyzed in representative vertebrate species including tetrapods (human, chicken, lizard, and xenopus), sarcopterygians (coelacanth) and actinopterygians (spotted gar, tilapia, fugu, stickleback, medaka, platyfish, and tetraodon) using Genomicus browser. The chromosome or scaffold number was indicated under the species name. The bar lengths were not proportional to the distances between genes. Dotted lines indicated omitted genes in the chromosome or scaffold. Different genes were represented by different colored pentagons and SMAD4 copies were indicated in red. The direction of pentagons indicated the gene direction. The gene names were placed on top of the pentagons.
Ijms 19 01154 g005
Figure 6. Tissue distribution (FPKM: fragments per kilobase of exon per million fragments mapped) of TGF-β pathway members in eight tissues of tilapia based on transcriptome data. A heat map showing expression of TGF-β pathway members in tilapia eight tissues, with red and blue indicating high and low expression, respectively. Each row represents a different gene, and each column represents an independent tissue sample. Hierarchical clustering of both genes and tissues (by correlation) organized the data set into similar expression patterns. The widespread complex expression patterns in all tissues were readily discernable. Most receptors and smads were expressed in multiple tissues while the ligands exhibited tissue-specific expression pattern especially in the heart and gonads.
Ijms 19 01154 g006
Figure 7. The expression profiles (FPKM) of TGF-β pathway members in the tilapia gonads. admp2, bmp7a, gdf9, bmp15, gdf3, acvr2ba, smad1, smad5 and smad8 were ovary-enriched genes, while inha, gsdf, amh and amhr2 were testis-enriched genes. Red and blue indicate high and low expression, respectively.
Ijms 19 01154 g007
Figure 8. Cellular location of 6 TGF-β pathway genes in tilapia gonads at 180 dah by ISH. Specific signals (brown) of bmp15, gdf9, gdf3, smad1, smad5 and smad8 were observed in the cytoplasm of oocytes in the ovary (a,c,e,g,i,k). In contrast, no signal of these genes was observed in any cells of the testis (b,d,f,h,j,l). Scale bar: (a) 25 µm; (bf) 15 µm; (gl) 50 µm.
Ijms 19 01154 g008
Figure 9. Cellular location of Gsdf and Amh in gonads by IHC. Gsdf-specific immunostaining was clearly observed in the somatic cells neighboring oogonia of XX gonads and Sertoli cells neighboring spermatogonia of the XY gonads at all stages (ah). The Amh proteins were located in granule cells in ovary at all stages and somatic cells surrounding germ cells in the testis at 5 dah, and at later stages in myoid cells and Sertoli cells (ip). Scale bar: (a,b,d,il,o) 10 µm; (c,eg,m,n) 15 µm; (p) 25 µm; (h) 50 µm.
Ijms 19 01154 g009
Figure 10. A schematic presentation of the evolution of TGF-β pathway members. 1R, 2R and 3R indicate the three rounds of WGD that occurred during vertebrate evolution. (a) Evolution of TGF-β ligands. The evolutionary tree is constructed with references from the tree of life web project (Available online: http://tolweb.org/tree/phylogeny.html). Branch lengths are not drawn to represent actual evolutionary distances. Protostomes, deuterostomes and gnathostomes were circled by yellow, green, and purple, respectively. Genes in the box indicate their presence in corresponding species. After split of protostome and deuterostome, changes (such as emergence, divergence, and duplication) of TGF-β ligands were mapped onto corresponding branches. The early emergence of these genes including, NODAL in Mollusca and Annelida, INHA in Urochordata, GDF5/6/7 in Cyclostomata were obtained from previous studies [62,63,64]. (b) Evolution of TGF-β type I receptors (A), type II receptors (B) and SMADs (C). The brown boxes indicate genes that with only one copy preserved after 2R or 3R. The dashed boxes indicate genes remain to be identified. The origins of the type I receptor can be traced to ALK1/2 and ALK4/5/7 in the vertebrate ancestor. Only one type II receptor ACVR2 was found in invertebrate. BMPR2 may be the paralog of ACVR2 and the hypothetical origin of TGF-β type II receptors was ACVR2. The origin of the SMADs can be traced to SMAD1/5/8, SMAD2/3 and SMAD4 in early invertebrates. SMAD6/7 appeared later. Four SMADs, i.e., SMAD1, SMAD3, SMAD4 and SMAD6 appeared in agnatha. The whole SMAD family (SMAD1–8) were generated after 2R.
Ijms 19 01154 g010

