Article

Global and Complement Gene-Specific DNA Methylation in Grass Carp after Grass Carp Reovirus (GCRV) Infection

1
State Key Laboratory of Freshwater Ecology and Biotechnology, Institute of Hydrobiology, Chinese Academy of Sciences, Wuhan 430072, China
2
University of Chinese Academy of Sciences, Beijing 100049, China
*
Authors to whom correspondence should be addressed.
Int. J. Mol. Sci. 2018, 19(4), 1110; https://doi.org/10.3390/ijms19041110
Submission received: 22 February 2018 / Revised: 30 March 2018 / Accepted: 5 April 2018 / Published: 7 April 2018
(This article belongs to the Section Biochemistry)

Abstract

:
Grass carp reovirus (GCRV) causes huge economic loss to the grass carp cultivation industry but the mechanism remains largely unknown. In this study, we investigated the global and complement gene-specific DNA methylation in grass carp after GCRV infection aimed to uncover the mechanism underlying GCRV infection. The global DNA methylation level was increased after GCRV infection. Expression levels of enzymes involved in DNA methylation including DNA methyltransferase (DNMT), ten-eleven translocation proteins (TETs), and glycine N-methyltransferase (GNMT) were significantly altered after GCRV infection. In order to investigate the relationship between the gene expression level and DNA methylation level, two representative complement genes, complement component 3 (C3) and kininogen-1 (KNG1), were selected for further analysis. mRNA expression levels of the two genes were significantly increased at 5 and 7 days after GCRV infection, whereas the DNA methylation level at the 5′ flanking regions of the two genes were down-regulated at the same time-points. Moreover, a negative correlation was detected between gene expression levels and DNA methylation levels of the two genes. Therefore, the current data revealed a global and complement gene-specific DNA methylation profile after GCRV infection. Our study would provide new insights into understanding the mechanism underlying GCRV infection.

1. Introduction

Grass carp (Ctenopharyngodon idellus) is an important aquaculture species in China, accounting for about 18% of total freshwater aquaculture production. The production of grass carp reached 5.5 million tons in 2014, making it the most highly consumed freshwater fish worldwide [1]. Unfortunately, frequent diseases always result in huge economic loss to the grass carp cultivation industry. Grass carp hemorrhagic disease which is caused by the grass carp reovirus (GCRV) is one of the most serious problems that hamper the development of grass carp aquaculture [2]. Therefore, GCRV has been noticed with special concern by fish breeders and immunologists with the hope of developing disease-resistant breeding or understanding the mechanism of GCRV infection [3].
DNA methylation refers to the addition of a methyl group to the 5’ position of a cytosine base to form 5-methylcytosine, and is one of the well characterized epigenetic markers in biota [4]. In general, DNA methylation in the cytosine-phosphor-guanine (CpG) sites of promoter regions or CpG islands of genes may be associated with gene expression levels [5,6]. Moreover, DNA hypermethylation in gene promoters is usually linked to transcriptional repression whereas hypomethylation is always correlated with transcriptional activation [7,8,9]. For example, the DNA methylation of the cyp19a1a gene in rare minnow under bisphenol A exposure was negatively correlated with gene expression levels [10]. mRNA expression levels of the RIG-1 gene in grass carp after GCRV infection is negatively regulated by DNA methylation [11]. The CpA/CpG methylation of CiMDA5 of grass carp negatively regulates its mRNA expression and is tightly associated with resistance against GCRV [12]. Low salinity affects the expression level of the igf1 gene in the liver of half smooth tongue sole, whereas methylation level shows an opposite trend to that of gene expression levels [13].
DNA methyltransferase (DNMT) proteins catalyze the addition of a methyl group to the 5’ position of cytosine at a CpG site [14]. In vertebrates, three DNMTs including DNMT1, DNMT2, and DNMT3 have been described [15]. DNMT1 is involved in the maintenance of methylation profiles during DNA replication [16], DNMT3 is important in establishing new methylation patterns of DNA and is hence referred to as the de novo methyltransferase [17], while the role of DNMT2 is still unclear. Interestingly, six DNMT3 family genes named DNMT3 to DNMT8 were reported in zebrafish, which is used as a model of teleost fish [18]. Beside the DNMTs, the ten-eleven translocation proteins (TETs) and glycine N-methyltransferase (GNMT) are two important enzymes that directly affect the DNA methylation level [19,20,21]. Up to now, three TET homologs (TET-1, TET-2, and TET-3) that share structural domains with their mammalian counterparts have been identified in zebrafish [22].
Due to the great economic loss that is caused by GCRV, many studies have been conducted about GCRV [23,24,25,26,27,28,29], but the mechanism underlying GCRV infection is still largely unknown. In the present study, we aimed to uncover the mechanism of GCRV infection from the point of view of epigenetics. Grass carp were infected with GCRV and the global DNA methylation level was measured. The expression levels of enzymes that are involved in DNA methylation were examined. Moreover, two representative complement genes, complement component 3 (C3) and kininogen-1 (KNG1), were selected for analysis of the relationship between gene expression level and DNA methylation level after GCRV infection. Our work provides valuable information for understanding the mechanism of GCRV infection.

2. Results

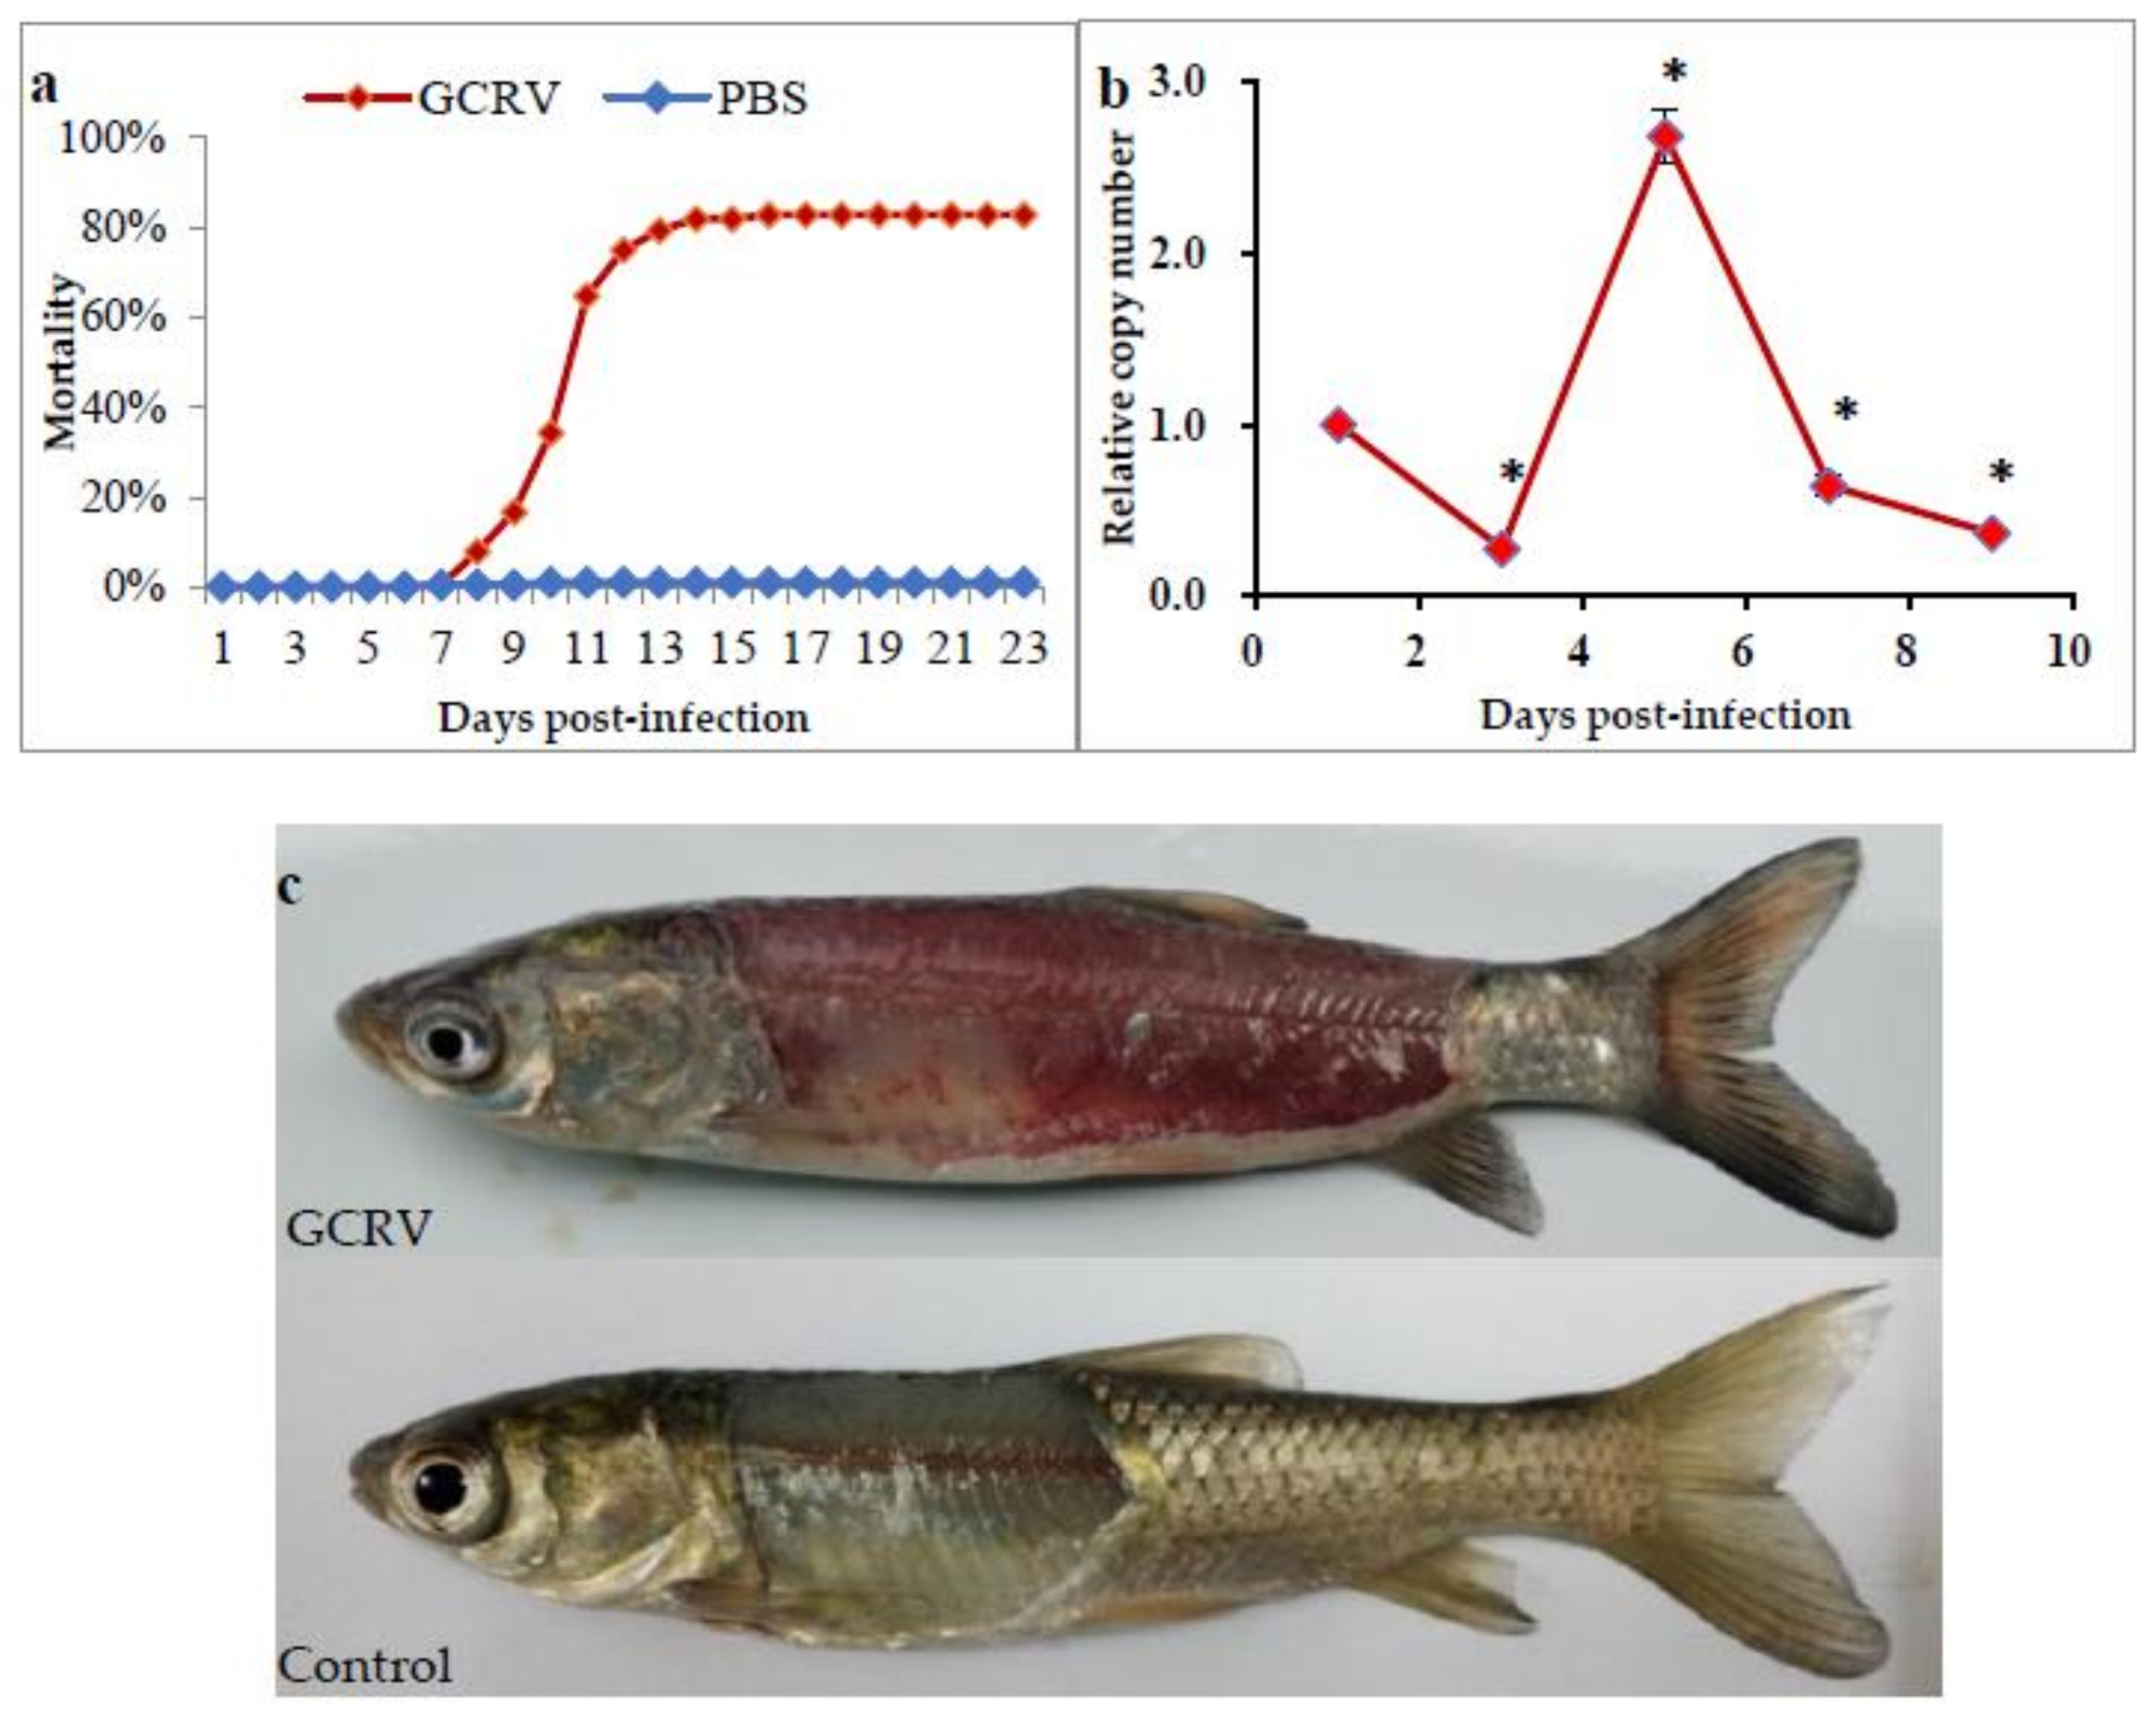
2.1. Grass Carp after GCRV Infection

The grass carp were divided into two groups and intraperitoneally injected with GCRV or PBS, respectively. As shown in Figure 1a, for the group that was injected with GCRV, a total mortality of 82.8% was reached at 16 days, with the first death recorded as early as 8 days post-infection. In the group that was injected with PBS, three dead fish were observed, giving a total mortality of 1.3% (Figure 1a). To determine dynamic changes of GCRV in the infected group, the viral load in the GCRV-infected fish at different times after challenge was examined by qPCR. The relative copy number of GCRV at 1-day post-infection was used as a reference for normalization. As shown in Figure 1b, extremely low copy numbers of GCRV were observed at 3 days post-infection, whereas a marked increase was detected at 5 days post-infection. The viral copy number declined at 7 and 9 days post-infection. Moreover, typical hemorrhagic symptoms were observed in the GCRV-infected group, especially in the muscle and tail fin, while no hemorrhagic symptoms were present in the control group (Figure 1c). Thus, these results confirmed the efficiency of GCRV infection.

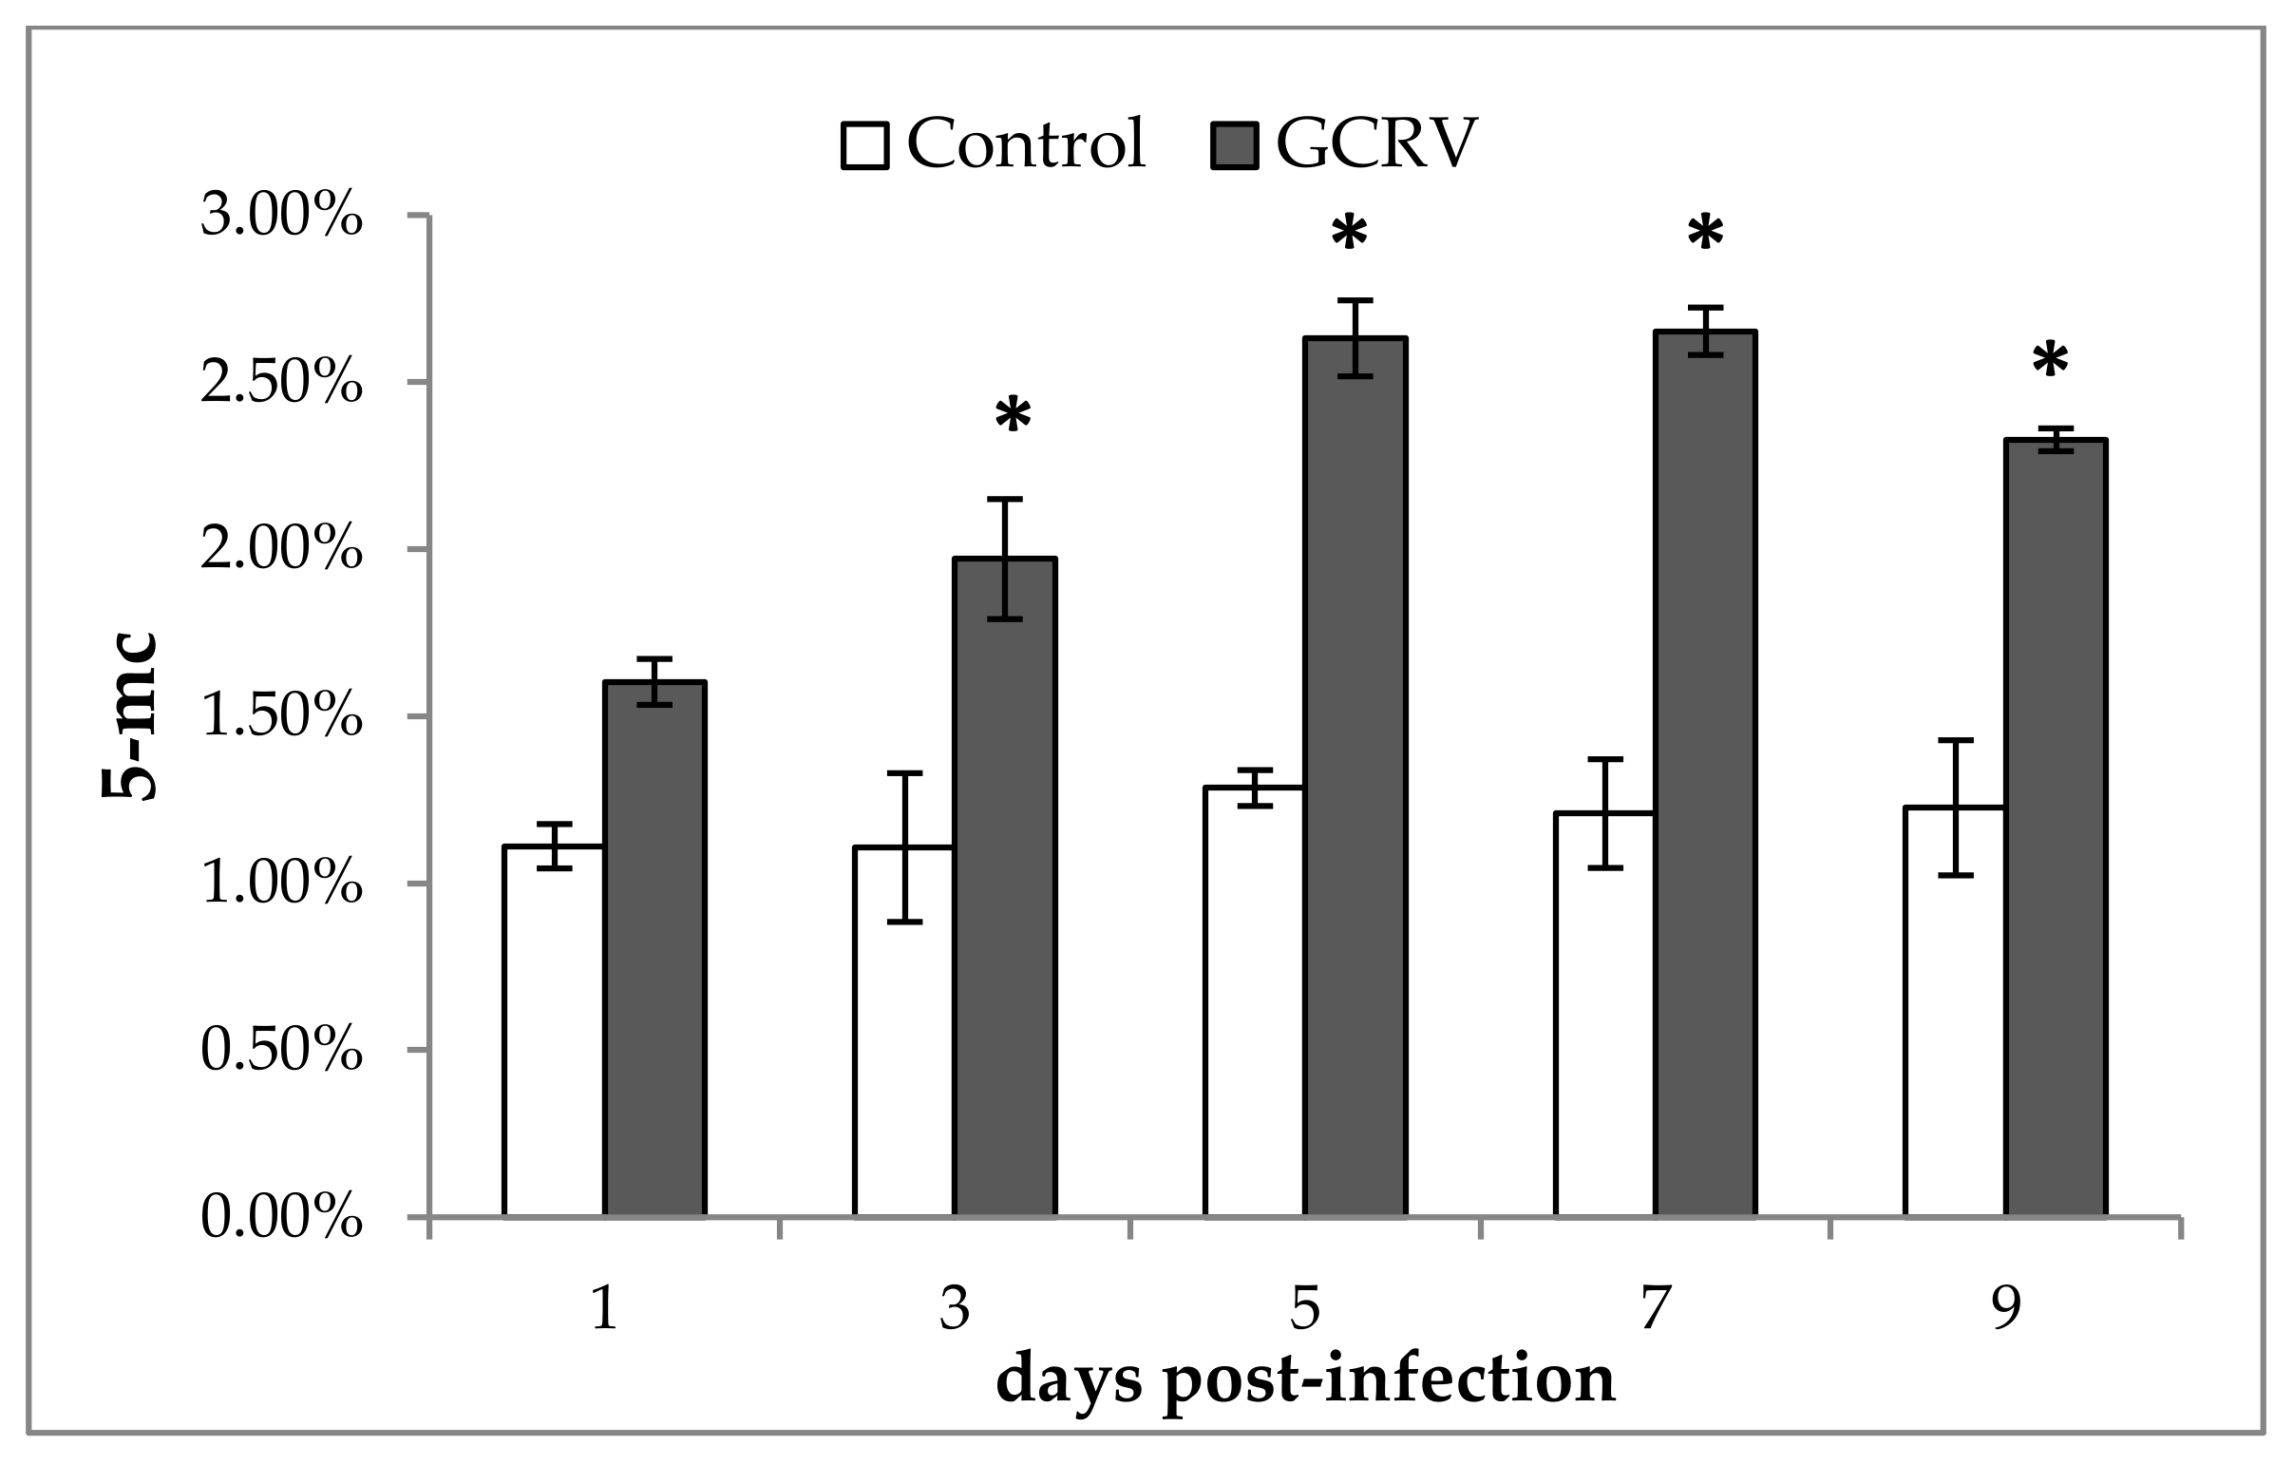
2.2. Global DNA Methylation Changes after GCRV Infection

In order to investigate whether the global DNA methylation was altered after GCRV infection, spleen samples of the two groups at different time points post-infection were obtained and global DNA methylation level was measured. As shown in Figure 2, for the control group that injected with PBS, the global DNA methylation level was almost consistent throughout the experiment. However, for the GCRV infected group, the percent of 5-methylcytosine (5-mc) was significant higher than that of control group at 3, 5, 7, and 9 days post-infection, while no significant difference was observed at the first day post-infection. Therefore, these results implied that the global DNA methylation level was altered after GCRV infection.

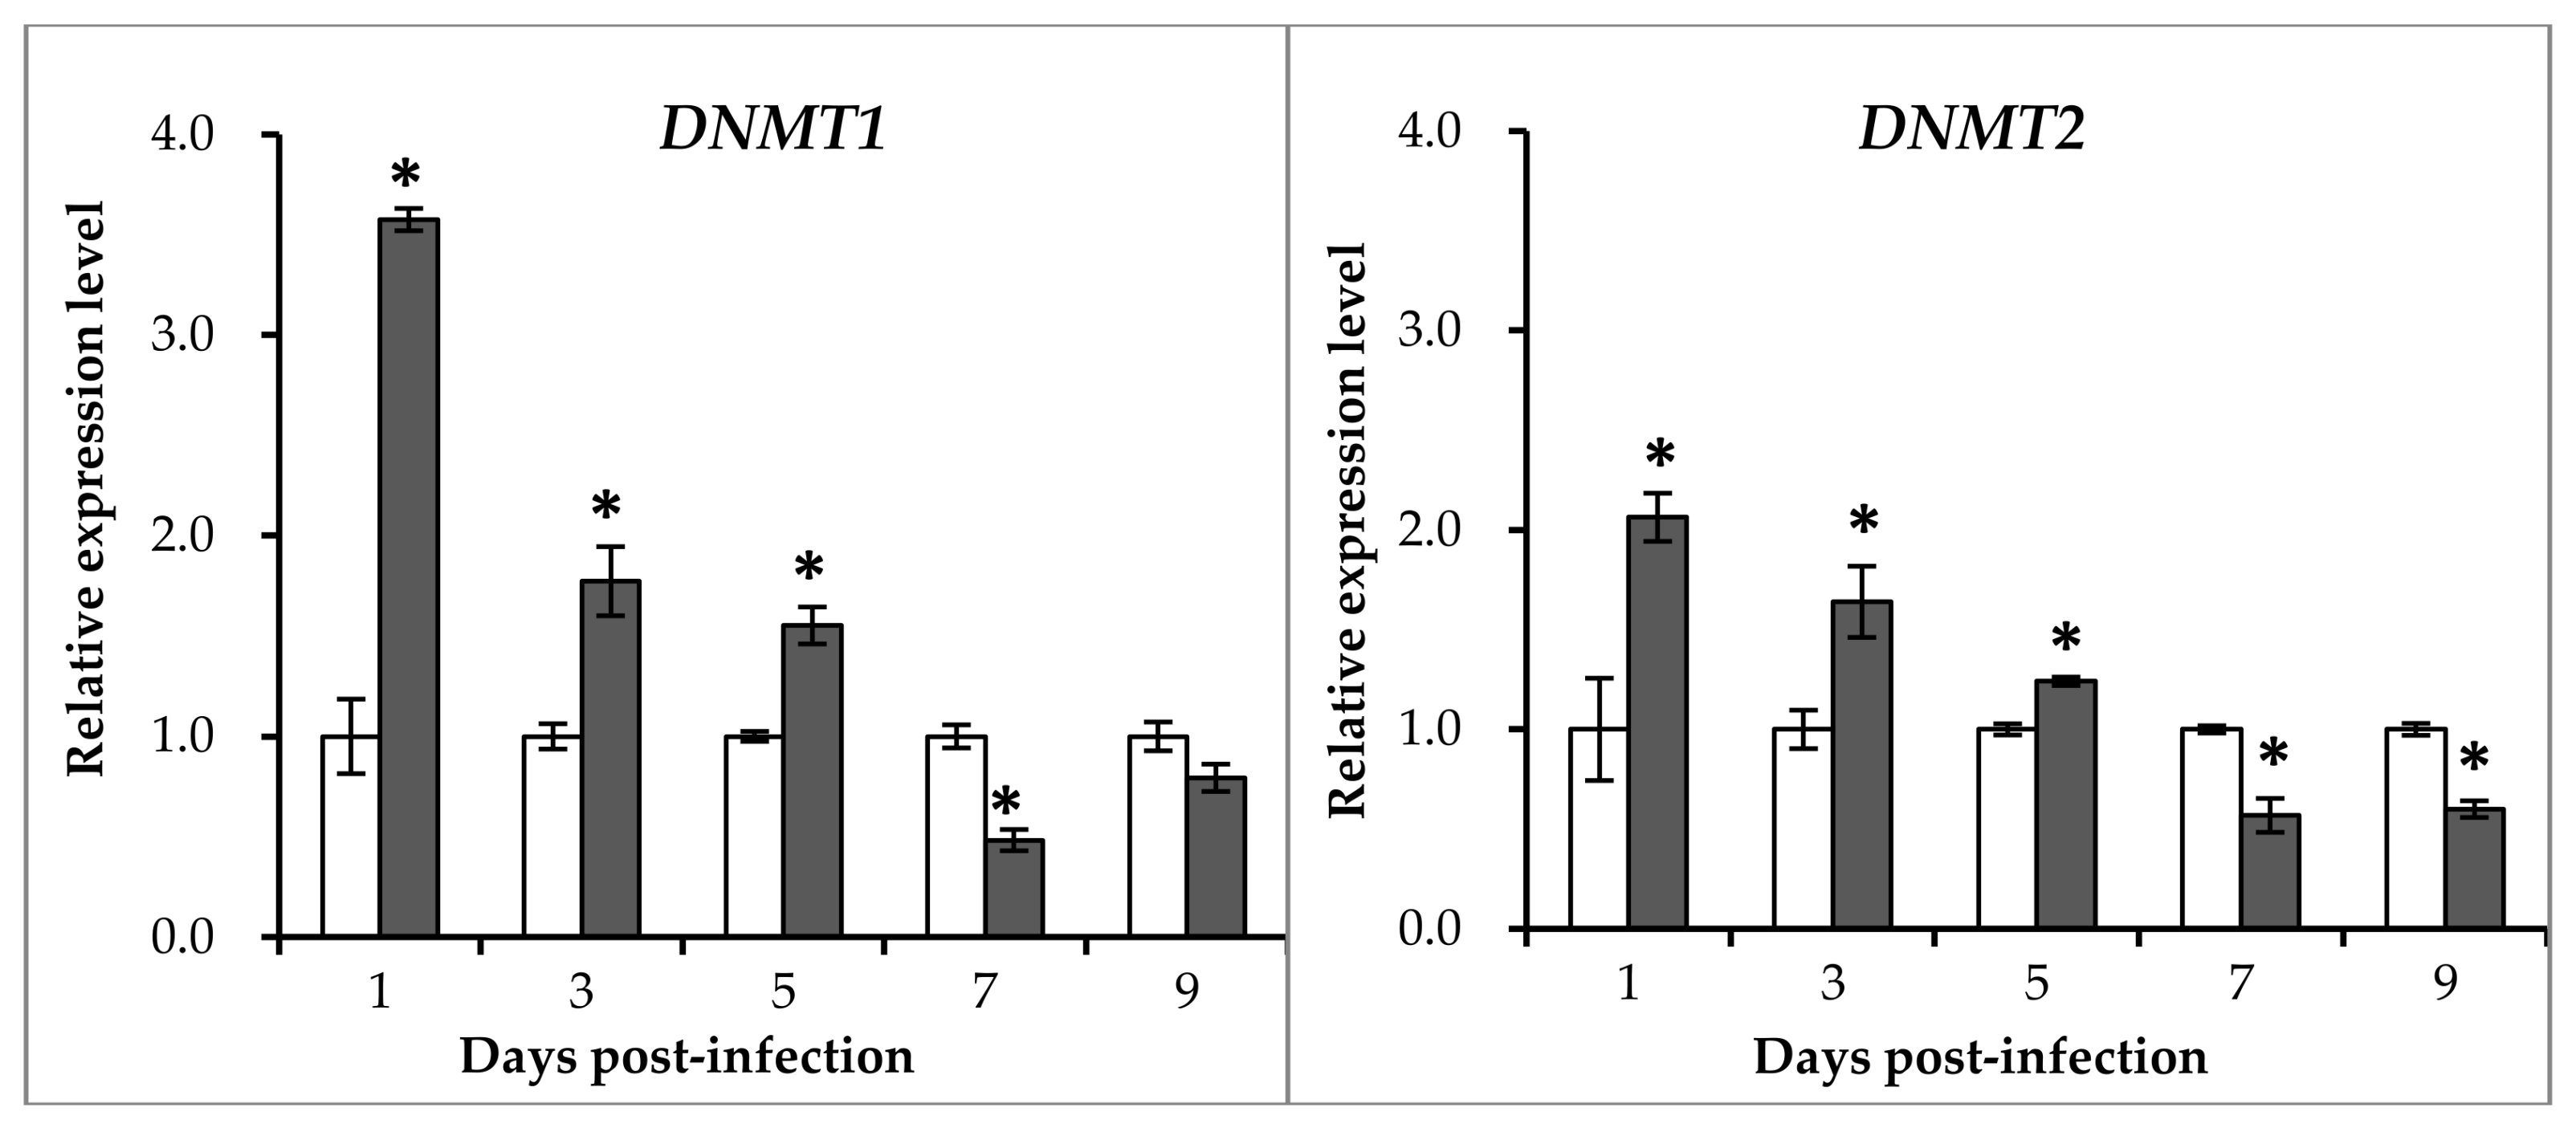
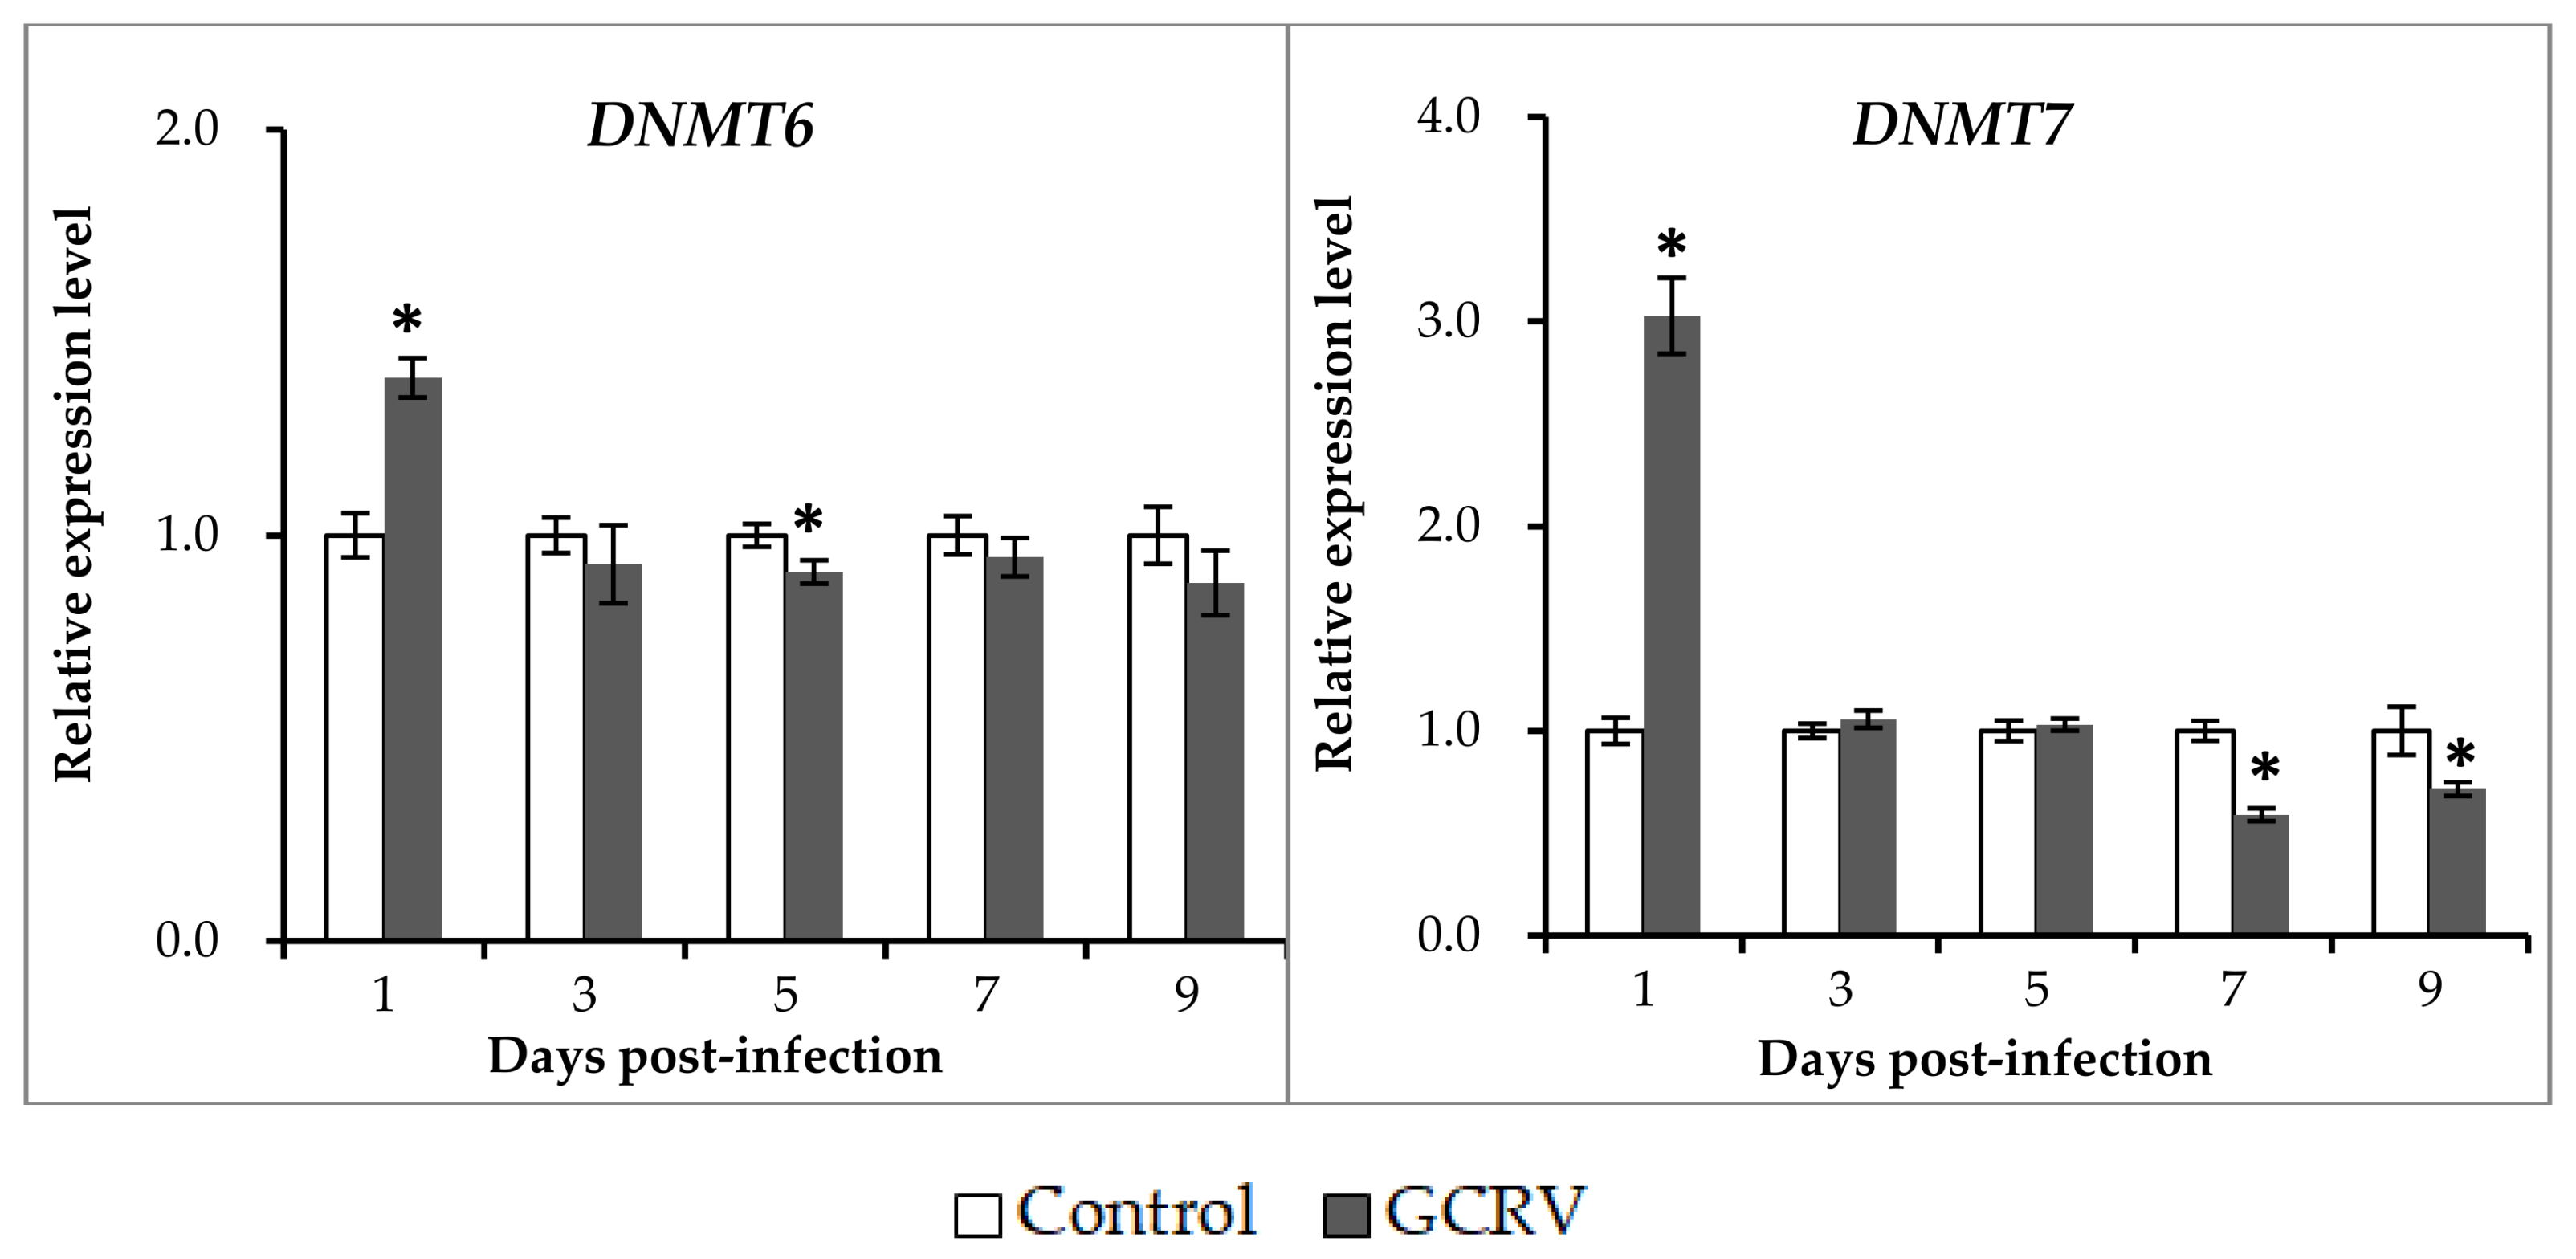
2.3. Expression Patterns of DNA Methyltransferase Genes after GCRV Infection

DNA methylation levels are associated with DNA methyltransferase (DNMT), which catalyzes the addition of a methyl group to the 5’ position of cytosine at a CpG site. Therefore, the expression patterns of DNMT1, DNMT2, and two DNMT3 family genes (DNMT6 and DNMT7) were examined after GCRV infection. As shown in Figure 3, overall, DNMT1 and DNMT2 genes showed similar expression patterns after exposure to GCRV while the expression patterns of DNMT6 and DNMT7 were distinct from them. To be specific, DNMT1 and DNMT2 showed a gradual decline from 1 day to 9 days post-infection, DNMT6 and DNMT7 presented a sharp peak at day 1 and reverted back to a basal level at 3 days post-infection. Hence, these results confirmed the alteration of DNMT gene expression levels after a GCRV challenge.

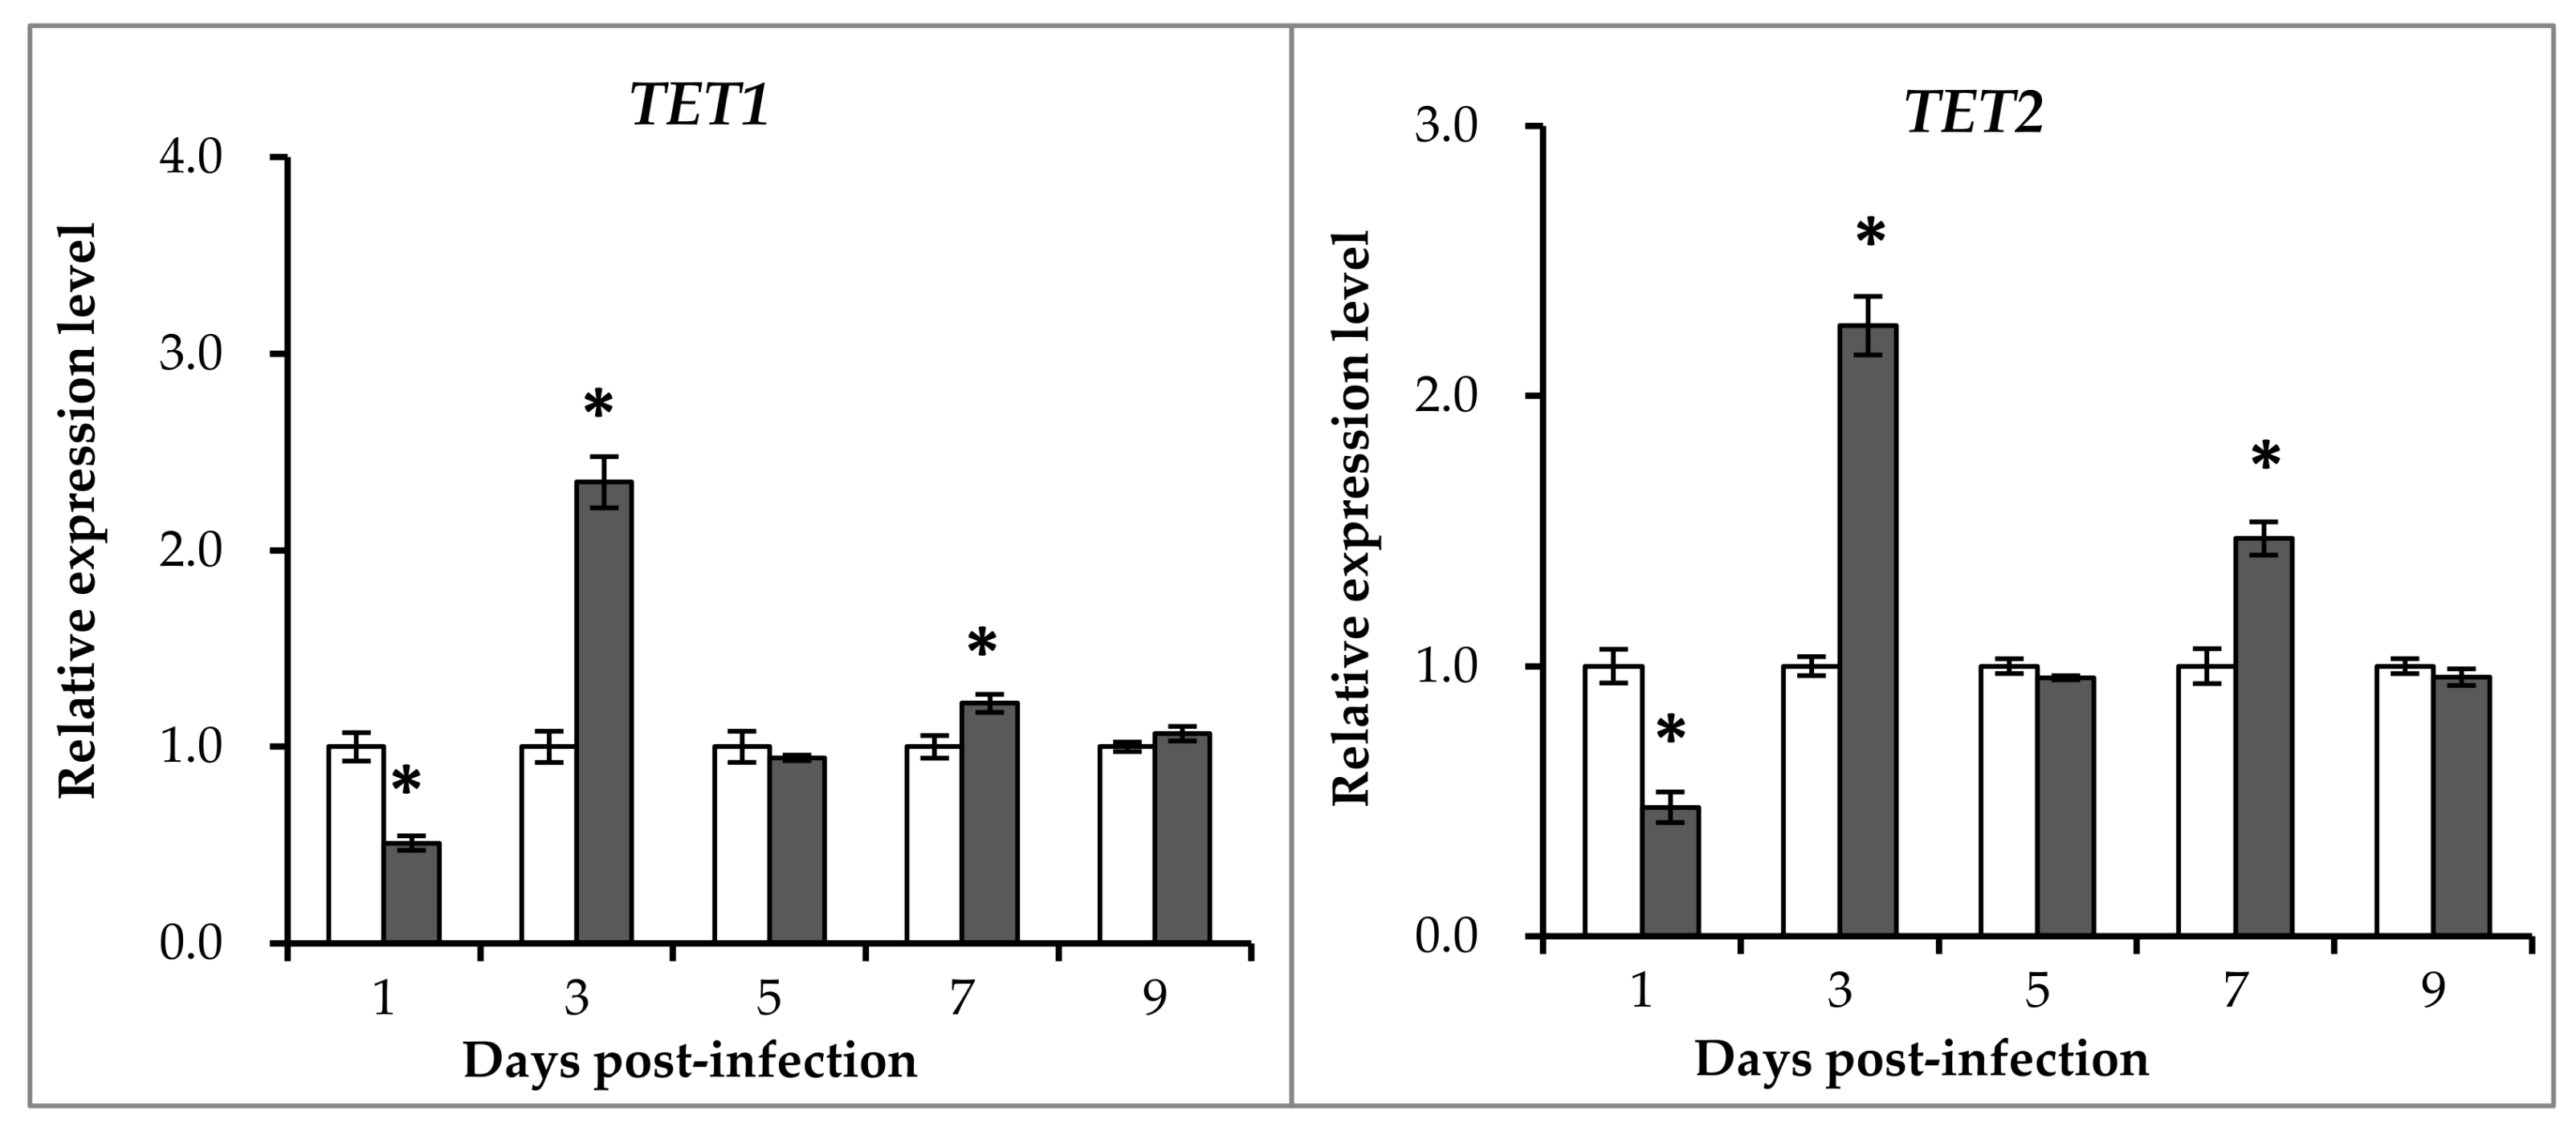
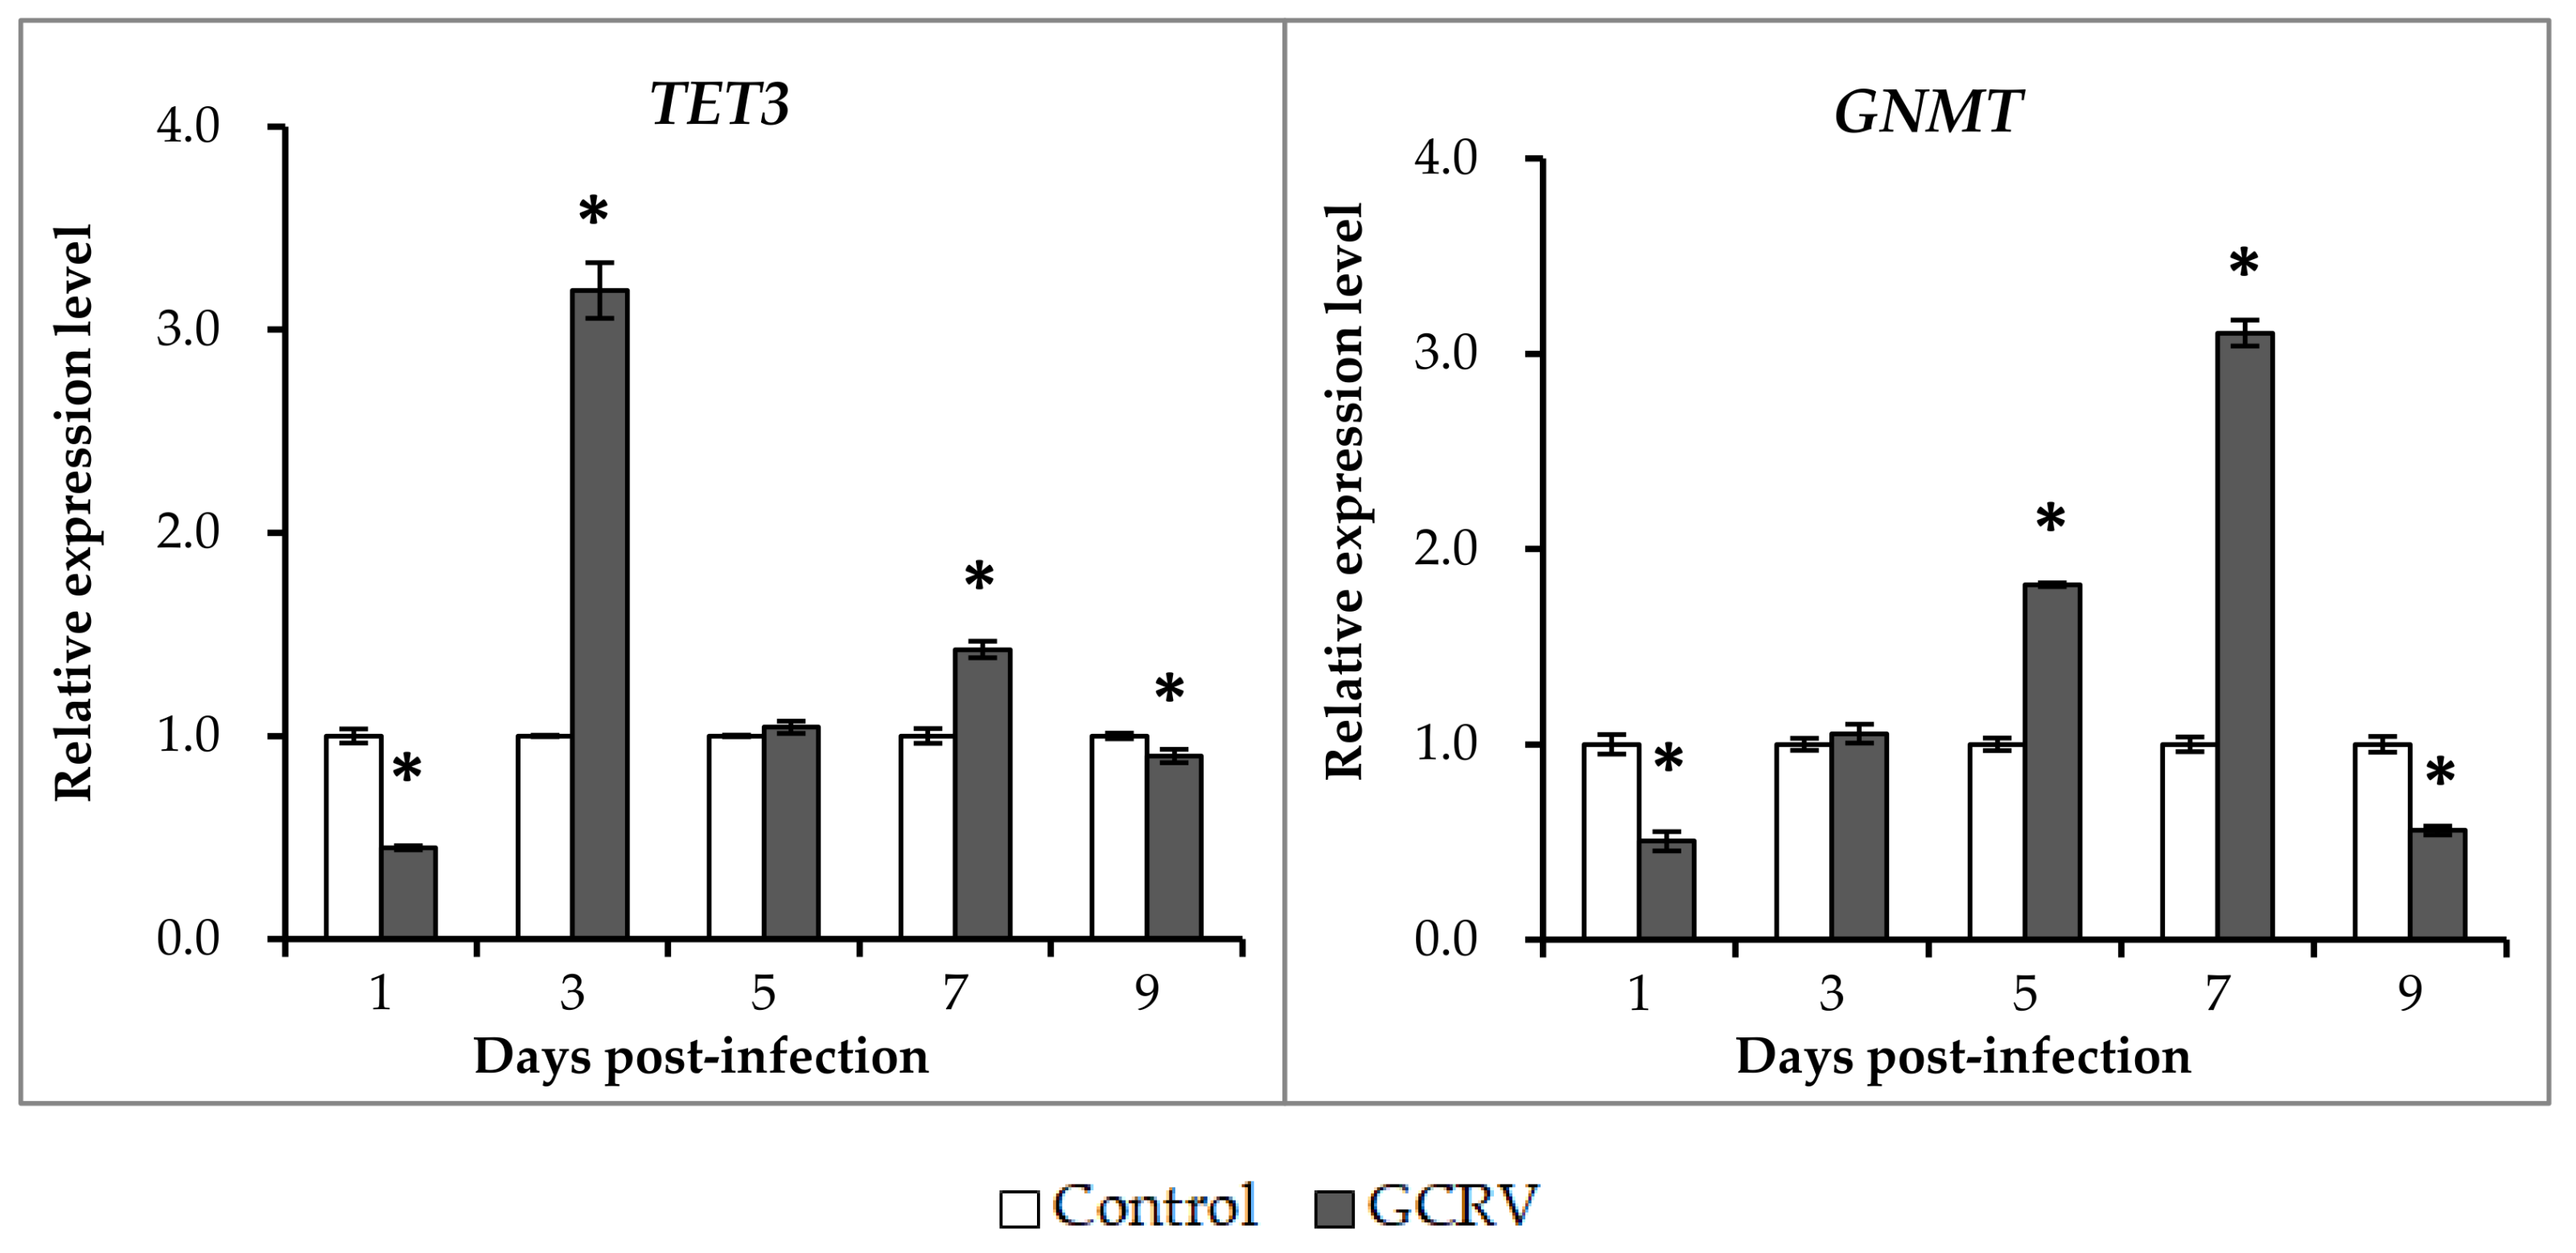
2.4. Expression Patterns of Ten-Eleven Translocation Proteins and Glycine N-methyltransferase after GCRV Exposure

In addition to DNMTs, ten-eleven translocation proteins (TETs) and glycine N-methyltransferase (GNMT) have also been reported to directly affect DNA methylation levels. Therefore, the expression patterns of three TETs (TET-1, TET-2, and TET-3) and the GNMT gene were investigated in this study. As shown in Figure 4, similar expression patterns were observed for the three TET genes. The expression levels of the three genes in the GCRV-infected group were lower than those of the control group at the first days post-infection, and higher than the control group at 3 and 7 days post-infection. For the GNMT genes, expression levels in the infected group were significantly higher than those in the control group at 5 and 7 days post-infection and slightly lower than the control group at the first and the last days (1 and 9 days post-infection).

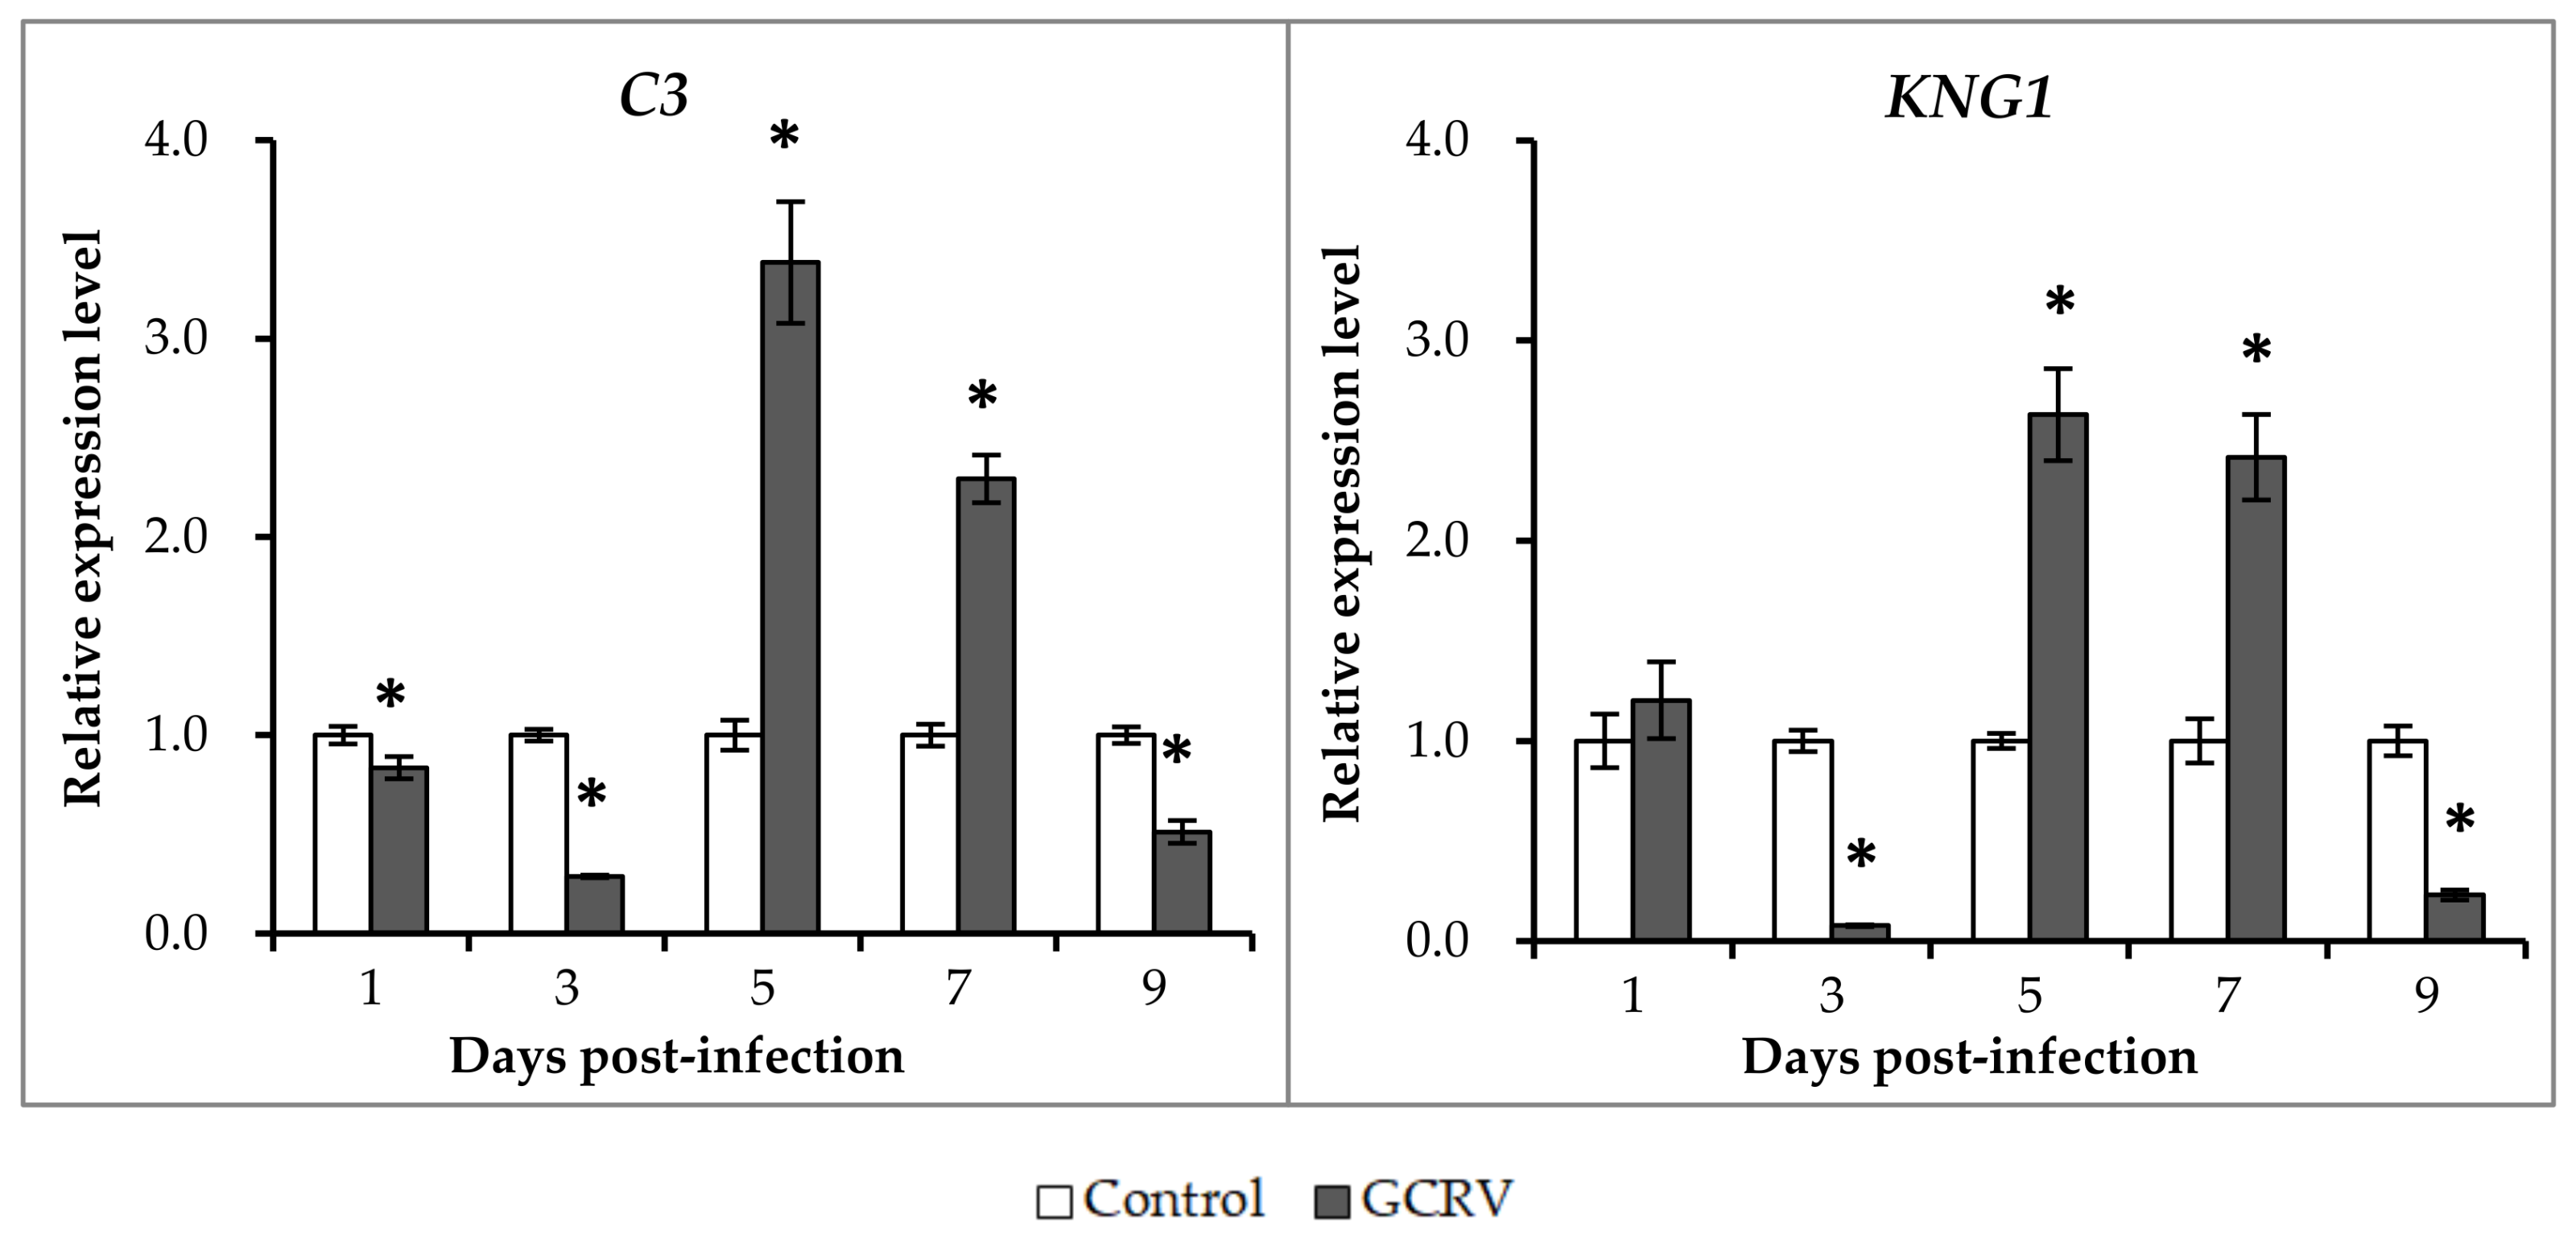
2.5. Expression Patterns of Representative Complement Genes after GCRV Infection

In our previous study, we showed that the activation of the “complement and coagulation cascade” pathways may account for the hemorrhagic symptoms after GCRV infection [29]. In the present study, two representative complement genes, C3 and KNG1, were selected to investigate their expression patterns after GCRV infection. As shown in Figure 5, a similar expression profile was observed for the two complement genes. The expression levels of the two genes were similar between the two groups at the first days after GCRV infection, whereas it was decreased in the GCRV-infected group at 3 days post-infection when compared to control group. However, a remarkable increase of the expression level was detected at 5 and 7 days post-infection in the infected group when compared with the control group. This increase was not persistent in the infected group, and declined at 9 days post-infection.

2.6. Methylation Changes in the 5′ flanking Region of C3 and KNG1 after GCRV Infection

The above results showed that the expression levels of two complement genes were significant altered after exposure to GCRV. To investigate whether the change of the expression levels were associated with the change of DNA methylation levels in the 5′ flanking regions of the two genes, bisulfite sequencing PCR was carried out for candidate CpG loci around the transcriptional start sites (TSSs) or translation initiation sites (TISs). As shown in Figure 6a, four representative CpG loci were selected in the 5′ flanking regions of both the C3 and KNG1 genes. The DNA of spleen samples from each group in each time-point were bisulfite treatment and subjected to bisulfite sequencing PCR. As shown in Figure 6b, for the C3 gene, the DNA methylation level in the control group was slightly changed and ranged from 59.67 ± 2.02% to 65.00 ± 2.50% during the infection process. However, remarkable change of DNA methylation levels were observed in the GCRV-infected group. At 3 days post-infection, the DNA methylation level in the infected group was significantly higher than that of the control group (p < 0.05), while it was clearly decreased at 5 and 7 days post-infection (p < 0.05). For the KNG1 gene, the methylation levels in both the infected and control groups were greater than that of C3 gene. Specifically, DNA methylation levels showed no significant difference between the two groups during the first days post-infection. However, the methylation level in the infected group was significantly higher than that in the control group at 3 and 9 days post-infection (p < 0.05), whereas it declined at 5 and 7 days post-infection (p < 0.05).

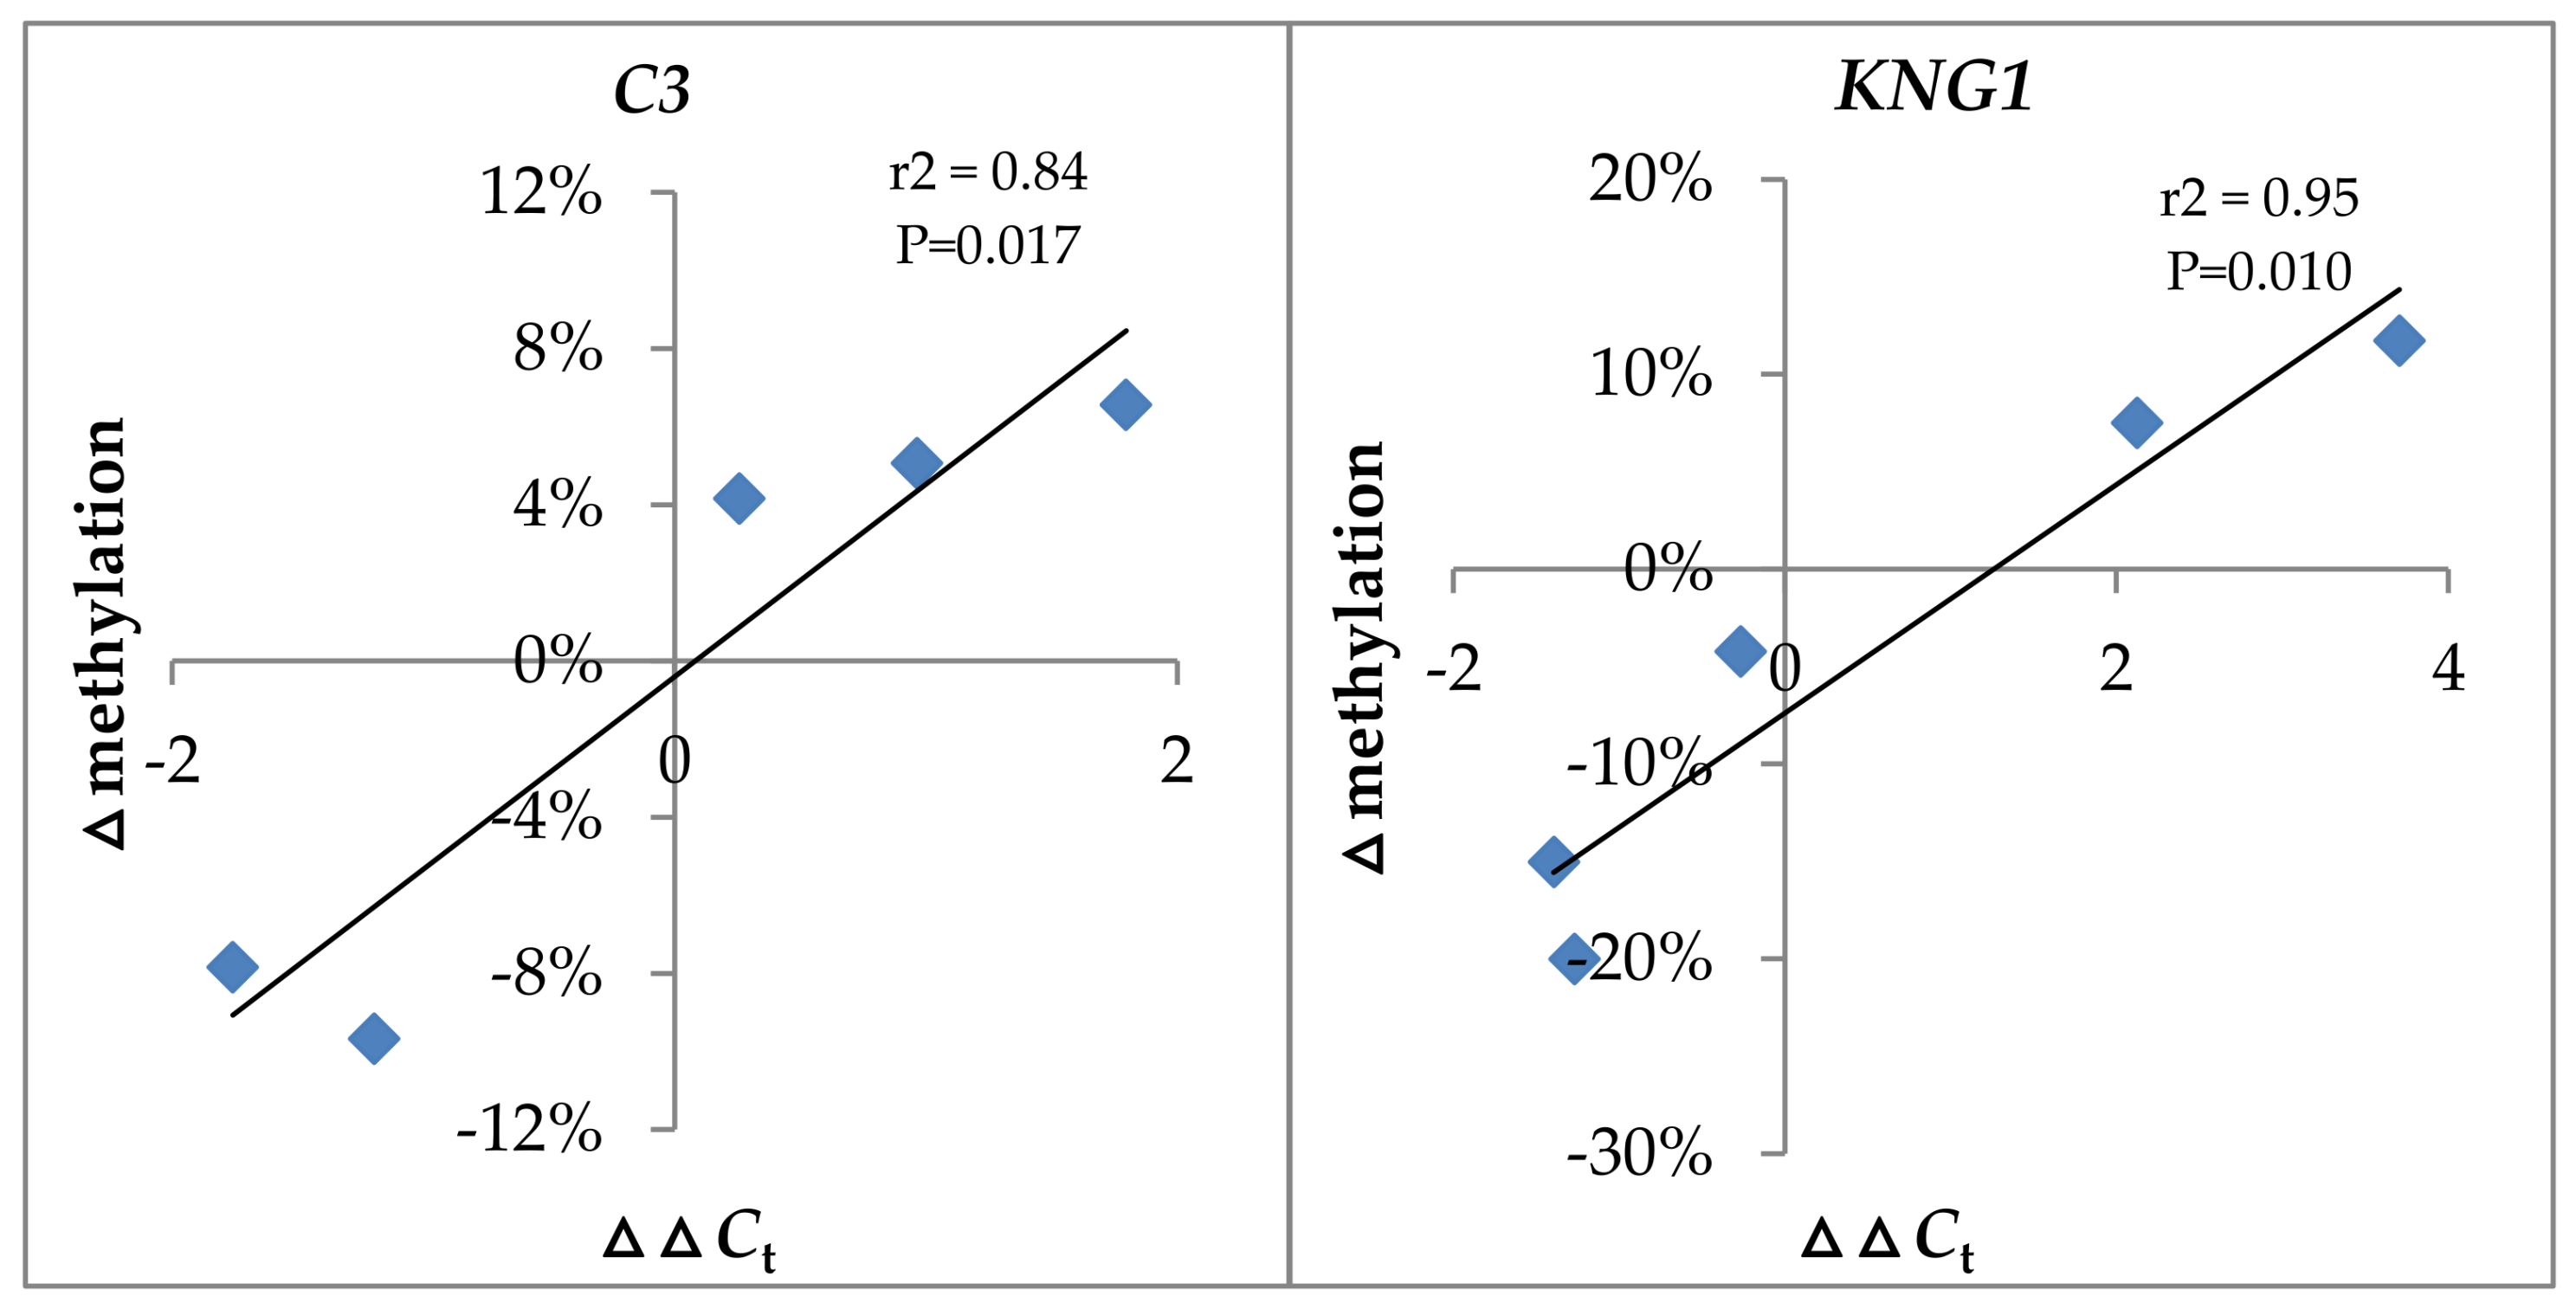
2.7. The Relationship between Expression Level and DNA Methylation Level of C3 and KNG1 after GCRV Infection

Based on the above results, we assumed a negative correlation between gene expression and DNA methylation levels for the two genes. To further confirm our hypothesis, correlation analysis was performed by the Statistical Product and Service Solutions (SPSS) software. The ΔΔCt value was used to evaluate the gene expression level whereas the Δmethylation between the infected and control groups was used to assess the DNA methylation level. As shown in Figure 7, for the C3 gene, there is a significant positive correlation between ΔΔCt and Δmethylation (r2 = 0.84, p = 0.017). In addition, a similar result was also obtained for the KNG1 gene (r2 = 0.95, p = 0.010). However, it should be mentioned that a high ΔΔCt value indicated a low gene expression level. Therefore, these results strongly suggest a negative correlation between gene expression and DNA methylation levels for the two genes.

3. Discussion

Epigenetics refers to heritable changes in gene function whereas DNA sequence does not change [30]. Epigenetic regulatory mechanisms include DNA methylation, histone modification, chromatin remodeling, and non-coding RNAs [31], of which DNA methylation is the most broadly studied and well-characterized epigenetic modification [32]. In the current study, the global and complement gene-specific DNA methylation in grass carp after GCRV infection were investigated in order to uncover the mechanism underlying GCRV infection.
Global DNA methylation measurement showed that the DNA methylation level in GCRV-infected group was significant higher than that of control group at 3, 5, 7, and 9 days post-infection, while no significant differences were observed in the first days post-infection. In general, DNA methylation in promoter regions was negatively correlated with gene expression level [5]. Therefore, the up-regulation of DNA methylation may suggest that the global gene expression level of the host was decreased after GCRV infection. After infection, normal host gene expression maybe hijacked or shutoff by the virus in order to benefit the virus’s own gene transcription and translation [33,34,35]. Therefore, it is clear that the global DNA methylation level was up-regulated after GCRV infection. A similar phenomenon was also reported in other viral infections. In the development of Epstein–Barr-virus-associated gastric carcinoma, DNA hypermethylation was observed [36]. The total DNA methylation level was significantly up-regulated in the thymus and bursa of chicken after H5N1 influenza viral infection (A-H5N1 strain) [37].
DNA methyltransferases (DNMTs) are important enzymes that are involved in DNA methylation [14]. Therefore, the expression profile of these genes was examined after GCRV infection. For the four DNMT genes that were examined, the expression levels in the infected group were significantly higher than those of the control group in the first days post-infection (Figure 3), whereas the global DNA methylation level showed no difference between the two groups at these time-points. In contrast to DNMTs, TETs are involved in demethylation which converts 5mC to 5-hydroxymethylcytosine (5hmC) and ultimately to a regular unmethylated cytosine residue [20,38]. GNMT catalyzes the S-adenosyl-l-methionine-(SAM)-dependent methylation of glycine to form sarcosine and plays important roles in the regulation of the cellular SAM/SAH ratio [39]. Therefore, the DNA methylation level may be the cooperation of these enzymes. Thus, it is not surprising that the global DNA methylation level was not in accordance with the expression level of DNMTs. In chickens before and after Marek’s disease virus (MDV) infection, the expression levels of DNMT3a and DNMT3b were also not consistent with the global DNA methylation level [40]. The global methylation level in the heart of young and middle-aged pigs showed significant differences, whereas no difference was detected in the expression levels of DNMT1 and DNMT3a [41].
In our previous study, we showed that most of the genes involved in the “complement and coagulation cascades” pathways were significantly up-regulated at 7 days post GCRV infection, suggesting the activation of these pathways, which account for the hemorrhagic symptoms after GCRV infection [29]. Moreover, genes in these pathways were targeted by microRNAs [42], implying that epigenetic regulation took place after GCRV infection. To further reveal the epigenetic mechanisms, two representative complement genes were selected for bisulfite sequencing PCR to evaluate the methylation level in the infection process in spleen tissue. We chose spleen as the tissue for analysis because it is the major immune organ of fish and has a higher number of viral RNA copies [43]. Correlation analysis revealed that the DNA methylation level was negatively correlated with gene expression level. Therefore, these results suggested that complement genes after GCRV infection are not only targeted by microRNAs, but are also regulated by DNA methylation. Moreover, these results further prove that epigenetic regulation does indeed take place after GCRV infection. In addition, the viral copy number was determined in the infected fish (Figure 2b).It could be seen that a positive correlation between viral copy number and DNA methylation levels of both genes, suggesting the role of viral infection on the DNA methylation.
In conclusion, global and complement gene-specific DNA methylation in grass carp after GCRV infection was investigated. Global DNA methylation levels increased after GCRV infection. Expression levels of enzymes that are involved in DNA methylation were significantly altered after GCRV infection. Moreover, gene expression levels of representative complement genes were negatively correlated with DNA methylation levels after GCRV infection. Our work provides valuable information regarding the mechanism of GCRV infection.

4. Materials and Methods

4.1. Ethical Procedures

Animal welfare and experimental procedures were performed according to the Guide for the Care and Use of Laboratory Animals (Ministry of Science and Technology of China, 2006), and the protocol was approved by the committee of the Institute of Hydrobiology, Chinese Academy of Sciences (CAS). The reference number obtained was Y11201-1-301 (Approval date: 30 May 2016). All surgery was performed under eugenol anesthesia (Final concentration: 100 mg/L), and all efforts were made to minimize suffering.

4.2. Experimental Animals, Virus Exposure, and Sample Collection

Healthy grass carp, averaging 5 g in weight and 10 cm in length, were acclimatized in a circulating water system at 26–28 °C for 1 week and fed twice daily using a commercial diet. The photoperiod was 14 h:10 h light/dark and the dissolved oxygen in the water was maintained at 5–10 mg/L. Five grass carp were randomly selected for the PCR detection of GCRV with GCRV-specific primers (Table 1) to ensure that the fish were GCRV-free prior to the experiments. Then, the GCRV-free fish were divided into two groups (approximately 300 per group) that were maintained in separate tanks.
After no abnormal symptoms were observed in the two groups, viral challenge experiments were performed. In group I, fish were infected with GCRV (GCRV subtype II, 2.97 × 10³ RNA copy/µL) at a dose of 200 µL by intraperitoneal injection. In group II, fish were injected with an equal dose of PBS as a control group; 15 fish that contained three biological duplicates (n = 5 for each biological duplicate) from each group were collected and the spleens were removed for analysis at 1, 3, 5, 7, and 9 days post injection, respectively. For each biological duplicate, one half of the spleens were used to test the methylation level, while the other half was used to determine the gene expression level. Moreover, in order to calculate the total mortality in the two groups, the remaining fish in each group were monitored carefully and the number of dead fish was recorded. After no dead fish were recorded for seven consecutive days, the experiment was concluded and the total mortality was calculated.

4.3. DNA Isolation and Global DNA Methylation Measurement

Genomic DNA from the spleens of two groups was extracted using the traditional phenol–chloroform protocol with RNase treatment. DNA purity was checked using a NanoPhotometer spectrophotometer (IMPLEN, Munich, Germany) and the concentration was measured using the Qubit DNA Assay Kit with a Qubit 2.0 Flurometer (Life Technologies, Carlsbad, CA, USA). Global DNA methylation level was measured with the MethylFlash™ Global DNA Methylation (5-methylcytosine, 5-mC) ELISA Easy Kit (Epigentek, Brooklyn, NY, USA) according to the manufacturer’s protocol. The amount of input DNA for each assay was 100 ng to ensure optimal quantification. The analysis was performed on spleens of 15 grass carp (three biological duplicates, n = 5 for each biological duplicate) from each group in each time-point. For each biological duplicate, the DNA samples form five grass carp were mixed equivalently as a mixture for analysis. Data were shown as the mean ± standard deviation of three replicates.

4.4. Bisulfite Treatment and Sequencing

Bisulfite treatment of the DNA samples was carried out by using the EZ DNA Methylation-Gold™ Kit (Zymo Research, Irvine, CA, USA) according to the manufacturer’s instructions. In each biological duplicate, the DNA of five grass carp was mixed equivalently as a mixture for bisulfite treatment. Bisulfite-treated DNA was used for further analysis.
To verify whether the expression levels of complement genes were under methylation regulation, two representative complement genes, complement component 3 (C3) and kininogen-1 (KNG1), were selected. Genomic sequences of the two genes were extracted from the grass carp draft genome [44] and submitted to the online software Methprimer (http://www.urogene.org/cgi-bin/methprimer/methprimer.cgi) [45] to obtain the CpG island region and candidate CpG loci around the transcriptional start site (TSS) or translation initiation site (TIS). Specific methylation primers for bisulfite sequencing PCR were designed by Methprimer and verified again in Premier 5 software (Table 1). Moreover, an outer reverse primer was designed for each gene in order to improve the specificity of semi-nested BSP amplification. The DNA fragments were cloned into PMD18-T vector (TaKaRa, Shiga, Japan). Ten clones for each sample (biological duplicates) were randomly selected to sequence in order to evaluate the methylation status.

4.5. RNA Isolation and Quantitative Real-Time PCR (RT-qPCR)

TRizol reagent (Invitrogen, Carlsbad, CA, USA) was used to isolate RNA from spleen samples according the manufacturer’s protocol. The Qubit RNA assay kit (Life Technologies, Carlsbad, CA, USA) and RNA Nano 6000 assay kit (Agilent Technologies, Santa Clara, CA, USA) were used to measure the concentration and integrity of isolated RNA, respectively. DNase I (Promega, Madison, WI, USA)-treated total RNA was used as the template for the first-strand cDNA synthesis.
To investigate the gene expression levels of DNMT1, DNMT2, DNMT6, DNMT7, TET-1, TET-2, TET-3, GNMT, C3, and KNG1, RT-qPCR was carried out using a fluorescence quantitative PCR instrument (Bio-Rad, Hercules, CA, USA). The primer sequences are shown in Table 1. Each RT-qPCR mixture contained 10 μL 2× SYBR green master mix (Toyobo, Osaka, Japan), 7.4 μL ddH2O, 0.8 μL forward and reverse primers (for each primer), and 1 μL template. For each tested sample, three replicates (n = 5 for each biological replicates) were included. The β-actin gene was used as an internal control for normalization of gene expression. The program for RT-qPCR was as follows: 95 °C for 10 s, 40 cycles of 95 °C for 15 s, 58 °C for 15 s, and 72 °C for 30 s. The 2ΔΔCt method was used to calculate relative expression levels [46]. Data represent the mean ± standard deviation (S.D.) of three replicates.
In addition, to determine the viral loads in the GCRV-infected group at different times after challenge, the relative copy numbers of the virus were examined by RT-qPCR using specific primers for the S6 segments of the GCRV (Table 1). The program and reaction mixture for qPCR were the same as above. Data were also represented as mean ± SD of three replicates.

4.6. Statistical Analysis

One-way ANOVA and Fisher’s least significant difference (LSD) posttest were used to determine the statistical significance between experimental groups and controls. Differences were considered significant at p < 0.05. Moreover, the correlation between ΔΔCt value of the two genes and methylation level of the CpGs in the 5′ flanking region of the two genes were examined using Pearson’s correlation coefficient in the Statistical Product and Service Solutions (SPSS) software; p < 0.05 was also considered for significant differences.

Acknowledgments

This work was supported by grants from the National Natural Science Foundation of China (31721005 and 31702332), the Strategic Priority Research Programme of Chinese Academy of Sciences (XDA08030203), and the Hubei Natural Science Foundation of China (2015CFA007).

Author Contributions

Libo He, Yaping Wang, and Zuoyan Zhu conceived and designed the experiments; Lv Xiong, Libo He, Lifei Luo , Yongming Li, Lanjie Liao, and Rong Huang performed the experiments; Lv Xiong and Libo He analyzed the data; Lv Xiong, Lifei Luo and Yongming Li contributed reagents/materials/analysis tools.

Conflicts of Interest

The authors declare no conflict of interest. The founding sponsors had no role in the design of the study; in the collection, analyses, or interpretation of data; in the writing of the manuscript, and in the decision to publish the results.

Abbreviations

C3complement component 3
CpGcytosine-phosphor-guanine
DNMTDNA methyltransferase
GCRVgrass carp reovirus
GNMTglycine N-methyltransferase
KNG1kininogen-1
LSDleast significant difference
MDVMarek’s disease virus
TETsten-eleven translocation proteins
TIStranslation initiation site
TSStranscriptional start site
SAMS-adenosyl-l-methionine
SPSSStatistical Product and Service Solutions
5hmC5-hydroxymethylcytosine
5-mC5-methylcytosine

References

  1. Food and Agriculture Organization (FAO). Fishery and Aquaculture Statistics Yearbook; Food and Agriculture Organization of the United Nations: Rome, Italy, 2016. [Google Scholar]
  2. Wang, Q.; Zeng, W.; Liu, C.; Zhang, C.; Wang, Y.; Shi, C.; Wu, S. Complete genome sequence of reovirus isolated from grass carp, indicating different genotypes of GCRV in China. J. Virol. 2012, 86, 12466. [Google Scholar] [CrossRef] [PubMed]
  3. Rao, Y.; Su, J. Insights into the antiviral immunity against grass carp (Ctenopharyngodon idella) reovirus (GCRV) in grass carp. J. Immunol. Res. 2015, 2015, 670437. [Google Scholar] [CrossRef] [PubMed]
  4. Varriale, A. DNA methylation, epigenetics, and evolution in vertebrates: Facts and challenges. Int. J. Evol. Biol. 2014, 2014, 475981. [Google Scholar] [CrossRef] [PubMed]
  5. Bird, A.P. CpG-rich islands and the function of DNA methylation. Nature 1986, 321, 209–213. [Google Scholar] [CrossRef] [PubMed]
  6. Caiafa, P.; Zampieri, M. DNA methylation and chromatin structure: The puzzling CpG islands. J. Cell. Biochem. 2005, 94, 257–265. [Google Scholar] [CrossRef] [PubMed]
  7. Weber, M.; Hellmann, I.; Stadler, M.B.; Ramos, L.; Pääbo, S.; Rebhan, M.; Schübeler, D. Distribution, silencing potential and evolutionary impact of promoter DNA methylation in the human genome. Nat. Genet. 2007, 39, 457–466. [Google Scholar] [CrossRef] [PubMed]
  8. Meissner, A.; Mikkelsen, T.S.; Gu, H.; Wernig, M.; Hanna, J.; Sivachenko, A.; Zhang, X.; Bernstein, B.E.; Nusbaum, C.; Jaffe, D.B.; et al. Genome-scale DNA methylation maps of pluripotent and differentiated cells. Nature 2008, 454, 766–770. [Google Scholar] [CrossRef] [PubMed]
  9. Hinoue, T.; Weisenberger, D.J.; Lange, C.P.; Shen, H.; Byun, H.M.; Van Den Berg, D.; Malik, S.; Pan, F.; Noushmehr, H.; van Dijk, C.M.; et al. Genome-scale analysis of aberrant DNA methylation in colorectal cancer. Genome Res. 2012, 22, 271–282. [Google Scholar] [CrossRef] [PubMed]
  10. Liu, Y.; Yuan, C.; Chen, S.; Zheng, Y.; Zhang, Y.; Gao, J.; Wang, Z. Global and cyp19a1a gene specific DNA methylation in gonads of adult rare minnow Gobiocypris rarus under bisphenol A exposure. Aquat. Toxicol. 2014, 156, 10–16. [Google Scholar] [CrossRef] [PubMed]
  11. Shang, X.; Wan, Q.; Su, J.; Su, J. DNA methylation of CiRIG-I gene notably relates to the resistance against GCRV and negatively-regulates mRNA expression in grass carp, Ctenopharyngodon idella. Immunobiology 2016, 221, 23–30. [Google Scholar] [CrossRef] [PubMed]
  12. Shang, X.; Su, J.; Wan, Q.; Su, J. CpA/CpG methylation of CiMDA5 possesses tight association with the resistance against GCRV and negatively regulates mRNA expression in grass carp, Ctenopharyngodon idella. Dev. Comp. Immunol. 2015, 48, 86–94. [Google Scholar] [CrossRef] [PubMed]
  13. Li, S.; He, F.; Wen, H.; Li, J.; Si, Y.; Liu, M.; Huang, Y.; Meng, L. Low salinity affects cellularity, DNA methylation, and mRNA expression of igf1 in the liver of half smooth tongue sole (Cynoglossus semilaevis). Fish Physiol. Biochem. 2017, 43, 1587–1602. [Google Scholar] [CrossRef] [PubMed]
  14. Hermann, A.; Gowher, H.; Jeltsch, A. Biochemistry and biology of mammalian DNA methyltransferases. Cell. Mol. Life Sci. 2004, 61, 2571–2587. [Google Scholar] [CrossRef] [PubMed]
  15. Goll, M.G.; Bestor, T.H. Eukaryotic cytosine methyltransferases. Annu. Rev. Biochem. 2005, 74, 481–514. [Google Scholar] [CrossRef] [PubMed]
  16. Rai, K.; Nadauld, L.D.; Chidester, S.; Manos, E.J.; James, S.R.; Karpf, A.R.; Cairns, B.R.; Jones, D.A. Zebrafish Dnmt1 and Suv39h1 regulate organ-specific terminal differentiation during development. Mol. Cell. Biol. 2006, 26, 7077–7085. [Google Scholar] [CrossRef] [PubMed]
  17. Li, J.Y.; Pu, M.T.; Hirasawa, R.; Li, B.Z.; Huang, Y.N.; Zeng, R.; Jing, N.H.; Chen, T.; Li, E.; Sasaki, H.; et al. Synergistic function of DNA methyltransferases Dnmt3a and Dnmt3b in the methylation of Oct4 and Nanog. Mol. Cell. Biol. 2007, 27, 8748–8759. [Google Scholar] [CrossRef] [PubMed]
  18. Campos, C.; Valente, L.M. Fernandes JM. Molecular evolution of zebrafish dnmt3 genes and thermal plasticity of their expression during embryonic development. Gene 2012, 500, 93–100. [Google Scholar] [CrossRef] [PubMed]
  19. Fang, X.; Dong, W.; Thornton, C.; Willett, K.L. Benzo[a]pyrene effects on glycine N-methyltransferase mRNA expression and enzyme activity in Fundulus heteroclitus embryos. Aquat. Toxicol. 2010, 98, 130–138. [Google Scholar] [CrossRef] [PubMed]
  20. Ito, S.; D’Alessio, A.C.; Taranova, O.V.; Hong, K.; Sowers, L.C.; Zhang, Y. Role of Tet proteins in 5mC to 5hmC conversion, ES-cell self-renewal and inner cell mass specification. Nature 2010, 466, 1129–1133. [Google Scholar] [CrossRef] [PubMed]
  21. Wu, H.; Zhang, Y. Mechanisms and functions of Tet protein-mediated 5-methylcytosine oxidation. Genes Dev. 2011, 25, 2436–2452. [Google Scholar] [CrossRef] [PubMed]
  22. Ge, L.; Zhang, R.P.; Wan, F.; Guo, D.Y.; Wang, P.; Xiang, L.X.; Shao, J.Z. TET2 plays an essential role in erythropoiesis by regulating lineage-specificgenes via DNA oxidative demethylation in a zebrafish model. Mol. Cell. Biol. 2014, 34, 989–1002. [Google Scholar] [CrossRef] [PubMed]
  23. Zhou, Y.; Fan, Y.D.; Zeng, L.B.; Ma, J. Prokaryotic expression and immunoassay of grass carp reovirus capsid VP6 protein. Acta Virol. 2013, 57, 456–461. [Google Scholar] [CrossRef] [PubMed]
  24. Jian, J.C.; Wang, Y.; Yan, X.Y.; Ding, Y.; Wu, Z.H.; Lu, Y.S. Molecular cloning and prokaryotic expression of vp5 gene of grass carp reovirus strain GCRV096. Virus Genes 2013, 47, 483–489. [Google Scholar] [CrossRef] [PubMed]
  25. Jing, H.L.; Zhang, L.F.; Fang, Z.Z.; Xu, L.P.; Zhang, M.; Wang, N.; Jiang, Y.L.; Lin, X.M. Detection of grass carp reovirus (GCRV) with monoclonal antibodies. Arch. Virol. 2014, 159, 649–655. [Google Scholar]
  26. Zeng, W.; Wang, Y.; Liang, H.; Liu, C.; Song, X.; Shi, C.; Wu, S.; Wang, Q. A one-step duplex rRT-PCR assay for the simultaneous detection of grass carp reovirus genotypes I and II. J. Virol. Methods 2014, 210C, 32–35. [Google Scholar] [CrossRef] [PubMed]
  27. Zhu, B.; Liu, G.L.; Gong, Y.X.; Ling, F.; Wang, G.X. Protective immunity of grass carp immunized with DNA vaccine encoding the vp7 gene of grass carp reovirus using carbon nanotubes as a carrier molecule. Fish Shellfish Immunol. 2015, 42, 325–334. [Google Scholar] [CrossRef] [PubMed]
  28. Xu, D.; Song, L.; Wang, H.; Xu, X.; Wang, T.; Lu, L. Proteomic analysis of cellular protein expression profiles in response to grass carp reovirus infection. Fish Shellfish Immunol. 2015, 44, 515–524. [Google Scholar] [CrossRef] [PubMed]
  29. He, L.; Zhang, A.; Pei, Y.; Chu, P.; Li, Y.; Huang, R.; Liao, L.; Zhu, Z.; Wang, Y. Differences in responses of grass carp to different types of grass carp reovirus(GCRV) and the mechanism of hemorrhage revealed by transcriptome sequencing. BMC Genom. 2017, 18, 452. [Google Scholar] [CrossRef] [PubMed]
  30. Bird, A. Perceptions of epigenetics. Nature 2007, 447, 396–398. [Google Scholar] [CrossRef] [PubMed]
  31. Egger, G.; Liang, G.; Aparicio, A.; Jones, P.A. Epigenetics in human disease and prospects for epigenetic therapy. Nature 2004, 429, 457–463. [Google Scholar] [CrossRef] [PubMed]
  32. Serman, A.; Vlahović, M.; Serman, L.; Bulić-Jakus, F. DNA methylation as a regulatory mechanism for gene expression in mammals. Coll. Antropol. 2006, 30, 665–671. [Google Scholar] [PubMed]
  33. Lyles, D.S. Cytopathogenesis and inhibition of host gene expression by RNA viruses. Microbiol. Mol. Biol. Rev. 2000, 64, 709–724. [Google Scholar] [CrossRef] [PubMed]
  34. Pulgar, R.; Hödar, C.; Travisany, D.; Zuñiga, A.; Domínguez, C.; Maass, A.; González, M.; Cambiazo, V. Transcriptional response of Atlantic salmon families to Piscirickettsia salmonis infection highlights the relevance of the iron-deprivation defence system. BMC Genom. 2015, 16, 495. [Google Scholar] [CrossRef] [PubMed]
  35. Gale, M., Jr.; Tan, S.L.; Katze, M.G. Translational control of viral gene expression in eukaryotes. Microbiol. Mol. Biol. Rev. 2000, 64, 239–280. [Google Scholar] [CrossRef] [PubMed]
  36. Choi, S.J.; Shin, Y.S.; Kang, B.W.; Kim, J.G.; Won, K.J.; Lieberman, P.M.; Cho, H.; Kang, H. DNA hypermethylation induced by Epstein-Barr virus in the development of Epstein-Barr virus-associated gastric carcinoma. Arch. Pharm. Res. 2017, 40, 894–905. [Google Scholar] [CrossRef] [PubMed]
  37. Zhang, Y.H.; Meng, J.L.; Gao, Y.; Zhang, J.Y.; Niu, S.L.; Yu, X.Z.; Li, Y.B.; Guan, Y.T.; Sun, B.X.; Zhao, Z.H. Changes in methylation of genomic DNA from chicken immune organs in response to H5N1 influenza virus infection. Genet. Mol. Res. 2016, 15. [Google Scholar] [CrossRef] [PubMed]
  38. Liyanage, V.R.; Jarmasz, J.S.; Murugeshan, N.; Del Bigio, M.R.; Rastegar, M.; Davie, J.R. DNA modifications: Function and applications in normal and disease States. Biology (Basel) 2014, 3, 670–723. [Google Scholar] [CrossRef] [PubMed]
  39. Takata, Y.; Huang, Y.; Komoto, J.; Yamada, T.; Konishi, K.; Ogawa, H.; Gomi, T.; Fujioka, M.; Takusagawa, F. Catalytic mechanism of glycine N-methyltransferase. Biochemistry 2003, 42, 8394–8402. [Google Scholar] [CrossRef] [PubMed]
  40. Tian, F.; Zhan, F.; VanderKraats, N.D.; Hiken, J.F.; Edwards, J.R.; Zhang, H.; Zhao, K.; Song, J. DNMT gene expression and methylome in Marek’s disease resistant and susceptible chickens prior to and following infection by MDV. Epigenetics 2013, 8, 431–444. [Google Scholar] [CrossRef] [PubMed]
  41. Jin, L.; Jiang, Z.; Xia, Y.; Lou, P.; Chen, L.; Wang, H.; Bai, L.; Xie, Y.; Liu, Y.; Li, W.; et al. Genome-wide DNA methylation changes in skeletal muscle between young and middle-aged pigs. BMC Genom. 2014, 15, 653. [Google Scholar] [CrossRef] [PubMed]
  42. He, L.; Zhang, A.; Chu, P.; Li, Y.; Huang, R.; Liao, L.; Zhu, Z.; Wang, Y. Deep Illumina sequencing reveals conserved and novel microRNAs in grass carp in response to grass carp reovirus infection. BMC Genom. 2017, 18, 195. [Google Scholar] [CrossRef] [PubMed]
  43. Liang, H.R.; Li, Y.G.; Zeng, W.W.; Wang, Y.Y.; Wang, Q.; Wu, S.Q. Pathogenicity and tissue distribution of grass carp reovirus after intraperitoneal administration. Virol. J. 2014, 11, 178. [Google Scholar] [CrossRef] [PubMed]
  44. Wang, Y.; Lu, Y.; Zhang, Y.; Ning, Z.; Li, Y.; Zhao, Q.; Lu, H.; Huang, R.; Xia, X.; Feng, Q.; et al. The draft genome of the grass carp (Ctenopharyngodon idellus) provides genomic insights into its evolution and vegetarian diet adaptation. Nat. Genet. 2015, 47, 625–631. [Google Scholar] [CrossRef] [PubMed]
  45. Li, L.C.; Dahiya, R. MethPrimer: Designing primers for methylation PCRs. Bioinformatics 2002, 18, 27–31. [Google Scholar] [CrossRef]
  46. Livak, K.J.; Schmittgen, T.D. Analysis of relative gene expression data using real-time quantitative PCR and the 2−ΔΔCt Method. Methods 2001, 25, 402–408. [Google Scholar] [CrossRef] [PubMed]
Figure 1. The fish after grass carp reovirus (GCRV) infection. (a) Cumulative mortality of fish. Fish were infected with 200 µL GCRV or PBS by intraperitoneal injection, respectively. The number of dead fish in each group was counted every day until no deaths were recorded for seven consecutive days. (b) Relative copy number of GCRV in infected fish. Data represent mean ± standard deviation of three replicates. Significant difference (p < 0.05) is indicated with asterisks (*). (c) The clinical symptom of fish after GCRV infection.
Ijms 19 01110 g001
Figure 2. Global DNA methylation level of grass carp after GCRV infection. The spleen samples of two groups at different time points were obtained and global DNA methylation level was analyzed. Data were shown as the mean ± standard deviation of three replicates (n = 5 for each biological duplicate). Significant difference (p < 0.05) in DNA methylation level between the two groups are indicated with an asterisk (*).
Ijms 19 01110 g002
Figure 3. qRT-PCR analysis of the expression levels of DNA methyltransferases (DNMTs) after GCRV infection. The relative expression levels of genes were calculated as the ratio of gene expression levels in the GCRV-infected group relative to those in the control group at the same time points. All data represent the mean ± standard deviation of three replicates (n = 5 for each biological duplicate). Significant difference (p < 0.05) in gene expression levels between the two groups are indicated with an asterisk (*).
Ijms 19 01110 g003aIjms 19 01110 g003b
Figure 4. qRT-PCR analysis of the expression level of ten-eleven translocation proteins (TETs) and glycine N-methyltransferase (GNMT) after GCRV infection. The relative expression levels of genes were calculated as the ratio of gene expression levels in the GCRV-infected group relative to those in the control group at the same time-points. All data represent the mean ± standard deviation of three replicates (n = 5 for each biological duplicate). Significant differences (p < 0.05) in gene expression levels between the two groups are indicated with an asterisk (*).
Ijms 19 01110 g004aIjms 19 01110 g004b
Figure 5. qRT-PCR analysis of the expression levels of C3 and KNG1 after GCRV infection. The relative expression levels of the genes were calculated as the ratio of gene expression level in GCRV infected group relative to that in the control group at the same time-point. All data represent the mean ± standard deviation of three replicates (n = 5 for each biological duplicate). Significant difference (p < 0.05) in gene expression level between the two groups are indicated with an asterisk (*).
Ijms 19 01110 g005
Figure 6. The DNA methylation level in the 5′ flanking region of C3 and KNG1 after GCRV infection. (a) A schematic diagram of CpG loci in the 5′ flanking region of C3 and KNG1 genes. Four CpG loci were selected in both C3 (-293, -192, -164, and -132) and KNG1 (-215, -207, -115, and -104) genes for BSP-PCR. (b) Changes of DNA methylation levels after GCRV infection. Data are shown as the mean ± standard deviation of three biological duplicates (n = 5 for each biological duplicate). Significant difference (p < 0.05) in DNA methylation level between the two groups are indicated with an asterisk (*).
Ijms 19 01110 g006
Figure 7. Correlation analysis between gene expression and DNA methylation levels of C3 and KNG1 after GCRV infection. The ΔΔCt value was used to evaluate gene expression levels whereas the Δmethylation between the infected and control groups was used to assess the DNA methylation level.
Ijms 19 01110 g007
Table 1. Primers used in the study.
PrimersSequences (5′ to 3′)Usage
GCRV-FGGCGGCTGCTATGATACCAGTAGACGCRV detection
GCRV-RGTCGCTTCAGATCAATCACCAAATC
C3-BSP-FTTAGAGGGTTATTATGTTGAGTATTTBSP PCR of C3
C3-BSP-RAAAACTCATAAAACCATTCAACTC
C3-BSP-outer-RAACAATATAAATTTTTCAAAAAATTC
KNG1-BSP-FTGTAAAGGTTTTTGTGAAGGTTTTTBSP PCR of KNG1
KNG1-BSP-RCCACTAAACTCTATCCTCCCCTATAATA
KNG1-BSP-outer-RTCTCTACTCTTCTAAAAACCCAACAA
Qdnmt1-FCCACCGAAATGTGCCGACTGQPCR of dnmt1
Qdnmt1-RGGTGCCCATGCTTGTCATACAC
Qdnmt2-FAAGTCTCAAAGCCCTTCACATTCTCQPCR of dnmt2
Qdnmt2-RACTACCCCACTCCTGCCAAAAAC
Qdnmt6-FCAACCGCCACAGCCTCAAACTQPCR of dnmt6
Qdnmt6-RCCTCGGCCATCTCGTACTCTGAC
Qdnmt7-FGAGAAGCAAGTGGGCTCCTACGQPCR of dnmt7
Qdnmt7-RCAGCGATGGAGGTCGTAAGAGTT
Qtet1-FAGGCGTGTGAACATCAGGTGGQPCR of tet1
Qtet1-RAACCGAAAAACGGGGCATC
Qtet2-FCCTAACTCCAAAATAGACGGCACQPCR of tet2
Qtet2-RGATGCGGGGTCATTGGTTTA
Qtet3-FGCCGCATATCCCTGGTCTTCTAQPCR of tet3
Qtet3-RTCGTGTCATCACACCGTCTCGT
Qgnmt-FAGTCTGAATGCCCTCTGGTGGQPCR of gnmt
Qgnmt-RACCAGACTTCAAAGGGACCAAA
QC3-FATGGTTCGCAAACACTCCTCAGQPCR of C3
QC3-RACAGGTACTTGGCTTCTATGTCAACT
Qkng1-FTGAAGGTGCTCAACTGGCTCTQPCR of kng1
Qkng1-RAGTAACTCTTGACCTGCTTCTGTAAAC
Q-β-actin-FAGCCATCCTTCTTGGGTATGQPCR of β-actin
Q-β-actin-RGGTGGGGCGATGATCTTGAT
Q-GCRV-FAGCGCAGCAGGCAATTACTATCTQPCR of GCRV
Q-GCRV-RATCTGCTGGTAATGCGGAACG

