Article

Transcriptome Analysis of a Premature Leaf Senescence Mutant of Common Wheat (Triticum aestivum L.)

Key Laboratory of Crop Gene Resources and Germplasm Enhancement, Ministry of Agriculture, The National Key Facility for Crop Gene Resources and Genetic Improvement, Institute of Crop Science, Chinese Academy of Agricultural Sciences, Beijing 100081, China
*
Authors to whom correspondence should be addressed.
These authors contributed equally to this study.
Int. J. Mol. Sci. 2018, 19(3), 782; https://doi.org/10.3390/ijms19030782
Submission received: 26 January 2018 / Revised: 1 March 2018 / Accepted: 5 March 2018 / Published: 10 March 2018
(This article belongs to the Section Molecular Plant Sciences)

Abstract

:
Leaf senescence is an important agronomic trait that affects both crop yield and quality. In this study, we characterized a premature leaf senescence mutant of wheat (Triticum aestivum L.) obtained by ethylmethane sulfonate (EMS) mutagenesis, named m68. Genetic analysis showed that the leaf senescence phenotype of m68 is controlled by a single recessive nuclear gene. We compared the transcriptome of wheat leaves between the wild type (WT) and the m68 mutant at four time points. Differentially expressed gene (DEG) analysis revealed many genes that were closely related to senescence genes. Gene Ontology (GO) enrichment analysis suggested that transcription factors and protein transport genes might function in the beginning of leaf senescence, while genes that were associated with chlorophyll and carbon metabolism might function in the later stage. Kyoto Encyclopedia of Genes and Genomes (KEGG) pathway analysis showed that the genes that are involved in plant hormone signal transduction were significantly enriched. Through expression pattern clustering of DEGs, we identified 1012 genes that were induced during senescence, and we found that the WRKY family and zinc finger transcription factors might be more important than other transcription factors in the early stage of leaf senescence. These results will not only support further gene cloning and functional analysis of m68, but also facilitate the study of leaf senescence in wheat.

1. Introduction

Senescence plays a key role in the adaptability of plants. Effective senescence can enhance the adaptation of plants to the environment [1]. In crops, leaf senescence is an important agronomic trait that not only affects crop yield, but also affects crop quality [2,3]. Leaf senescence is the last stage of leaf development that can induce leaf cell death and nutrient transfer from senescing leaves to seeds or storage organs. This process is not a negative or unregulated degeneration step; rather, it is a positive step that involves fine gene regulation [4]. During senescence, the metabolism of leaf cells changes. Specifically, assimilation decreases the while catabolism is enhanced, e.g., chloroplast degradation occurs, the photosynthetic capacity decreases, and macromolecular material degrades [5]. Leaf senescence is affected by both internal and external factors. The former mainly include leaf age, foliar reactive oxygen species (ROS) levels, hormones, and sugar content. The latter mainly include lighting conditions, soil moisture, nutrient content, temperature, and pathogens [6,7]. Because the regulation of leaf senescence is so important and complicated, many studies on senescence-associated genes (SAGs) have been carried out in different plant species [5,8].
In recent years, with biotechnological development, many SAGs have been studied in various plant species. Many SAGs have been found to be involved in chlorophyll metabolism. For instance, GmSARK, which belongs to the LRR receptor-like kinase family, regulates leaf senescence by regulating chloroplast development and chlorophyll accumulation [9]. In Arabidopsis thaliana, At4G25080, At5G54190, At1G44446, and At3G51820, which encode magnesium protoporphyrin IX methyltransferase, protochlorophyllide reductase, chlorophyllide-a oxygenase, and bacteriochlorophyll a synthase, respectively, can affect chlorophyll synthesis and leaf development [10,11,12,13]. Another A. thaliana gene, pheophorbide a oxygenase (PAO), regulates chlorophyll degradation and leaf senescence [14]. Pentatricopeptide repeat (PPR) genes play important roles in regulating the expression of chloroplast genes, which results in leaf senescence in rice [15]. The PPR53 gene in maize can also control the expression of chloroplast genes by regulating the stability and translation of specific chloroplast RNAs [16]. Many GATA-zinc finger transcription factors have been found to be involved in the chlorophyll metabolism pathway. Mutation of the GNC gene, which belongs to the GATA-zinc transcription factor family, can destroy the chlorophyll synthesis process in A. thaliana [17]. In soybean, the over-expression of GmGATA44 can rescue the phenotype of the A. thaliana gnc mutant by reversing a deficiency in the chlorophyll content [18]. Overexpression of the GATA-zinc transcription factor OsGATA12 can delay senescence and enhance rice yield by elevating the chlorophyll content of leaves [19]. Additionally, Cytokinin responsive GATA transcription factor 1 (Cga1) has been reported to influence plant architecture by regulating the chlorophyll content in rice [20].
In addition, genes involved in plant hormone signal transduction and stress resistance also play important roles in the regulation of leaf senescence. For instance, the genes that participate in the ethylene (ET), jasmonic acid (JA), abscisic acid (ABA), and salicylic acid (SA) pathways can positively regulate leaf senescence, while other genes that are involved in the cytokinin (CK), indoleacetic acid (IAA), and gibberellin (GA) pathways may negatively regulate leaf senescence [21,22,23,24]. Orthologous genes OsNAP, GPC-B1 and AtNAP, belonging to the NAC transcription factor family, regulate leaf senescence through the ABA pathway, and promote the transcription of SAGs [25,26,27]. Receptor-like protein kinase 1 (RPK1), an ABA-inducible receptor kinase, positively regulates leaf senescence in A. thaliana [28]. AtMYB44 is involved in stress resistance and leaf senescence through interactions with ABA receptor pyrabactin resistance 8 (PYL8) [29]. In addition, AtWRKY53, AtWRKY54, AtWRKY70, and AtCAMs, which are induced during leaf senescence and cell death, are involved in the SA signaling pathway [30,31]. As a CK receptor, AHK3 transfers signals to downstream genes AHPs and ARR2, which can inhibit leaf senescence in A. thaliana [32]. IAA plays complicated roles in the regulation of leaf senescence. Studies have shown that the exogenous application of IAA could delay leaf senescence, and other reports have indicated that the early auxin response gene small auxin-up RNA (SAUR) could positively regulate leaf senescence [33,34]. PYL9 and OsSPL32 are involved in the stress response. Overexpression of PYL9 can enhance drought resistance and accelerate leaf senescence [35], and mutation of OsSPL32 can enhance the defense response and induce leaf senescence in rice [36].
Although wheat is one of the most important crops in the world and approximately 20 percent of global calories consumed originate from wheat (www.fao.org/faostat), we still know very little about leaf senescence in wheat. Studies have shown that premature senescence affects the yield and quality of wheat [2]. A comparison of early and normally senescing near-isogenic wheat lines suggested that the enzyme activities of antioxidant systems, such as superoxide (O2−) dismutase (SOD), catalase (CAT), ascorbate peroxidase (APX), and glutathione reductase (GR) were significantly inhibited. The destruction of the oxidation-reduction system is accompanied by an increase in the superoxide (O2−) and hydrogen peroxide (H2O2) contents, which may lead to early leaf senescence [8]. A study of the wheat stay-green mutant tasg1 indicated that wheat leaf senescence was related to CK-regulated sucrose metabolism [15]. Lr34/Yr18/Pm38 encodes an ATP-binding cassette (ABC) transporter that provides durable resistance to multiple fungal pathogens and induces flag leaf tip necrosis-like leaf senescence [37]. GPC-B1 is an NAC family transcription factor that accelerates leaf senescence and affects the protein, zinc, and iron contents of wild wheat grains [27]. TaNAMs were down-regulated by RNAi technology, which led to the stay-green phenotype and the reduction in nutritive material transport from flag leaves to seeds [38]. The difficulty that is associated with wheat gene studies is caused by the complexity of the huge wheat genome, with a high ratio of repeat sequences [39]. Recently, in the wake of the development of sequencing and assembly technologies, the wheat reference genome has been greatly improved to provide a favorable condition for the study of wheat genes.
Using RNA-seq to study leaf senescence in wheat has rarely been reported. In the present study, RNA-seq analysis was performed with the leaf senescence mutant m68 and the wild-type (WT) variety YZ4110 at different time points. Differentially expressed genes (DEGs) were identified between m68 and the WT, and the Gene Ontology (GO) enrichment, and the Kyoto Encyclopedia of Genes and Genomes (KEGG) pathways of DEGs were analyzed at different time points. Analysis of transcriptome data will be helpful for understanding leaf senescence in wheat.

2. Results

2.1. Phenotypic Characterization and Genetic Analysis

At the seedling stage, there was no obvious difference between the WT and m68 mutant (Figure 1A,B). Initial senescence only occurred in the bottom leaves at the shooting stage in m68 (Figure 1C). Then, the leaves in the middle part of m68 plants showed senescence symptoms around the heading date. Approximately one week later, flag leaves started to senescence. During the filling stage, the leaf senescence process of the m68 mutant accelerated dramatically (Figure 1D). The final spikelet number, grain number, floret number per spike, 1000-grain weight, plant height, and effective tiller number of m68 were significantly different from those of the WT (Table 1). To determine the genetic basis of these phenotypes, we conducted genetic analysis. Among a total of 318 F2 plants, 73 showed the premature leaf senescence phenotype of m68, whereas the others showed the WT phenotype. The segregation ratio of the m68 phenotype to the WT phenotype was 1:3.36. Based on the chi-square (χ2) test, the F2 population segregation ratio was in accordance with the expected ratio of 1:3 (χ2 = 0.71 < χ20.05,1 = 3.84). The results indicated that premature leaf senescence of m68 is controlled by a single recessive nuclear gene.
As the development of flag leaves is crucial to agronomic traits, we observed the flag leaf phenotype of the m68 mutant in detail beginning on the heading date, i.e., 19 April 2016. We separated the phenotype into four stages. In the first stage (stage 1, S1), on 19 April 2016, the flag leaves of m68 and the WT showed almost no differences (Figure 2A). In the second stage (stage 2, S2), on 25 April, the m68 flag leaf tip exhibited senescence (Figure 2B). Then, the flag leaf of m68 underwent accelerated senescence, and senescence was obvious on 3 May 2016 (stage 3, S3) (Figure 2C). In the final stage (stage 4, S4), the flag leaf of m68 had almost completely turned yellow, while the flag leaf of the WT had not senesced (Figure 2D). Our measurements of maximum quantum efficiency of photosystem II (Fv/Fm) and the malondialdehyde (MDA) contents indicated that in m68 leaves, Fv/Fm gradually decreased (Figure 2E), but the MDA content increased significantly as the leaf senescence progressed (Figure 2F). The expression of TaPAO, which is associated with chlorophyll degradation, increased rapidly during leaf senescence in m68 (Figure 2G).

2.2. RNA-Seq Analysis and DEGs

In total, 24 sample libraries were constructed and sequenced. We obtained 40.79 to 41.51 million reads from each sample. The GC content of the raw reads ranged from 53.66 to 56.33% in different libraries, and the Q30 percentage exceeded 94.5%. These libraries contained 85.61–89.34% of mapped reads and 77.81–82.53% of unique reads mapped to the T. aestivum _CS42_TGAC_v1 (Table 2).
The differentially expressed genes (DEGs) between m68 and the WT at the four development stages were identified to investigate the genes that might be responsible for leaf senescence in the m68 mutant (Supplementary Table S1). At S1 (WT_S1 vs. M_S1), although the flag leaf of the m68 mutant had not started senescing, 2396 genes were significantly differentiated. These included 2030 up-regulated and 366 down-regulated genes in m68 (Figure 3A). When the m68 flag leaf tip exhibited senescence at S2, 8383 DEGs were identified (WT_S2 vs. M_S2), including 5241 up-regulated and 3142 down-regulated genes in m68 (Figure 3B). During S3, the leaf senescence phenotype of m68 was obvious, and more DEGs between WT_S3 and M_S3 were found, including 6903 up-regulated and 6452 down-regulated genes in m68 (Figure 3C). At S4, the m68 mutant flag leaf had turned completely yellow. The number of DEGs between WT_S4 and M_S4 increased to 16130, which included 7369 up-regulated and 8761 down-regulated genes in m68 (Figure 3D). Moreover, we also detected the specific DEGs at different stages (Figure 3E,F); the Venn diagrams showed that 94, 698, 1652, and 3911 genes were down-regulated at S1, S2, S3, and S4, respectively, while 367, 1358, 1616, and 2842 genes specific were up-regulated at S1, S2, S3, and S4, respectively. The numbers of consistently down- and up-regulated genes in all of the stages were 140 and 805, respectively.

2.3. GO Enrichment Analysis of DEGs

The enriched GO terms of down- and up-regulated DEGs at different time points were analyzed (Figure 4 and Supplementary Table S2). A total of 141 down-regulated DEGs were significantly enriched in GO terms. Among these terms, none were found at S1 (Figure 4A). However, 52 were found at S2, such as the chloroplast thylakoid membrane, photosynthesis, light harvesting, photosystem II, and chlorophyll binding. Ninety-one terms, such as ribulose-bisphosphate carboxylase activity, fructose 1,6-bisphosphate 1-phosphatase activity, ribosome, carbohydrate metabolic process, and chloroplast, were detected at S3. At S4, there existed 108 GO terms, among which, 29 were simultaneously enriched at S2 and S3 (Figure 4A). In terms of the up-regulated DEGs, there were 143 significantly enriched GO terms (Figure 4B). At S1, there were 48 including thirteen stage-specific GO terms such as lyase activity phosphate ion transport, transcription factor activity, sequence-specific DNA binding and inorganic phosphate transmembrane transporter activity. Sixty-one terms, such as integral component of membrane, response to stress, sucrose alpha-glucosidase activity, chlorophyll catabolic process, and oxidation-reduction process, were detected at S2. Sixty and 80 were found at S3 and S4, respectively. Among the 143 significantly enriched GO terms, 16 were enriched at all four development stages (Figure 4B), including terms in calcium ion binding, carbohydrate metabolic process, oxidation-reduction process, and integral component of the membrane.

2.4. KEGG Pathway Analysis of DEGs

To further investigate the leaf senescence pathway in the m68 mutant, KEGG analysis of DEGs was performed at different stages. Among the four stages, DEGs were significantly enriched in 18 KEGG pathways (Figure 5). At S1, DEGs were enriched in 5 KEGG pathways, and four of them, i.e., the plant-pathogen interaction (ko04626), glutathione metabolism (ko00480), the calcium signaling pathway (ko04020), and the cyclic adenosine 3′,5′-monophosphate (cAMP) signaling pathway (ko04024), were only enriched in this stage. DEGs at S2 and S3 shared 6 enriched KEGG pathways, including starch and sucrose metabolism (ko00500), plant hormone signal transduction (ko04075), carbon fixation in photosynthetic organisms (ko00710), amino sugar and nucleotide sugar metabolism (ko00520), glyoxylate and dicarboxylate metabolism (ko00630), and photosynthesis (ko00195). At the late stage of leaf senescence, i.e., S4, DEGs were enriched in seven KEGG pathways, involving carbon metabolism (ko01200), lysosomes (ko04142), glycolysis (ko00010), plant hormone signal transduction (ko04075), starch and sucrose metabolism (ko00500), porphyrin and chlorophyll metabolism (ko00860) and alanine, aspartate, and glutamate metabolism (ko00250).
At S2, the m68 flag leaf tips exhibited senescence, and many DEGs were significantly enriched in plant hormone signal transduction; therefore, genes that were involved in the plant hormone signal transduction pathway were selected and analyzed further. We identified 24 DEGs orthologs of the wheat genes related to ABA, IAA, ET, JA, and SA responses (Table 3). The orthologs of IAA13, IAA7 and IAA11, MSTRG.36133.1, MSTRG.30418.1, and MSTRG.37877.1 were down-regulated in the m68 mutant. ABA signaling transduction-related gene expression levels increased in m68. In addition, the expression of several PR1 family-related genes, MSTGR.29737.1, MSTGR.32097.1, and MSTGR.26416.1, was significantly increased in the m68 mutant. The orthologs of NPR3 (MSTRG.18976.1), CAM1 (MSTRG.13794.1), and CAM8 (MSTRG.27143.1), which were also up-regulated, belonged to the SA signaling pathway. We checked the expression of six SA response gene orthologs using qRT-PCR (Figure 6). The results showed that the expression of these genes was obviously increased, which is consistent with the transcriptome analysis.

2.5. Expression Pattern Clustering Analysis of DEGs

To identify genes closely that were related to senescence, we performed expression pattern cluster analysis of DEGs at different time points. All of the DEGs were used for cluster analysis. Hierarchical clustering based on DEGs (Figure 7A) and a 10% tree cutoff was performed using the R package cutree. In total, 4708 genes were classified into 393 clusters, which showed different expression patterns between the WT and m68. We further analyzed the genes of 27 subclusters, which contained 1012 genes (Figure 7B and Supplementary Table S3). The expression levels of these cluster genes were almost unchanged in the WT at all four time points, but in the m68 mutant, they were obviously up-regulated during leaf senescence. There were 75 genes encoding kinase family proteins, 23 of which were receptor-like kinase genes. Additionally, 56 genes were annotated as transcription factors or DNA binding factors, 24 of which were orthologs of WRKY transcription factors, and 26 were orthologs of zinc finger transcription factors. In addition, 42 genes encoded different types of transporters, including inorganic phosphate transporters, high-affinity potassium transporters, boron transporter proteins, potassium transporters, ABC transporters, and amino acid transporters.

3. Discussion

In this study, we identified a wheat mutant, m68, which had many effects on plant development. Agronomic traits, such as grain weight, kernel number per spike, and floret number decreased significantly in m68. Because the leaves of m68 started to senescence much earlier than those of the WT, we found some indicators that were detected in previous senescence studies. These senescence indicators include MDA, which is toxic to cells and can lead to cell death; Fv/Fm, which affects leaf photosynthesis and the accumulation of photosynthetic products; and, TaPAO, which participates in the degradation of chlorophyll [8,14]. We examined those indicators and found that the MDA content and the expression level of TaPAO were significantly up-regulated, and Fv/Fm decreased remarkably in m68 (Figure 2E–G). Therefore, m68 is a premature senescence mutant. Using genetic analysis, we further determined that the premature senescence phenotype was controlled by a single recessive nuclear gene.
We randomly selected 16 genes among the DEGs to test their expression at different stages using qRT-PCR. Our qRT-PCR analysis results showed that those genes were indeed differentially expressed, which is in accordance with our transcriptome analysis results (Supplementary Figure S1). Therefore, our genome-wide transcriptome profiling analysis is reliable. The detection of specific DEGs at different stages indicated that the numbers of both the specific down-regulated and up-regulated genes were increased from S1 to S4. Through the GO enrichment analysis of down- and up-regulated DEGs at different time points, we detected a total of 141 and 143 enriched GO terms in down- and up-regulated DEGs at different time points, respectively. We found that the down-regulated DEGs did not have significantly enriched GO term at S1, while for the up-regulated DEGs, significantly enriched GO terms appeared at S1. For up-regulated DEGs, thirteen of 143 GO terms were specifically enriched at S1, which may play important roles in induced leaf senescence or onset of leaf senescence-related signal transduction, such as transcription factor activity and sequence-specific DNA binding. AtWRKY53, AtWRKY70, and AtWRKY40 transcription factors participated in SA signaling transduction pathways [30,31,56], the expression levels of their orthologous genes were up-regulated in m68. AtWRKY67 might participate in stress resistance-induced leaf senescence [57], and the expression levels of its orthologous genes were also up-regulated in m68. Therefore, the functions of these WRKY transcription factors might be very conserved in regulated leaf senescence and may include functions as upstream regulators of senescence. The mutant gene in m68 might function upstream of the senescence regulatory network.
We also found that down-regulated DEGs were enriched in GO terms such as chlorophyll binding, chloroplast, chloroplast organization, photosystem I, and photosystem II at S2, S3, and S4, which were defined as the degenerative phase in previous studies [58]. In accordance with the results from previous studies, many chlorophyll metabolism genes were differentially expressed in m68, which might play important roles in wheat leaf senescence. For example, the expression of orthologs of chloroplast precursor-relative and TPR (tetratricopeptide repeat) genes, such as MSTRG.35978.1, MSTRG.34045.1, and MSTRG.3773.1, were reduced in m68. Chlorophyll synthesis-related genes, such as orthologs of At5G54190, At1G44446 and At3G51820 genes, were reduced in m68. GATA transcription factors can influence leaf senescence by regulating the chlorophyll content [17,18,19,20]. In our study, the GATA zinc finger family genes MSTRG.14332.1 and MSTRG.41348.1 were down-regulated during leaf senescence, which agrees with the function of GATA transcription factors. PPR proteins can influence the chloroplast content by regulating chloroplast gene expression, such as OspTAC2 in rice [59] and PPR53 can also affect chloroplast gene expression and leaf development in maize [16]. In our study, PPR-like genes MSTRG.37348.1 and MSTRG.23240.1 were down-regulated in m68. The above mentioned genes might play crucial roles in leaf senescence in wheat at the S2, S3 and S4 stages.
KEGG pathway analysis showed that plant hormone signaling severely affected the leaf senescence process. A previous study showed that ET, SA, JA, and ABA promoted leaf senescence, while CK, GA and IAA were observed to delay the progression of leaf senescence [21]. In our study, we found that the orthologs of the SA receptor gene NPR3 and its downstream genes, CaMs and PR-related genes, such as MSTRG.13794.1, MSTRG.27143.1, MSTRG.29737.1, MSTRG.32097.1, and MSTRG.26416.1, were up-regulated in the m68 mutant (Table 3). The JA response gene JAZ2 was also up-regulated (Table 3). The expression levels of ABA signal transduction pathway genes, such as ABF1, ABF4, and HAB1 significantly increased in m68 (Table 3). The IAA signaling transduction-related genes IAA7, IAA13, and IAA11 were down-regulated in the m68 mutant (Table 3). However, ET receptor gene EIN2 expression was down-regulated in the m68 mutant, which is supposed to promote leaf senescence (Table 3). These results seem to imply that leaf senescence in wheat is regulated by a variety of hormones and might have a unique regulatory mechanism.
The clusters of the expression pattern of DEGs provided us with a good opportunity to identify SAGs in wheat. We mainly paid attention to the clusters whose expression pattern had no obvious change during WT leaf development but showed a rapid increase during the leaf development of the mutant. There were 27 subclusters that contained 1012 genes showing this expression pattern (Figure 7B and Supplementary Table S3). All of the genes in this cluster were induced significantly during senescence and might be essential to wheat leaf senescence. Among these genes, many types of receptor-like protein kinases, transporter family proteins and transcription factors were enriched. The number of WRKY family and zinc finger transcription factors was much higher than that of the other transcription factors in these subclusters. It is suggested that they may play much more important roles than the other transcription factors in the regulation of leaf senescence in wheat. In addition, we noticed that flag leaf senescence occurred after the heading date, which was much later than that in the lower leaves of m68. Therefore, we deduced that oriented signal transduction and substance transport occur in plants around the heading date and are important in leaf senescence. We identified receptor genes and transporter genes that might participate in signal transduction and substance transport during leaf senescence of wheat.

4. Materials and Methods

4.1. Plant Materials and Genetic Analysis

The m68 mutant was generated from an EMS mutant library of the common wheat cultivar Yanzhan 4110 (YZ4110), which was constructed and conserved in our laboratory. We planted m68 and the YZ4110 in 2013–2016 in Beijing, and investigated agronomic traits, such as plant height and spike length each year.
We obtained inheritance-stable homozygote m68 mutant seeds and crossed them with the YZ4110 to generate a heterozygote F1 population. F1 seeds were produced from self-crossed F1 plants and were sown on 7 October 2015, in Beijing. In each row, 15 seeds were evenly planted along a length of 2 m. We observed the flag leaves of 318 F2 plants on 3 May 2016. The number of plants exhibiting premature senescence was counted. A chi-square (χ2) test was used to analyze the segregation ratios.

4.2. Plant Materials Used in RNA-Seq

The WT and m68 mutant were sown on 7 October 2015, i.e., 30 rows each, in Beijing (China), and were grown under field conditions. In each row, 15 seeds were evenly planted along a length of 2 m. The flag leaves of the WT and m68 mutant were collected from the heading stage (19 April 2016) and were continuously sampled every 6 days until 9 May 2016. In each of the four stages, leaves from 10 plants were pooled to produce three biological replicates. All of the samples were immediately frozen in liquid nitrogen and were stored at −80 °C in a refrigerator.

4.3. Fv/Fm and MDA Content Measurement

The Fv/Fm and the MDA content of flag leaves of the WT and m68 were measured at different sampling times. Fv/Fm was measured using a handheld fluorometer (FluorPen FP100, Photon Systems Instruments, Drasov, Czech Republic), according to the manufacturer’s instructions. At each time point, 20 plants were measured; an average of three measurements were collected per plant. The MDA content was measured by utilizing a 5% thiobarbituric acid reaction, according to previous study methods [60].

4.4. RNA Extraction and Library Construction

Total RNA was isolated using Trizol reagent (Promega, Madison, WI, USA) following the manufacturer’s instructions. RNA purity was tested using a NanoDrop 2000 (Thermo, Waltham, MA, USA), RNA concentration was measured using an Agilent 2100 Bioanalyzer, and RNA integrity was evaluated with an Agilent RNA6000 NanoKit according to the manufacturer’s protocol.
Each sample required approximately 4 to 8 μg of total RNA to construct the RNA-Seq libraries. The method consisted mainly of the following steps: (1) mRNA was first purified from total RNA using polyA magnetic bead enrichment. (2) Chemical fragmentation was conducted. (3) Random hexamer priming was used to convert mRNA into first single-strand cDNA and to synthesize second-strand cDNA. (4) Sequencing adaptors were added to cDNA fragments. Suitable fragments were selected based on the separation by agarose gel electrophoresis. (5) PCR amplification construction of RNA libraries was completed. In total, 24 RNA libraries were constructed, and the quality and quantity of each RNA library were assessed using Nanodrop ND-1000 spectroscopy and an Agilent 2100 Bioanalyzer according to the protocol guide.

4.5. Illumina Sequencing and Read Mapping

RNA-Seq was performed using an Illumina HiSeq 4000 sequencing platform by OnMath Technologies, Chengdu, Sichuan, China. The raw reads were cleaned by removing adapter and low-quality sequences. Mapping of 24 sample reads to wheat genome (T. aestivum. TGACv1) was conducted with Tophat (version 2.1.0, default parameters). The new transcripts were assembled with StringTie (version 1.3.3b, default parameters). New gtf assembling and merging for each sample were used known TGAC gtf (version: TGACv1).
All of the sequencing data in this study are stored at the Sequence Read Archive under BioProject ID PRJA431543.

4.6. Transcriptome Analysis

The Kallisto tool, version v0.43.0 (https://pachterlab.github.io/kallisto), was used to calculate gene expression levels [61]. We use the edgerR tool, version v3.12.1, (http://bioinf.wehi.edu.au/edgeR) to analyze DEGs [62]. DEGs were defined as genes with a false discovery rate (FDR) <0.001 and |Log2(fold-change)| > 2.0.
GO enrichment analysis of DEGs was performed using the Goseq R package. All of the significantly DEGs between compare groups (both known genes and new assembled genes) were blasted in Pfam database (version 31.0, March 2017) and extracted all gene’s GO id for enrichment. GOseq was applied for enrichment and topGO was used for plot directed acyclic graph base on significantly enrichment gene (p value < 0.05 and q value < 0.05) [63]. We used KOBAS software 2.0 to determine significant enrichment of DEGs in KEGG pathways (p-value < 0.05 and corrected p-value < 0.05) [64]. Hierarchical clustering based on DEGs and a 10% tree cutoff was performed using the R package cutree.

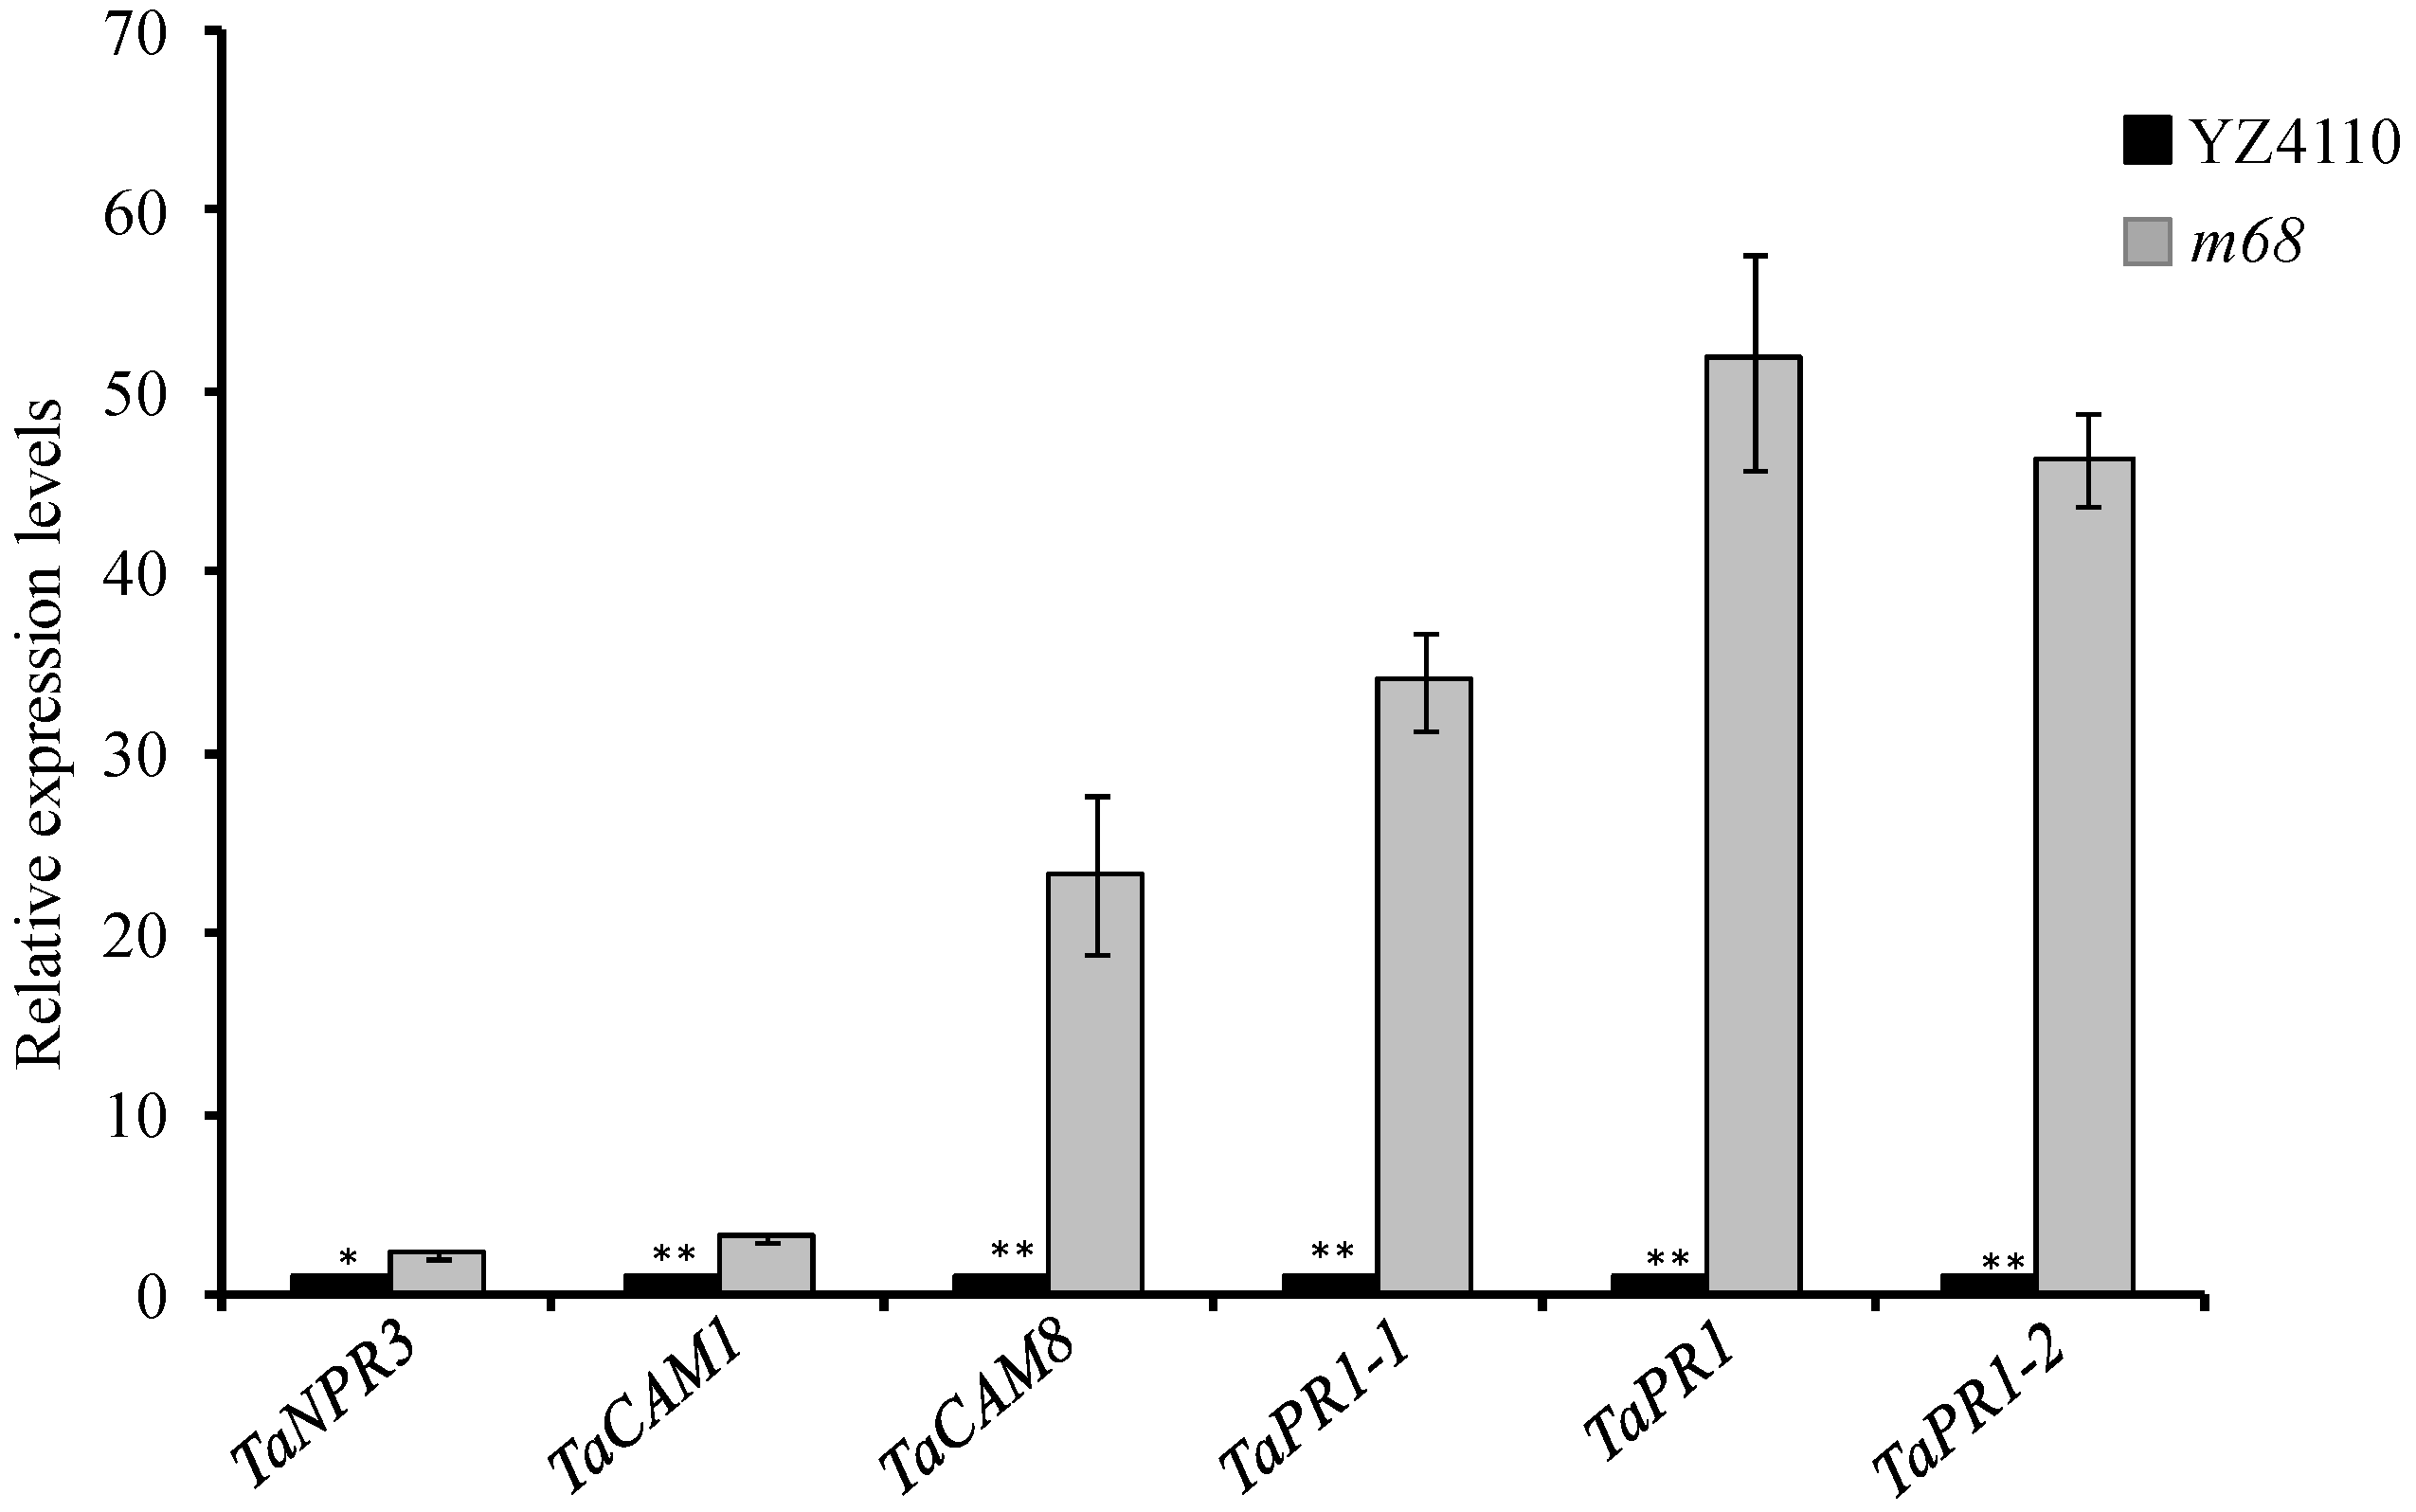
4.7. Quantitative Real-Time PCR

To validate the RNA-seq data, we randomly selected 16 genes in DEGs to test their expression at different stages using qRT-PCR, which were the same RNA samples used for RNA-seq. According to the sequences, primer version 5.0 was used to design gene-specific primers. The primer sequences are listed in Supplementary Table S4. qRT-PCR was performed using a Roche LightCycler 480 Real-Time System (Roche, Switzerland). The wheat gene GAPDH (NCBI accession: AF251217.1) was used as an internal control for normalization of expression. Each experiment was performed with three biological replicates. qRT-PCR was performed using a 15-µL reaction volume that consisted of 7.5 µL of SYBR Mix (Toyobo, Japan), 1 µL of cDNA, 2 µL of gene-specific primers (2 µmol·L−1), and 4.5 µL of ddH2O. The PCR program parameters were 95 °C for 1 min, followed by 40 cycles at 95 °C for 20 s, 60 °C for 20 s, and 72 °C for 40 s. The relative gene expression levels were evaluated according to a previous study [65].

Supplementary Materials

Supplementary materials can be found at https://www.mdpi.com/1422-0067/19/3/782/s1.

Acknowledgments

This study was supported by the National Basic Research Program of China [2014CB138103], National Transgenic Research Project [2014ZX0800918B] and the CAAS-Innovation Team Project.

Author Contributions

Qiang Zhang, Xiuying Kong and Xu Liu designed the experiments. Qiang Zhang, Chuan Xia, Lichao Zhang and Chunhao Dong carried out the experiments. Qiang Zhang, Chuan Xia, Lichao Zhang, Xiuying Kong and Xu Liu wrote this paper. All authors read and approved the final manuscript.

Conflicts of Interest

The authors declare no conflict of interest.

References

  1. Schippers, J.H.; Schmidt, R.; Wagstaff, C.; Jing, H.C. Living to die and dying to live: The survival strategy behind leaf senescence. Plant Physiol. 2015, 169, 914–930. [Google Scholar] [CrossRef] [PubMed]
  2. Gregersen, P.L.; Culetic, A.; Boschian, L.; Krupinska, K. Plant senescence and crop productivity. Plant Mol. Biol. 2013, 82, 603–622. [Google Scholar] [CrossRef] [PubMed]
  3. Distelfeld, A.; Avni, R.; Fischer, A.M. Senescence, nutrient remobilization, and yield in wheat and barley. J. Exp. Bot. 2014, 65, 3783–3798. [Google Scholar] [CrossRef] [PubMed]
  4. Lim, P.O.; Woo, H.R.; Nam, H.G. Molecular genetics of leaf senescence in Arabidopsis. Trends Plant Sci. 2003, 8, 272–278. [Google Scholar] [CrossRef]
  5. Lira, B.S.; Gramegna, G.; Trench, B.A.; Alves, F.R.R.; Silva, E.M.; Silva, G.F.F.; Thirumalaikumar, V.P.; Lupi, A.C.D.; Demarco, D.; Purgatto, E.; et al. Manipulation of a senescence-associated gene improves fleshy fruit yield. Plant Physiol. 2017, 175, 77–91. [Google Scholar] [CrossRef] [PubMed]
  6. Zhang, H.; Zhou, C. Signal transduction in leaf senescence. Plant Mol. Biol. 2013, 82, 539–545. [Google Scholar] [CrossRef] [PubMed]
  7. Juvany, M.; Muller, M.; Munne-Bosch, S. Photo-oxidative stress in emerging and senescing leaves: A mirror image? J. Exp. Bot. 2013, 64, 3087–3098. [Google Scholar] [CrossRef] [PubMed]
  8. Li, H.; Wang, G.; Liu, S.; An, Q.; Zheng, Q.; Li, B.; Li, Z. Comparative changes in the antioxidant system in the flag leaf of early and normally senescing near-isogenic lines of wheat (Triticum aestivum L.). Plant Cell Rep. 2014, 33, 1109–1120. [Google Scholar] [CrossRef] [PubMed]
  9. Li, X.P.; Gan, R.; Li, P.L.; Ma, Y.Y.; Zhang, L.W.; Zhang, R.; Wang, Y.; Wang, N.N. Identification and functional characterization of a leucine-rich repeat receptor-like kinase gene that is involved in regulation of soybean leaf senescence. Plant Mol. Biol. 2006, 61, 829–844. [Google Scholar] [CrossRef] [PubMed]
  10. Pattanayak, G.K.; Tripathy, B.C. Modulation of biosynthesis of photosynthetic pigments and light-harvesting complex in wild-type and gun5 mutant of Arabidopsis thaliana during impaired chloroplast development. Protoplasma 2016, 253, 747–752. [Google Scholar] [CrossRef] [PubMed]
  11. Pudelski, B.; Soll, J.; Philippar, K. A search for factors influencing etioplast-chloroplast transition. Proc. Natl. Acad. Sci. USA 2009, 106, 12201–12206. [Google Scholar] [CrossRef] [PubMed]
  12. Sakuraba, Y.; Balazadeh, S.; Tanaka, R.; Mueller-Roeber, B.; Tanaka, A. Overproduction of chl b retards senescence through transcriptional reprogramming in Arabidopsis. Plant Cell Physiol. 2012, 53, 505–517. [Google Scholar] [CrossRef] [PubMed]
  13. Lin, Y.P.; Lee, T.Y.; Tanaka, A.; Charng, Y.Y. Analysis of an Arabidopsis heat-sensitive mutant reveals that chlorophyll synthase is involved in reutilization of chlorophyllide during chlorophyll turnover. Plant J. 2014, 80, 14–26. [Google Scholar] [CrossRef] [PubMed]
  14. Xie, Q.; Liang, Y.; Zhang, J.; Zheng, H.; Dong, G.; Qian, Q.; Zuo, J. Involvement of a putative bipartite transit peptide in targeting rice pheophorbide a oxygenase into chloroplasts for chlorophyll degradation during leaf senescence. J. Genet. Genom. 2016, 43, 145–154. [Google Scholar] [CrossRef] [PubMed]
  15. Wang, D.; Liu, H.; Zhai, G.; Wang, L.; Shao, J.; Tao, Y. OspTAC2 encodes a pentatricopeptide repeat protein and regulates rice chloroplast development. J. Genet. Genom. 2016, 43, 601–608. [Google Scholar] [CrossRef] [PubMed]
  16. Zoschke, R.; Watkins, K.P.; Miranda, R.G.; Barkan, A. The PPR-SMR protein PPR53 enhances the stability and translation of specific chloroplast RNAs in maize. Plant J. 2016, 85, 594–606. [Google Scholar] [CrossRef] [PubMed]
  17. Hudson, D.; Guevara, D.; Yaish, M.W.; Hannam, C.; Long, N.; Clarke, J.D.; Bi, Y.M.; Rothstein, S.J. GNC and CGA1 modulate chlorophyll biosynthesis and glutamate synthase (GLU1/Fd-GOGAT) expression in Arabidopsis. PLoS ONE 2011, 6, e26765. [Google Scholar] [CrossRef] [PubMed]
  18. Zhang, C.; Hou, Y.; Hao, Q.; Chen, H.; Chen, L.; Yuan, S.; Shan, Z.; Zhang, X.; Yang, Z.; Qiu, D.; et al. Genome-wide survey of the soybean GATA transcription factor gene family and expression analysis under low nitrogen stress. PLoS ONE 2015, 10, e0125174. [Google Scholar] [CrossRef] [PubMed]
  19. Lu, G.; Casaretto, J.A.; Ying, S.; Mahmood, K.; Liu, F.; Bi, Y.M.; Rothstein, S.J. Overexpression of OsGATA12 regulates chlorophyll content, delays plant senescence and improves rice yield under high density planting. Plant Mol. Biol. 2017, 94, 215–227. [Google Scholar] [CrossRef] [PubMed]
  20. Chiang, Y.H.; Zubo, Y.O.; Tapken, W.; Kim, H.J.; Lavanway, A.M.; Howard, L.; Pilon, M.; Kieber, J.J.; Schaller, G.E. Functional characterization of the GATA transcription factors GNC and CGA1 reveals their key role in chloroplast development, growth, and division in Arabidopsis. Plant Physiol. 2012, 160, 332–348. [Google Scholar] [CrossRef] [PubMed]
  21. Khan, M.; Rozhon, W.; Poppenberger, B. The role of hormones in the aging of plants—A mini-review. Gerontology 2014, 60, 49–55. [Google Scholar] [CrossRef] [PubMed]
  22. Reinbothe, C.; Springer, A.; Samol, I.; Reinbothe, S. Plant oxylipins: Role of jasmonic acid during programmed cell death, defence and leaf senescence. FEBS J. 2009, 276, 4666–4681. [Google Scholar] [CrossRef] [PubMed]
  23. Oh, S.A.; Park, J.H.; Lee, G.I.; Paek, K.H.; Park, S.K.; Nam, H.G. Identification of three genetic loci controlling leaf senescence in Arabidopsis thaliana. Plant J. 1997, 12, 527–535. [Google Scholar] [CrossRef] [PubMed]
  24. Lim, P.O.; Kim, H.J.; Nam, H.G. Leaf senescence. Annu. Rev. Plant Biol. 2007, 58, 115–136. [Google Scholar] [CrossRef] [PubMed]
  25. Yang, J.; Worley, E.; Udvardi, M. A NAP-AAO3 regulatory module promotes chlorophyll degradation via ABA biosynthesis in Arabidopsis leaves. Plant Cell 2014, 26, 4862–4874. [Google Scholar] [CrossRef] [PubMed]
  26. Liang, C.; Wang, Y.; Zhu, Y.; Tang, J.; Hu, B.; Liu, L.; Ou, S.; Wu, H.; Sun, X.; Chu, J.; et al. OsNAP connects abscisic acid and leaf senescence by fine-tuning abscisic acid biosynthesis and directly targeting senescence-associated genes in rice. Proc. Natl. Acad. Sci. USA 2014, 111, 10013–10018. [Google Scholar] [CrossRef] [PubMed]
  27. Uauy, C.; Distelfeld, A.; Fahima, T.; Blechl, A.; Dubcovsky, J. A NAC Gene regulating senescence improves grain protein, zinc, and iron content in wheat. Science 2006, 314, 1298–1301. [Google Scholar] [CrossRef] [PubMed]
  28. Lee, I.C.; Hong, S.W.; Whang, S.S.; Lim, P.O.; Nam, H.G.; Koo, J.C. Age-dependent action of an ABA-inducible receptor kinase, RPK1, as a positive regulator of senescence in Arabidopsis leaves. Plant Cell Physiol. 2011, 52, 651–662. [Google Scholar] [CrossRef] [PubMed]
  29. Lee, H.N.; Lee, K.H.; Kim, C.S. Abscisic acid receptor pyrabactin resistance-like 8, PYL8, is involved in glucose response and dark-induced leaf senescence in Arabidopsis. Biochem. Biophys. Res. Commun. 2015, 463, 24–28. [Google Scholar] [CrossRef] [PubMed]
  30. Besseau, S.; Li, J.; Palva, E.T. WRKY54 and WRKY70 co-operate as negative regulators of leaf senescence in Arabidopsis thaliana. J. Exp. Bot. 2012, 63, 2667–2679. [Google Scholar] [CrossRef] [PubMed]
  31. Park, H.C.; Park, C.Y.; Koo, S.C.; Cheong, M.S.; Kim, K.E.; Kim, M.C.; Lim, C.O.; Lee, S.Y.; Yun, D.J.; Chung, W.S. AtCML8, a calmodulin-like protein, differentially activating CaM-dependent enzymes in Arabidopsis thaliana. Plant Cell Rep. 2010, 29, 1297–1304. [Google Scholar] [CrossRef] [PubMed]
  32. Kim, H.J.; Ryu, H.; Hong, S.H.; Woo, H.R.; Lim, P.O.; Lee, I.C.; Sheen, J.; Nam, H.G.; Hwang, I. Cytokinin-mediated control of leaf longevity by AHK3 through phosphorylation of ARR2 in Arabidopsis. Proc. Natl. Acad. Sci. USA 2006, 103, 814–819. [Google Scholar] [CrossRef] [PubMed]
  33. Hou, K.; Wu, W.; Gan, S.S. SAUR36, a small auxin up RNA gene, is involved in the promotion of leaf senescence in Arabidopsis. Plant Physiol. 2013, 161, 1002–1009. [Google Scholar] [CrossRef] [PubMed]
  34. Kant, S.; Bi, Y.M.; Zhu, T.; Rothstein, S.J. SAUR39, a small auxin-up RNA gene, acts as a negative regulator of auxin synthesis and transport in rice. Plant Physiol. 2009, 151, 691–701. [Google Scholar] [CrossRef] [PubMed]
  35. Zhao, Y.; Chan, Z.; Gao, J.; Xing, L.; Cao, M.; Yu, C.; Hu, Y.; You, J.; Shi, H.; Zhu, Y.; et al. ABA receptor PYL9 promotes drought resistance and leaf senescence. Proc. Natl. Acad. Sci. USA 2016, 113, 1949–1954. [Google Scholar] [CrossRef] [PubMed]
  36. Sun, L.; Wang, Y.; Liu, L.L.; Wang, C.; Gan, T.; Zhang, Z.; Wang, Y.; Wang, D.; Niu, M.; Long, W.; et al. Isolation and characterization of a spotted leaf 32 mutant with early leaf senescence and enhanced defense response in rice. Sci. Rep. 2017, 7, 41846. [Google Scholar] [CrossRef] [PubMed]
  37. Krattinger, S.G.; Lagudah, E.S.; Spielmeyer, W.; Singh, R.P.; Huerta-Espino, J.; McFadden, H.; Bossolini, E.; Selter, L.L.; Keller, B. A putative ABC transporter confers durable resistance to multiple fungal pathogens in wheat. Science 2009, 323, 1360–1363. [Google Scholar] [CrossRef] [PubMed] [Green Version]
  38. Checovich, M.L.; Galatro, A.; Moriconi, J.I.; Simontacchi, M.; Dubcovsky, J.; Santa-Maria, G.E. The stay-green phenotype of TaNAM-RNAi wheat plants is associated with maintenance of chloroplast structure and high enzymatic antioxidant activity. Plant Physiol. Biochem. 2016, 104, 257–265. [Google Scholar] [CrossRef] [PubMed]
  39. Wang, M.; Wang, S.; Xia, G. From genome to gene: A new epoch for wheat research? Trends Plant Sci. 2015, 20, 380–387. [Google Scholar] [CrossRef] [PubMed]
  40. Sarkar, A.K.; Lahiri, A. Specificity determinants for the abscisic acid response element. FEBS Open Bio 2013, 3, 101–105. [Google Scholar] [CrossRef] [PubMed]
  41. Umezawa, T.; Sugiyama, N.; Mizoguchi, M.; Hayashi, S.; Myouga, F.; Yamaguchi-Shinozaki, K.; Ishihama, Y.; Hirayama, T.; Shinozaki, K. Type 2C protein phosphatases directly regulate abscisic acid-activated protein kinases in Arabidopsis. Proc. Natl. Acad. Sci. USA 2009, 106, 17588–17593. [Google Scholar] [CrossRef] [PubMed]
  42. Chen, L.; Xiang, S.; Chen, Y.; Li, D.; Yu, D. Arabidopsis WRKY45 interacts with the DELLA protein RGL1 to positively regulate age-triggered leaf senescence. Mol. Plant 2017, 10, 1174–1189. [Google Scholar] [CrossRef] [PubMed]
  43. Bao, Y.; Song, W.M.; Pan, J.; Jiang, C.M.; Srivastava, R.; Li, B.; Zhu, L.Y.; Su, H.Y.; Gao, X.S.; Liu, H.; et al. Overexpression of the NDR1/HIN1-like gene NHL6 modifies seed germination in response to abscisic acid and abiotic atresses in Arabidopsis. PLoS ONE 2016, 11, e0148572. [Google Scholar] [CrossRef] [PubMed]
  44. Huang, D.; Jaradat, M.R.; Wu, W.; Ambrose, S.J.; Ross, A.R.; Abrams, S.R.; Cutler, A.J. Structural analogs of ABA reveal novel features of ABA perception and signaling in Arabidopsis. Plant J. 2007, 50, 414–428. [Google Scholar] [CrossRef] [PubMed]
  45. Dreher, K.A.; Brown, J.; Saw, R.E.; Callis, J. The Arabidopsis Aux/IAA protein family has diversified in degradation and auxin responsiveness. Plant Cell 2006, 18, 699–714. [Google Scholar] [CrossRef] [PubMed]
  46. Hu, Y.; Yang, L.; Na, X.; You, J.; Hu, W.; Liang, X.; Liu, J.; Mao, L.; Wang, X.; Wang, H.; et al. Narciclasine inhibits the responses of Arabidopsis roots to auxin. Planta 2012, 236, 597–612. [Google Scholar] [CrossRef] [PubMed]
  47. Ohto, M.A.; Hayashi, S.; Sawa, S.; Hashimoto-Ohta, A.; Nakamura, K. Involvement of HLS1 in sugar and auxin signaling in Arabidopsis leaves. Plant Cell Physiol. 2006, 47, 1603–1611. [Google Scholar] [CrossRef] [PubMed]
  48. McGarry, R.C.; Ayre, B.G. A DNA element between At4g28630 and At4g28640 confers companion-cell specific expression following the sink-to-source transition in mature minor vein phloem. Planta 2008, 228, 839–849. [Google Scholar] [CrossRef] [PubMed]
  49. Hutchison, C.E.; Li, J.; Argueso, C.; Gonzalez, M.; Lee, E.; Lewis, M.W.; Maxwell, B.B.; Perdue, T.D.; Schaller, G.E.; Alonso, J.M.; et al. The Arabidopsis histidine phosphotransfer proteins are redundant positive regulators of cytokinin signaling. Plant Cell 2006, 18, 3073–3087. [Google Scholar] [CrossRef] [PubMed]
  50. Cortleven, A.; Marg, I.; Yamburenko, M.V. Cytokinin regulates the etioplast-chloroplast transition through the two-component signaling system and activation of chloroplast-related genes. Plant Physiol. 2016, 172, 464–478. [Google Scholar] [CrossRef] [PubMed]
  51. Yan, H.; Yoo, M.J.; Koh, J.; Liu, L.; Chen, Y.; Acikgoz, D.; Wang, Q.; Chen, S. Molecular reprogramming of Arabidopsis in response to perturbation of jasmonate signaling. J. Proteome Res. 2014, 13, 5751–5766. [Google Scholar] [CrossRef] [PubMed]
  52. Danon, A.; Miersch, O.; Felix, G.; Camp, R.G.; Apel, K. Concurrent activation of cell death-regulating signaling pathways by singlet oxygen in Arabidopsis thaliana. Plant J. 2005, 41, 68–80. [Google Scholar] [CrossRef] [PubMed]
  53. Fu, Z.Q.; Yan, S.; Saleh, A.; Wang, W.; Ruble, J.; Oka, N.; Mohan, R.; Spoel, S.H.; Tada, Y.; Zheng, N.; et al. NPR3 and NPR4 are receptors for the immune signal salicylic acid in plants. Nature 2012, 486, 228–232. [Google Scholar] [CrossRef] [PubMed] [Green Version]
  54. Choi, H.W.; Lee, D.H.; Hwang, B.K. The pepper calmodulin gene CaCaM1 is involved in reactive oxygen species and nitric oxide generation required for cell death and the defense response. Mol. Plant Microbe Interact. 2009, 22, 1389–1400. [Google Scholar] [CrossRef] [PubMed]
  55. Zhu, X.; Robe, E.; Jomat, L.; Aldon, D.; Mazars, C.; Galaud, J.P. CML8, an Arabidopsis calmodulin-like protein, plays a role in pseudomonas syringae plant immunity. Plant Cell Physiol. 2017, 58, 307–319. [Google Scholar] [CrossRef] [PubMed]
  56. Schon, M.; Toller, A.; Diezel, C.; Roth, C.; Westphal, L.; Wiermer, M.; Somssich, I.E. Analyses of wrky18 wrky40 plants reveal critical roles of SA/EDS1 signaling and indole-glucosinolate biosynthesis for Golovinomyces orontii resistance and a loss-of resistance towards Pseudomonas syringae pv. tomato AvrRPS4. Mol. Plant Microbe Interact. 2013, 26, 758–767. [Google Scholar] [CrossRef] [PubMed]
  57. Truman, W.; de Zabala, M.T.; Grant, M. Type III effectors orchestrate a complex interplay between transcriptional networks to modify basal defence responses during pathogenesis and resistance. Plant J. 2006, 46, 14–33. [Google Scholar] [CrossRef] [PubMed]
  58. Yoshida, S. Molecular regulation of leaf senescence. Curr. Opin. Plant Biol. 2003, 6, 79–84. [Google Scholar] [CrossRef] [PubMed]
  59. Wang, W.; Hao, Q.; Tian, F.; Li, Q.; Wang, W. The stay-green phenotype of wheat mutant tasg1 is associated with altered cytokinin metabolism. Plant Cell Rep. 2016, 35, 585–599. [Google Scholar] [CrossRef] [PubMed]
  60. Saher, S.; Piqueras, A.; Hellin, E.; Olmos, E. Hyperhydricity in micropropagated carnation shoots: The role of oxidative stress. Physiol. Plant 2004, 120, 152–161. [Google Scholar] [CrossRef] [PubMed]
  61. Bray, N.L.; Pimentel, H.; Melsted, P. Near-optimal probabilistic RNA-seq quantification. Nat. Biotechnol. 2016, 34, 525–527. [Google Scholar] [CrossRef] [PubMed]
  62. Robinson, M.D.; McCarthy, D.J.; Smyth, G.K. edgeR: A Bioconductor package for differential expression analysis of digital gene expression data. Bioinformatics 2010, 26, 139–140. [Google Scholar] [CrossRef] [PubMed]
  63. Young, M.D.; Wakefield, M.J.; Smyth, G.K.; Oshlack, A. Gene ontology analysis for RNA-seq: Accounting for selection bias. Genome Biol. 2010, 11, R14. [Google Scholar] [CrossRef] [PubMed]
  64. Xie, C.; Mao, X.; Huang, J.; Ding, Y.; Wu, J.; Dong, S.; Kong, L.; Gao, G.; Li, C.Y.; Wei, L. KOBAS 2.0: A web server for annotation and identification of enriched pathways and diseases. Nucleic Acids Res. 2011, 39, W316–W322. [Google Scholar] [CrossRef] [PubMed]
  65. Livak, K.J.; Schmittgen, T.D. Analysis of relative gene expression data using real-time quantitative PCR and the 2(-delta delta C(T)) method. Methods 2001, 25, 402–408. [Google Scholar] [CrossRef] [PubMed]
Figure 1. Phenotypic differences between the WT and m68. (A) The wild type (WT) phenotype at the seeding stage (B) The m68 mutant phenotype at the seeding stage. (C) Leaf phenotypes of the WT (left) and m68 mutant (right) at the shooting stage. (D) Filling stage phenotype of the m68 mutant (left) and WT (right). Scale bars = 5 cm.
Ijms 19 00782 g001
Figure 2. Phenotypic, physiological index measurements and TaPAO relative gene expression analysis of sample leaves of m68 and the WT. (AD) Leaves of the WT (left) and m68 (right) were collected in S1 (A), S2 (B), S3 (C) and S4 (D). S1, S2, S3 and S4 represent stage 1 (19 April), stage 2 (25 April), stage 3 (3 May) and stage 4 (9 May), respectively; (E) Measurements of Fv/Fm conducted on the WT and m68 at different stages; (F) Measurements of the malondialdehyde (MDA) content of the WT and m68 at different stages; (G) Relative expression of the TaPAO gene in the WT and m68 at different stages. GAPDH was selected as the internal standard. Error bars represent the means ± SD (n = 3). ** indicates p < 0.01; * indicates p < 0.05.
Ijms 19 00782 g002
Figure 3. Volcano plots and Venn diagrams of DEGs. (AD) DEGs between the WT and m68 at different stages shown by volcano plots. The X-axis represents the fold change difference in the expression of genes in different comparison groups, and the Y-axis indicates the adjusted p-values for the differences in expression. The green dots represent up-regulated genes in m68, and the red dots represent down-regulated genes in m68. Blue dots indicate genes without significant changes in expression; (E) Venn diagrams indicate the overlap in down-regulated genes between m68 and WT at different leaf senescence stages; (F) Venn diagrams indicate the overlap in up-regulated genes between m68 and WT at different leaf senescence stages. The numbers in each circle represents the down-regulated or up-regulated genes at different leaf senescence stage.
Ijms 19 00782 g003
Figure 4. Gene Ontology (GO) enrichment analyses of down- and up-regulated DEGs between the WT and m68 at different stages. Twenty-nine and sixteen GO terms are shown in down- and up-regulated DEGs, respectively. (A) GO enrichment analyses of down-regulated DEGs; (B) GO enrichment analyses of up-regulated DEGs; The Y-axis indicates the number of genes belonging to the GO terms below. The X-axis indicates GO terms. The DEGs at S1, S2, S3, and S4 are shown in red, blue, purple and yellow, respectively.
Ijms 19 00782 g004
Figure 5. Kyoto Encyclopedia of Genes and Genomes (KEGG) analysis of DEGs between WT and m68 in different leaf senescence stages. The X-axis indicates the number of genes belonging to the KEGG pathway on the left side. The DEGs in S1, S2, S3, and S4 are shown in red, blue, purple, and yellow, respectively.
Ijms 19 00782 g005
Figure 6. Salicylic acid (SA) signaling pathway-related gene expression levels analyzed using qRT-PCR. Each gene consisted of three biological replicates. Error bars represent the means ± SD (n = 3). TaNPR3, TaCAM1, TaCAM8, TaPR1-1, TaPR and TaPR1-2 represent MSTRG.18976.1, MSTRG.13794.1, MSTRG.27143.1, MSTRG.29737.1, MSTRG.32097.1, and MSTRG.26416.1, respectively. GAPDH was selected as the internal standard. * indicates p < 0.05, ** indicates p < 0.01.
Ijms 19 00782 g006
Figure 7. Clustering of DEGs between WT and m68 at different leaf senescence stages. (A) Hierarchical clustering of all DEGs; (B) The two subclusters represent 27 subclusters which had increased expression pattern in m68 and unchanged expression pattern in WT during leaf development. Gray lines show the relative expression levels of DEGs in the subcluster in WT and m68 at different leaf senescence stages. Black lines and Blue lines show the average values for relative expression in each subcluster. X-axis indicates m68 and WT at different leaf senescence stages. Y-axis indicates the relative expression level.
Ijms 19 00782 g007
Table 1. Comparison of agronomically important traits between YZ4110 and m68.
AccessionYearsLocationNo. #Plant HeightSpike LengthEffective Tiller NumberSpikelet NumberGrain Number per SpikeFloret Number1000-Grain Weight (g)
YZ41102014Beijing3068.9 ± 1.19.9 ± 0.113.2 ± 0.224.9 ± 0.160.6 ± 4.579.5 ± 11.549.4 ± 0.8
m683061.4 ± 0.5 **8.8 ± 0.97.3 ± 1.3 **17.3 ± 0.8 **27.8 ± 3.9 **50.8 ± 6.8 **15.3 ± 0.5 **
YZ41102015Beijing3066.8 ± 0.49.1 ± 0.815.3 ± 4.922.8 ± 0.748.7 ± 4.169.2 ± 7.850.9 ± 0.9
m683057.4 ± 0.7 **8.9 ± 0.18.1 ± 0.7 **20.2 ± 0.1 *33.9 ± 0.1 **59.7 ± 8.4 *15.7 ± 0.5 **
YZ41102016Beijing3070.5 ± 1.78.9 ± 0.416.7 ± 2.423.1 ± 0.449.8 ± 2.972.8 ± 3.848.0 ± 0.9
m683057.8 ± 1.5 **9.0 ± 0.46.2 ± 0.5 **19.9 ± 0.5 *37.3 ± 3.1 **63.6 ± 8.5 *15.7 ± 0.8 **
No. # indicates the number of plants analyzed; * and ** indicate p < 0.05 and p < 0.01, respectively, according to Student’s t-test.
Table 2. Descriptive statistics of the sequencing data of the eight samples.
Sample IDNo. of Total Reads (Mb)Read Length (bp)Data Size (G)Q30 (%)GC (%)Mappable Reads (%)Unique Mapped Reads (%)Multiple Mapped Reads (%)
WT_S141.31506.1995.7155.6688.9281.337.59
WT_S240.81506.1294.9356.3389.6978.568.40
WT_S340.91506.1395.3155.0089.3479.579.77
WT_S441.51506.2395.4855.0087.8879.598.29
M_S141.41506.2194.6556.0085.7277.817.91
M_S240.61506.1394.8455.3385.6179.645.97
M_S341.51506.2295.8554.3387.8981.696.20
M_S441.31506.1995.6953.6688.7582.536.22
Table 3. Plant hormone-related DEGs.
Wheat Gene IDGene NameE-ValueLogFCParticipate in Signal Transduction PathwayReference
MSTRG.35870.1ABF14.00 × 10−35−2.08ABA signaling[40]
MSTRG.10319.1OST11.00 × 10−142−2.19ABA signaling[35]
MSTRG.11222.1SNF1-like1.00 × 10−142−2.11ABA signaling[41]
MSTRG.14188.1HAB16.00 × 10−63−3.61ABA signaling[42]
MSTRG.33951.1ABF41.00 × 10−35−2.66ABA signaling[43]
MSTRG.18662.1HAI38.00 × 10−63−4.07ABA signaling[44]
MSTRG.36133.1IAA133.00 × 10−392.31AUX signaling[45]
MSTRG.30418.1IAA74.00 × 10−472.89AUX signaling[46]
MSTRG.11304.1SAAUR30−2.53AUX signaling[47]
MSTRG.37877.1IAA113.00 × 10−152.12AUX signaling[48]
MSTRG.10089.1SAUR382.00 × 10−22−5.79AUX signaling
MSTRG.7713.1SAUR384.00 × 10−20−9.86AUX signaling
MSTRG.41779.1SAUR714.00 × 10−13−3.23AUX signaling
MSTRG.3553.1AHP41.00 × 10−453.37CK signaling[49]
MSTRG.40221.1ARR122.00 × 10−932.68CK signaling[50]
MSTRG.21216.1EIN21.00 × 10−1802.07Ethylene signal[18]
MSTRG.31221.1JAZ24.00 × 10−12−3.69JA signaling[51]
MSTRG.38578.1PR1-like1.00 × 10−39−3.94JA signaling[52]
MSTRG.18976.1NPR31.00 × 10−106−1.23SA signaling[53]
MSTRG.13794.1CAM12.00 × 10−81−2.20SA signaling[54]
MSTRG.27143.1CAM82.00 × 10−54−4.39SA signaling[55]
MSTRG.29737.1PR1-like7.00 × 10−39−8.88SA signaling
MSTRG.32097.1PR1-like7.00 × 10−37−7.75SA signaling
MSTRG.26416.1PR1-like4.00 × 10−39−5.92SA signaling

