Presyncodon, a Web Server for Gene Design with the Evolutionary Information of the Expression Hosts


Abstract
1. Introduction
2. Materials and Methods
2.1. Dataset
2.2. Workflow
3. Validation
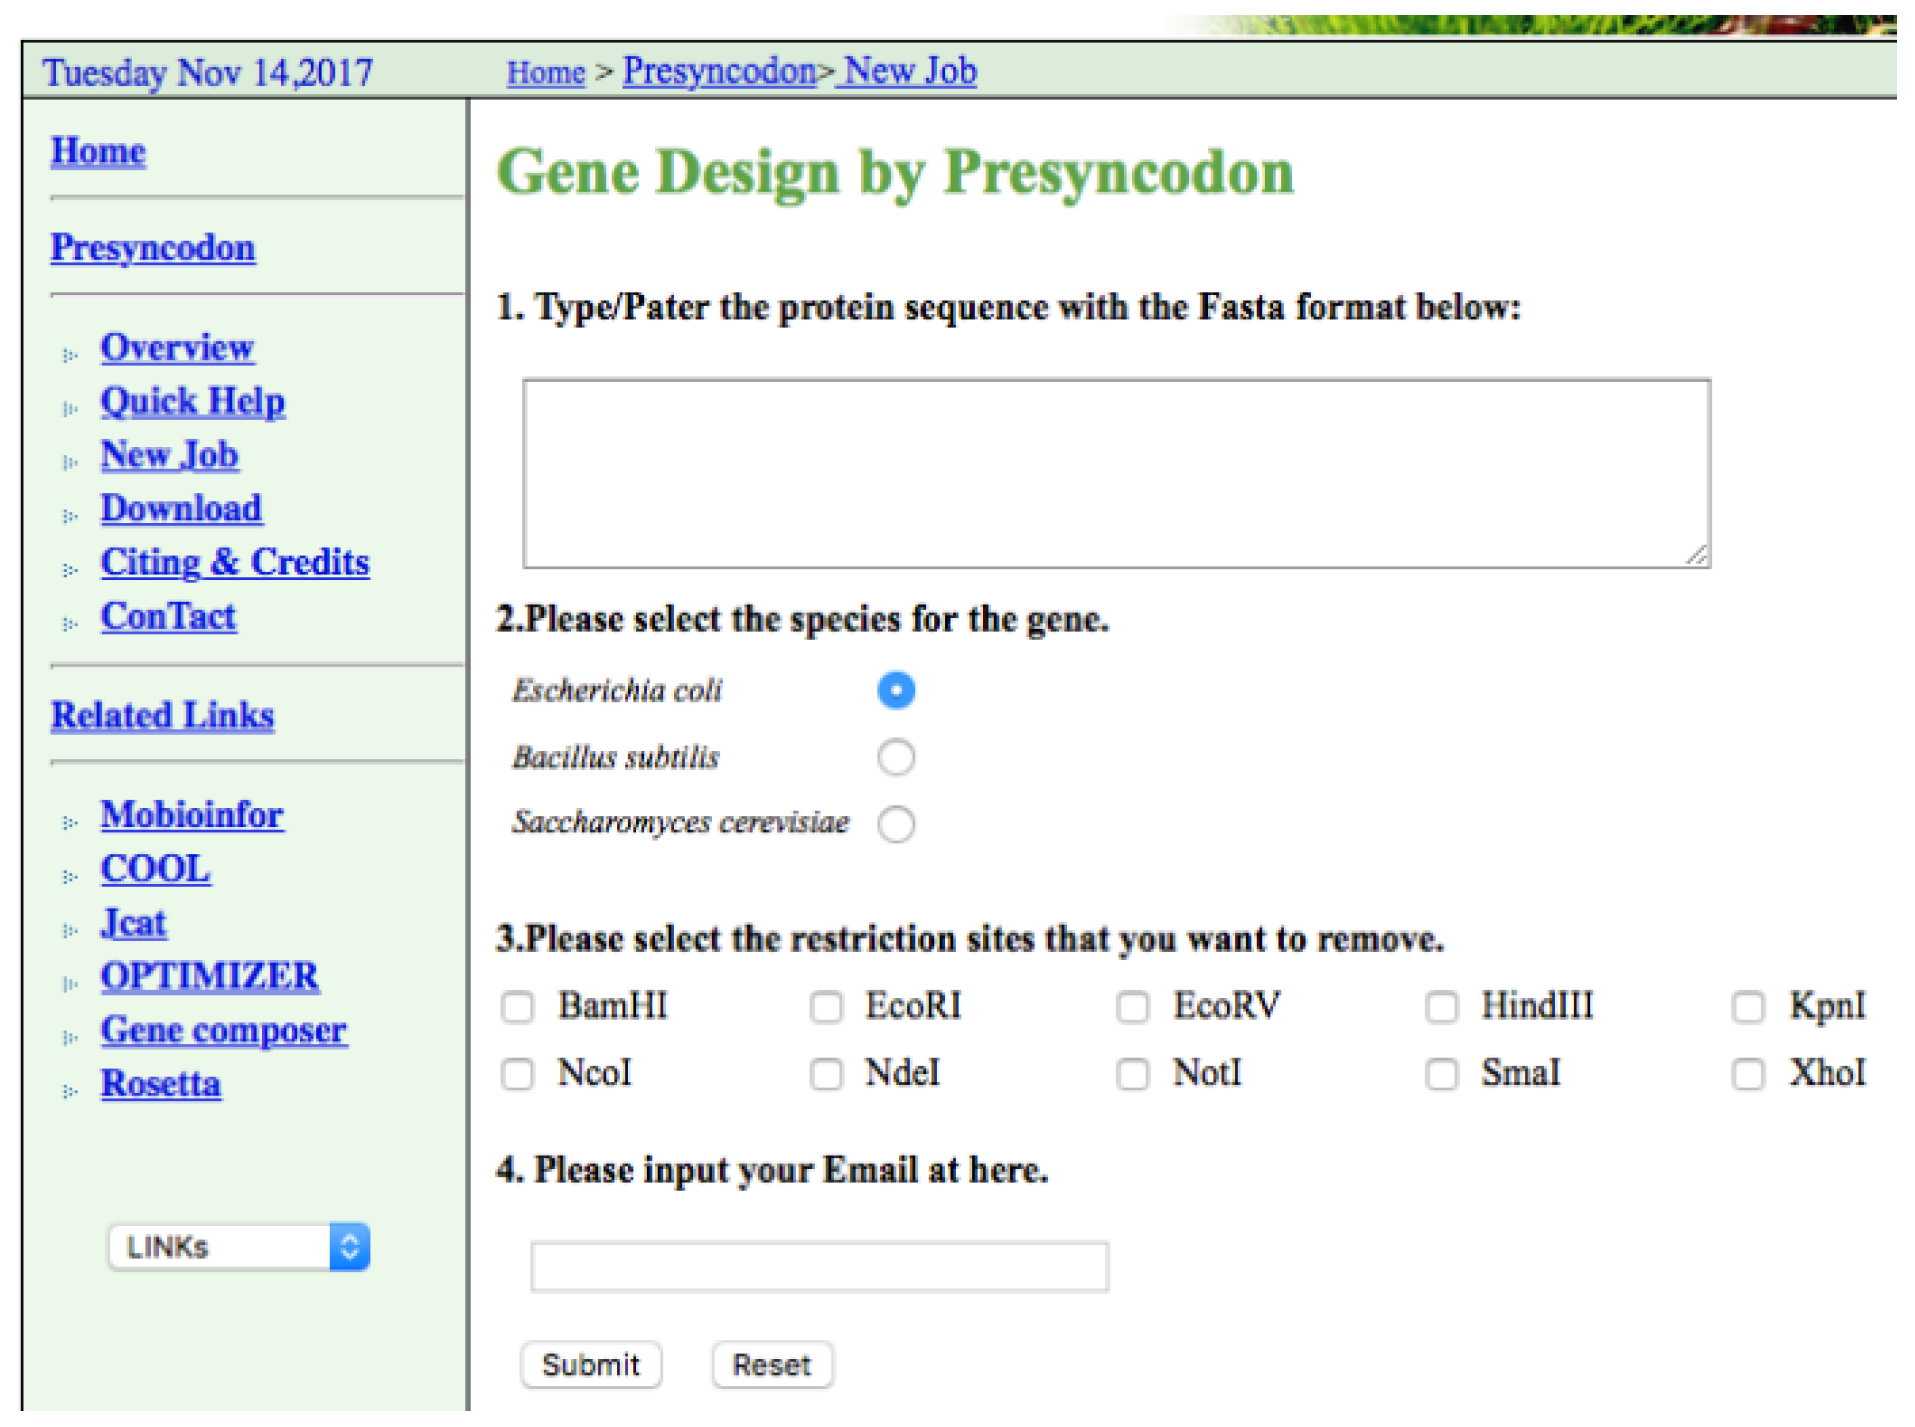
4. Implementation
Supplementary Materials
Author Contributions
Funding
Acknowledgments
Conflicts of Interest
References
- Cannarozzi, G.; Schraudolph, N.N.; Faty, M.; von Rohr, P.; Friberg, M.T.; Roth, A.C.; Gonnet, P.; Gonnet, G.; Barral, Y. A role for codon order in translation dynamics. Cell 2010, 141, 355–367. [Google Scholar] [CrossRef] [PubMed]
- Gamble, C.E.; Brule, C.E.; Dean, K.M.; Fields, S.; Grayhack, E.J. Adjacent Codons Act in Concert to Modulate Translation Efficiency in Yeast. Cell 2016, 166, 679–690. [Google Scholar] [CrossRef] [PubMed]
- Brandis, G.; Hughes, D. The Selective Advantage of Synonymous Codon Usage Bias in Salmonella. PLoS Genet. 2016, 12, e1005926. [Google Scholar] [CrossRef] [PubMed]
- Brule, C.E.; Grayhack, E.J. Synonymous Codons: Choose Wisely for Expression. Trends genet. 2017, 33, 283–297. [Google Scholar] [CrossRef] [PubMed]
- Boel, G.; Letso, R.; Neely, H.; Price, W.N.; Wong, K.H.; Su, M.; Luff, J.D.; Valecha, M.; Everett, J.K.; Acton, T.B.; et al. Codon influence on protein expression in E. coli correlates with mRNA levels. Nature 2016, 529, 358–363. [Google Scholar] [CrossRef] [PubMed]
- Goodman, D.B.; Church, G.M.; Kosuri, S. Causes and Effects of N-Terminal Codon Bias in Bacterial Genes. Science 2013, 342, 475–479. [Google Scholar] [CrossRef] [PubMed]
- Yu, C.H.; Dang, Y.; Zhou, Z.; Wu, C.; Zhao, F.; Sachs, M.S.; Liu, Y. Codon Usage Influences the Local Rate of Translation Elongation to Regulate Co-translational Protein Folding. Mol. Cell 2015, 59, 744–754. [Google Scholar] [CrossRef]
- Grote, A.; Hiller, K.; Scheer, M.; Munch, R.; Nortemann, B.; Hempel, D.C.; Jahn, D. JCat: A novel tool to adapt codon usage of a target gene to its potential expression host. Nucleic Acids Res. 2005, 33, W526–W531. [Google Scholar] [CrossRef]
- Villalobos, A.; Ness, J.E.; Gustafsson, C.; Minshull, J.; Govindarajan, S. Gene Designer: A synthetic biology tool for constructing artificial DNA segments. BMC Bioinform. 2006, 7, 285. [Google Scholar] [CrossRef]
- Puigbo, P.; Guzman, E.; Romeu, A.; Garcia-Vallve, S. Optimizer: A web server for optimizing the codon usage of DNA sequences. Nucleic Acids Res. 2007, 35, W126–W131. [Google Scholar] [CrossRef]
- Lorimer, D.; Raymond, A.; Walchli, J.; Mixon, M.; Barrow, A.; Wallace, E.; Grice, R.; Burgin, A.; Stewart, L. Gene composer: Database software for protein construct design, codon engineering, and gene synthesis. BMC Biotechnol. 2009, 9, 36. [Google Scholar] [CrossRef] [PubMed]
- Liu, X.; Deng, R.; Wang, J.; Wang, X. COStar: A D-star Lite-based dynamic search algorithm for codon optimization. J. Theor. Biol. 2014, 344, 19–30. [Google Scholar] [CrossRef] [PubMed]
- Chin, J.X.; Chung, B.K.; Lee, D.Y. Codon Optimization OnLine (COOL): A web-based multi-objective optimization platform for synthetic gene design. Bioinformatics 2014, 30, 2210–2212. [Google Scholar] [CrossRef] [PubMed]
- Zhou, M.; Guo, J.; Cha, J.; Chae, M.; Chen, S.; Barral, J.M.; Sachs, M.S.; Liu, Y. Non-optimal codon usage affects expression, structure and function of clock protein FRQ. Nature 2013, 495, 111–115. [Google Scholar] [CrossRef] [PubMed]
- Blazej, P.; Mackiewicz, D.; Wnetrzak, M.; Mackiewicz, P. The Impact of Selection at the Amino Acid Level on the Usage of Synonymous Codons. G3 2017, 7, 967–981. [Google Scholar] [CrossRef] [PubMed]
- Napolitano, M.G.; Landon, M.; Gregg, C.J.; Lajoie, M.J.; Govindarajan, L.; Mosberg, J.A.; Kuznetsov, G.; Goodman, D.B.; Vargas-Rodriguez, O.; Isaacs, F.J.; et al. Emergent rules for codon choice elucidated by editing rare arginine codons in Escherichia coli. Proc. Natl. Acad. Sci. USA 2016, 113, E5588–E5597. [Google Scholar] [CrossRef] [PubMed]
- Chaney, J.L.; Steele, A.; Carmichael, R.; Rodriguez, A.; Specht, A.T.; Ngo, K.; Li, J.; Emrich, S.; Clark, P.L. Widespread position-specific conservation of synonymous rare codons within coding sequences. PLoS Comput. Biol. 2017, 13, e1005531. [Google Scholar] [CrossRef] [PubMed]
- Jacobs, W.M.; Shakhnovich, E.I. Evidence of evolutionary selection for cotranslational folding. Proc. Natl. Acad. Sci. USA 2017, 114, 11434–11439. [Google Scholar] [CrossRef] [PubMed]
- Zhou, Z.; Dang, Y.; Zhou, M.; Li, L.; Yu, C.H.; Fu, J.; Chen, S.; Liu, Y. Codon usage is an important determinant of gene expression levels largely through its effects on transcription. Proc. Natl. Acad. Sci. USA 2016, 113, E6117–E6125. [Google Scholar] [CrossRef] [PubMed]
- Tian, J.; Yan, Y.; Yue, Q.; Liu, X.; Chu, X.; Wu, N.; Fan, Y. Predicting synonymous codon usage and optimizing the heterologous gene for expression in E. coli. Sci. Rep. 2017, 7, 9926. [Google Scholar] [CrossRef]
- Fu, L.; Niu, B.; Zhu, Z.; Wu, S.; Li, W. CD-HIT: Accelerated for clustering the next-generation sequencing data. Bioinformatics 2012, 28, 3150–3152. [Google Scholar] [CrossRef] [PubMed]
- Liaw, A.; Wiener, M. Classification and Regression by randomForest. R News 2002, 2, 18–22. [Google Scholar]
- Breiman, L. Random Forests. Mach. Learn. 2001, 45, 5–32. [Google Scholar] [CrossRef]


© 2018 by the authors. Licensee MDPI, Basel, Switzerland. This article is an open access article distributed under the terms and conditions of the Creative Commons Attribution (CC BY) license (http://creativecommons.org/licenses/by/4.0/).
Share and Cite
Tian, J.; Li, Q.; Chu, X.; Wu, N. Presyncodon, a Web Server for Gene Design with the Evolutionary Information of the Expression Hosts. Int. J. Mol. Sci. 2018, 19, 3872. https://doi.org/10.3390/ijms19123872
Tian J, Li Q, Chu X, Wu N. Presyncodon, a Web Server for Gene Design with the Evolutionary Information of the Expression Hosts. International Journal of Molecular Sciences. 2018; 19(12):3872. https://doi.org/10.3390/ijms19123872
Chicago/Turabian StyleTian, Jian, Qingbin Li, Xiaoyu Chu, and Ningfeng Wu. 2018. "Presyncodon, a Web Server for Gene Design with the Evolutionary Information of the Expression Hosts" International Journal of Molecular Sciences 19, no. 12: 3872. https://doi.org/10.3390/ijms19123872
APA StyleTian, J., Li, Q., Chu, X., & Wu, N. (2018). Presyncodon, a Web Server for Gene Design with the Evolutionary Information of the Expression Hosts. International Journal of Molecular Sciences, 19(12), 3872. https://doi.org/10.3390/ijms19123872