Article

Proteolipid Protein 2 Overexpression Indicates Aggressive Tumor Behavior and Adverse Prognosis in Human Gliomas

1
Graduate Institute of Pathology and Parasitology, National Defense Medical Center, Taipei 11490, Taiwan
2
Department of Neurological Surgery, Tri-Service General Hospital, National Defense Medical Center, Taipei 11490, Taiwan
3
Department of Pathology, Tri-Service General Hospital, National Defense Medical Center, No. 325, Sec. 2, Cheng-Kung Road, Neihu 114, Taipei 11490, Taiwan
*
Author to whom correspondence should be addressed.
Int. J. Mol. Sci. 2018, 19(11), 3353; https://doi.org/10.3390/ijms19113353
Submission received: 27 September 2018 / Revised: 21 October 2018 / Accepted: 23 October 2018 / Published: 26 October 2018
(This article belongs to the Section Molecular Pathology, Diagnostics, and Therapeutics)

Abstract

:
Proteolipid protein 2 (PLP2), a membrane protein of the endoplasmic reticulum, is related to tumor proliferation and metastasis in some human cancers, but not in gliomas. First, we performed western-blot analysis, real-time quantitative PCR and immunohistochemical stains to detect PLP2 expression in 4 glioma cell lines and human glioma tissues. In addition, we used small interfering RNA (SiPLP2) and short hairpin RNA (shPLP2) to knockdown PLP2 expression in GBM8401 and LN229 glioma cell lines. After then, the alteration of PLP2 suppressed glioma cells behavior were examined by cell proliferation, wound healing, cell invasion, and colonies formation assays. Finally, the possible mechanism of PLP2 was analyzed by detecting the expression of the proteins related to cell-cycle checkpoints, cell-proliferative signaling factors, and cell-matrix interaction. Compared with normal brain cell lysates and mRNA, all glioma cell lines displayed PLP2 protein and mRNA overexpression. Besides, higher PLP2 IHC staining significantly correlated with more advanced tumor grades and poorer prognosis in human gliomas. Both siPLP2 transfected gliomas showed a clear inhibition of glioma cell proliferation, migration, and invasion as well as down-regulating p-p38, p-ERK, MMP-2, and MMP-9 expression. In conclusion, we successfully demonstrated that PLP2 overexpression played an oncogenic role in glioma development and aggressive tumor behavior.

Graphical Abstract

1. Introduction

Primary brain tumors (PBT) are not easily-identified neoplasms because of the limitations of diagnostic tools and the inconspicuous symptoms, except for tumor compression [1]. Whether PBTs are benign or malignant, surgical resection of brain neoplasms is a standard treatment to decrease tumor recurrence rates and prolong patient survival [2,3]. In a recent study, various molecular epidemiologic factors, including unrepaired mutant DNA, cell-cycle disarrangement, metabolic disorders, and long-term repeated inflammation, have been demonstrated to be related to the development of PBTs [4]. The two most common categories of PBTs are meningiomas and gliomas [5,6]. Optimal treatment and prognosis depend on the extent of tumor involvement, tumor size, location, and World Health Organization (WHO) specified grades [7]. Unlike low-grade glioma, post-operative radiotherapy and chemotherapy produced some benefits with more advanced tumors [7]. In recent years, the concomitance of newly developed alkylating drugs, such as temozolomide (TMZ), with external beam radiation therapy or stereotactic radiosurgery has been shown to effectively induce apoptosis in high-grade glioma cells and potentially result in prognostic improvement. This concomitance is especially apparent in elderly patients [7,8]. However, some severe complications from the above therapeutic regimens, including somnolence syndrome [9], cerebral radionecrosis [10], posterior leukoencephalopathy [11,12], and secondary hematologic malignancies [13,14], could restrict the wide use of these drugs. Recently, many genetic mutations have been proven to be related to drug effectiveness and the disease-free survival of glioma patients. Such mutations include those of O6 methyl-guanine methyltransferase (MGMT) [15,16], isocitrate dehydrogenase (IDH) [17,18], BRAF [19,20], and co-deletion of 1p and 19q [21,22,23]. Similarly, some genetic aberrations, such as in NF2 [24,25], AKT1/TRF7 [26], SMO [26], KLF4/TRF7 [27], and TERT [28], have been demonstrated to be associated with the tumor recurrence rate, histological sub-classification, and disease-free survival time of meningioma patients. Accordingly, PBTs are considered a multifactorial disease [5].
According to the revised 2016 WHO classification of central nervous system tumors, grade II to IV astrocytic tumors divided into IDH-mutant and IDH-wildtype based on the immunohistochemical analysis. The function of IDH catalyzes the oxidative decarboxylation of isocitrate, which produces alpha-ketoglutarate [29]. The mutation status of IDH1 or IDH2 leads to the production of the oncometabolite 2-hydroxyglutarate [29]. The epidemiology of IDH mutation mainly located on grade II–III gliomas and represented a relatively favorable prognosis [4]. However, only a small portion of glioblastomas revealed IDH mutation. In addition, compared to other high-grade gliomas, a new entity of “diffuse midline glioma, H3 K27M-mutant” often occurred in children [30]. The mutation of histone H3 often located on at codon 27 and represented a gain of function [31]. H3 K27M mutation gliomas showed aggressive tumor behavior and poor prognosis, even histological absence of brick mitotic figures, microvascular proliferation, or pseudopalisading necrosis [32].
The phosphatidylinositol-3-kinase (PI3K)/protein kinase B (Akt) and the mammalian target of rapamycin (mTOR) signaling pathways induce cell proliferation and angiogenesis in glioblastomas and neuroblastomas [33,34]. The suppression of PI3K/AKT/mTOR pathway effectively regulates cell-cycle entry, glycogen metabolism, and vasculogenesis [35]. Proteolipid protein 2 (PLP2) is a 4-transmembrane protein that is expressed in several areas of the brain, including the hippocampus [36]. Otherwise, PLP2 had been viewed as an oncogenic-inducer in several human cancers including melanoma, osteosarcoma, breast cancer, hepatocellular carcinomas, and acute lymphoblastic leukemia [37,38,39,40,41]. In the recent study, PLP2 could stimulate matrix metalloprotease 2 (MMP2) secretions to induce melanoma cell proliferation, invasion and even metastasis [37]. However, the function of PLP2 in gliomas remained unclear.
In this study, we performed in vitro studies, tissue microarrays, and immunohistochemical stains to detect the possible role of PLP2 in glioma. This study successfully proves that PLP2 induces tumor overgrowth and correlates with poor prognosis in glioma patients. Additionally, PLP2 suppression may inhibit glioma cell migration and invasion. Although the detailed mechanism remained undetermined, our results supported PLP2 could induce cell cycle checkpoint dysregulation, stimulate extracellular matrix factors overexpression and enhance Raf/MEK/ERK signaling pathway in glioma tumorigenesis. Furthermore, the consistent results from in vitro studies and human tissue specimens supplied strong evidence to prove the oncogenic role of PLP2 in glioma.

2. Results

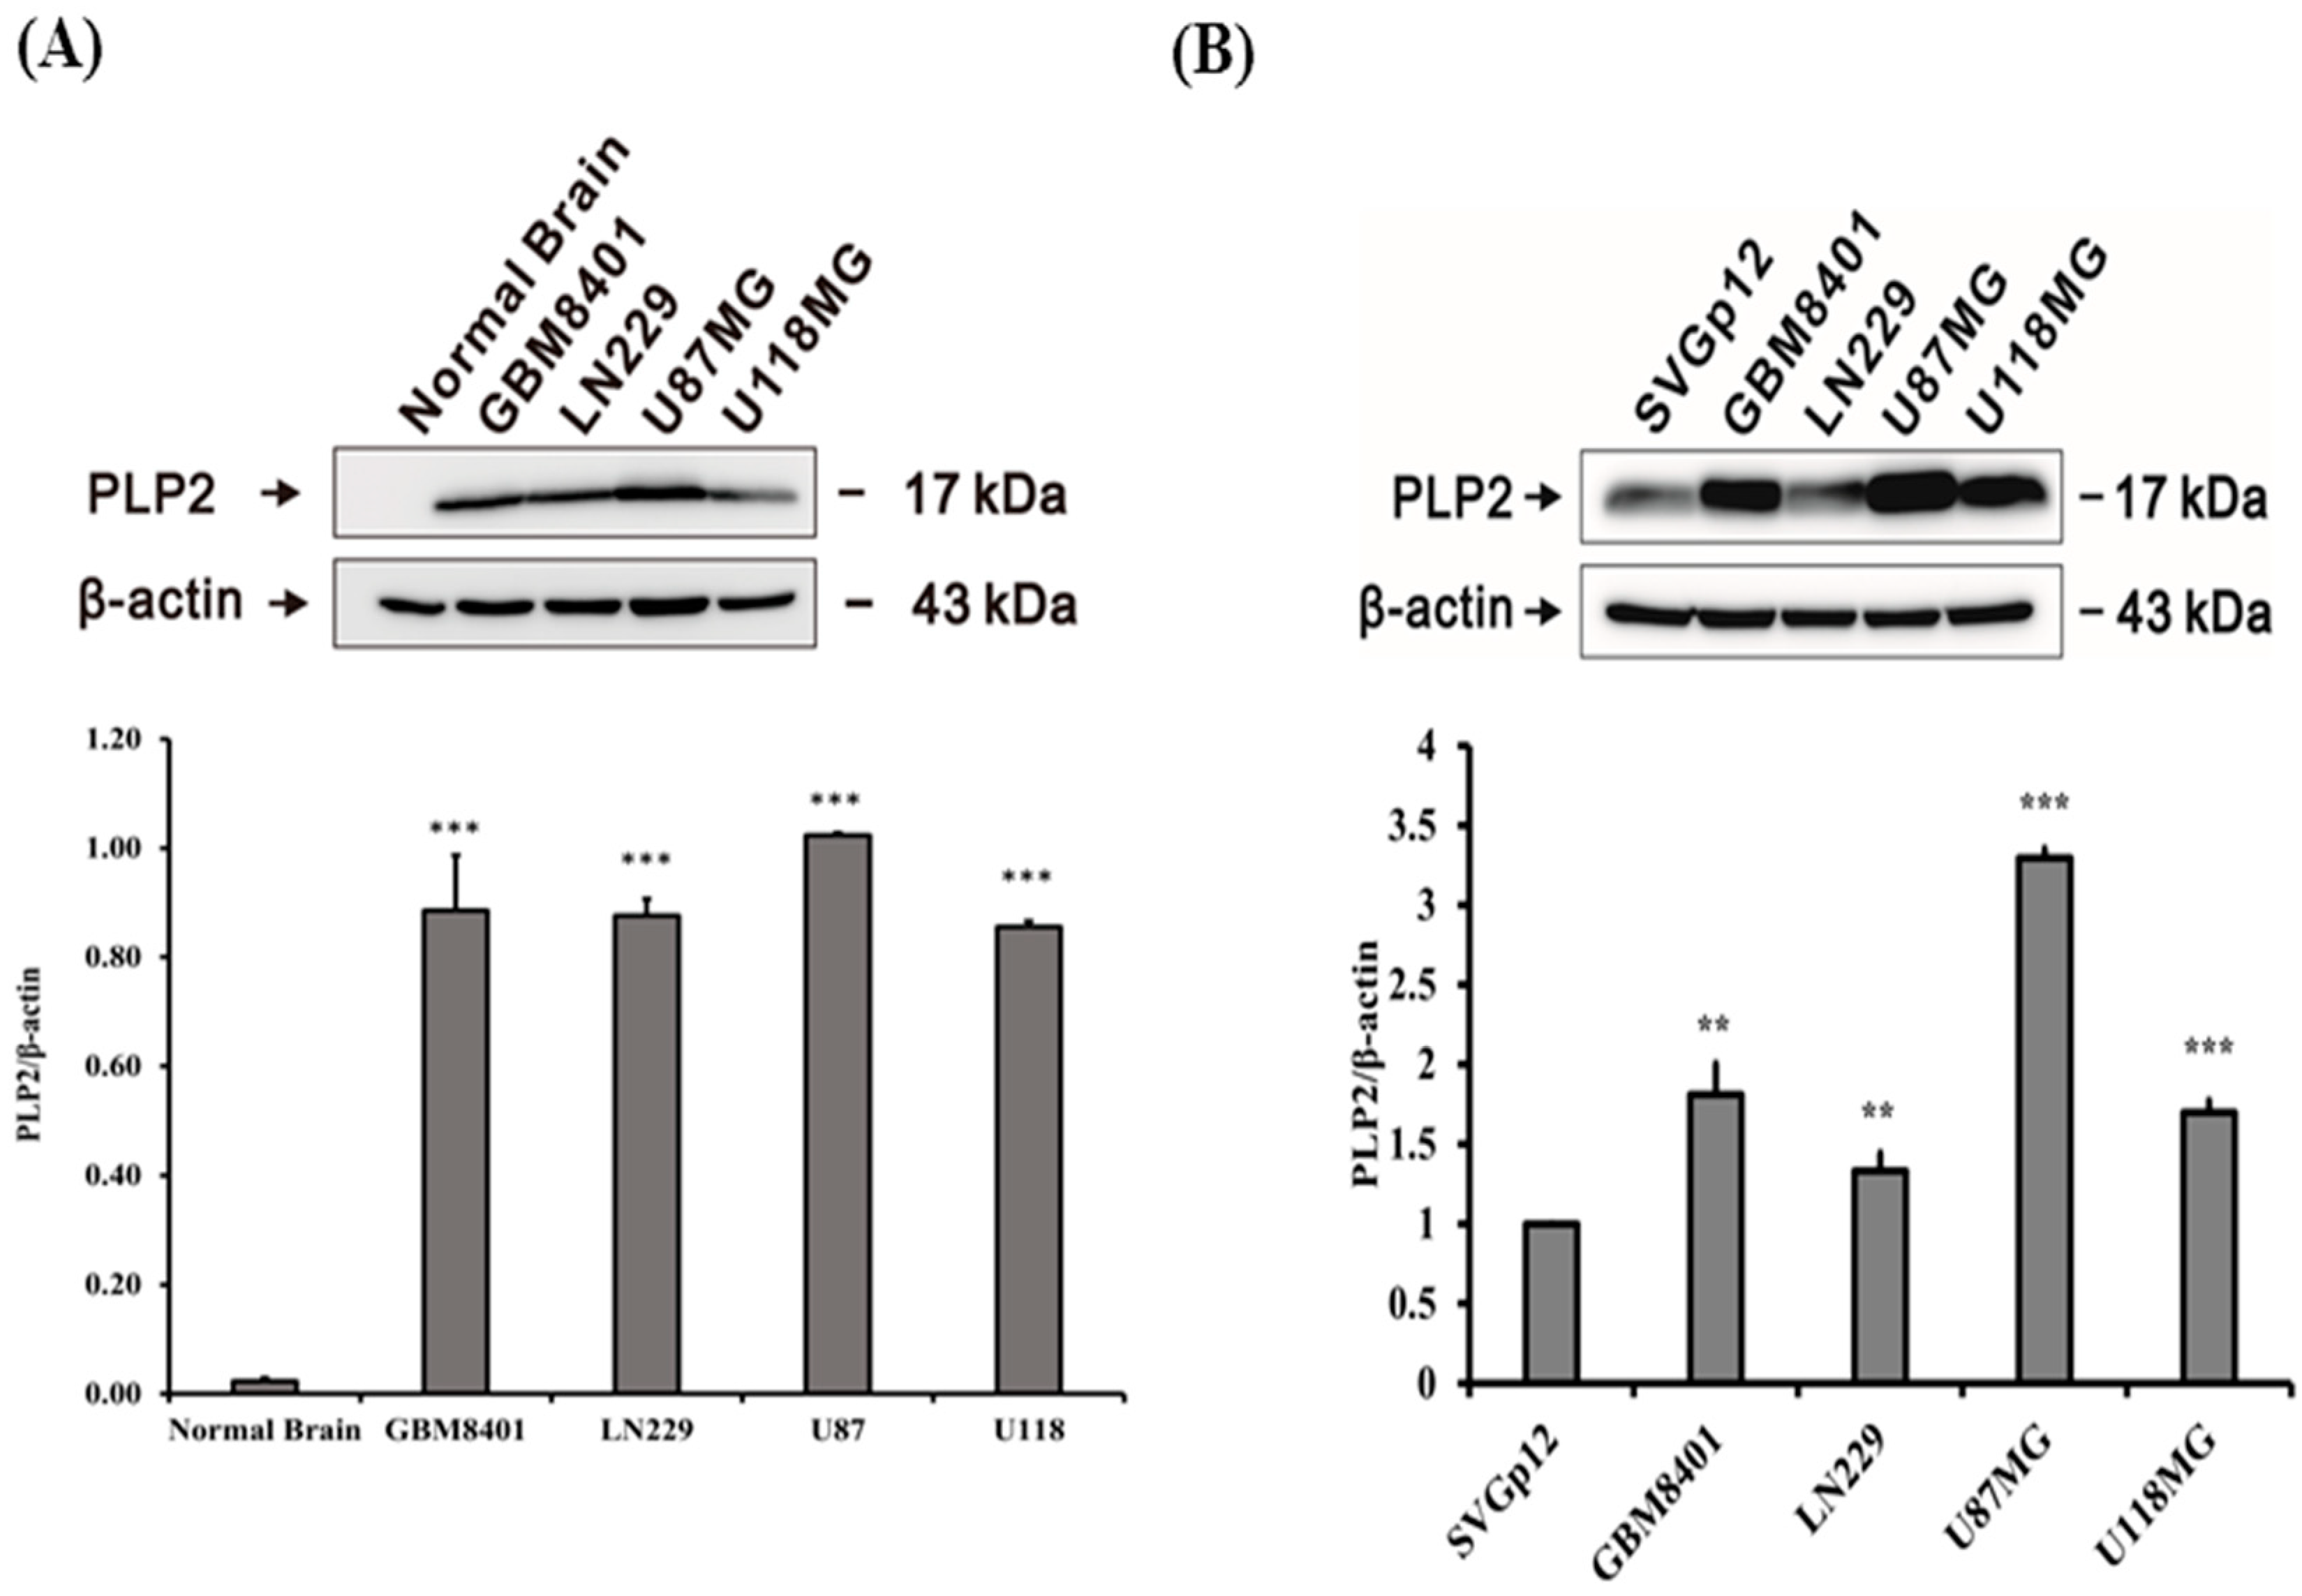
2.1. PLP2 Protein Overexpression in Human Glioma Cell Lines

To detect PLP2 protein expression, western-blot analysis was performed in normal brain tissue and human glioma cell lines. Compared with normal brain cell lysates, our study revealed PLP2 overexpression in the GBM8401, LN229, U87MG, and U118MG human glioma cell lines (* p < 0.05; ** p < 0.01; *** p < 0.001, Figure 1A). In order to evaluate the differences of PLP2 expression between glial cell and glioma cell lines, higher PLP2 expression was identified on all glioma cell lines than the SV40-immortalized human fetal glial cell line SVG p12 by western-blot analysis (** p < 0.01; *** p < 0.001, Figure 1B). Therefore, in an in vitro study, we demonstrated the phenomenon of PLP2 overexpression in all human glioma cell lines.

2.2. Higher PLP2 mRNA Expression in Human Glioma Cell Lines than in Normal Brain Tissues

To evaluate PLP2 mRNA expression in human glioma cell lines, we applied quantitative RT-PCR on cDNA isolated from normal brain tissue and four different clones of glioma cell lines including GBM8401, LN229, U87MG, and U118MG. All glioma cell lines presented higher PLP2 mRNA expression than normal brain tissue cDNA. Of all glioma cell lines, the degree of PLP2 mRNA expression in LN229 and GBM8401 was higher than that in U87MG and U118MG (** p < 0.01; *** p < 0.001, Figure 2).

2.3. PLP2 IHC Staining Correlated with WHO Grades and Poor Prognosis in Gliomas

To evaluate PLP2 expression in human glioma tissues, we performed IHC staining for PLP2 on 2 tissue microarray slides of various World Health Organization (WHO) grades of gliomas. After the exclusion of some cases with inadequate representative specimens, 10 non-neoplastic brain tissues and 76 gliomas with various WHO grades were included in this study. Of all gliomas, 1 pilocytic astrocytoma, 1 diffuse astrocytoma with IDH-mutant, 13 diffuse astrocytoma with IDH-wildtype (WT), 3 anaplastic astrocytomas with IDH-mutant, 7 anaplastic astrocytomas with IDH-WT, 3 oligodendrogliomas, NOS, 5 anaplastic oligodendrogliomas, NOS, 5 glioblastomas with IDH-mutant, 26 glioblastomas with IDH-WT, and 12 diffuse midline gliomas with H3 K27M-mutant from the results of IDH1 R132H, IDH2 and H3 K27M IHC staining (Table 1). Most non-neoplastic brain tissue cases revealed negative or small portions of PLP2 IHC staining. On the contrary, higher PLP2 expression significantly correlated with more advanced tumor grades of gliomas (p = 0.039, Figure 3). Otherwise, in order to evaluate PLP2 with other glioma-related genes expression, we performed univariate or multivariate analysis to detect the possible PLP2 associated risk factors. The epidermal growth factor receptor vIII (EGFRvIII), AXL and loss of H3 K27me3 expression were the independent factors associated with PLP2 overexpression (Table 2). Additionally, to detect the overall survival time with PLP2 expression, we divided all gliomas into two groups based on high and low PLP2 expression. The cut-off of PLP2 immunostain scores was set at 40 for gliomas based on the relatively equal number of cases in each group [42]. 32 cases of PLP2 immunostain score < 40 and 34 cases of score ≥ 40 were followed for five years. These data revealed that higher PLP2 expression was correlated with shorter overall survival time in gliomas (p = 0.003, Figure 4). Furthermore, of all included factors, senior glioma patient, PLP2 overexpression, loss of ATRX, and positive expression of AxL, NUR77 or PDGFRA were the independent prognostic factors under cox regression analysis (Table 3).

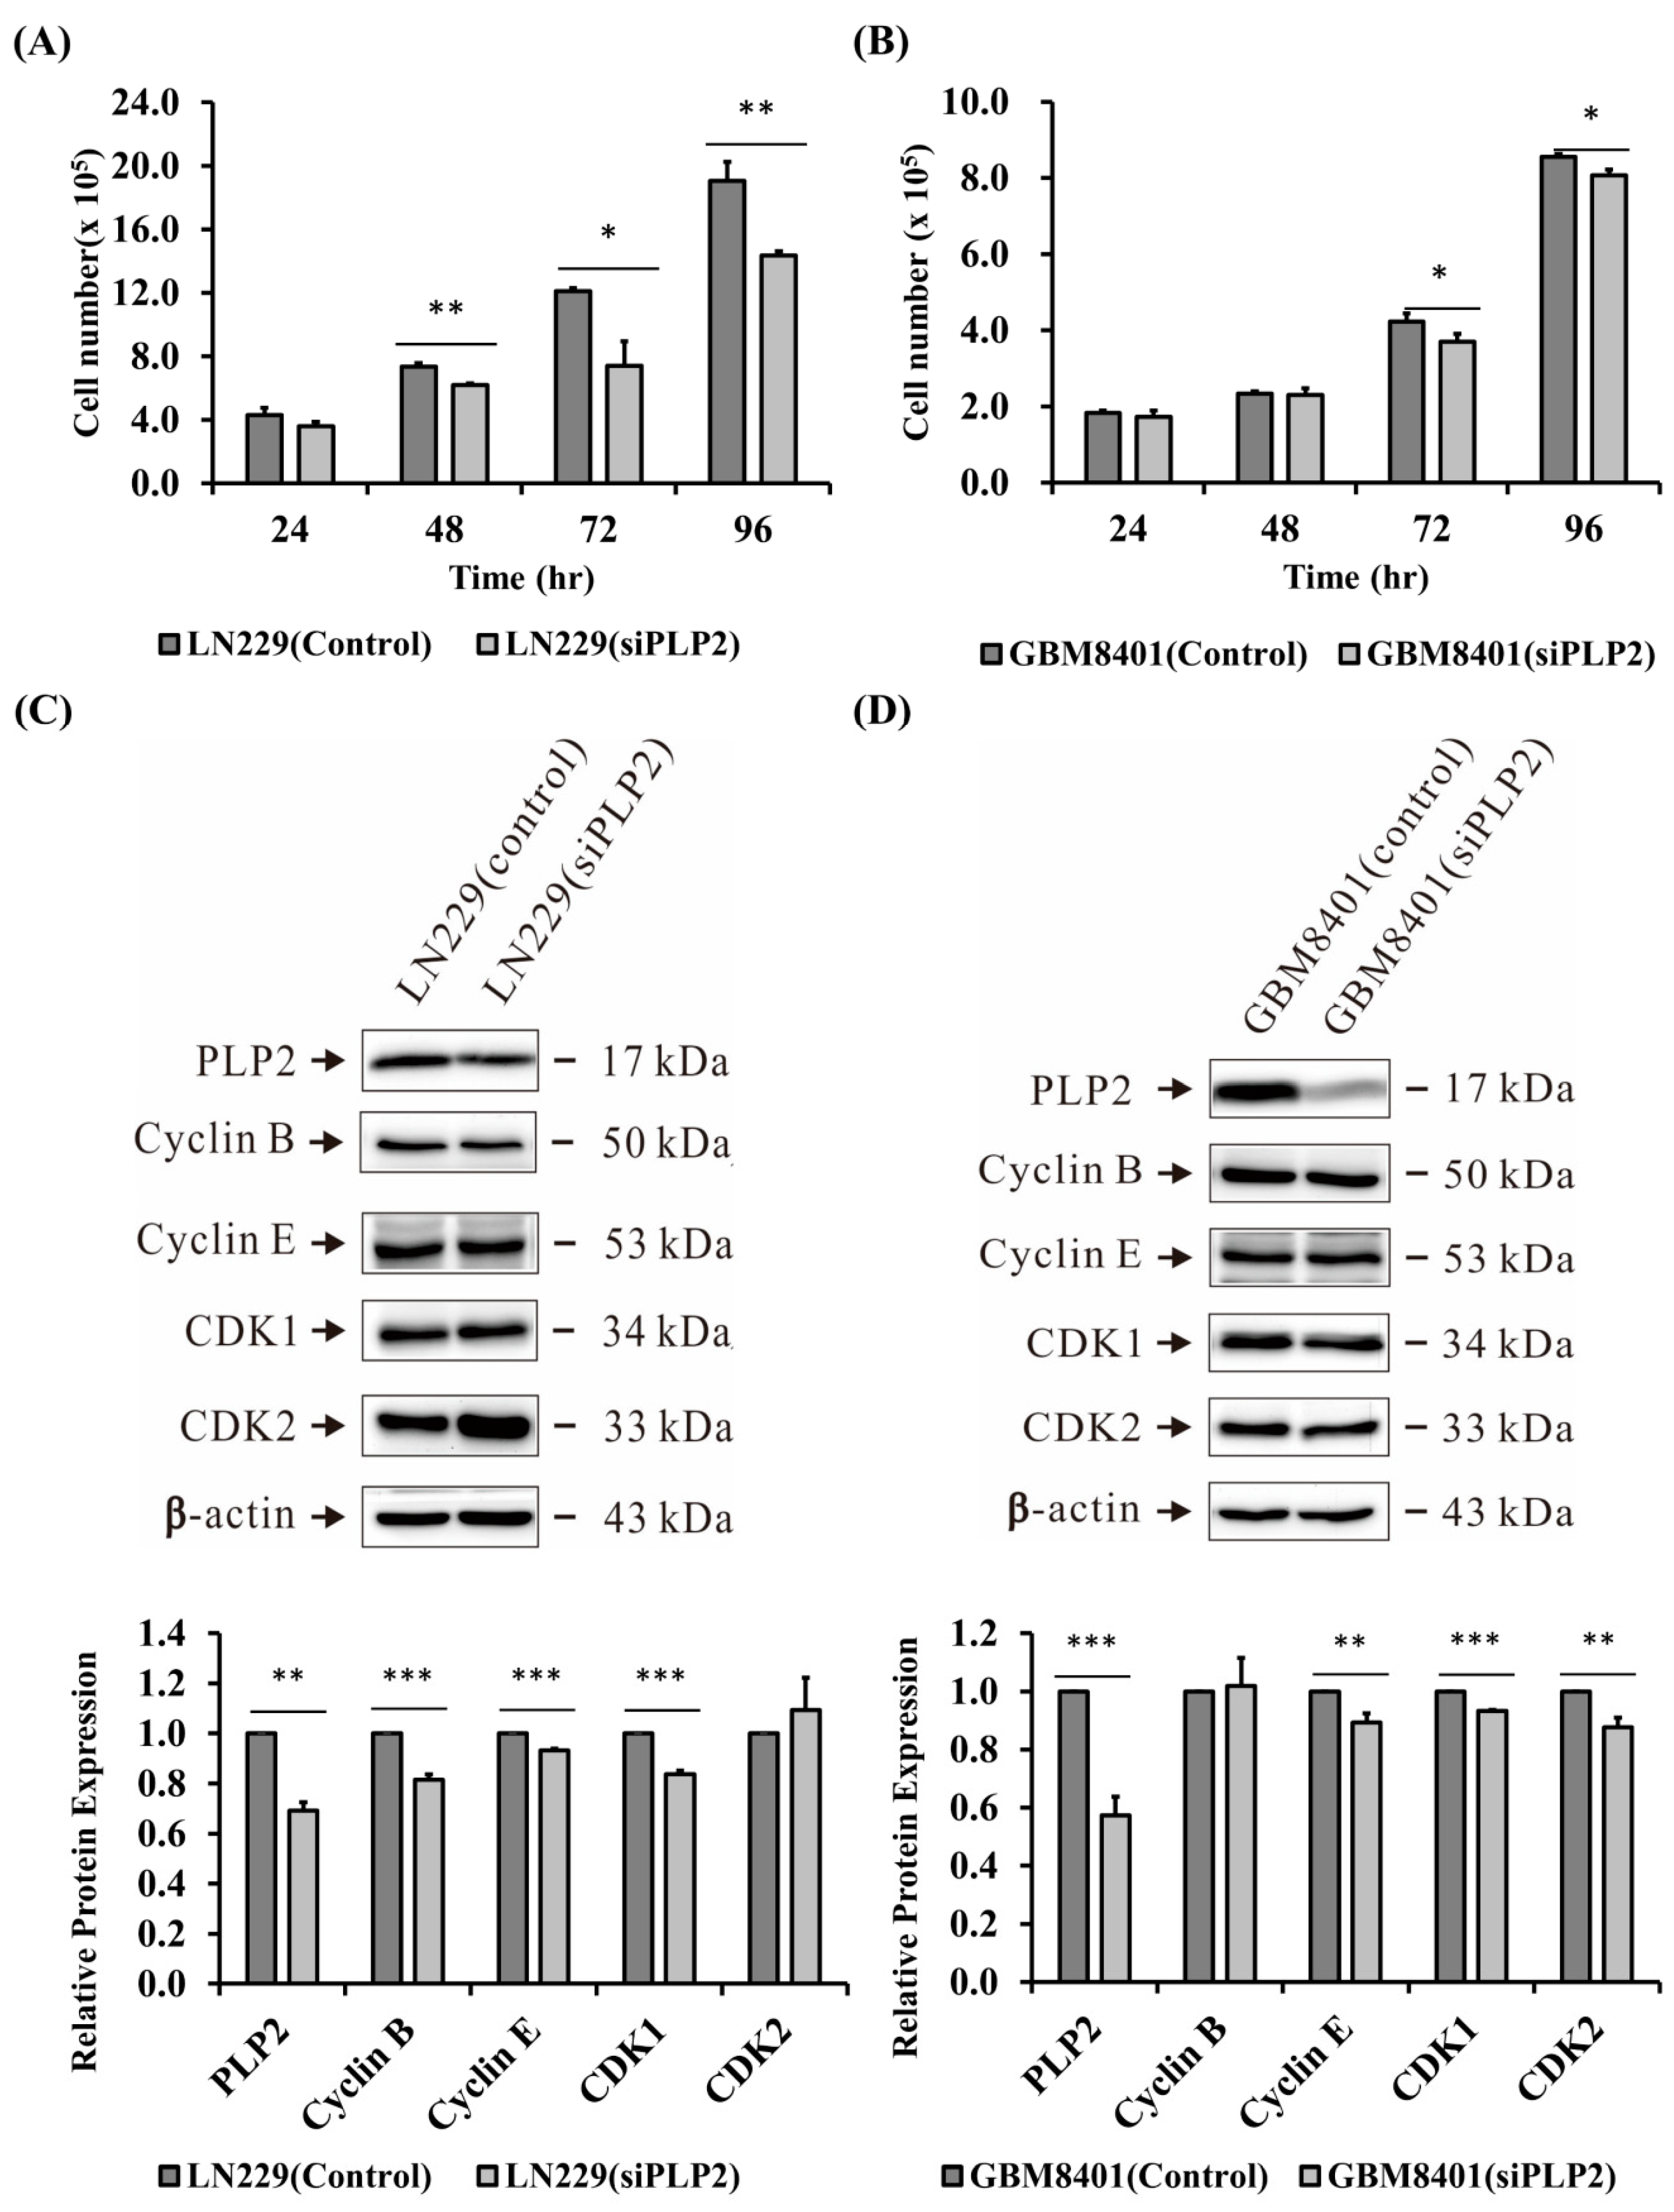
2.4. Suppression of PLP2 Inhibits Glioma Cell Proliferation

To check the role of PLP2 expression and glioma cell proliferation, cell counting assessment was analyzed. Since GBM8401 and LN229 glioma cell lines revealed higher PLP2 mRNA expression than U87MG, and U118MG, GBM8401 and LN229 glioma cell were transfected with siPLP2 and siRNA-A (scramble siRNA) (NC). In the first 24 h, the number of siPLP2 transfected glioma cells was not significantly different from that in the NC transfected group. After 48 h, siPLP2 transfected LN229 glioma cells revealed lower ability for cell proliferation (* p < 0.05; ** p < 0.01, Figure 5A). Similarly, compared with NC, a significantly lower number of GBM8401 glioma, with siPLP2 transfection, was also identified after 72 h (p < 0.05, Figure 5B). Therefore, we successfully demonstrated that PLP2 is an important cell proliferative factor in glioma cells, especially the LN229 glioma cell line. Additionally, we also performed western-blot analysis to evaluate the association between PLP2 and cell-cycle checkpoints in the LN229 and GBM8401 glioma cells. Our study revealed that the inhibition of PLP2 could suppress cyclin-B, cyclin-E, and CDK1 expression in LN229 glioma cells (** p < 0.01; *** p < 0.001, Figure 5C). In addition, cyclin-E, CDK1, and CDK2 were significantly suppressed in siPLP2 transfected GBM8401 gliomas (** p < 0.01; *** p < 0.001, Figure 5D). Therefore, we confirmed that PLP2 could accelerate cell proliferation depending on the activation of cell-cycle checkpoint proteins from the G1-S and G2-M phases. Furthermore, our data also revealed PLP2 inhibition could effectively down-regulate phosphorylated-p38 (p-p38) and p-ERK expression (p < 0.001, Figure 6A).

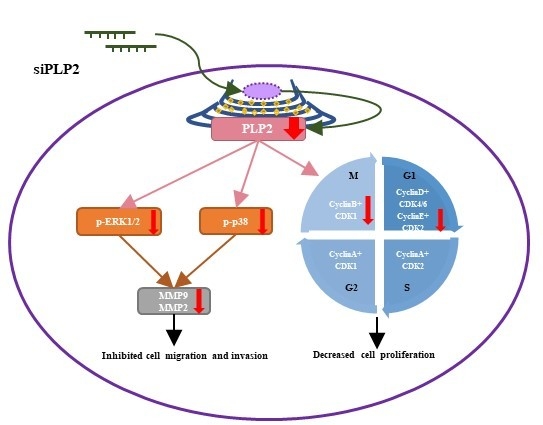
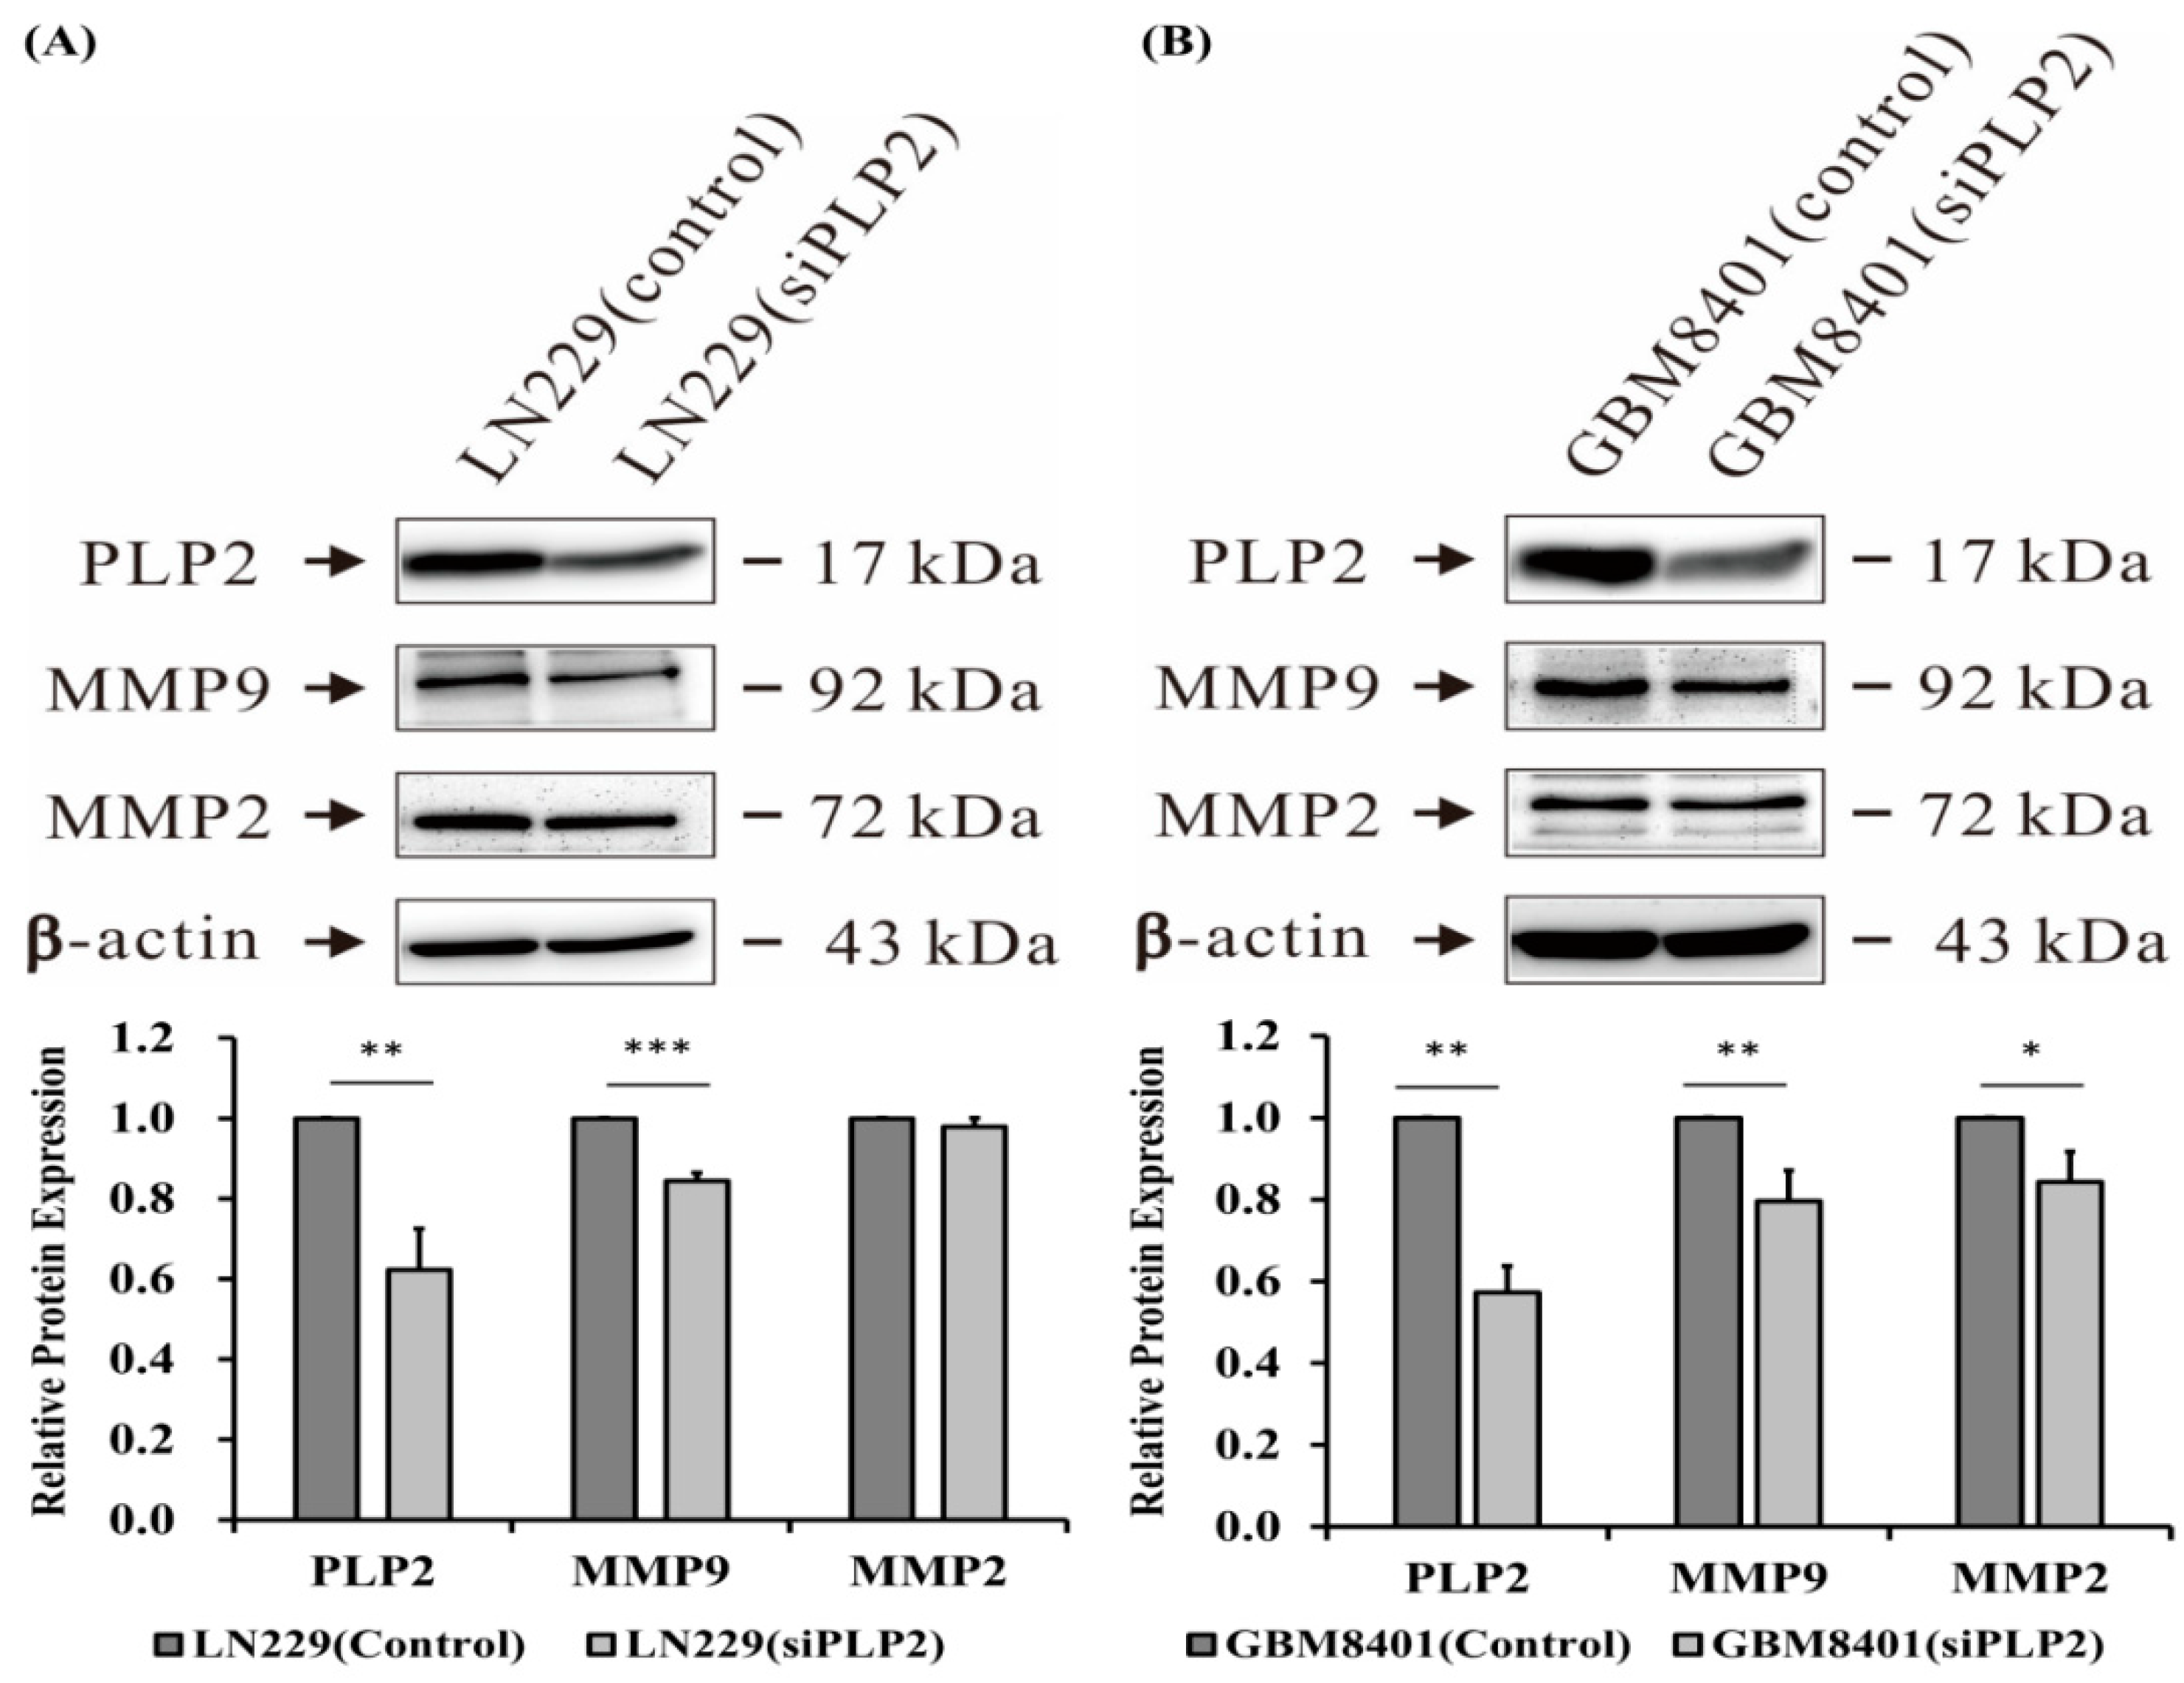
2.5. PLP2 Inhibition Down-Regulates Glioma Cell Migration and Invasion

To detect the relationship between PLP2 expression and glioma cell aggressiveness, wound-healing tests, and cell invasion assays were employed on GBM8401 and LN229 cell lines. Both the included glioma cell lines with siPLP2 transfection showed weaker cellular migration than NC transfection after 16 h as determined by the difference in the dimensions of the scratch area (p < 0.001, Figure 6B). Similarly, less trans-membranous siPLP2 transfected LN229 glioma cells indicated that the suppression of PLP2 could inhibit tumor invasive behavior (p < 0.01, Figure 7A).

2.6. Knockdown of PLP2 Expression Inhibits Glioma Tumorigeneity

Since soft agar colony formation test is an ideal tool for quantitative assessing cancer cell proliferation and migration [43], we performed this assay to evaluate the ability for tumor tumorigenicity in gliomas with a PLP2 knockdown. Our results indicate that the LN229 glioma cells with short hairpin RNA (shPLP2) transfection produce significantly fewer cell colonies than cells transfected with an empty-vector (p < 0.001, Figure 7B). Therefore, the inhibition of PLP2 expression could effectively decrease glioma cell spheres formation. Besides, as the extracellular matrix degradation is an important factor for tumor invasion and metastasis, we also evaluated the possible influence of PLP2 expression and cell-matrix interaction. These data indicate that PLP2 knockdown could down-regulate matrix metalloproteinase 9 (MMP9) in LN229 and GBM8401 glioma cell lines, and matrix metalloproteinase 2 (MMP2) expression in GBM8401 glioma cell line (* p < 0.05; ** p < 0.01; *** p < 0.001, Figure 8).

3. Discussion

Recently, PLP2 expression has been reported to be associated with tumor cell persistence and metastasis in melanoma and hematologic malignancies [37,41]. Sonoda et al. [37] demonstrated that PLP2 plays an important role in up-regulation of the PI3K/AKT/mTOR pathway and induction of melanoma cell overgrowth. Additionally, the down-regulation of PLP2 expression by microRNA-664 significantly inhibited leukemic and melanoma cell proliferation and invasion [41,44]. Similarly, we demonstrated the relationship between PLP2 expression and glioma cell proliferation, migration, invasion, and metastatic characters. We also identified the potential activation of G2-M cell-cycle checkpoints, and factors involved in cell-matrix interaction, as possible mechanisms in the in vitro studies. In addition, our tissue microarray study showed that PLP2 IHC staining is positively correlated with tumor grade and poor survival time in human gliomas.
In the current study, our results indicated the possible role of PLP2 in the up-regulation of the phosphorylated p38 (p-p38) and p-ERK. Bradham et al. [45] demonstrated that p38 is a mitogen-activated protein kinase (MAPK) which acts as a responder to stress and cytokines. p38 activation is associated with several signaling pathways, such as MAPK and MKK kinase [46]. In addition, p38, MAPK, phosphatidylinositol 3-kinase (PI3K), Rac1, Cdc42, and JNK-dependent pathways are important factors for lysophosphatidic acid (LPA) signaling, which is related to glioma cell migration [45]. Otherwise, ERK phosphorylation relied on some cellular proliferative factors, such as guanine nucleotide binding protein (G-protein) coupled receptors and carcinogens [47]. The processes of cellular mitosis and meiosis were involved in the Raf/MEK/ERK signaling pathway [48]. Therefore, we discovered that PLP2 expression could up-regulate the p-p38 and p-ERK pathways and induced glioma cell proliferation, migration, and invasion. However, more evidence is needed to confirm the detailed mechanism.
It is difficult to discriminate reactive glial proliferation from low-grade neoplastic lesions because of the overlap in histologic appearance and the similar proliferative index [49,50]. Moreover, it is difficult to determine the precise glioma WHO grades owing to the frequently fragmented surgical specimens taken from limited operative spaces. In the recent studies, the benefits of IHC stain analysis for the assessment of glioma cell behavior was shown to be relatively effective and inexpensive [51,52]. The application of isocitrate dehydrogenase I R132H (IDH1 R132H) could differentiate low-grade gliomas from non-neoplastic CNS lesions [53,54]. In this study, we showed that PLP2 IHC staining can not only discriminate glioma from non-neoplastic brain tissue, but also help clinical doctors and pathologists predict tumor aggressiveness and overall prognosis.
From our univariate and multivariate analysis, PLP2 overexpression was associated with the activation of some oncogenic factors or the inhibition of tumor suppressor genes, including H3 K27M, MGMT, EGFRvIII, AxL, p-AxL, NUR77, and H3 Lys27. EGFRvIII is an autophosphorylated-form of EGFR and presents in half of glioblastomas with EGFR amplification [55]. Overexpression of EGFRvIII is viewed as a poor prognostic factor because of its role on tumor invasion and metastasis as well as angiogenesis [56]. Besides, AxL is the tyrosine kinase receptor and plays a role as an adhesion molecule of immunoglobulin [57]. The combination of AxL and growth arrest-specific gene 6 (Gas6) is responsible for tumor progression and migration [58]. Otherwise, the orphan receptor NUR77 is a transcription factor and regulates T cell apoptosis [59]. In the recent study, the inhibition of NUR77expression could induce glioma cell survival via down-regulating JNK pathway [60]. In addition, the results of cox regression analysis revealed PDGFRA and above oncologic factors are independent prognostic factors in gliomas. Recently, Kessler et al. have demonstrated the amplification of platelet-derived growth factor receptor alpha (PDGFRA) related to glioblastoma progression, especially in the methylated form of MGMT tumors [61]. Therefore, in this study, we firstly demonstrated the upregulation of PLP2 expression could be possibly related to AxL, p-AxL, EGFRvIII, PDGFRA, NUR77, H3 K27M, H3 Lys27, and MGMT genetic mutation, but the detailed mechanism needed more evidence.

4. Materials and Methods

4.1. Human Glioma Cell Lines and Lysate Preparation

Human glioma cell lines GBM8401, LN229, U87MG, and U118MG were purchased from the Cell Resource Center, Shanghai Institute of Biochemistry and Cell Biology at the Chinese Academy of Sciences (Shanghai, China). GBM8401, LN229, U87MG, and U118MG were maintained in Dulbecco’s modified Eagle’s medium (DMEM) containing 13.1 mM NaHCO3, 13 mM glucose, 2 mM glutamine, 10% fetal bovine serum (FBS), 100 U/mL penicillin, and 100 mg/mL streptomycin. Cultures were maintained in a humidified incubator with 5% CO2 at 37 °C. At the end of incubation, the cells were lysed by adding lysis buffer containing 10 mM Tris-HCl, 1 mM EGTA, 1 mM MgCl2, 1 mM sodium orthovanadate, 1 mM DTT, 0.1% mercaptoethanol, 0.5% Triton X-100, and protease inhibitor cocktails. Cell lysates were prepared from 2 × 10⁷ cells from the GBM8401, LN229, U87MG, and U118MG glioma cell lines. Lysate was used for Western blot analysis for PLP2, with β-actin as an internal control. In addition, normal brain cell lysates prepared from cerebral cortex were purchased from the company of Biocompare (MBS537208, San Francisco, CA, USA).

4.2. Western Blot Analysis

Polyclonal rabbit anti-human PLP2 antibody (1:5000, ab180131, Abcam, Cambridge, UK), and monoclonal mouse anti-β-actin antibody (1:5000, sc47778, San, St. Louista Cruz, TX, USA) were employed as primary antibodies in western blot analysis. The analysis was performed following the previously described protocol [38].

4.3. RNA Isolation and Real-Time Reverse Transcription-PCR

Total RNA was extracted (PAXGeneTM Blood RNA kit, PreAnalytix, Hombrechtikon, Switzerland) and residual genomic DNA was digested using the RNase-Free DNase set (Qiagen, Hilden, Germany). Single-stranded cDNA was prepared from 1 µg of total RNA using the Thermoscript RT-PCR system (Invitrogen, Carlsbad, CA, USA). The mRNA expression of selected genes was quantified using qRT-PCR. PCR reactions performed with a LightCyclerTM instrument using the Fast-StartTM DNA Master SYBR Green I real-time PCR kit (Roche Molecular Biochemicals, Mannheim, Germany). Thermocycling was performed with a final volume of 20 µL of 3 mM magnesium chloride (MgCl2), 0.5 µM each of the required primers, and 10 µL of the appropriate cDNA dilution. PCR was performed with an initial denaturation step of 10 min at 95 °C, followed by 40 cycles of a touch-down PCR protocol (10 s at 95 °C, 10 s annealing at 68–58 °C, and 16 s extension at 72 °C). Specific primers for GAPDH and PLP2 (list as follows) were purchased from Search-LC (Heidelberg, Germany). To confirm amplification specificity, the PCR products from each primer pair were subjected to a 58–98 °C temperature 0.1 °C/s) for melting curve analysis.
GAPDH: 5′-GCACCGTCAAGGCTGAGAAC-3′ (forward)
GAPDH: 5′-ATGGTGGTGAAGACGCCAGT-3′ (reverse)
PLP2: 5′-CTCATAGCGGCAATCCTCTACC-3′ (forward)
PLP2: 5′-CTGCGACGATTTTGGAGTGG-3′ (reverse)

4.4. Tissue Microarray Slide Preparation and Immunohistochemistry

Tissue microarray slides (No. GL2083a and GL2083b) were purchased from GenDiscovey Biotechnology Inc. According to the 2016 World Health Organization Classification of Tumors of the Central Nervous System [4], we performed some biomarkers to re-classify all included gliomas and detect the possibly PLP2-related factors. Initially, the Antigen retrieval was performed by heating (100 °C) each section for 30 min in a 0.01 mol/L sodium citrate buffer (pH 6.0). After 3 rinses (each for 5 min in phosphate buffered saline [PBS]), sections were incubated for 1 h at room temperature with a polyclonal rabbit anti-human PLP2 antibody (1:100, Biorbyt, Cambridge, UK), a monoclonal mouse anti-human IDH1 R132H antibody (1:100, Dianova, Hamburg, Germany), a polyclonal rabbit anti-human ATRX antibody (1:100, ATLAS, Stockholm, Sweden), a polyclonal rabbit anti-human Histone H3, K27M mutant (H3 K27M) antibody (1:100, Millipore, Bedford, CA, USA), a polyclonal rabbit anti-human Trimethyl-Histone H3, Lys27 (H3 K27me3) antibody (1:1000, Millipore, Bedford, CA, USA), a monoclonal mouse anti-human EGFR antibody (1:100, Thermo Fisher Scientific, San Jose, CA, USA), a monoclonal mouse anti-human EGFRvIII antibody (1:100, Absolute, Oxiford, UK), a polyclonal rabbit anti-human AXL antibody (1:50, Sigma-Aldrich, St Louis, MO, USA), a monoclonal mouse anti-human phosphor-Axl (Y779) antibody (1:50, R&D system, Minneapolis, MN, USA), a monoclonal mouse anti-human p53 antibody (1:100, DAKO, Carpinteria, CA, USA), a monoclonal mouse anti-human Neurofilament antibody (1:100, DAKO, Carpinteria, CA, USA), a monoclonal mouse anti-human platelet-derived growth factor-alpha (PDGFRA) antibody (1:100, Santa Cruz Biotechnology, Santa Cruz, TX, USA), a polyclonal rabbit anti-human neurofibromin (NF1) antibody (1:100, Abcam, Cambridge, UK), a polyclonal rabbit anti-human NUR77 antibody (1:100, Abcam, Cambridge, UK) diluted in PBS. After 3 washes (each for 5 min in PBS), the sections were incubated with biotin-labeled secondary immunoglobulin (1:100, DAKO, Glostrup, Denmark) for 1 h at room temperature. After 3 additional washes, peroxidase activity was developed with a 3-amino-9-ethylcarbazole substrate chromogen (DAKO, Glostrup, Denmark) at room temperature.

4.5. Assessment of Immunostain Scores in Gliomas

To assess PLP2 expression, all tumor cells with membranous and cytoplasmic staining were assessed. The intensity of cytoplasmic and membranous immunostain of tumor cells was scored on a scale of 0 (absence of staining), 1 (weak staining), 2 (moderate staining), or 3 (strong staining). Weak, moderate, and strong cytoplasmic staining were identified based on microscopy at a magnification of 40×, 20×, and 10× or 4× respectively. In addition, the percentage of tumor cells with cytoplasmic or nuclear staining was estimated. The percentage of cells (from 0 to 100) at each intensity was multiplied by the corresponding immunostaining intensity (from 0 to 3) to obtain an immunostaining score ranging from 0 to 300. For biomarker analysis, tumors with <5% cytoplasmic and nuclear staining were considered negatively stained. The immunohistochemical stains for PLP2 in normal colonic mucosa were selected as positive controls. Otherwise, the criteria of positive results of the other biomarkers except PLP2 depended on equal or more than 5% of tumor expression.

4.6. Statistical Analysis of PLP2 Expression

To detect the correlation of PLP2 IHC stain with WHO grades and glioma survival rates, statistical analysis was performed using the Pearson Product Moment method and Kaplan-Meier survival test. With a p value less than 0.05, correlation of tumor grades with PLP2 immunoscores was established. In addition, survival times were calculated from the date of surgery to the date of death. These cases are divided into 2 groups to compare the survival time with the PLP2 immunostain scores. Statistical analysis of survival time was done with the Kaplan-Meier survival test. Furthermore, we also performed univariate and multivariate analyses and cox proportional hazards regression to evaluate the possible independent factors related to PLP2 overexpression and prognosis.

4.7. Transfection of siPLP2 and siRNA-A into LN229 and GBM8401 Cell Lines and Cell Proliferation Assay

For transfection studies, PLP2 siRNA (siPLP2) and siRNA-A were purchased from Ambion (assay ID, PM10206 and AM10206). The role of siRNA-A was used as the negative control (NC). LN229 and GBM8401 cells were transfected with 100 µM siPLP2 and NC in the 6 cm dish using Lipofectamine 2000 transfection reagent (Invitrogen, Carlsbad, CA, USA). Cells from each group were seeded at 5 × 10⁴ in 12 well plates and incubated overnight at 37 °C Then, to collect cells, 500 µL 2% FBS DMEM medium and 100 µL trypsin were added to each well. Furthermore, 500 µL of 2% FBS DMEM medium was added to the well to ensure complete cell collection. A mixture of 10 µL of LN229 and GBM8401 cells and 10 µL trypan blue in a 96-well plate was injected into the Neubauer chamber. The cells were count at the 4 corners of a Neubauer chamber with a microscope at 24, 48, 72, and 96 h after transfection. The previously described experimental procedure for the cell proliferation assay of each cell line was repeated 3 times. Finally, western-blot analysis was performed to detect cell cycle checkpoint expressions (cyclin B, cyclin E, CDK1, and CDK2), cell signaling pathways (ERK, phosphorylated-ERK, p38, and phosphorylated-p38), and cell matrix interaction (MMP2 and MMP9) on gliomas with siPLP2 and NC transfection.

4.8. Wound Healing Assay

First, 2 × 10⁵ LN229 and GBM8401 cells were seeded in a 12-well plate overnight. Then, glioma cells were scratched with 200 µL tips 48 h after transfection of NC or siPLP2. PBS was used to wash the cells, and the scratched area was photographed with a microscope at 0 h. A mixture of 1 mL DMEM medium and 2% FBS was slowly added into the well to maintain the cell growth. After a 16 h incubation at 37 °C, the medium was suctioned from the well and photographed with a microscope.

4.9. Cell Invasion Assay

Cells were seeded at 2 × 10⁵ cells/well in a 6-well plate for 24 h and transfected with NC or siPLP2. Trypsin was used to detach the transfected cells after 72 h. Then the cells were suspended in serum-free DMEM medium and adjusted to a density of 2 × 10⁴ cells. Transfected cells (500 µL) were added to the upper chamber and 10% FBS DMEM medium (500 µL) was added to the lower chamber. After a 24 h incubation, the membrane of the chamber was fixed with formalin, staining with crystal violet, and photographed with a microscope.

4.10. Soft Agar Colony Formation Assay

LN229 glioma cells with shPLP2 transfection were trypsinized and re-suspended in 1.5 mL 0.35% agarose and poured onto a 2 mL 0.5% agarose bed in 35 mm tissue culture dishes, then incubated overnight at 37 °C. After 3 weeks, all cultured cells were stained with 200 µL of crystal violet solution per well. After washing and drying, photographs of wells were taken using an imager and colonies were counted using image J software.

5. Conclusions

In conclusion, we indicated that PLP2 might have a “Yin-Yang” effect. PLP2 could prevent normal neuronal cell apoptosis and oxidative stress apoptosis, but unfortunately, PLP2 increases glioma aggressive behavior. Although the precise mechanism of PLP2 in gliomas remains unclear, PLP2 might be a potential target to prolong overall survival, delay disease progression, and suppress tumor infiltration.

Author Contributions

W.-C.T. designed this study and performed IHC staining and overall survival rates statistical analysis; D.-Y.H. supply glioma cell lines; Y.-H.C. assist Western-blot analysis and Real-time reverse transcription-PCR, cell migration and invasion test, cell colonies assay and prepared the manuscript.

Funding

This study was supported by grants from the Tri-Service General Hospital, TSGH-C107-190, TSGH-C107-075, TSGH-C105-073, and National Defense Medical Center, MAB-105-098 Taiwan, R. O. C.

Conflicts of Interest

The authors declare no conflict of interest.

References

  1. Nowosielski, M.; Galldiks, N.; Iglseder, S.; Kickingereder, P.; von Deimling, A.; Bendszus, M.; Wick, W.; Sahm, F. Diagnostic challenges in meningioma. Neuro Oncol. 2017, 19, 1588–1598. [Google Scholar] [CrossRef] [PubMed]
  2. Karim, A.B.; Maat, B.; Hatlevoll, R.; Menten, J.; Rutten, E.H.; Thomas, D.G.; Mascarenhas, F.; Horiot, J.C.; Parvinen, L.M.; van Reijn, M.; et al. A randomized trial on dose-response in radiation therapy of low-grade cerebral glioma: European Organization for Research and Treatment of Cancer (EORTC) Study 22844. Int. J. Radiat. Oncol. Biol. Phys. 1996, 36, 549–556. [Google Scholar] [CrossRef]
  3. Van den Bent, M.J.; Afra, D.; de Witte, O.; Ben Hassel, M.; Schraub, S.; Hoang-Xuan, K.; Malmström, P.O.; Collette, L.; Piérart, M.; Mirimanoff, R.; et al. Long-term efficacy of early versus delayed radiotherapy for low-grade astrocytoma and oligodendroglioma in adults: The EORTC 22845 randomised trial. Lancet 2005, 366, 985–990. [Google Scholar] [CrossRef]
  4. Louis, D.N.; Ohgaki, H.; Weistler, O.D.; Cavenee, W.K. World Health Organization Classification of Tumours of the Central Nervous System, 5th ed.; IARC Press: Lyon, France, 2016; pp. 16–122. [Google Scholar]
  5. Gu, J.; Liu, Y.; Kyritsis, A.P.; Bondy, M.L. Molecular epidemiology of primary brain tumors. Neurotherapeutics 2009, 6, 427–435. [Google Scholar] [CrossRef] [PubMed] [Green Version]
  6. Tsai, W.C.; Lee, H.S.; Lin, C.K.; Chen, A.; Nieh, S.; Ma, H.I. The association of osteopontin and LMX1A expression with World Health Organization grade in meningiomas and gliomas. Histopathology 2012, 61, 844–856. [Google Scholar] [CrossRef] [PubMed]
  7. Lukas, R.V.; Nicholas, M.K. Update in the treatment of high-grade Gliomas. Neurol. Clin. 2013, 31, 847–867. [Google Scholar] [CrossRef] [PubMed]
  8. Binello, E.; Green, S.; Germano, I.M. Radiosurgery for high-grade glioma. Surg. Neurol. Int. 2012, 3, S118–S126. [Google Scholar] [PubMed]
  9. Mandell, L.R.; Walker, R.W.; Steinherz, P.; Fuks, Z. Reduced incidence of the somnolence syndrome in leukemic children with steroid coverage during prophylactic cranial radiation therapy. Results of a pilot study. Cancer 1989, 63, 1975–1978. [Google Scholar] [CrossRef]
  10. Lee, A.W.; Foo, W.; Chappell, R.; Fowler, J.F.; Sze, W.M.; Poon, Y.F.; Law, S.C.; Ng, S.H.; O, S.K.; Tung, S.Y.; et al. Effect of time, dose, and fractionation on temporal lobe necrosis following radiotherapy for nasopharyngeal carcinoma. Int. J. Radiat. Oncol. Biol. Phys. 1998, 40, 35–42. [Google Scholar] [CrossRef]
  11. Rajasekhar, A.; George, T.J., Jr. Gemcitabine-induced reversible posterior leukoencephalopathy syndrome: A case report and review of the literature. Oncologist 2007, 12, 1332–1335. [Google Scholar] [CrossRef] [PubMed]
  12. Onujiogu, N.; Lengyel, E.; Yamada, S.D. Reversible posterior leukoencephalopathy syndrome following intravenous paclitaxel and intraperitoneal cisplatin chemotherapy for fallopian tube cancer. Gynecol. Oncol. 2008, 111, 537–539. [Google Scholar] [CrossRef] [PubMed]
  13. Sierra del Rio, M.; Rousseau, A.; Soussain, C.; Ricard, D.; Hoang-Xuan, K. Primary CNS lymphoma in immunocompetent patients. Oncologist 2009, 14, 526–539. [Google Scholar] [CrossRef] [PubMed]
  14. Noronha, V.; Berliner, N.; Ballen, K.K.; Lacy, J.; Kracher, J.; Baehring, J.; Henson, J.W. Treatment-related myelodysplasia/AML in a patient with a history of breast cancer and an oligodendroglioma treated with temozolomide: Case study and review of the literature. Neuro Oncol. 2006, 8, 280–283. [Google Scholar] [CrossRef] [PubMed]
  15. Stupp, R.; Mason, W.P.; van den Bent, M.J.; Weller, M.; Fisher, B.; Taphoorn, M.J.; Belanger, K.; Brandes, A.A.; Marosi, C.; Bogdahn, U.; et al. Radiotherapy plus concomitant and adjuvant temozolomide for glioblastoma. N. Engl. J. Med. 2005, 352, 987–996. [Google Scholar] [CrossRef] [PubMed]
  16. Hegi, M.E.; Diserens, A.C.; Gorlia, T.; Hamou, M.F.; de Tribolet, N.; Weller, M.; Kros, J.M.; Hainfellner, J.A.; Mason, W.; Mariani, L.; et al. MGMT gene silencing and benefit from temozolomide in glioblastoma. N. Engl. J. Med. 2005, 352, 997–1003. [Google Scholar] [CrossRef] [PubMed]
  17. Yan, H.; Parsons, D.W.; Jin, G.; McLendon, R.; Rasheed, B.A.; Yuan, W.; Kos, I.; Batinic-Haberle, I.; Jones, S.; Riggins, G.J.; et al. IDH1 and IDH2 mutations in gliomas. N. Engl. J. Med. 2009, 360, 765–773. [Google Scholar] [CrossRef] [PubMed]
  18. Metellus, P.; Coulibaly, B.; Colin, C.; de Paula, A.M.; Vasiljevic, A.; Taieb, D.; Barlier, A.; Boisselier, B.; Mokhtari, K.; Wang, X.W.; et al. Absence of IDH mutation identifies a novel radiologic and molecular subtype of WHO grade II gliomas with dismal prognosis. Acta Neuropathol. 2010, 120, 719–729. [Google Scholar] [CrossRef] [PubMed]
  19. Sadighi, Z.; Slopis, J. Pilocytic astrocytoma: A disease with evolving molecular heterogeneity. J. Child. Neurol. 2013, 28, 625–632. [Google Scholar] [CrossRef] [PubMed]
  20. Horbinski, C. To BRAF or not to BRAF: Is that even a question anymore? J. Neuropathol. Exp. Neurol. 2013, 72, 2–7. [Google Scholar] [CrossRef] [PubMed]
  21. Jiao, Y.; Killela, P.J.; Reitman, Z.J.; Rasheed, A.B.; Heaphy, C.M.; de Wilde, R.F.; Rodriguez, F.J.; Rosemberg, S.; Oba-Shinjo, S.M.; Nagahashi Marie, S.K.; et al. Frequent ATRX, CIC, FUBP1 and IDH1 mutations refine the classification of malignant gliomas. Oncotarget 2012, 3, 709–722. [Google Scholar] [CrossRef] [PubMed] [Green Version]
  22. Bettegowda, C.; Agrawal, N.; Jiao, Y.; Sausen, M.; Wood, L.D.; Hruban, R.H.; Rodriguez, F.J.; Cahill, D.P.; McLendon, R.; Riggins, G.; et al. Mutations in CIC and FUBP1 contribute to human oligodendroglioma. Science 2011, 333, 1453–1455. [Google Scholar] [CrossRef] [PubMed]
  23. Yip, S.; Butterfield, Y.S.; Morozova, O.; Chittaranjan, S.; Blough, M.D.; An, J.; Birol, I.; Chesnelong, C.; Chiu, R.; Chuah, E.; et al. Concurrent CIC mutations, IDH mutations, and 1p/19q loss distinguish oligodendrogliomas from other cancers. J. Pathol. 2012, 226, 7–16. [Google Scholar] [CrossRef] [PubMed]
  24. Wellenreuther, R.; Waha, A.; Vogel, Y.; Lenartz, D.; Schramm, J.; Wiestler, O.D.; von Deimling, A. Quantitative analysis of neurofibromatosis type 2 gene transcripts in meningiomas supports the concept of distinct molecular variants. Lab. Investig. 1997, 77, 601–606. [Google Scholar] [PubMed]
  25. Rouleau, G.A.; Merel, P.; Lutchman, M.; Sanson, M.; Zucman, J.; Marineau, C.; Hoang-Xuan, K.; Demczuk, S.; Desmaze, C.; Plougastel, B.; et al. Alteration in a new gene encoding a putative membrane-organizing protein causes neuro-fibromatosis type 2. Nature 1993, 363, 515–521. [Google Scholar] [CrossRef] [PubMed]
  26. Strickland, M.R.; Gill, C.M.; Nayyar, N.; D’Andrea, M.R.; Thiede, C.; Juratli, T.A.; Schackert, G.; Borger, D.R.; Santagata, S.; Frosch, M.P.; et al. Targeted sequencing of SMO and AKT1 in anterior skull base meningiomas. J. Neurosurg. 2017, 127, 438–444. [Google Scholar] [CrossRef] [PubMed]
  27. Clark, V.E.; Erson-Omay, E.Z.; Serin, A.; Yin, J.; Cotney, J.; Ozduman, K.; Avşar, T.; Li, J.; Murray, P.B.; Henegariu, O.; et al. Genomic analysis of non-NF2 meningiomas reveals mutations in TRAF7, KLF4, AKT1, and SMO. Science 2013, 339, 1077–1080. [Google Scholar] [CrossRef] [PubMed]
  28. Abedalthagafi, M.S.; Bi, W.L.; Merrill, P.H.; Gibson, W.J.; Rose, M.F.; Du, Z.; Francis, J.M.; Du, R.; Dunn, I.F.; Ligon, A.H.; et al. ARID1A and TERT promoter mutations in dedifferentiated meningioma. Cancer Genet. 2015, 208, 345–350. [Google Scholar] [CrossRef] [PubMed] [Green Version]
  29. Xu, W.; Yang, H.; Liu, Y.; Yang, Y.; Wang, P.; Kim, S.H.; Ito, S.; Yang, C.; Wang, P.; Xiao, M.T.; et al. Oncometabolite 2-hydroxyglutarate is a competitive inhibitor of α-ketoglutarate-dependent dioxygenases. Cancer Cell 2011, 19, 17–30. [Google Scholar] [CrossRef] [PubMed]
  30. Solomon, D.A.; Wood, M.D.; Tihan, T.; Bollen, A.W.; Gupta, N.; Phillips, J.J.; Perry, A. Diffuse Midline Gliomas with Histone H3-K27M Mutation: A Series of 47 Cases Assessing the Spectrum of Morphologic Variation and Associated Genetic Alterations. Brain Pathol. 2016, 26, 569–580. [Google Scholar] [CrossRef] [PubMed]
  31. Sturm, D.; Witt, H.; Hovestadt, V.; Khuong-Quang, D.A.; Jones, D.T.; Konermann, C.; Pfaff, E.; Tönjes, M.; Sill, M.; Bender, S.; et al. Hotspot mutations in H3F3A and IDH1 define distinct epigenetic and biological subgroups of glioblastoma. Cancer Cell 2012, 22, 425–437. [Google Scholar] [CrossRef] [PubMed]
  32. Louis, D.N.; Perry, A.; Reifenberger, G.; von Deimling, A.; Figarella-Branger, D.; Cavenee, W.K.; Ohgaki, H.; Wiestler, O.D.; Kleihues, P.; Ellison, D.W. The 2016 World Health Organization classification of tumors of the central nervous system: A summary. Acta Neuropathol. 2016, 131, 803–820. [Google Scholar] [CrossRef] [PubMed]
  33. Network, T.C. Comprehensive genomic characterization defines human glioblastoma genes and core pathways. Nature 2013, 494, 506. [Google Scholar] [CrossRef] [PubMed]
  34. Fan, Q.W.; Weiss, W.A. Targeting the RTK-PI3K-mTOR axis in malignant glioma: Overcoming resistance. Curr. Top. Microbiol. Immunol. 2010, 347, 279–296. [Google Scholar] [PubMed]
  35. Fresno Vara, J.A.; Casado, E.; de Castro, J.; Cejas, P.; Belda-Iniesta, C.; González-Barón, M. PI3K/Akt signalling pathway and cancer. Cancer Treat Rev. 2004, 30, 193–204. [Google Scholar] [CrossRef] [PubMed]
  36. Zhang, L.; Wang, T.; Valle, D. Reduced PLP2 expression increases ER-stress-induced neuronal apoptosis and risk for adverse neurological outcomes after hypoxia ischemia injury. Hum. Mol. Genet. 2015, 24, 7221–7226. [Google Scholar] [CrossRef] [PubMed] [Green Version]
  37. Sonoda, Y.; Warita, M.; Suzuki, T.; Ozawa, H.; Fukuda, Y.; Funakoshi-Tago, M.; Kasahara, T. Proteolipid protein 2 is associated with melanoma metastasis. Oncol. Rep. 2010, 23, 371–376. [Google Scholar] [CrossRef] [PubMed]
  38. Longo, A.; Librizzi, M.; Luparello, C. Effect of transfection with PLP2 antisense oligonucleotides on gene expression of cadmium-treated MDA-MB231 breast cancer cells. Anal. Bioanal. Chem. 2013, 405, 1893–1901. [Google Scholar] [CrossRef] [PubMed] [Green Version]
  39. Zimmerman, J.W.; Pennison, M.J.; Brezovich, I.; Yi, N.; Yang, C.T.; Ramaker, R.; Absher, D.; Myers, R.M.; Kuster, N.; Costa, F.P.; et al. Cancer cell proliferation is inhibited by specific modulation frequencies. Br. J. Cancer 2012, 106, 307–313. [Google Scholar] [CrossRef] [PubMed]
  40. Lee, S.M.; Shin, H.; Jang, S.W.; Shim, J.J.; Song, I.S.; Son, K.N.; Hwang, J.; Shin, Y.H.; Kim, H.H.; Lee, C.K.; et al. PLP2/A4 interacts with CCR1 and stimulates migration of CCR1-expressing HOS cells. Biochem. Biophys. Res. Commun. 2004, 324, 768–772. [Google Scholar] [CrossRef] [PubMed]
  41. Zhu, H.; Miao, M.H.; Ji, X.Q.; Xue, J.; Shao, X.J. miR-664 negatively regulates PLP2 and promotes cell proliferation and invasion in T-cell acute lymphoblastic leukaemia. Biochem. Biophys. Res. Commun. 2015, 459, 340–345. [Google Scholar] [CrossRef] [PubMed]
  42. Tsai, W.C.; Hueng, D.Y.; Lin, C.R.; Yang, T.C.; Gao, H.W. Nrf2 Expressions Correlate with WHO Grades in Gliomas and Meningiomas. Int. J. Mol. Sci. 2016, 17, 722. [Google Scholar] [CrossRef] [PubMed]
  43. Mori, S.; Chang, J.T.; Andrechek, E.R.; Matsumura, N.; Baba, T.; Yao, G.; Kim, J.W.; Gatza, M.; Murphy, S.; Nevins, J.R. Anchorage-independent cell growth signature identifies tumors with metastatic potential. Oncogene 2009, 28, 2796–2805. [Google Scholar] [CrossRef] [PubMed] [Green Version]
  44. Ding, Z.; Jian, S.; Peng, X.; Liu, Y.; Wang, J.; Zheng, L.; Ou, C.; Wang, Y.; Zeng, W.; Zhou, M. Loss of MiR-664 Expression Enhances Cutaneous Malignant Melanoma Proliferation by Upregulating PLP2. Medicine (Baltimore) 2015, 94, e1327. [Google Scholar] [CrossRef] [PubMed]
  45. Bradham, C.; McClay, D.R. p38 MAPK in development and cancer. Cell Cycle 2006, 5, 824–828. [Google Scholar] [CrossRef] [PubMed]
  46. Ge, B.; Gram, H.; Di Padova, F.; Huang, B.; New, L.; Ulevitch, R.J.; Luo, Y.; Han, J. MAPKK-independent activation of p38alpha mediated by TAB1-dependent autophosphorylation of p38alpha. Science 2002, 295, 1291–1294. [Google Scholar] [CrossRef] [PubMed]
  47. Johnson, G.L.; Lapadat, R. Mitogen-activated protein kinase pathways mediated by ERK, JNK, and p38 protein kinases. Science 2002, 298, 1911–1912. [Google Scholar] [CrossRef] [PubMed]
  48. Roux, P.P.; Blenis, J. ERK and p38 MAPK-activated protein kinases: A family of protein kinases with diverse biological functions. Microbiol. Mol. Biol. Rev. 2004, 68, 320–344. [Google Scholar] [CrossRef] [PubMed]
  49. Burger, P.C.; Shibata, T.; Kleihues, P. The use of the monoclonal antibody Ki-67 in the identification of proliferating cells: Application to surgical neuropathology. Am. J. Surg. Pathol. 1986, 10, 611–617. [Google Scholar] [CrossRef] [PubMed]
  50. Deckert, M.; Reifenberger, G.; Wechsler, W. Determination of the proliferative potential of human brain tumors using the monoclonal antibody Ki-67. J. Cancer Res. Clin. Oncol. 1989, 115, 179–188. [Google Scholar] [CrossRef] [PubMed]
  51. Makino, K.; Nakamura, H.; Hide, T.; Yano, S.; Kuroda, J.; Takahashi, Y.; Iyama, K.; Kuratsu, J. Usefulness of immunohistochemical expression analysis of metabolic-related molecules in differentiating between intracranial neoplastic and non-neoplastic lesions. Brain Tumor Pathol. 2013, 30, 144–150. [Google Scholar] [CrossRef] [PubMed]
  52. Rivera-Zengotita, M.; Yachnis, A.T. Gliosis versus glioma: Don’t grade until you know. Adv. Anat. Pathol. 2012, 19, 239–249. [Google Scholar] [CrossRef] [PubMed]
  53. Capper, D.; Sahm, F.; Hartmann, C.; Meyermann, R.; von Deimling, A.; Schittenhelm, J. Application of mutant IDH1 antibody to differentiate diffuse glioma from nonneoplastic central nervous system lesions and therapy-induced changes. Am. J. Surg. Pathol. 2010, 34, 1199–1204. [Google Scholar] [CrossRef] [PubMed]
  54. Camelo-Piragua, S.; Jansen, M.; Ganguly, A.; Kim, J.C.; Louis, D.N.; Nutt, C.L. Mutant IDH1-specific immunohistochemistry distinguishes diffuse astrocytoma from astrocytosis. Acta Neuropathol. 2010, 119, 509–511. [Google Scholar] [CrossRef] [PubMed] [Green Version]
  55. Mao, H.; Lebrun, D.G.; Yang, J.; Zhu, V.F.; Li, M. Deregulated signaling pathways in glioblastoma multiforme: Molecular mechanisms and therapeutic targets. Cancer Investig. 2012, 30, 48–56. [Google Scholar] [CrossRef] [PubMed]
  56. Liu, Z.; Han, L.; Dong, Y.; Tan, Y.; Li, Y.; Zhao, M.; Xie, H.; Ju, H.; Wang, H.; Zhao, Y.; et al. EGFRvIII/integrin β3 interaction in hypoxic and vitronectinenriching microenvironment promote GBM progression and metastasis. Oncotarget 2016, 7, 4680–4694. [Google Scholar] [PubMed]
  57. Stoeckli, E.T.; Landmesser, L.T. Axonin-1, Nr-CAM, and Ng-CAM play different roles in the in vivo guidance of chick commissural neurons. Neuron 1995, 14, 1165–1179. [Google Scholar] [CrossRef]
  58. Manfioletti, G.; Brancolini, C.; Avanzi, G.; Schneider, C. The protein encoded by a growth arrest-specific gene (gas6) is a new member of the vitamin K-dependent proteins related to protein S, a negative coregulator in the blood coagulation cascade. Mol. Cell Biol. 1993, 13, 4976–4985. [Google Scholar] [CrossRef] [PubMed]
  59. Liang, B.; Song, X.; Liu, G.; Li, R.; Xie, J.; Xiao, L.; Du, M.; Zhang, Q.; Xu, X.; Gan, X.; et al. Involvement of TR3/Nur77 translocation to the endoplasmic reticulum in ER stress-induced apoptosis. Exp. Cell Res. 2007, 313, 2833–2844. [Google Scholar] [CrossRef] [PubMed]
  60. Chang, L.F.; Lin, P.C.; Ho, L.I.; Liu, P.Y.; Wu, W.C.; Chiang, I.P.; Chang, H.W.; Lin, S.Z.; Harn, Y.C.; Harn, H.J.; et al. Overexpression of the orphan receptor Nur77 and its translocation induced by PCH4 may inhibit malignant glioma cell growth and induce cell apoptosis. J. Surg. Oncol. 2011, 103, 442–450. [Google Scholar] [CrossRef] [PubMed]
  61. Kessler, T.; Sahm, F.; Sadik, A.; Stichel, D.; Hertenstein, A.; Reifenberger, G.; Zacher, A.; Sabel, M.; Tabatabai, G.; Steinbach, J.; et al. Molecular differences in IDH wildtype glioblastoma according to MGMT promoter methylation. Neuro Oncol. 2018, 20, 367–379. [Google Scholar] [CrossRef] [PubMed]
Figure 1. Expression analysis of proteolipid protein 2 (PLP2) in glioma cell lines and normal brain tissues. (A) Analysis of PLP2 protein expression in GBM8401, LN229, U87, and U118MG glioma cell lines and normal brain tissue protein lysates. (B) Analysis of PLP2 protein expression in GBM8401, LN229, U87, and U118MG glioma and the human fetal glial cell line SVG p12 glial cell lines. The densitometric analysis revealed a higher percentage of peak of PLP2 (17 kDA) in all glioma cell lines than in normal brain tissue protein lysates and SVG p12 glial cell line. (** p < 0.01; *** p < 0.001).
Ijms 19 03353 g001
Figure 2. Using quantitative RT-PCR to detect PLP2 mRNA expression in GBM8401, LN229, U87, and U118MG glioma cell lines and normal brain tissue cDNA.β-actin served as a loading control. Data are representative of three independent experiments. (*p < 0.05; **p < 0.01; *** p < 0.001).
Ijms 19 03353 g002
Figure 3. Hematoxylin and eosin staining of (A) normal brain tissue, (B) pilocytic astrocytoma, (C) diffuse astrocytoma, (D) anaplastic astrocytoma, and (E) glioblastome multiforme. IHC analysis of PLP2 in (F) normal brain tissue, (G) pilocytic astrocytoma, (H) diffuse astrocytoma, (I) anaplastic astrocytoma, and (J) glioblastoma. (Original magnification × 400).
Ijms 19 03353 g003
Figure 4. Relationships between overall survival rate and PLP2 immunostain scores in gliomas. Survival rates were analyzed using the Kaplan–Meier survival test (* p < 0.05).
Ijms 19 03353 g004
Figure 5. Analysis of (A) LN229 and (B) GBM8401 glioma cells proliferative ability after using small interfering RNA (siPLP2) to knockdown PLP2 expression. (* p < 0.05; ** p < 0.01); Using western-blot analysis to detect the cell-cycle checkpoints expression in (C) LN229 and (D) GBM8401 glioma cell lines after siPLP2 administration (** p < 0.01; *** p < 0.001).
Ijms 19 03353 g005
Figure 6. (A) Influence of the possible signaling pathway in the LN229 glioma cell line after siPLP2 and siRNA-A (NC)transfection. p-p38 and p-ERK showed a significant decrease after knockdown PLP2 expression. (*** p < 0.001); (B) Assessment of tumor migration ability in GBM8401 and LN229 glioma cell lines after siPLP2 and NC transfection. Glioma cells with a PLP2 knockdown revealed slow tumor migration after 16 h. (*** p < 0.001).
Ijms 19 03353 g006
Figure 7. (A) The cell invasive ability in LN229 glioma cell line with siPLP2 transfection was lower than NC transfection after 24 h incubation; (B) Similarly, siPLP2 transfected LN229 glioma cells revealed lesser cell colonies then NC transfected tumors. (** p < 0.01; *** p < 0.001).
Ijms 19 03353 g007
Figure 8. The detection of tumor cells and matrix interaction analyzed by metalloproteinase 2 (MMP2) and metalloproteinase 9 (MMP9) expression between the groups of siPLP2 and NC transfected (A) LN229 and (B) GBM8401 glioma cells. Compared to NC transfection, both of above glioma cells with siPLP2 transfection revealed the inhibition of MMP9 expression. In addition, the suppression of MMP2 by down-regulation of PLP2 is identified in GBM8401 glioma cell line, but not in LN229. The densitometric analysis revealed a lower percentage of peaks on MMP2 (72 kDA) and MMP9 (92 kDA) in LN229 (siPLP2) than in LN229 (control). Similarly, lower percentage of peak on MMP9 (92 kDA) by densitometric analysis is identified in GBM8401 (siPLP2) than in GBM8401 (control) (* p < 0.05; ** p < 0.01; *** p < 0.001).
Ijms 19 03353 g008
Table 1. The correlation of PLP2 immunostain score with WHO grades of gliomas.
Average
Intensity
Average
% Tumor
Average
Score
Correlation *
Normal Brain Tissue0.5510.9510.95
Classification of Gliomas
Pilocytic astrocytoma155No correlation
(p = 0.206)
Diffuse astrocytoma, IDH-mutant000
Diffuse astrocytoma, IDH-WT1.3135.3859.23
Anaplastic astrocytoma, IDH-mutant0.676.676.67
Anaplastic astrocytoma, IDH-WT1.4336.4382.14
Glioblastoma, IDH-mutant1.23346
Glioblastoma, IDH-WT1.5341.3279.41
Oligodendroglioma, NOS0.331010No correlation
(p = 0.488)
Anaplastic oligodendroglioma, NOS0.62323
Diffuse midline glioma, H3 K27M-mutant1.4744.6787.33
WHO Grades of Gliomas
WHO grade I155Positive correlation
(p = 0.039 *)
WHO grade II1.0628.8247.06
WHO grade III12647.33
WHO grade IV1.4841.4878.52
* The correlation was analyzed by Pearson Product Method Correlation test.
Table 2. Univariate and multivariate analysis of risk factors associated with PLP2 expression.
VariableTotalUnivariate AnalysisMultivariate Analysis
OR (95% CI)p ValueOR (95% CI)p Value
Sex
Male471
Female291.18 (1.10–1.22)0.5071.28 (1.24–1.30)0.279
Age
<50361
≥50402.38 (1.59–3.87)0.011 #2.38 (1.59–3.87)0.244
IDH1 R132H
Negative631
Positive130.46 (0.09–0.79)0.0650.46 (0.09–0.80)0.069
ATRX
Preserve391
Loss of expression370.83 (0.76–0.86)0.4500.81 (0.74–0.85)0.114
H3K27M
Negative671
Positive91.80 (1.44–2.00)0.045 #1.68 (1.33–1.88)0.029 *
MGMT
Preserved431
Loss of expression331.30 (1.17–1.63)0.3011.36 (1.22–1.71)<0.001 *
EGFR
Negative691
Positive71.89 (1.42–2.16)0.0531.77 (1.31–2.03)0.268
EGFRvIII
Negative581
Positive182.26 (2.14–2.49)0.001 #2.29 (2.14–2.59)0.013 *
P53
Negative361
Overexpression401.59 (1.39–2.14)0.0661.43 (1.27–1.87)0.050
Neurofilament
Negative591
Positive171.17 (0.89–1.33)0.5821.16 (0.89–1.31)0.091
NF1
Negative421
Positive341.29 (1.24–1.40)0.3021.18 (1.15–1.22)0.002 *
AxL
Negative291
Positive472.21 (1.64–4.99)0.006 #2.07 (1.50–4.67)<0.001 *
p-AxL
Negative221
Positive540.97 (0.80–1.53)0.9230.97 (0.81–1.52)0.004 *
NUR77
Negative271
Positive491.71 (1.35–3.10)0.0571.80 (1.42–3.28)0.010 *
H3Lys27
Preserved 671
Loss of expression91.59 (1.47–1.84)0.021 #1.58 (1.43–1.80)<0.001 *
PDGFRA
Negative51
Positive711.24 (0.41–1.76)0.6341.16 (0.30–1.66)0.442
#p < 0.05, * p < 0.05.
Table 3. Multivariate Analysis for Overall Survival in human brain gliomas.
Multivariate Analysis
VariableHazard Ratio95% Confidence Intervalp Value
Sex (male/female)1.710.73–3.990.214
Age (<50/>50)2.901.28–6.560.010 *
PLP2 (Negative/Positive)1.010.99–1.030.030 *
IDH1 R132H (Negative/Positive)2.690.87–8.300.086
ATRX (Preserve/Loss)0.280.12–0.650.003 *
H3K27M (Negative/Positive)2.200.56–8.760.262
MGMT (Unmethylated/ Methylated)0.470.17–1.290.142
EGFR (Negative/Positive)2.690.63–11.490.181
EGFRvIII (Negative/Positive)0.900.39–2.060.805
P53 (Negative/Overexpression)0.790.36–1.750.557
Neurofilament (Negative/Positive)0.700.29–1.690.423
NF1 (Negative/Positive)1.010.40–2.540.996
AxL (Negative/Positive)4.031.32–12.270.014 *
p-AxL (Negative/Positive)2.390.77–7.420.130
NUR77 (Negative/Positive)0.350.14–0.850.021 *
H3Lys27 (Negative/Positive)0.450.11–1.940.284
PDGFRA (Negative/Positive)14.0783.27–60.65<0.001 *
* p < 0.05.

