1. Introduction
Head and neck squamous cell carcinoma (HNSCC) frequently invades the facial bones [
1], and this invasion promotes HNSCC bone pain (HNSCC-BP) [
2]. Cancer pain contributes to increased mortality and is a prognostic factor of poor clinical outcomes [
3]. HNSCC-BP often lowers a patient’s quality of life and leads to a disruption of speech and swallowing function; it thus poses a significant challenge to the quality of life of patients presenting with HNSCC-BP. The pathophysiology of bone pain associated with HNSCC is poorly understood, and HNSCC-BP is frequently inadequately treated.
Cancer cells have been demonstrated to secrete significant amounts of growth factors that can promote osteoclastogenesis [
4,
5]. Protons (H
+) are well known as a pain inducer [
6]. In a bone cancer microenvironment, cancer cells and osteoclasts secrete protons through the proton pump, creating an acidic microenvironment [
7]. This environment breaks the bone matrix and activates pH-sensitive sensory neurons (SNs), eliciting bone pain [
8]. It is thus critical to evaluate new approaches to the treatment of bone destruction and bone pain in advanced HNSCC. Monocarboxylate transporter 4 (MCT4), also known as SLC16A3, is a member of the MCT family. MCT4 is one the key transporters involved in the regulation of lactate and proton release from cancer cells [
9]. MCT4 also plays a critical role in anaerobic glycolysis, known as the Warburg effect [
10].
In normal cells, glucose is taken as an energy source. Glucose is converted to pyruvate in glycolysis pathway. Pyruvate is source of the mitochondrial oxidative glycolysis for ATP generation. In cancer cells glucose uptake and aerobic glycolysis is increased compared with normal cells [
11]. A greater amount of glucose is diverted to biosynthetic pathways to fuel cell proliferation by anaerobic glycolysis. In this pathway, pyruvate is preferentially shunted to lactate, resulting in increased lactic acid production from cancer cells [
12].
Lactic acid is considered an energy source in the central nervous system [
13]. The effect of lactic acid on sensory nerve activation in HNSCC bone invasion is not yet known. We conducted the present study to evaluate the effect of MCT4 expression on HNSCC-BP and sensory neuron activation in bone. Our findings provide the first evidence that MCT4 has a role in HNSCC growth in bone, lactic acid release, and HNSCC-BP.
3. Discussion
MCTs are part of a 14-member family of transporter proteins [
15]. The first four isoforms (MCT1–4) have a function in transport proton-linked carbohydrates such as pyruvate, lactate, and ketone bodies [
16]. MCT4 contributes to the maintenance of intracellular pH within the physiological range. The maintenance of pH preserves metabolism, protein synthesis, and signaling processes.
MCT4 mediates the lactic acid efflux from cells that are dependent on glycolysis for their ATP production. MCT4 expression is limited to skeletal muscle, red blood cells, brain tissue and tumor cells that are highly glycolytic tissues [
17,
18]. The metabolic feature of malignant tumor is anaerobic glycolysis which produces huge amount of lactic acid. Cancer cells discharge lactic acid to evade intracellular acidification [
10]. Thus, it seems reasonable that malignant tumor cells expressed MCTs.
Our present findings indicate that SAS cells express plasma membrane MCT4, which acidifies the extracellular environment by releasing protons and directly contributes to the activation of sensory neurons to induce HNSCC-BP.
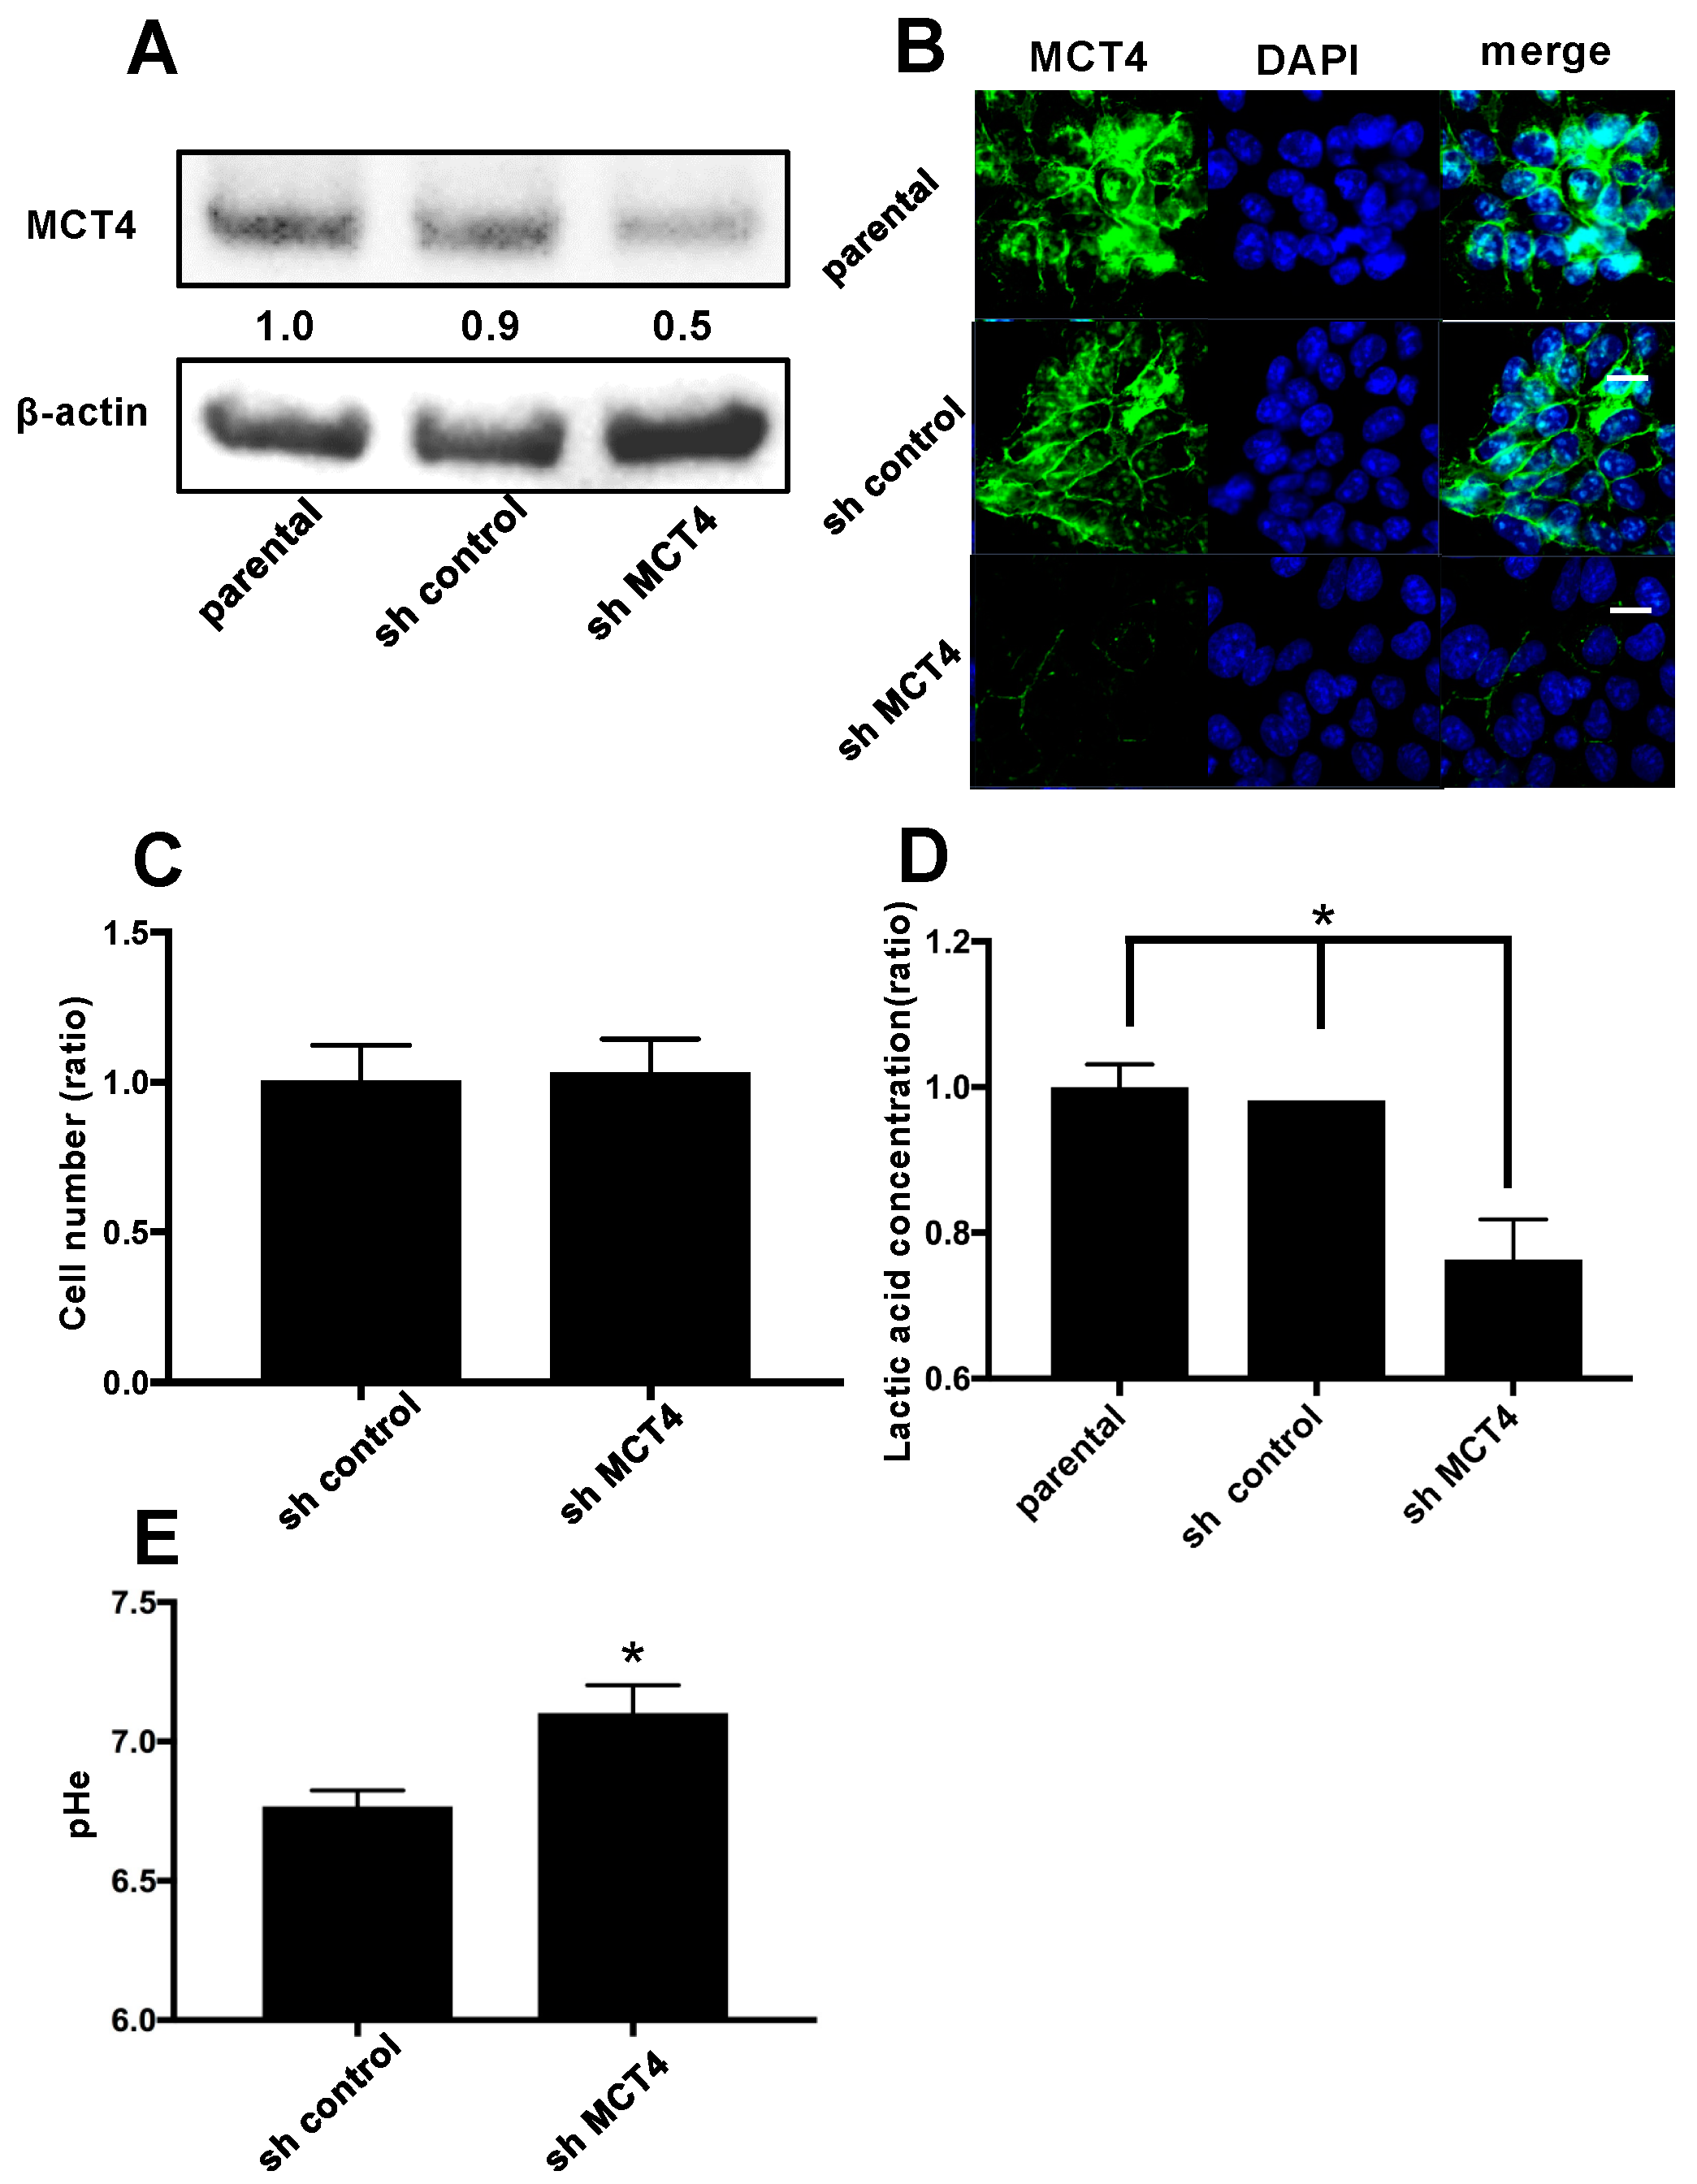
Our experiments revealed that tissues from patients with HNSCC expressed high levels of MCT4 compared to normal oral tissue. We thus evaluated the expression of MCT4 in several HNSCC cell lines and a positive control breast cancer cell line, MCF-7. We then investigated the effect of MCT4 on the lactic acid efflux in the HNSCC cell lines. We created MCT4-knockdown HNSCC SAS cells with shRNA transduction methods, and we observed that a 50% MCT4 protein reduction in the cell membrane decreased the lactic efflux in SAS cells, even though MCT4 expression did not affect cell proliferation. It was reported that MCT4 reduction decreased cancer cell proliferation in vitro [
19], and in another study, HNSCC cells highly expressed the B subunit of lactate dehydrogenase enzyme (LDH-B), which converts lactate to pyruvate in aerobic glycolysis [
20]. This aerobic metabolism may promote sh-MCT4 SAS cell growth in the same way as in parental SAS cells under in vitro culture conditions.
The best-studied roles of lactic acid are those in the central nervous system and neuron energy [
21]. The effect of lactic acid on sensory neurons is unclear. We demonstrated in an earlier study that vacuolar-ATPase expressed in tumor cells decreased the tissue pH and stimulated both neurite sprouting and cancer bone pain [
14]. The pKa value of lactic acid is 3.86, and thus lactic acid efflux decreases the pH [
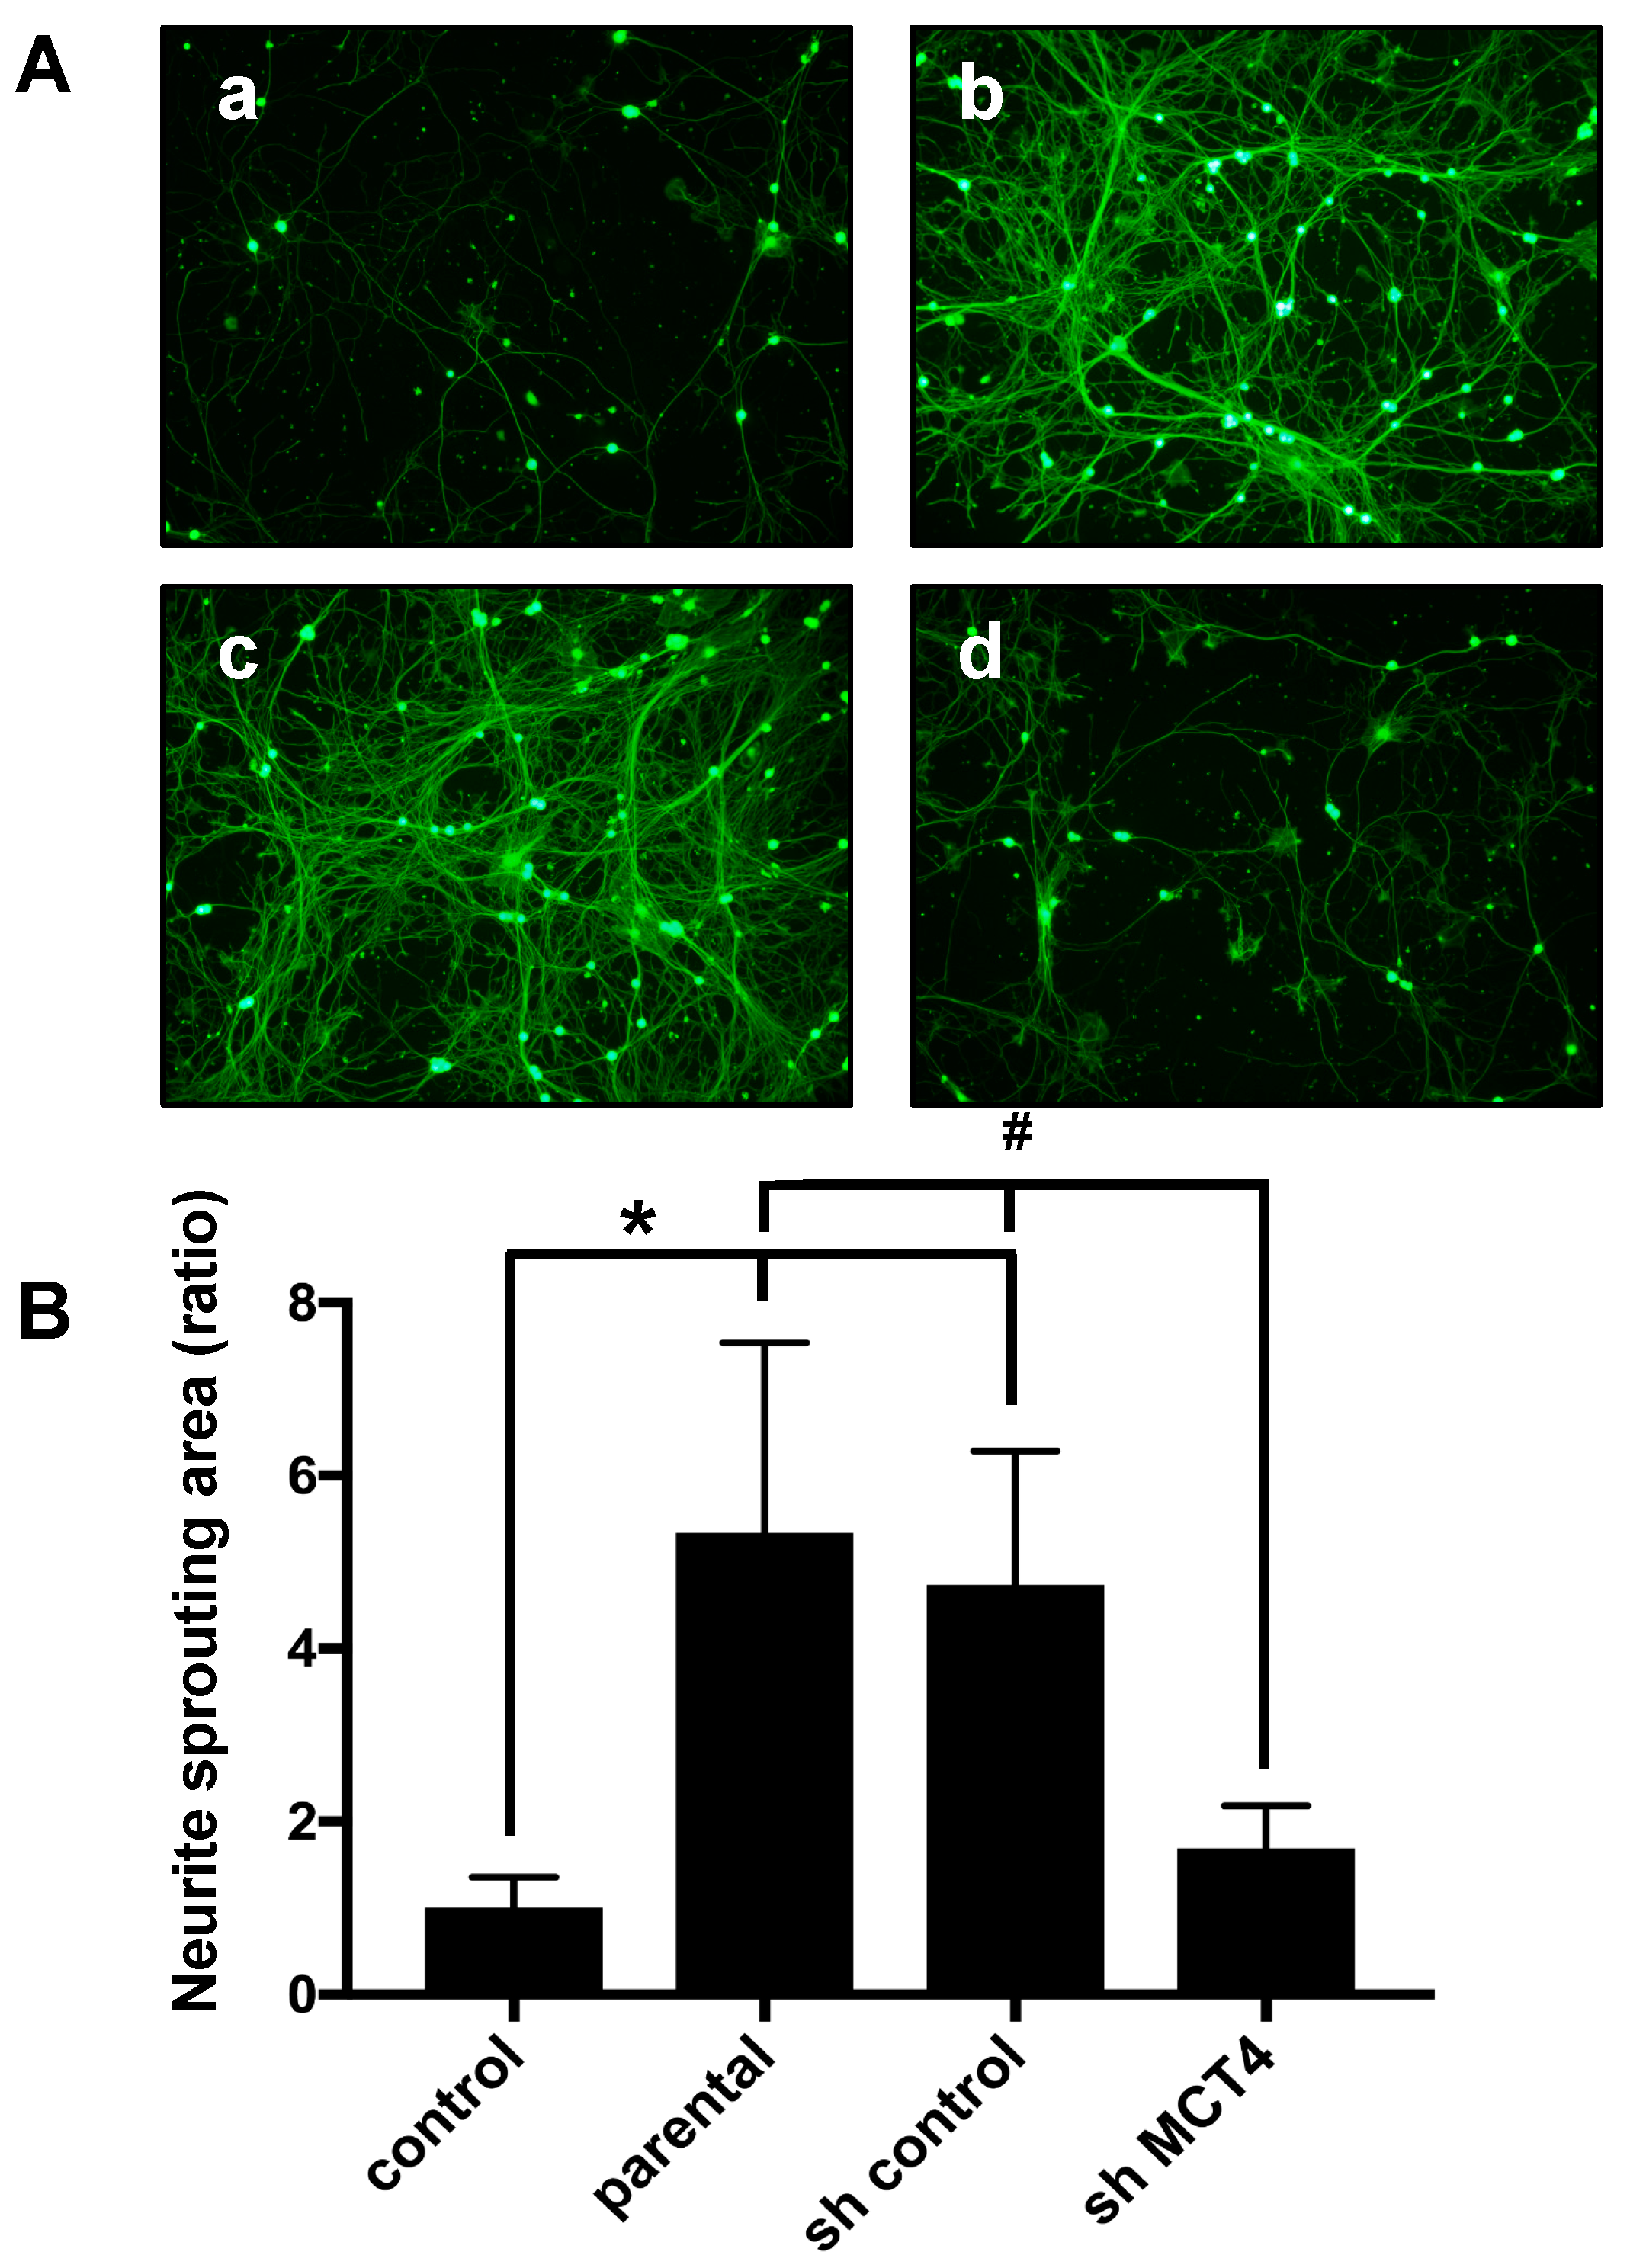
22]. Our present findings demonstrate that: (1) sensory neuron fiber sprouting was significantly increased in co-culture with an HNSCC cell line, and (2) MCT4 knockdown in HNSCC cells decreased the fiber sprouting. These data support our hypothesis that lactic acid also provides nutrition and induces sensory neuron axis sprouting.
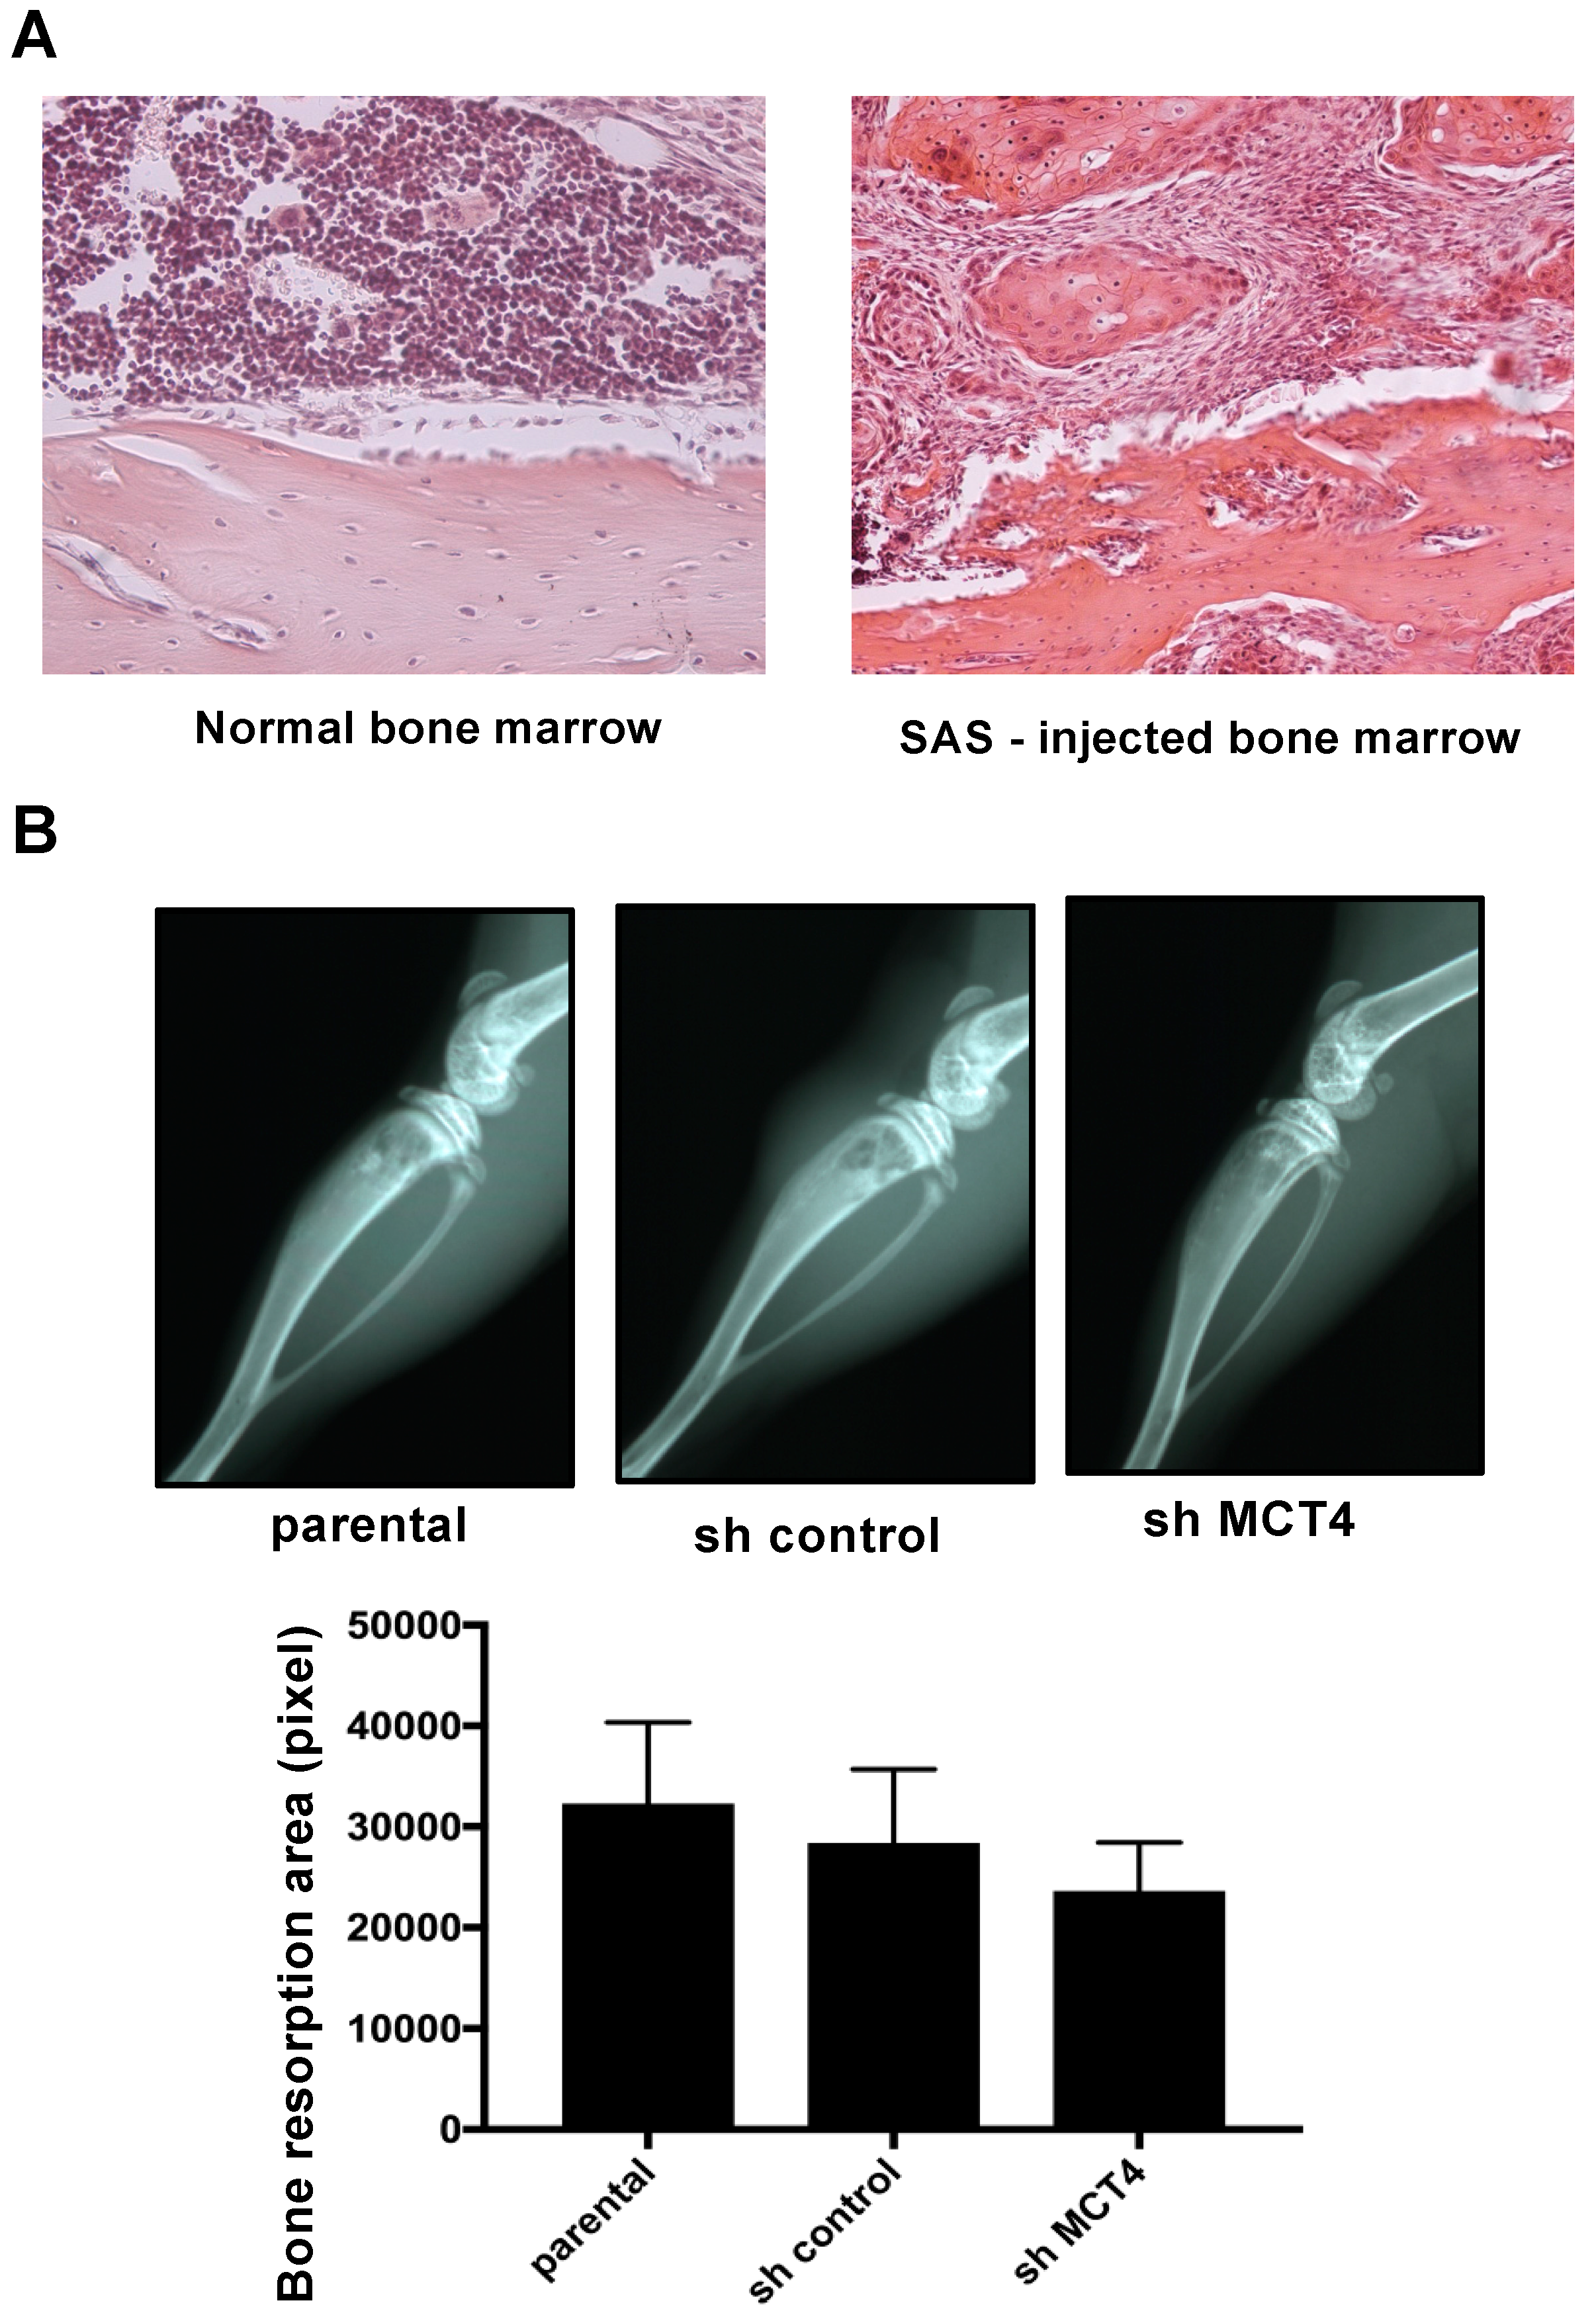
Here, the mice that were intratibially injected with SAS cells developed osteolytic lesions as seen by X-ray (
Figure 4B). These lesions showed an aggressive proliferation of SAS cells in the bone marrow (
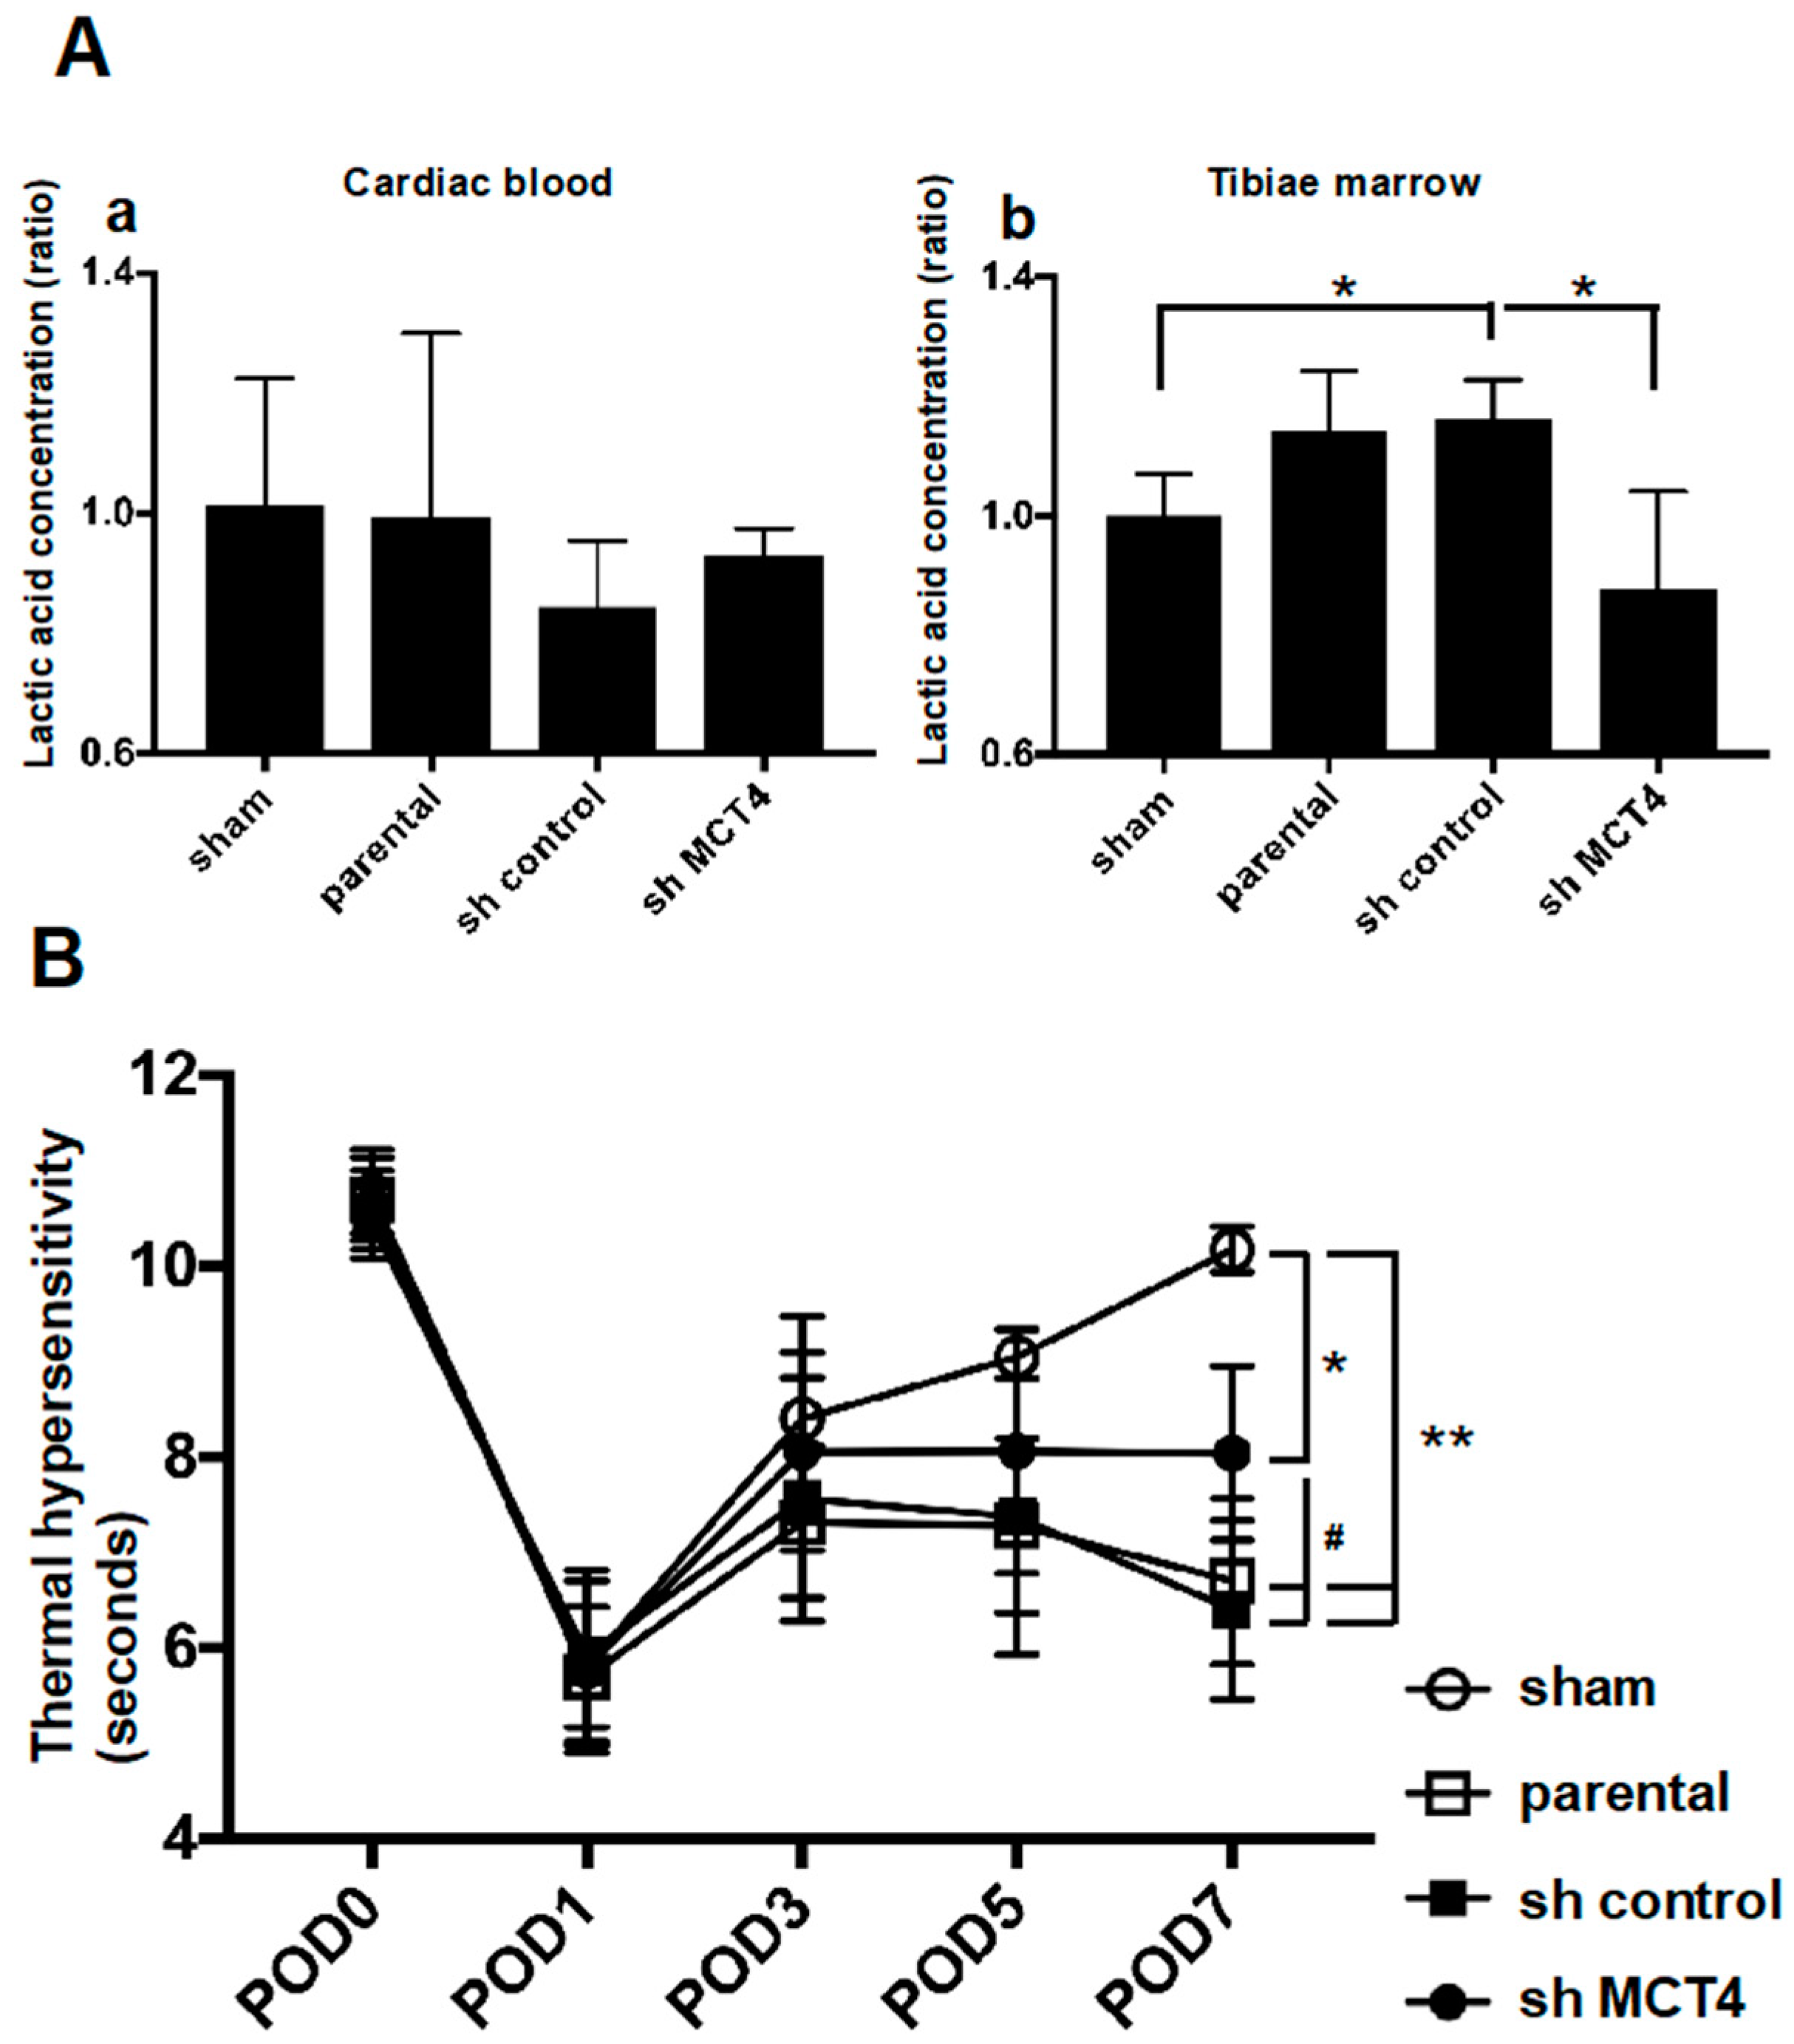
Figure 4A). The right legs of the mice harboring SAS cells initially displayed thermal hypersensitivity, and these pain behaviors progressed in parallel with the bone destruction, demonstrating that HNSCC-BP is associated with local SAS colonization (
Figure 4 and
Figure 5B).
It has been indicated that neurons promote cancer progression [
23]. In the present study, the reduction of MCT4 did not affect cell proliferation. However, MCT4 knockdown decreased HNSCC-BP in mice. These results may have been caused by a lactic acid-induced activation of neurons and other bone micro-environmental cells that promoted HNSCC-BP.
Our results showed that MCT4 reduction inhibited the lactic acid concentration in both bone marrow and HNSCC-BP. Yoneda demonstrated that an acidic micro-environment created by osteoclasts and cancer in bone induces sensory excitation and evokes bone pain [
24]. The results of our present investigation demonstrated that MCT4 expression in HNSCC cells and lactic acid efflux are key factors for HNSCC-BP.
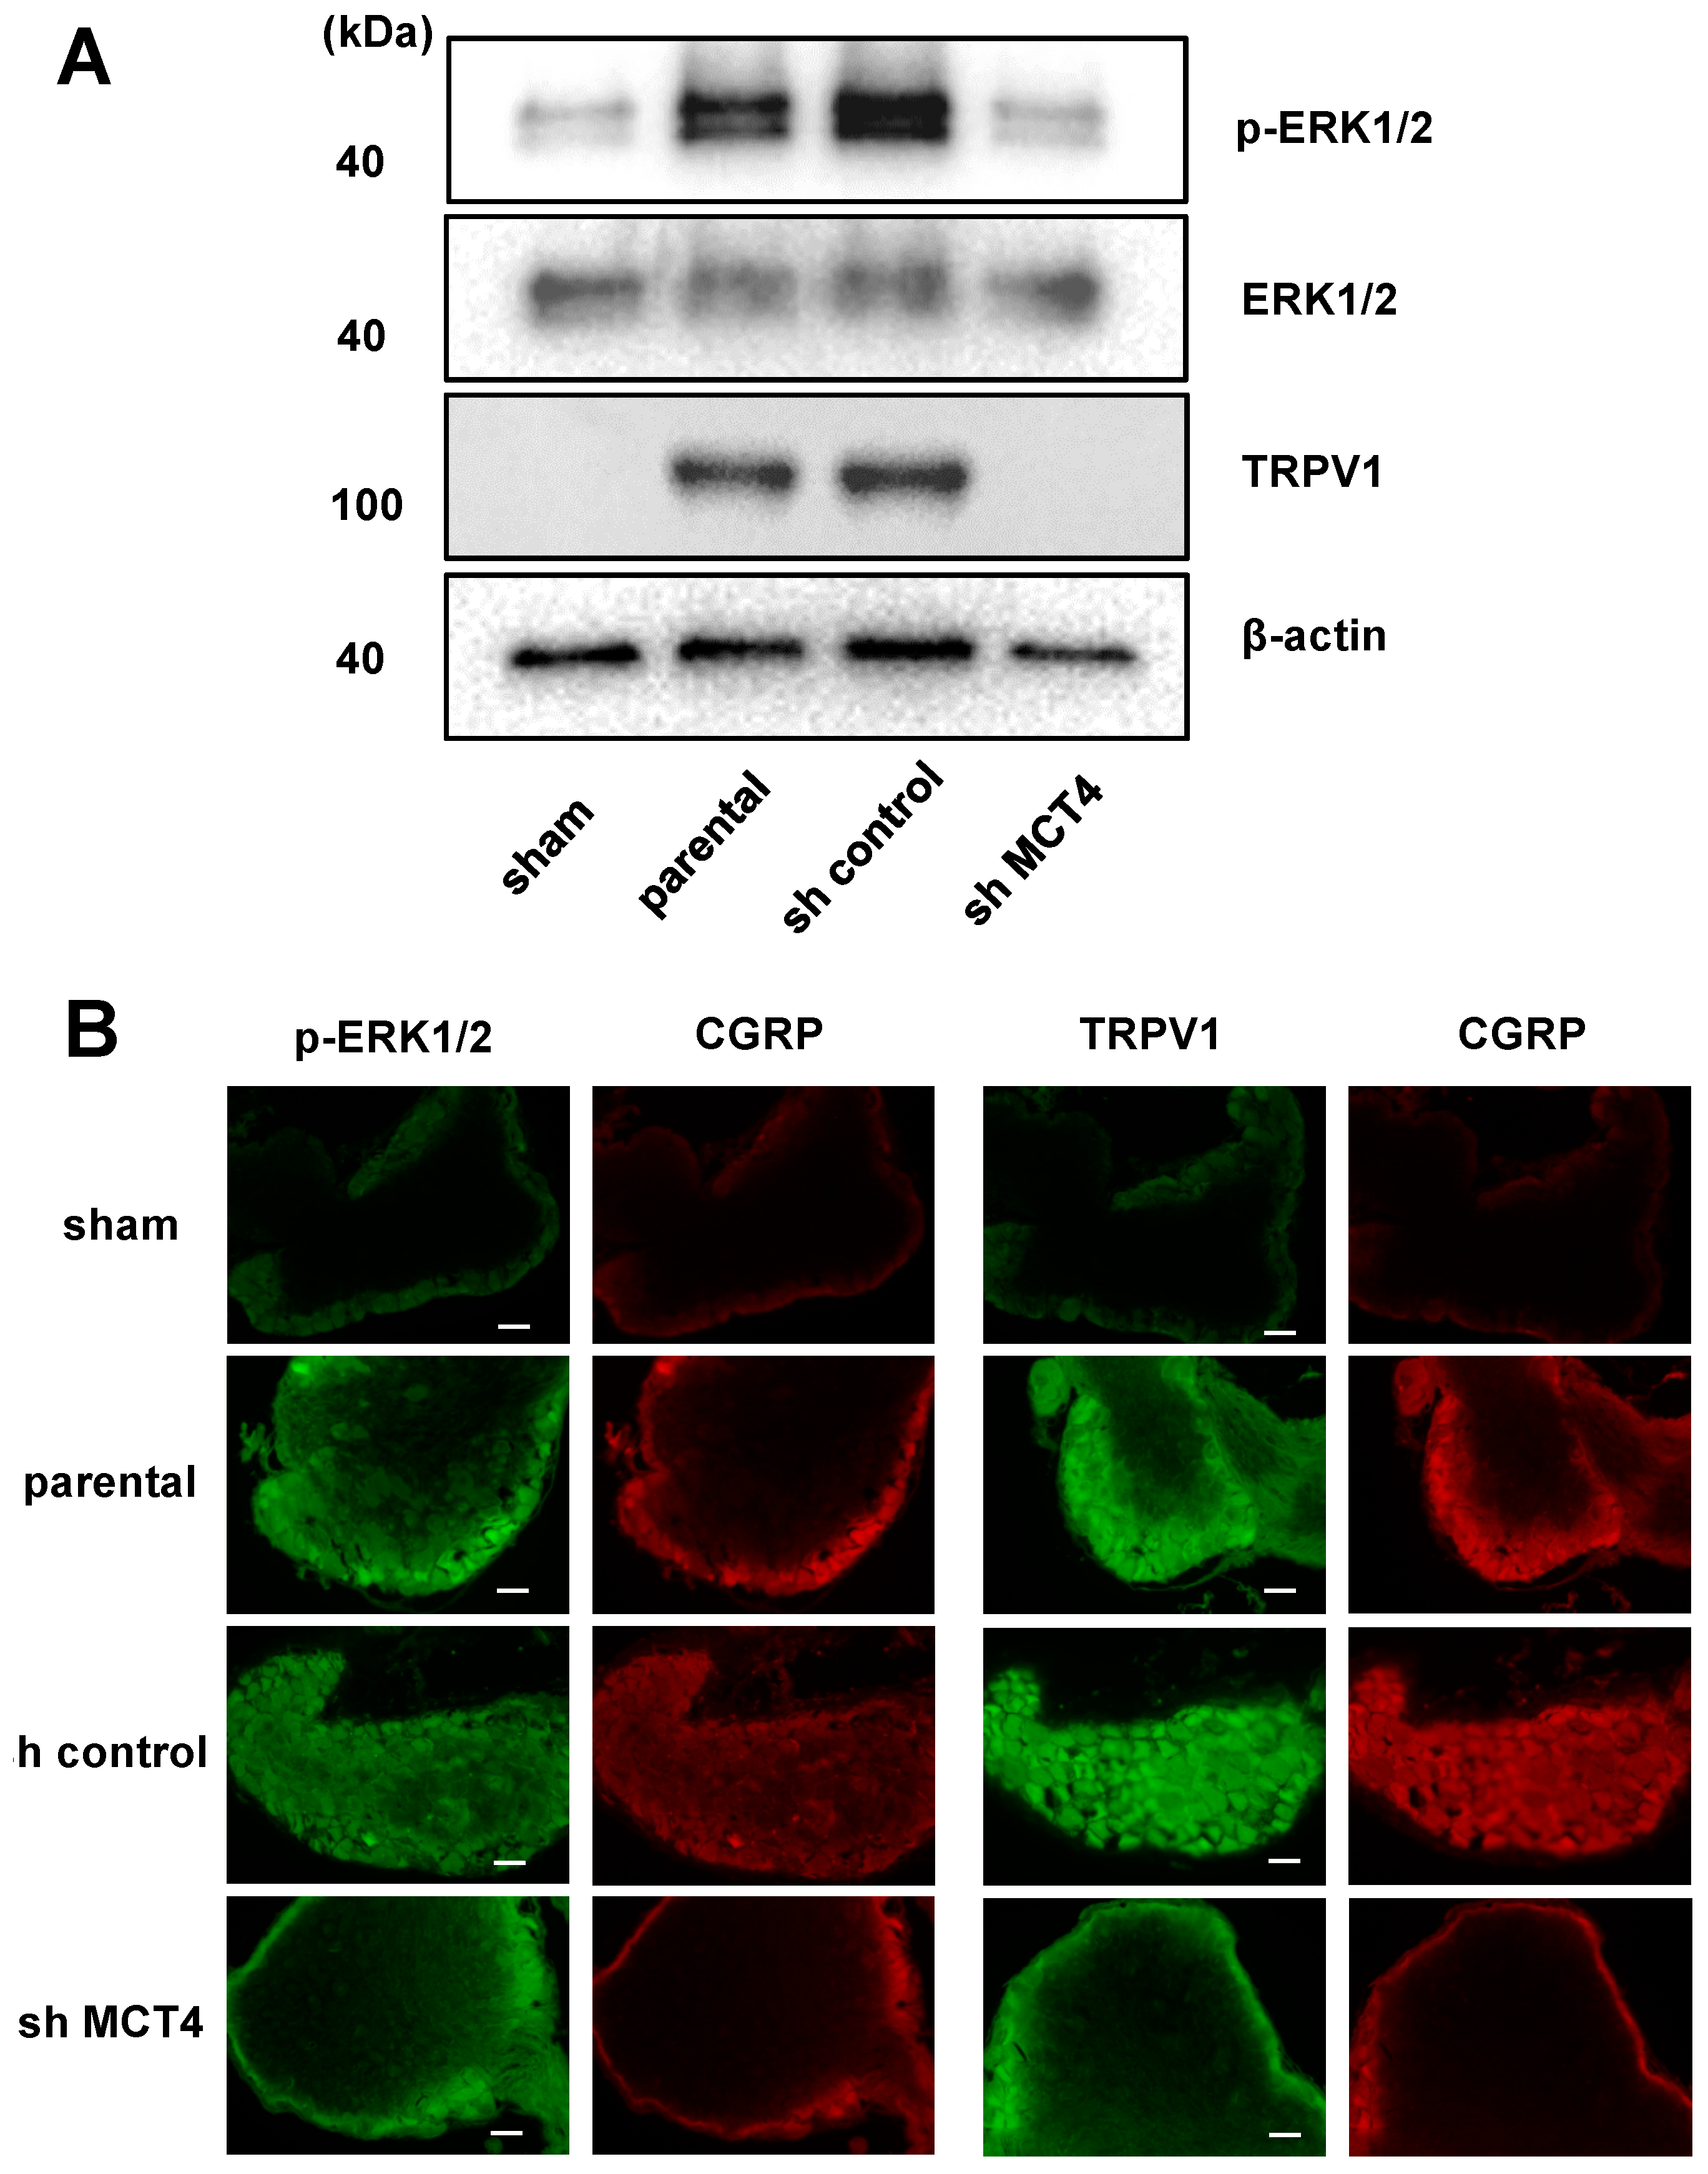
Neuron cell excitation by protons was caused by an acid-sensing receptor. TRPV1 and ASIC3 are well-known acid-sensing receptors that are expressed in sensory neuron fibers. Wakabayashi showed that the disruption of the TRPV1 gene attenuated cancer-induced bone pain [
6]. We propose that the low pH of HNSCC-colonized bone induces the activation of ASIC3, TRPV1, or both on pH-sensitive sensory neurons to induce HNSCC-BP. Our present data demonstrate that MCT4-derived lactic acid increased and activated the acid-sensing receptor TRPV1.
Recent studies reported that the tissue damage and inflammation caused by cancer greatly decreases the thresholds of TRPV1 and ASIC3 for sensing noxious stimulation [
14]. We therefore speculate that lactic acid from cancer cells promotes HNSCC-BP in a vicious cycle via acid-sensing receptor activation and decreased thresholds for sensing noxious stimuli.
In conclusion, our present findings demonstrate that the creation of acidic extracellular bone micro-environments by HNSCC via lactic acid production through plasma membrane MCT4 and the responses of the sensory neurons innervating bone to the acidic microenvironment via TRPV1 are critical contributors to the pathophysiology of HNSCC-BP. Targeting these pathways may provide effective mechanism-based therapies for the control of HNSCC bone pain, which is currently undertreated.
4. Materials and Methods
4.1. Reagents
Puromycin dihydrochloride (cat. No. #sc-108071), control shRNA plasmid-A (#sc108060), MCT4 shRNA plasmid (h2) (#sc-45892-SH) and anti-MCT4 antibody (anti-rabbit, monoclonal, #sc-50329) were purchased from Santa Cruz Biotechnology (Dallas, TX). Anti-phospho-p44/42 MAPK antibody (p-ERK; anti-rabbit, monoclonal, #4370), anti-p44/42 MAPK antibody (ERK; anti-rabbit, monoclonal, #4695), horseradish peroxidase (HRP)-conjugated IgG antibody (goat anti-rabbit, monoclonal, #7074), HRP-conjugated IgG antibody (goat anti-mouse, monoclonal, #7076), Alexa Fluor 488-conjugated IgG (H+L) F(ab′)2 fragment (goat anti-rabbit, monoclonal, #4412), and Alexa Fluor 488-conjugated IgG (H+L) F(ab′)2 fragment (goat anti-mouse, monoclonal, #4408) were purchased from Cell Signaling Technology (Danvers, MA). Anti-VR1 antibody (TRPV1; anti-mouse, monoclonal, #ab203103), anti-CGRP antibody (anti-goat, polyclonal, #ab36001) and Alexa Fluor 647-conjugated IgG H&L (donkey anti-goat, monoclonal, #ab150135) were purchased from Abcam (Cambridge, MA, USA).
4.2. Cell Lines and Culture Conditions
The human oral squamous cell carcinoma cell lines SAS (#JCRB0260), HSC-2 (#JCRB0622), HSC-3 (#JCRB0623), HSC-4 (#JCRB0624), OSC-19 (#JCRB0198), and MCF-7(#JCRB0134) were obtained from the Human Science Resources Bank (Osaka, Japan). They were cultured in Dulbecco’s modified Eagle’s medium (DMEM) (Thermo Fisher Scientific, Waltham, MA, USA) supplemented with 10% heat-inactivated fetal bovine serum (FBS) and 1% penicillin–streptomycin in an atmosphere of 5% CO2 at 37 °C.
Rat DRG cells were obtained from Cell Applications (San Diego, CA, USA) and cultured according to the supplier’s instructions.
Cells (1 × 10⁵/96-well) were cultured for 48 h and extracellular pH (pHe) was measured by using a FiveEasy pH meter (Metter Toled) immediately after removal from the CO2 incubator.
4.3. Immunohistochemical Analysis
We analyzed the expression of MCT4 in head and neck cancer tissue and a normal tissue microarray (#HN803d; US Biomax, Rockville, MD, USA). The antigen was activated by cooking in a citric acid solution. For the immunohistochemical analysis, the specimens were incubated with anti-MCT4 antibody (1:100) overnight at 4 °C. The slides were then treated with a streptavidin–biotin complex (EnVision System labeled polymer, HRP; Dako, Carpinteria, CA, USA) for 60 min at a dilution of 1:100. The immunoreaction was visualized with the use of a DAB substrate–chromogen solution (Dako Cytomation Liquid DAB Substrate Chromogen System, Dako, Carpinteria, CA, USA). Quantification was performed using a BZ-X800 Analyzer hybrid cell count system (Keyence, Osaka, Japan), and the relative integrated density was calculated.
4.4. Analysis of MCT4 Expression in SAS Cells
SAS cells were transfected with 1 µg control short hairpin (sh) RNA or MCT4 shRNA with the use of 4D-Nucleofector™ (Lonza, Tokyo, Japan). Two days later, the cells were cultured in DMEM plus 10% FBS for 5 days in the presence of 2 µg/mL puromycin dihydrochloride for the selection of cells that stably expressed the shRNAs.
MCT4 shRNA plasmid is a pool of three different shRNAs. The hairpin sequence is as follows: GATCCGTCTACCTCTTCAGCTTCTTTCAAGAGAAGAAGCTGAAGAGGTAGACTTTTT. The corresponding siRNA sequences are 1: Sense: GUCUACCUCUUCAGCUUCUtt. Antisense: AGAAGCUGAAGAGGUAGACtt. The corresponding siRNA sequences are 2: Sense: GUCUACAUGUACGUGUUCAtt. Antisense: UGAACACGUACAUGUAGACtt. The corresponding siRNA sequences are 3: Sense: GUCAUUCCAGAGUGGAUCUtt. Antisense: AGAUCCACUCUGGAAUGACtt. All sequences are provided in 5′ → 3′ orientation.
4.5. Cell Proliferation Assay
SAS cells were plated in six-well plates at 1 × 10⁵ cells per well. Their number was counted 72 h later with a TC20 automated cell counter (Bio-Rad, Hercules, CA, USA).
4.6. Western Blot Analysis
The cell lysates were mixed with 4× Laemmli sample buffer (Bio-Rad) and heated at 95 °C for 5 min. The samples were electrophoresed in 4–12% SDS-PAGE gels, and the proteins were transferred onto PVDF membranes (Bio-Rad). The membranes were incubated with primary and secondary antibodies according to the ECL chemiluminescence protocol (RPN2109; Amersham Biosciences, Buckinghamshire, UK) to detect secondary antibody binding. Antibodies against MCT4 (1:1000), p-Erk (1:1000), Erk (1:1000) and TRPV1 (1:1000) were used as a primary antibody. HRP-conjugated anti-rabbit antibody (1:2000) and HRP-conjugated anti-mouse antibody (1:2000) were used as the secondary antibody. A BZ-X microscope (Keyence) was used for the analysis of western blots.
4.7. DRG Fiber Sprouting Assay
DRG cells were plated in 48-well plates (1 × 10⁴/well) with neuron growth media for 24 h. Subsequently, the DRG cells were co-cultured with SAS, short hairpin (sh) control SAS, and sh-MCT4 SAS in the transwell chamber for 5 days. DRG fibers were visualized with calcein acetoxymethyl (AM) staining. DRG neuron fibers were observed with an Olympus microscope (IX71; Tokyo, Japan).
4.8. Animal Experiments
We established a mouse model of bone invasion by human oral squamous cell carcinoma in 5-week-old female BALB/c nude mice (each group, n = 5; total, n = 20; mean body weight, 19.5 g; Charles River Laboratories, Yokohama, Japan) by the inoculation of 1 × 10⁵ SAS cells (parental, sh-control, sh-MCT4) with a 29-gauge needle into the bone marrow space of the right tibial edge of the mouse under anesthesia with 0.4 mg/kg of medetomidine, 4.0 mg/kg of midazolam and 5.0 mg/kg of butorphanol. The sham procedure was only a puncture with a 29-gauage needle into the right tibial cavity.
Thermal hyperalgesia and allodynia were evaluated every other day from POD 1–7 in each group of mice, respectively [
25]. The mice were individually placed in a cage with a glass floor, over a moveable infrared light source. The light source was positioned under the center of the hind paw, and the time (seconds) from stimulus onset to withdrawal was recorded. On POD 8, the mice underwent cardiac blood collection under anesthesia, followed by cervical dislocation. Ipsilateral DRGs and the right tibia were then harvested. All of the animal experimental protocols were approved by the Ethics Review Committee for Animal Experimentation of the Okayama University Graduate School of Medicine and Dentistry (OKU-2013108, 19/Feb/2016. OKU-2018510, 7/May/2018).
4.9. In Vivo Analysis of HNSCC-BP
We evaluated the thermal hypersensitivity and allodynia in the mice with the use of a Hargreaves apparatus (Plantar Test, #37370; Ugo Basile, Varese, Italy), which measures an animal’s withdrawal latency from a radiant heat source directed at the proximal half of the plantar surface of the ipsilateral hind paw. Prior to this examination, the mice were allowed to acclimate for 30 min to the testing environment, which consisted of translucent plastic-walled individual chambers and a 3-mm thick glass bottom. A radiant heat source, consisting of an adjustable infrared lamp and a built-in stopwatch accurate to 0.1 second, was used to measure the paw withdrawal latency. The test was performed every other day from POD 1–7 in each group.
4.10. In Vivo Radiography and Measurement of Osteolytic Lesion Areas
Osteolytic bone destruction was assessed on radiographs. The bones were placed against films (22 × 27 cm; Fuji Industrial Film FR: Fuji Photo Film Co., Tokyo, Japan) and exposed to soft X-rays at 35 kV for 15 seconds with the use of a Sofron apparatus (Sofron, Tokyo, Japan). The radiolucent bone lesions were observed microscopically (IX81, Olympus), and the areas were quantified with Lumina Vision/OL (Mitani, Tokyo).
4.11. Lactate Concentration Measurement
The lactic metabolism of tibias collected for a previous experiment was evaluated. Both ends of the tibias were cut, and the bone marrow serum was extracted by centrifugation. The lactate concentrations in the bone marrow serum and whole blood serum were measured by a lactate assay kit (EnzyChrom™; BioAssay Systems, Hayward, CA, USA).
4.12. DRG Processing
Corrected DRGs were homogenized in RIPA lysis buffer with 1 mM PMSF and phosphatase inhibitor (Na3VO4 and NaF) added. The lysate was centrifuged at 15,000× g for 5 min at 4 °C, and the supernatant was collected as total protein. Some of the collected DRGs were fixed in 10% neutral-buffered formalin and then embedded in paraffin. Western blotting and immunofluorescence were performed using these DRGs.
4.13. Immunofluorescence Analysis
We conducted an immunofluorescence analysis to determine the expressions of p-Erk and TRPV1 in DRGs from each group of mice. The specimens were incubated with 3% bovine serum albumin–phosphate buffered saline (BSA–PBS) blocking solution, and then with p-Erk antibody (1:200) or TRPV1 antibody (1:100) and anti-CGRP antibody (1:200) overnight at 4 °C as primary antibodies, followed by Alexa Fluor 488 anti-rabbit IgG (1:1000) or Alexa Fluor 488 anti-mouse IgG (1:1000) and Alexa Fluor 647 anti-goat IgG (1:1000) as secondary antibodies. Nuclei were counterstained with Fluoroshield mounting medium with DAPI (#ab104139; Abcam).
4.14. Statistical Analyses
We analyzed the data using an unpaired Student’s t-test for comparisons of two groups and by performing a one-way analysis of variance (ANOVA) and a post hoc Bonferroni or Dunnett test for the analysis of multiple group comparisons, using SPSS statistical software, ver. 10. Results are expressed as the mean ± standard deviation (SD). Probability (p) values < 0.05 were considered significant.

 ,
, 


