Article

Structural and Comparative Analysis of the Complete Chloroplast Genome of Pyrus hopeiensis—“Wild Plants with a Tiny Population”—and Three Other Pyrus Species

1
Institute of Forest Biotechnology, Forestry College, Agricultural University of Hebei, Baoding 071000, China
2
Hebei Key Laboratory for Tree Genetic Resources and Forest Protection, Baoding 071000, China
3
Changli Institute for Pomology, Hebei Academy of Agricultural and Forestry Science, Changli 066600, China
*
Author to whom correspondence should be addressed.
These authors contributed to the work equally and should be regarded as co-first authors.
Int. J. Mol. Sci. 2018, 19(10), 3262; https://doi.org/10.3390/ijms19103262
Submission received: 2 October 2018 / Revised: 16 October 2018 / Accepted: 16 October 2018 / Published: 20 October 2018
(This article belongs to the Special Issue Plant Genomics)

Abstract

:
Pyrus hopeiensis is a valuable wild resource of Pyrus in the Rosaceae. Due to its limited distribution and population decline, it has been listed as one of the “wild plants with a tiny population” in China. To date, few studies have been conducted on P. hopeiensis. This paper offers a systematic review of P. hopeiensis, providing a basis for the conservation and restoration of P. hopeiensis resources. In this study, the chloroplast genomes of two different genotypes of P. hopeiensis, P. ussuriensis Maxin. cv. Jingbaili, P. communis L. cv. Early Red Comice, and P. betulifolia were sequenced, compared and analyzed. The two P. hopeiensis genotypes showed a typical tetrad chloroplast genome, including a pair of inverted repeats encoding the same but opposite direction sequences, a large single copy (LSC) region, and a small single copy (SSC) region. The length of the chloroplast genome of P. hopeiensis HB-1 was 159,935 bp, 46 bp longer than that of the chloroplast genome of P. hopeiensis HB-2. The lengths of the SSC and IR regions of the two Pyrus genotypes were identical, with the only difference present in the LSC region. The GC content was only 0.02% higher in P. hopeiensis HB-1. The structure and size of the chloroplast genome, the gene species, gene number, and GC content of P. hopeiensis were similar to those of the other three Pyrus species. The IR boundary of the two genotypes of P. hopeiensis showed a similar degree of expansion. To determine the evolutionary history of P. hopeiensis within the genus Pyrus and the Rosaceae, 57 common protein-coding genes from 36 Rosaceae species were analyzed. The phylogenetic tree showed a close relationship between the genera Pyrus and Malus, and the relationship between P. hopeiensis HB-1 and P. hopeiensis HB-2 was the closest.

Graphical Abstract

1. Introduction

Pyrus belongs to the Pyrus ssp. of the Maloideae subfamily (Rosaceae), which mainly includes temperate fruit trees. There are more than 30 species in this genus, and 13 species are present in China [1,2]. The pear has been cultivated for over 3000 years in China. It is the third most commonly cultivated fruit tree after apple and citrus. China is the world’s largest pear producer, accounting for 71.2% of the world’s total pear area. Wild resources of Pyrus are extremely precious. They are mostly distributed in the valleys, hillsides, and forest margins, and are characterized by cold resistance, drought resistance, disease resistance, barren tolerance, saline–alkali tolerance, and strong adaptability. They provide material for screening quality rootstocks and for molecular breeding. The flowers, leaves, and fruit also have high ornamental value. The fruit of the pear is rich in fruit acids, vitamins, sugars, and many mineral elements essential for human life. It is sweet and refreshing and can be used to make dried and preserved pears, wine, and other products. Furthermore, it is regarded as having a high medicinal value and is used to reduce fevers, moisten the lungs, provide cough relief, and eliminate phlegm. Therefore, Pyrus is a valuable wild resource with a high exploitation value.
P. hopeiensis is a rare wild resource of the genus Pyrus in the subfamily Rosaceae [3,4], which has been listed as one of the “wild plants with a tiny population” in China. It can be found at the edges of hillside jungles at 100–800 m above sea level. At present, only a few genotypes have been found in Changli, Hebei Province. So far, there have been few studies about P. hopeiensis. Successful sequencing of the chloroplast genome of P. hopeiensis in our study provides a foundation for further study of its chloroplast molecular biology and can effectively promote genetic breeding and help clarify the molecular evolution of P. hopeiensis. It also provides some basis for the evolutionary analysis and classification of the genus Pyrus. What is more, this study gives a systematic review of P. hopeiensis that is useful for the conservation and restoration of wild P. hopeiensis resources.
Chloroplasts are the main site of photosynthesis, where fatty acids, starch, pigments, and other materials are synthesized [5]. They are independent of the plant nuclei and have a highly conserved genomic structure. Chloroplast DNA (cpDNA) has the beneficial characteristics of multiple copies, low molecular weight, and simple structure. Unlike the nuclear genome, which contains more repetitive sequences, and the mitochondrial genome, which is frequently rearranged, the chloroplast genome is rather conservative. The main mutation types are substitution and base insertion or deletion, and the mutation rate is low. Additionally, the chloroplast genome is of moderate size, making it easier to sequence than complex nuclear genomes. The chloroplast genome is maternally inherited in angiosperms with an independent evolutionary route [6]. Phylogenetic trees can be constructed using cpDNA data only, and the chloroplast genome shows good collinearity among plant groups. Sequencing data are relatively easy to analyze and the chloroplast genome structure sequence information can be used to study the species origin, evolution, and relationships between different species. In recent years, with the development of high-throughput sequencing technology, more chloroplast genomes of Rosaceae have been sequenced. In this study, the chloroplast genomes of two genotypes of P. hopeiensis and three other Pyrus (P. ussuriensis Maxin. cv. Jingbaili, P. communis L. cv. Early Red Comice, and P. betulifolia) were sequenced and compared with other Rosaceae plants. The genome structure and phylogeny of Pyrus were elucidated.

2. Results and Analysis

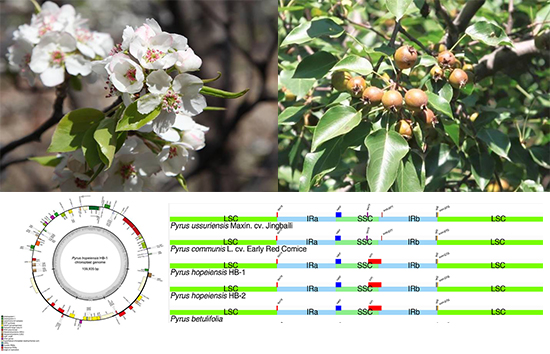
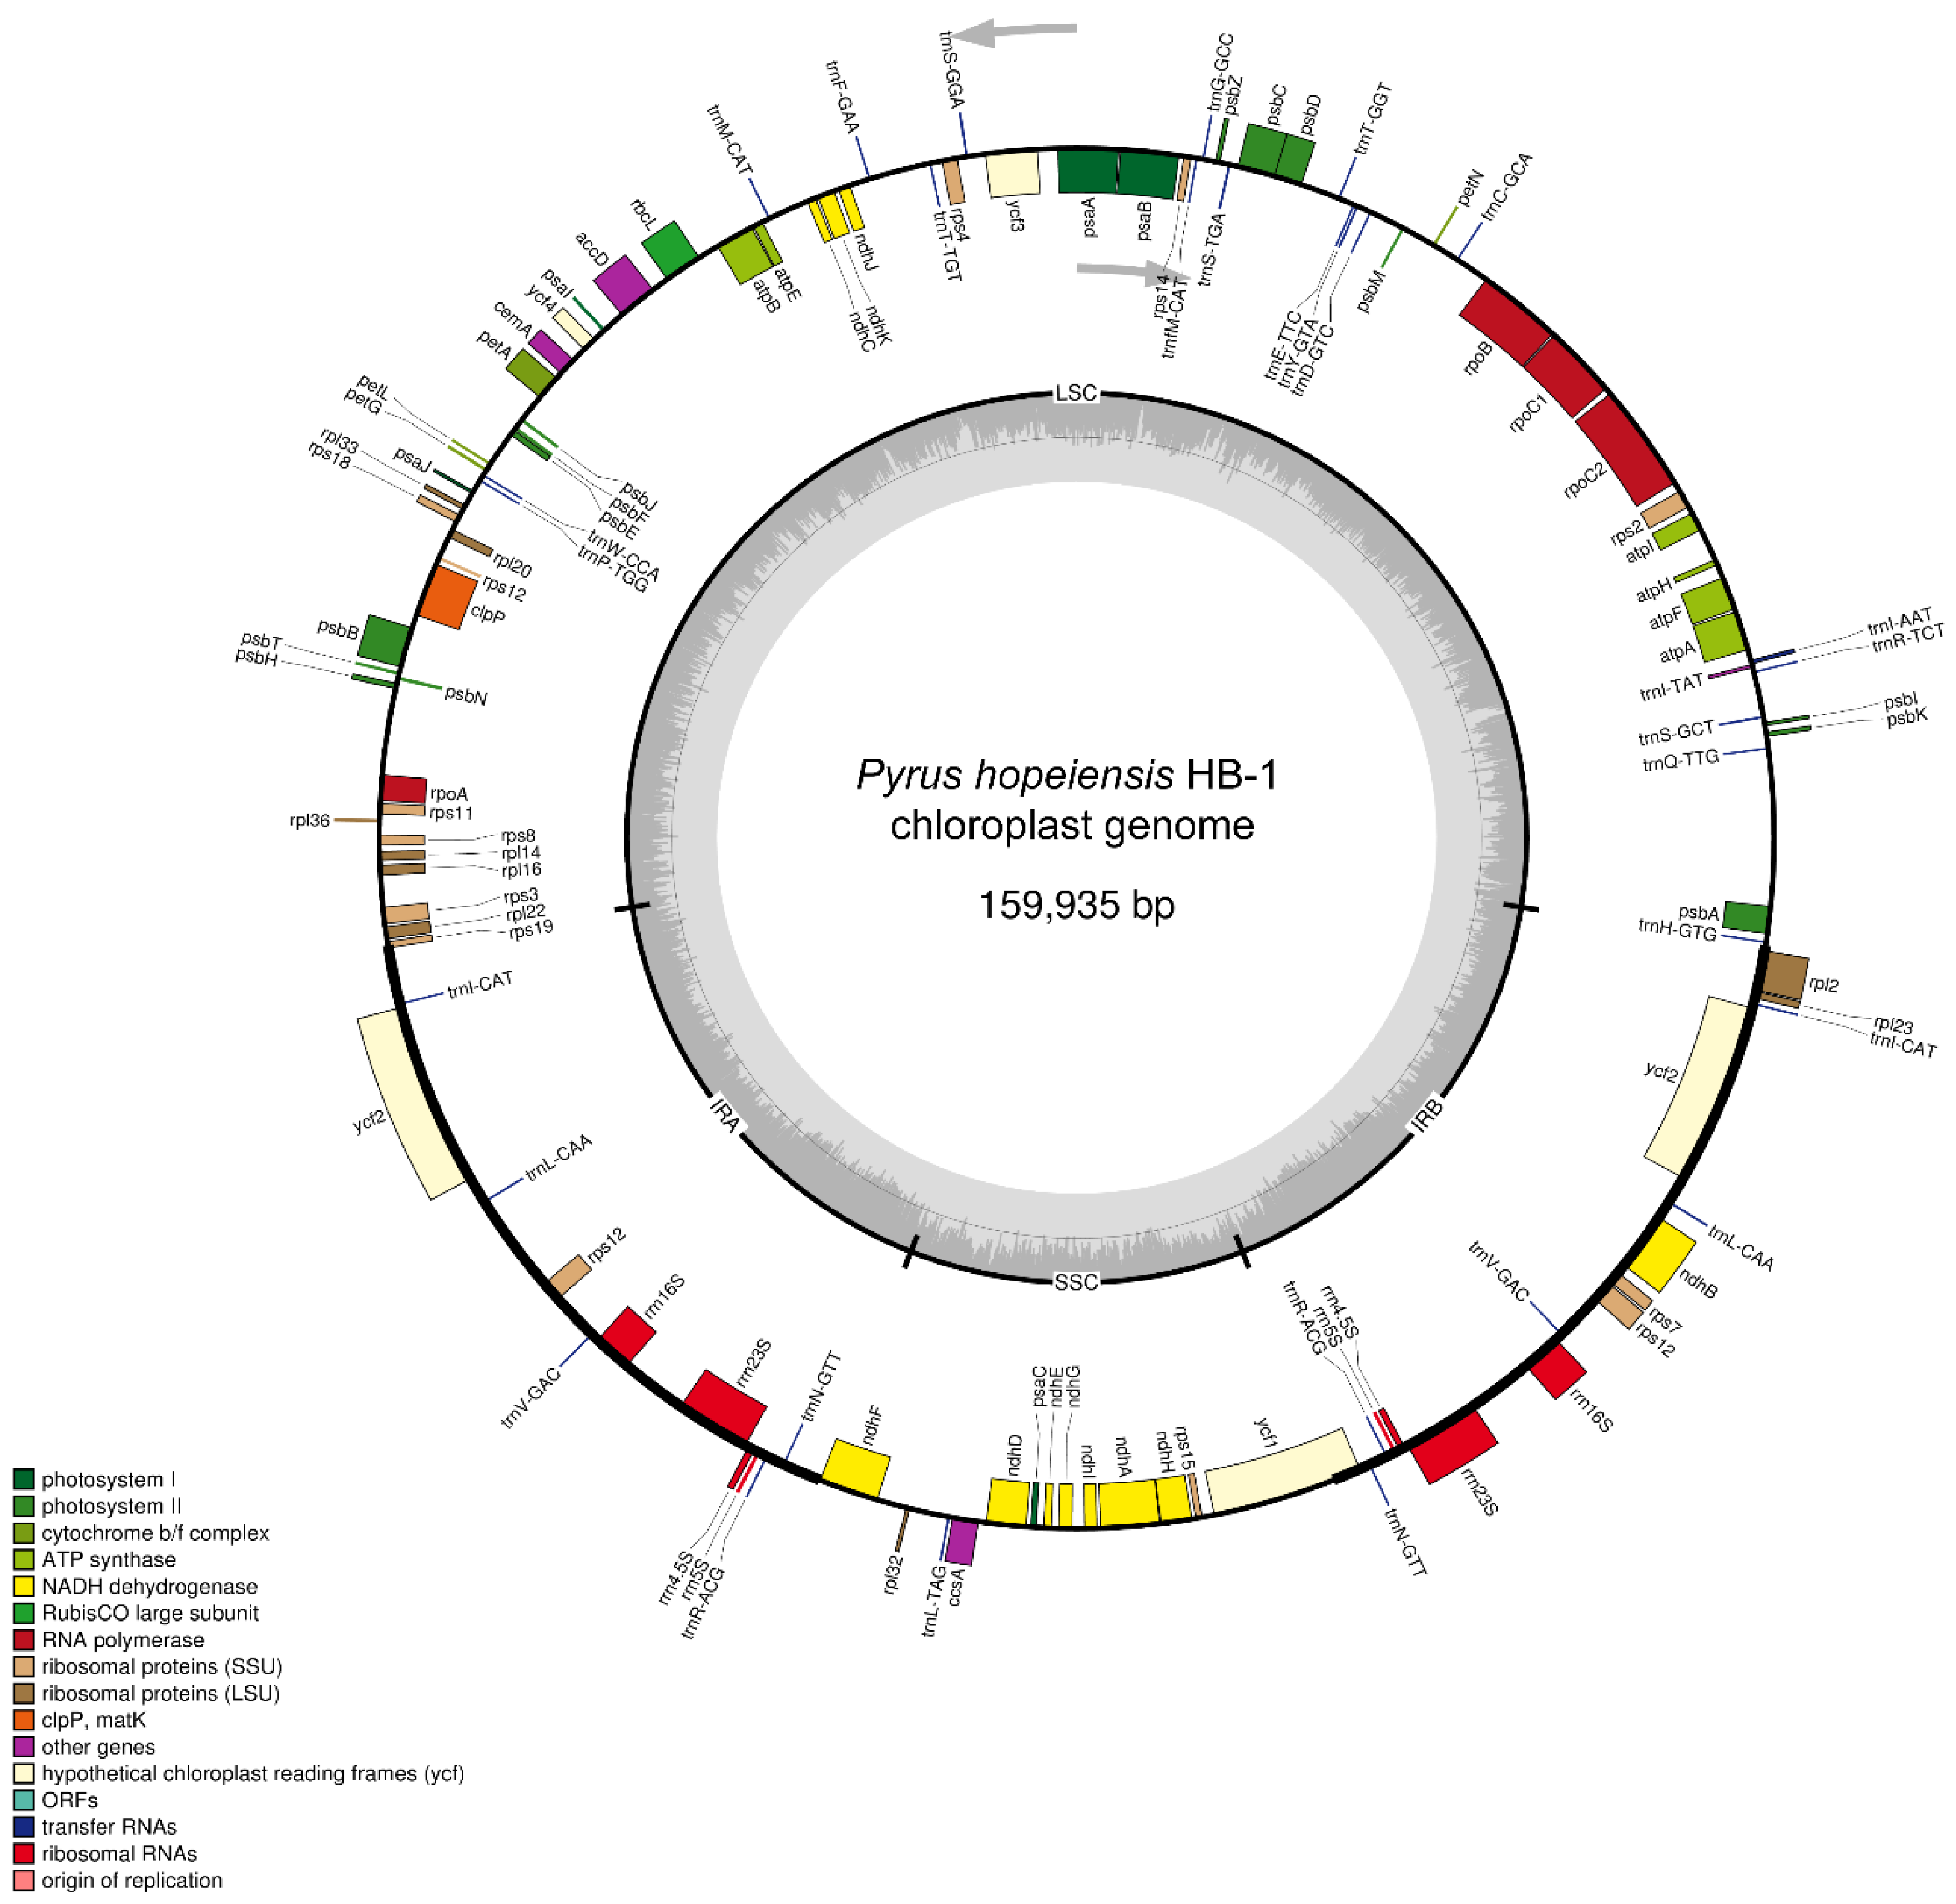
2.1. Basic Characteristics of Chloroplast Genome of P. hopeiensis

The chloroplast genome of P. hopeiensis has a typical tetrad structure, including paired IRa and IRb sequences, encoding in opposite directions, and large and small single copy regions (Figure 1). The total chloroplast genome of P. hopeiensis HB-1 was 159,935 bp in length, 46 bp smaller than that of P. hopeiensis HB-2. The large single copy (LSC) region was 87,961 bp long, 46 bp smaller than that of P. hopeiensis HB-2. The length of the small single copy (SSC) region was 19,200 bp and the IR region was 26,387 bp, the same as those of P. hopeiensis HB-2. There was little difference in length between the two P. hopeiensis genotypes, and what difference existed was in the LSC region.
A total of 117 genes (Table 1) from the chloroplast genome of P. hopeiensis HB-1 were annotated, including 77 protein coding genes, 31 tRNAs, eight rRNAs, and two pseudogenes (clpP and atpF). P. hopeiensis HB-1 lacked only the MATK protein-coding gene that was associated with biosynthesis in P. hopeiensis HB-2. These 77 protein-coding genes can be divided into four categories. The first contains 28 self-replicating genes, including three subunits encoding the synthesis of chloroplast RNA polymerase. The second category contains 40 genes related to photosynthesis, including light systems I and II, a cytochrome b 6/f protein complex, and ATP synthase and other biosynthesis genes, including cytochrome-related genes (P. hopeiensis HB-1 contains three genes and P. hopeiensis HB-2 contains four genes). The fourth category contains five unknown genes, such as the ycf gene. The IR region of P. hopeiensis contains 32 genes, of which the ndhB gene is present only in the IRb region and is absent in the IRa region. In addition, rps12 is a mitotic gene with its 5′ terminal located at the LSC region and 3′ end with a copy is located in each of the two IR regions. This phenomenon is common in higher plants.
The chloroplast genome of P. hopeiensis HB-1 contains 11 genes that harbor introns and one more trnI-TAT gene than P. hopeiensis HB-2. Of these 11 genes, two are tRNA genes (trnI-TAT and trnI-AAT) and nine are protein-coding genes (rpoC1, rpl22, rpl22, ndhA, rpl2, rpl2, rps12, rps12, rps12, ycf3), of which ycf3 contains two introns. Excepting the intron length of the trnI-AAT gene, P. hopeiensis HB-2 is larger than P. hopeiensis HB-1. The exon and intron lengths of the two P. hopeiensis genotypes are identical. Among the coding genes, ndhA was the longest at 1125 bp, and rpl22 was the shortest at 63 bp.

2.2. Comparison of the Basic Characteristics of the Chloroplast Genome in Five Pyrus Species

The chloroplast genome of Pyrus is a typical ring structure 159,834–160,059 bp in length (Table 2). The chloroplast genome of P. communis L. cv. Early Red Comice is the shortest, and the longest is P. ussuriensis Maxin. cv. Jingbaili. The LSC length of Pyrus is 87,793–88,074 bp, the longest in P. ussuriensis Maxin. cv. Jingbaili and the shortest in P. communis L. cv. Early Red Comice. The SSC length is 19,201–19,261 bp, with the longest in P. betulifolia and the shortest in both genotypes of P. hopeiensis.
The IR regions were of similar length in four of the five Pyrus species, and only differed by 4 bp, except in P. communis L. cv. Early Red Comice. The GC content was similar, 36.57–36.59%. The number of protein-coding genes ranged from 74 to 78. The chloroplast genome of the five Pyrus species contained 15 genes, including introns (nine protein-coding genes and six tRNAs, see Table 3), and the ycf3 gene contained two introns. The intron in P. betulifolia contained 13 genes, followed by 12 in P. ussuriensis Maxin. cv. Jingbaili, 11 in P. hopeiensis HB-1, 10 in P. hopeiensis HB-2, and 10 in P. communis L. cv. Early Red Comice. In the five Pyrus species, nine genes contained introns (rpoC1, ycf3, rpl22, rpl2, ndhA, ndhB, rpl2, rps12, and rps12), all of which were protein-coding genes. The intron in the ndhA gene was the longest, at 1125–1169 bp. Other than the short intron length of the trnI-TAT gene in P. ussuriensis Maxin. cv. Jingbaili, rpl22 harbored the smallest intron of the other four Pyrus species, at 63–83 bp. The results showed that the size, structure, sequence, and GC content of the chloroplast genome of P. hopeiensis were similar to those of the other three Pyrus species, which was characteristic of the slow evolution of the genus Pyrus [7] in comparison to the chloroplast genomes of P. hopeiensis, P. communis L. cv. Early Red Comice, P. ussuriensis Maxin. cv. Jingbaili, and P. betulifolia.

2.3. Chloroplast Gene Gain–Loss Events

The chloroplast genome structure of most higher plants is stable, and the number, sequence, and composition of genes are conserved. However, the loss of chloroplast genome genes is common. For example, the chloroplast genome of the sweet orange has lost the infA gene [8]; the ycf1, ycf2, and accD genes have been lost in Gramineae [9], and the chloroplast genome of some legumes has been recombined several times, resulting in the deletion of a copy of the IR region [10]. The rpl22 gene was detected in the chestnut nuclear genome [11], presumably having derived from the chloroplast genome. In addition, the rpl32 gene was transferred to the nuclear genome in the poplar [12], and 17 similar chloroplast regions were found in the mitochondrial genome of papaya, suggesting that the chloroplast gene may have transferred to the mitochondria [13]. However, there have been few studies on how these genes are lost, transferred, and integrated into the nuclear and mitochondrial genomes.
In this study, we compared the gain–loss events of eight Pyrus species (five Pyrus species that were sequenced in this study and three other Pyrus species, P. pyrifolia, P. spinose, and P. pashia, which were downloaded from NCBI) (Table 4 and Table 5). The psbL, psbl, trnI-GAU, trnA, trnL, and trnY-AUA genes were most readily lost through evolution, followed by trnA-UGC, trnG-UCC, trnI-AAU, trnI-GAU, trnK-UUU, trnN-AUU, and trnV-UAC. P. hopeiensis HB-1 contained one less MATK gene than P. hopeiensis HB-2. Compared with the other three sequenced Pyrus species, trnI-AAU was only present in P. hopeiensis HB-1 and P. hopeiensis HB-2. The atpB gene was only lost in P. ussuriensis Maxin. cv. Jingbaili and P. communis L. cv. Early Red Comice, and petB, petD, rps16 and trnL-UAA were present in the five Pyrus species sequenced here, but missing in P. pyrifolia, P. spinosa, and P. pashia.

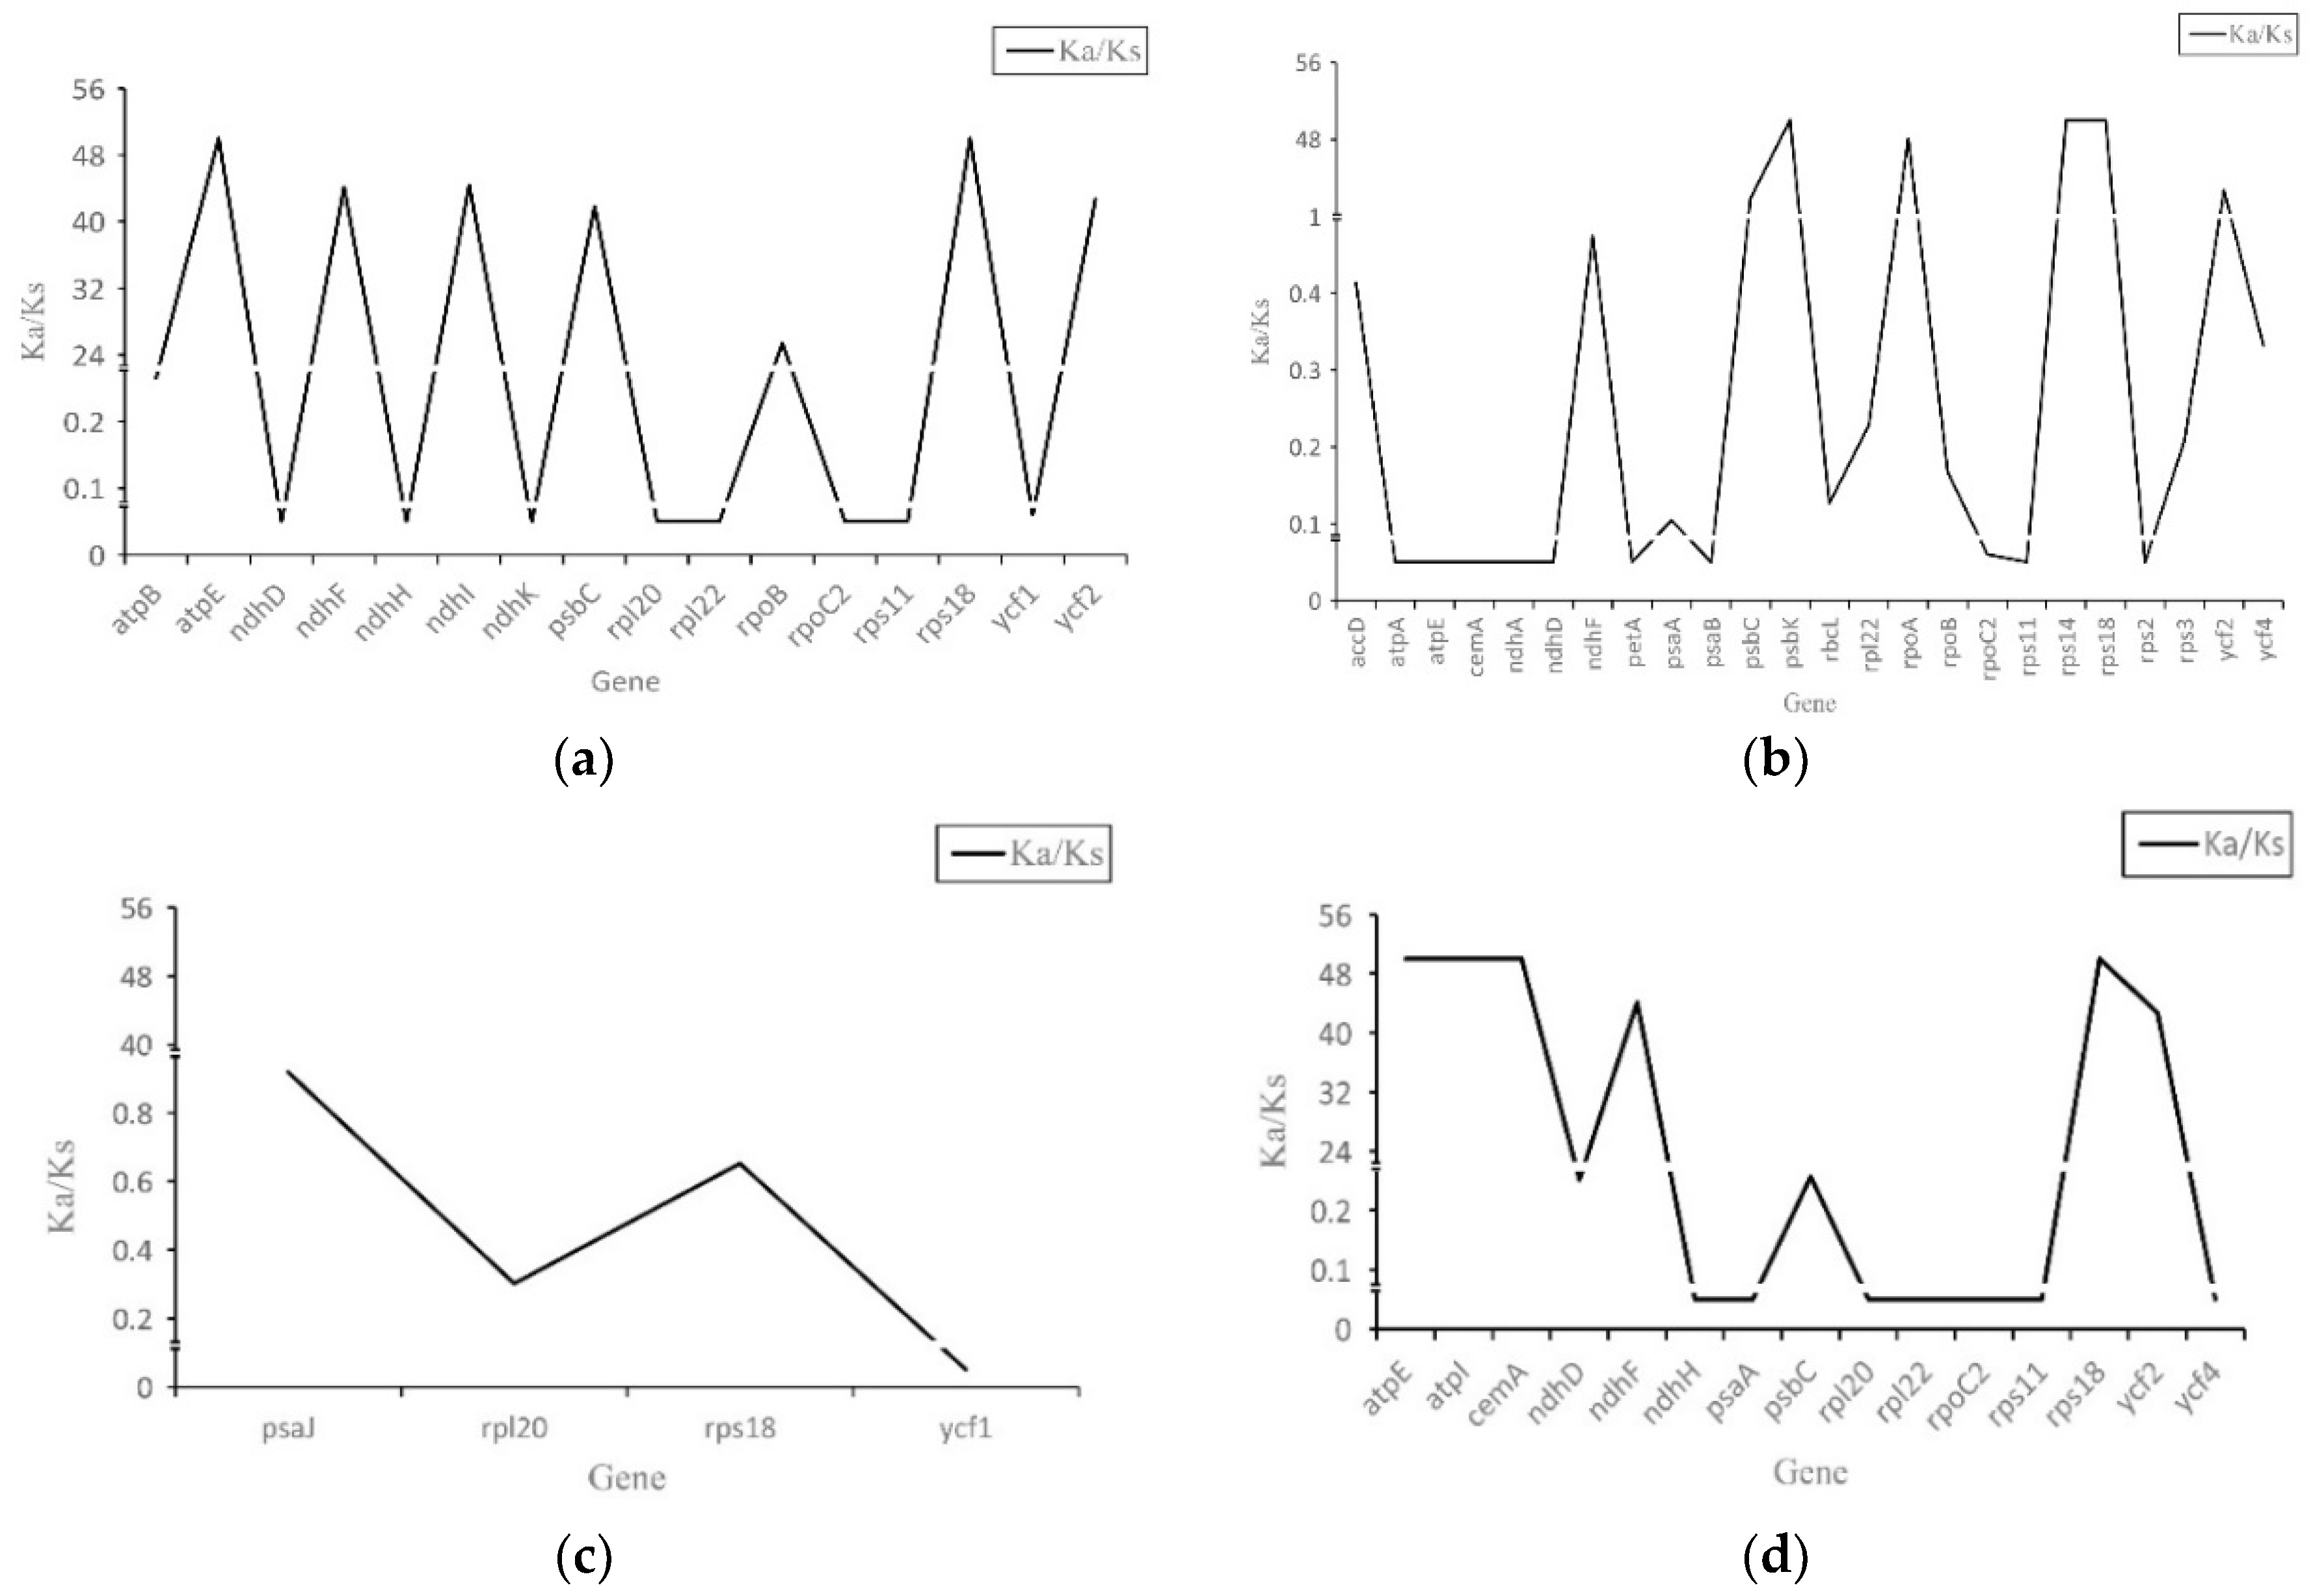
2.4. Synonymous (KS) and Nonsynonymous (KA) Substitution Rate Analysis

Nucleotide mutations that do not cause amino acid changes are known as synonymous mutations, whereas nonsynonymous mutations do cause changes to the amino acid sequence. The Ka/Ks ratio (or dN/ds) of nonsynonymous substitution (Ka) and synonymous substitution (Ks) is the selection pressure of an encoded protein, which can be used to determine whether the gene encoded by the protein is under selection pressure. If Ka/Ks > 1, the protein is considered to be positively selected; if Ka/Ks = l, the protein is neutral; and if Ka/Ks < 1, the protein is considered to have undergone purifying selection. It is generally believed that synonymous mutations are not subject to natural selection, whereas nonsynonymous mutations are.
Compared to P. hopeiensis HB-1, psaJ, rpl20, rps18, and ycf1 in P. hopeiensis HB-2 were subject to negative selection, and no positive selection gene (Figure 2 and Table S1–S4) was found. In P. betulifolia, atpE, ndhF, ndhI, rps18, and ycf2 were subject to positive selective pressure, whereas ndhD, ndhH, ndhK, rpl20, rpl22, rpoC2, rps11, and ycf1 were subject to negative selection. The psbC, psbK, rpoA, rps14, rps18, and ycf2 genes were subject to positive selective pressure in P. communis L. cv. Early Red Comice. Moreover, accD, atpA, atpE, cemA, matK, ndhA, ndhD, ndhF, ndhH, petA, psaA, psaB, rbcL, rpl22, rpoB, rpoC2, rps11, rps2, rps3, and ycf4 were subject to negative selection. In P. ussuriensis Maxin. cv. Jingbaili, atpE, atpI, cemA, ndhF, rps18, and ycf2 were subject to positive selective pressure, and ndhD, ndhH, psaA, psbC, rpl20, rpl22, rpoC2, rps11, and ycf4 were subject to negative selection. Compared with P. betulifolia, atpE was subject to positive selective pressure in P. betulifolia and P. ussuriensis Maxin. cv. Jingbaili, whereas atpE was subject to negative selection in P. communis L. cv. Early Red Comice. This shows that the chloroplast genome of Pyrus has been affected by different environmental pressures during evolution, which may account for the different gene numbers among the five Pyrus species.

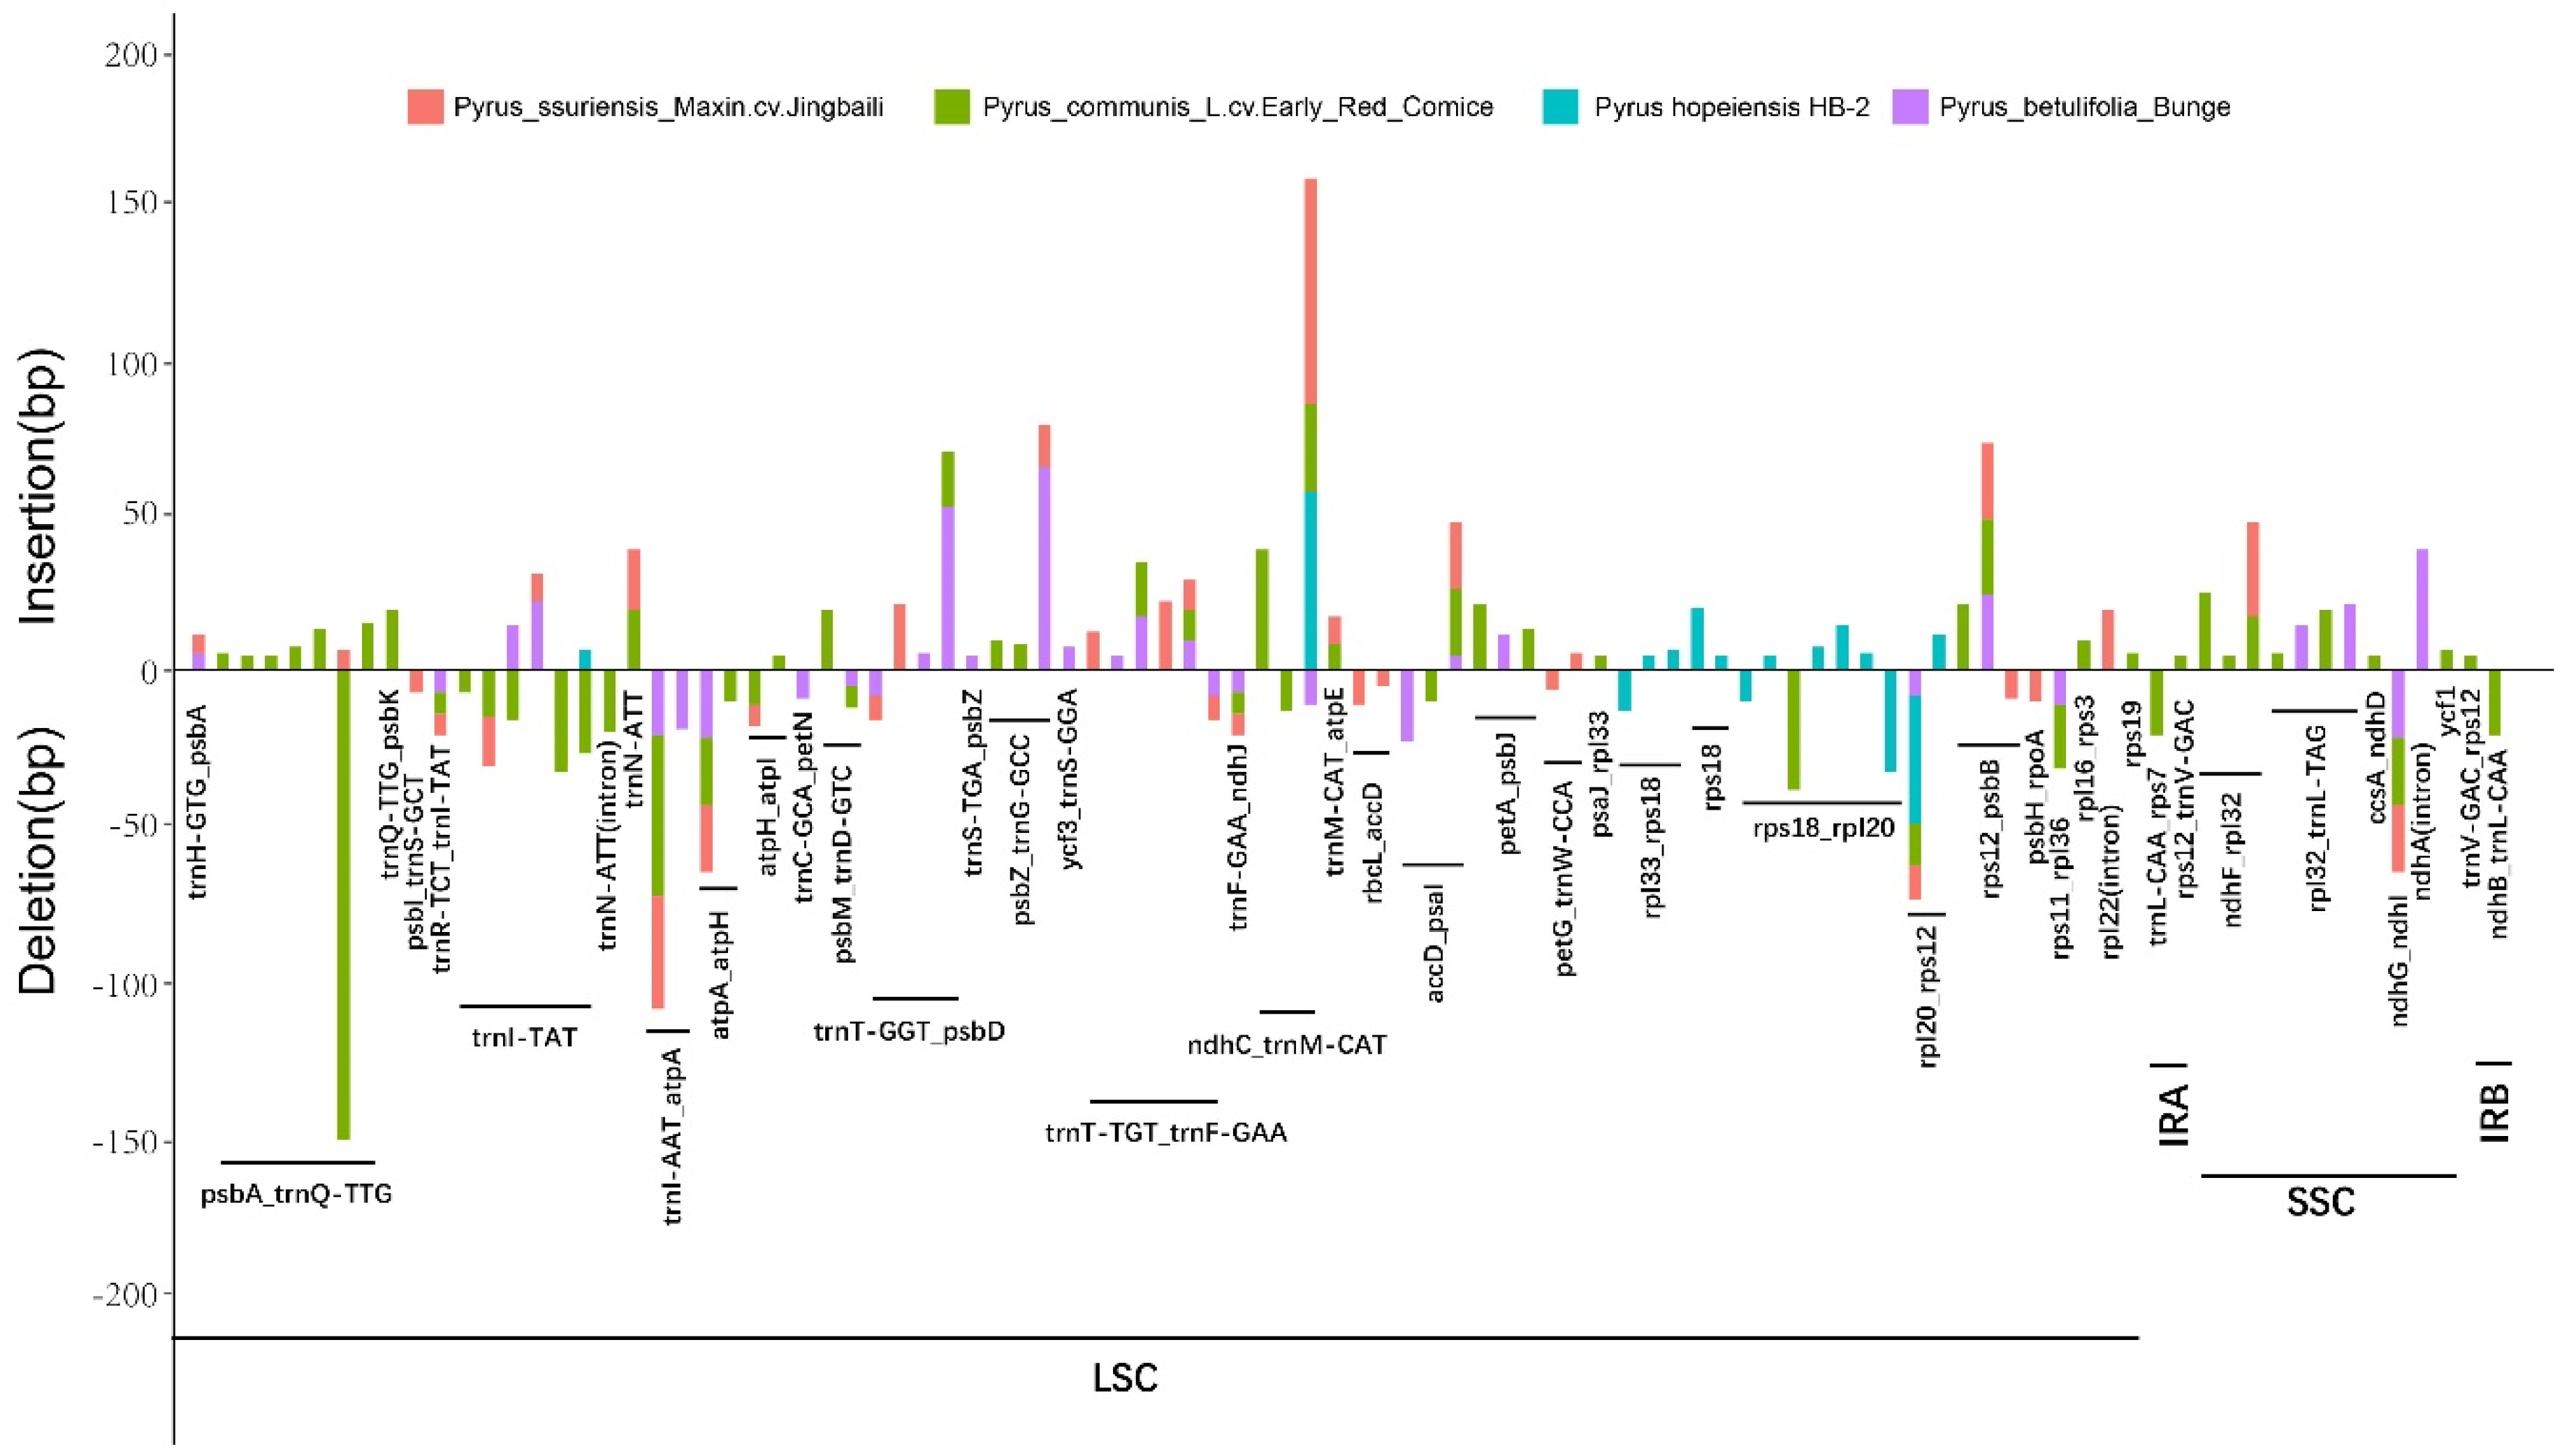
2.5. Indel Identification and Relationship of the Five Pyrus cp Genomes

The nucleotide bases in coding and non-coding regions have different evolutionary mutation rates. DNA variations located in coding regions can lead to large phenotypic and functional variations; moreover, these often have a slower mutation rate, making them suitable for phylogenetic studies of higher order elements (families, orders, and higher). Mutations in non-coding regions have little effect on phenotype and fewer functional restrictions, and as they take no part in the transcription/translation process, they have a relatively high nucleotide replacement rate and hence rapid evolution, making them suitable for the phylogenetic study of lower order elements (species, genus) [14].
The chloroplast genome data of five Pyrus species were compared with those of P. hopeiensis HB-1 by multiple sequence alignment using MAFFT. All differentially expressed sites were extracted using a script from the comparison results, and differences in sites of indels ≥ 5 bp were screened out. The location of different chloroplast genome sites was determined and ggplot in R was used to create graphic plots that were then optimized using AI. The results indicated 15 mutation sites in P. hopeiensis (Figure 3), which included 11 insertion and four deletion sites. All of these mutation sites were located in the LSC region; three were located in gene regions and 12 in intergenic regions. Among these, the longest was located in the ndh-trnM-CAT region, and as many as six mutations were located in the intergenic region rpl18rps20. A total of 96 mutation sites were detected in the other four Pyrus species, 81 of which were located in the LSC region of the chloroplast genome and 11 in the SSC region, whereas only two mutation sites were found in the IRa and IRb regions in P. communis L. cv. Early Red Comice. There were more mutation sites in the SC region, and the IR region was more conserved. Indels were mainly located in the intergenic regions, and three indel loci were detected in the intron region (rpl22, trnN-ATT, ndhA). Because the protein-coding region is arranged by triplet codons, the tolerance of indels is poor. Therefore, only five indel loci were detected in the protein-coding region (trnL-TAT, trnN-ATT, rps18, rps19 and ycf1), but no indel loci were detected in the rRNA region. A comparison of the occurrence of these indel loci among the four Pyrus species revealed 15 indel loci in the chloroplast genome of P. hopeiensis, 32 in P. ussuriensis Maxin. cv. Jingbaili, 57 in P. communis L. cv. Early Red Comice, and 31 in P. betulifolia. The insertion or deletion frequency in the chloroplast genome of P. hopeiensis HB-2 was less than that in P. hopeiensis HB-1. The psbA-trnQ_TTG and rpl18-rps20 intergenic regions were the most variable regions with seven loci, followed by trnT-TGT_trnF_GAA (six) and the trnI-TAT gene-coding region (six). The largest indels were located in psbA_trnQ-TTG in the chloroplast genome of P. communis L. cv. Early Red Comice.

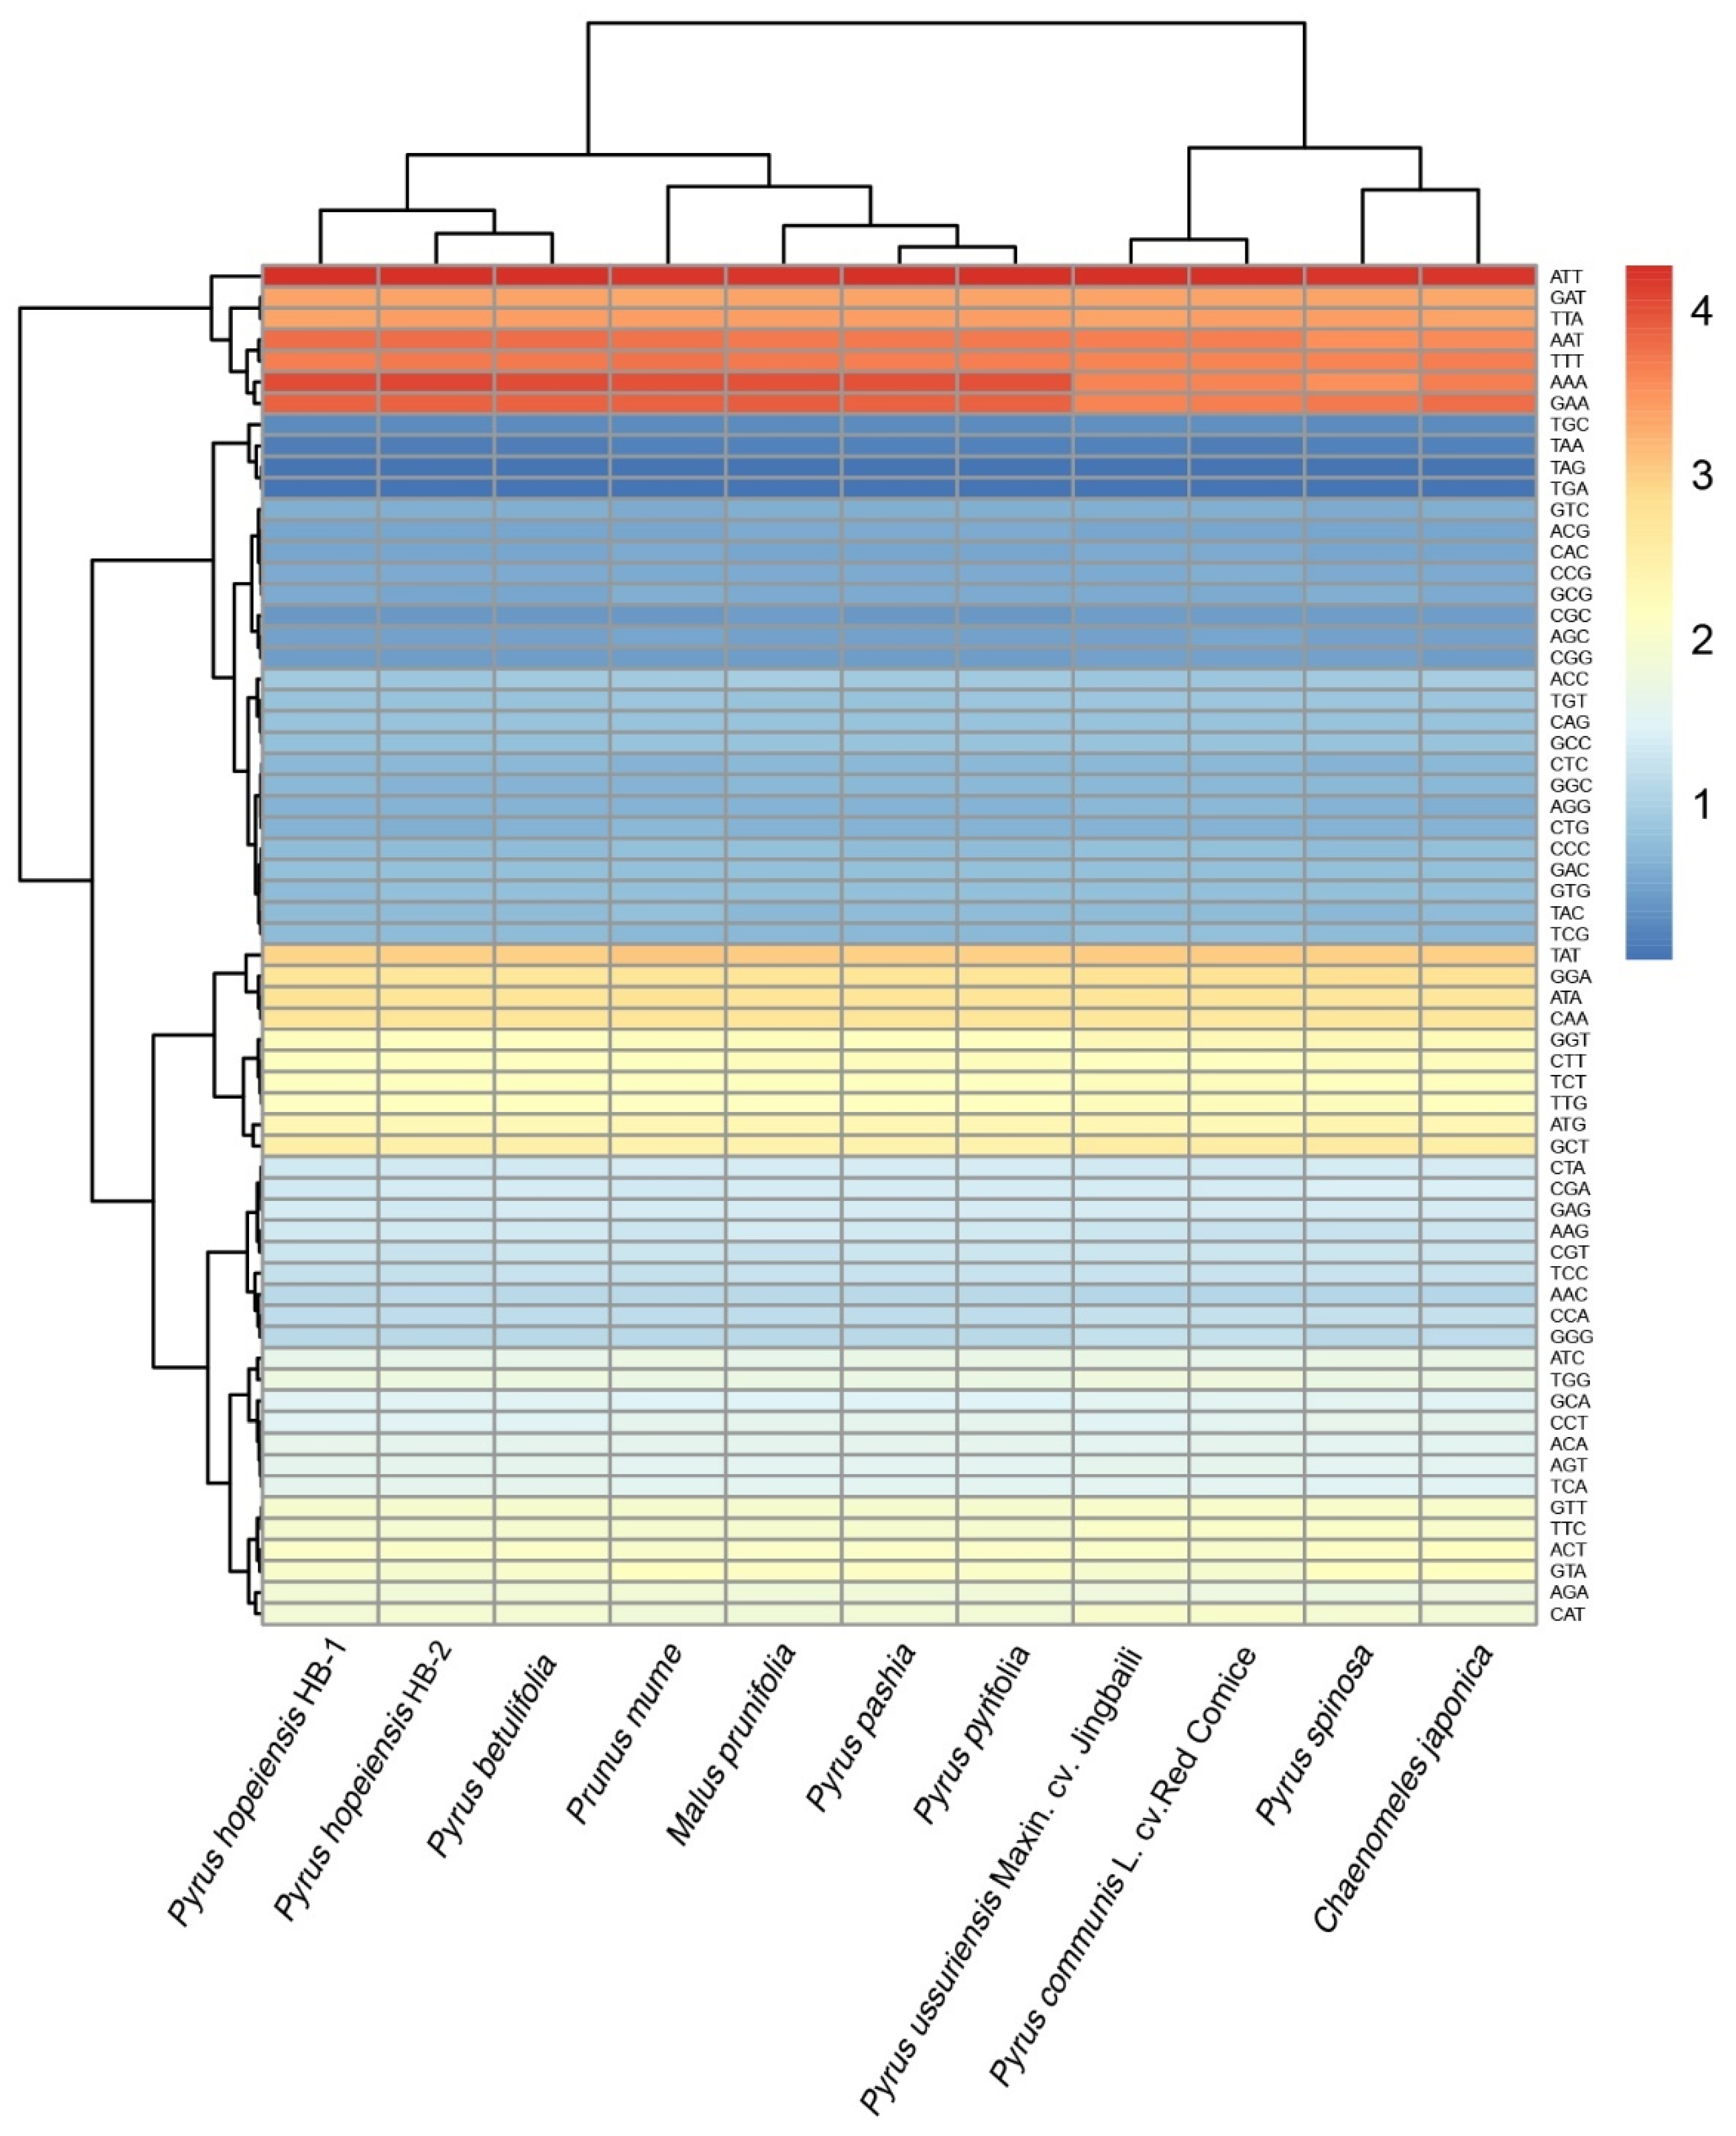
2.6. Codon Preference Analysis

Codons have an important role in the transmission of genetic information. Codon use is not equal in many species, and the phenomenon of a specific codon use frequency being higher than that of its synonymous codon is known as codon preference [15]. Codon preference is formed during the long-term evolution of organisms, with different species having different codon preferences. Codon use is affected by natural selection, mutagenesis, tRNA abundance, the composition of base groups, hydrophilicity of codons, gene length, and expression levels [16]. Analysis of the codon use preferences of a species improves our understanding of the transmission of genetic information and the development of evolutionary and phylogenetic models.
The annotated files of plant genomes, including P. pashia, P. pyrifolia, Malus prunifolia, Prunus mume, and Chaenomeles japonica, were selected from the NCBI database, including the sequence files encoding CDS and proteins. According to the full-length CDS criterion, sequences with lengths <300 nt were deleted. The codon-use frequency of each genome was extracted from the annotated files of each genome and the corresponding frequency ratio was calculated. The final statistical results were clustered and mapped using the pheatmap package in R. The results showed obvious codon use preferences for both types of P. hopeiensis, among which ATT, AAA, GAA and AAT, and TTT were used most frequently (Figure 4). Statistical analysis of all the codons of P. hopeiensis, the three other Pyrus species, and the other Rosaceae showed a high A/T preference in the third chloroplast codon. This is common in the chloroplast genomes of higher plants [17,18,19,20,21].

2.7. Comparison of the Genome Structure in Rosaceae cp Genomes

The chloroplast genome structure of most higher plants is relatively stable and the number, sequence, and composition of their genes are conserved. However, because different plant groups have different evolutionary histories and genetic backgrounds, the chloroplast genome size, genome structure, and gene numbers vary. Insertion/deletion is the most frequent type of microstructural variation in the chloroplast genome, and it occurs frequently in some segments where the variation is high, such as trnH-psbA and trnS-G. In Rosaceae, an insertion/deletion of 277 bp in the intergenic region of the trnS-G gene was reported in peach plants [22], and an insertion/deletion of 198 bp in the intergenic region of trnL-F was identified in P. mume [23].
The collinear method was used to analyze and compare the chloroplast genomes of the two genotypes of P. hopeiensis, the other three sequenced Pyrus, and other related Rosaceae (P. pashia, P. pyrifolia, P. spinosa, M. prunifolia, P. mume, and C. japonica). The results showed optimal collinearity between P. hopeiensis HB-1 and P. hopeiensis HB-2, and only a few sites contained insertions and deletions (Figure 5). Compared with the other Rosaceae, the genome structure and gene sequences were highly conserved, with more linear relationships indicating high chloroplast genome homology among the different plants.

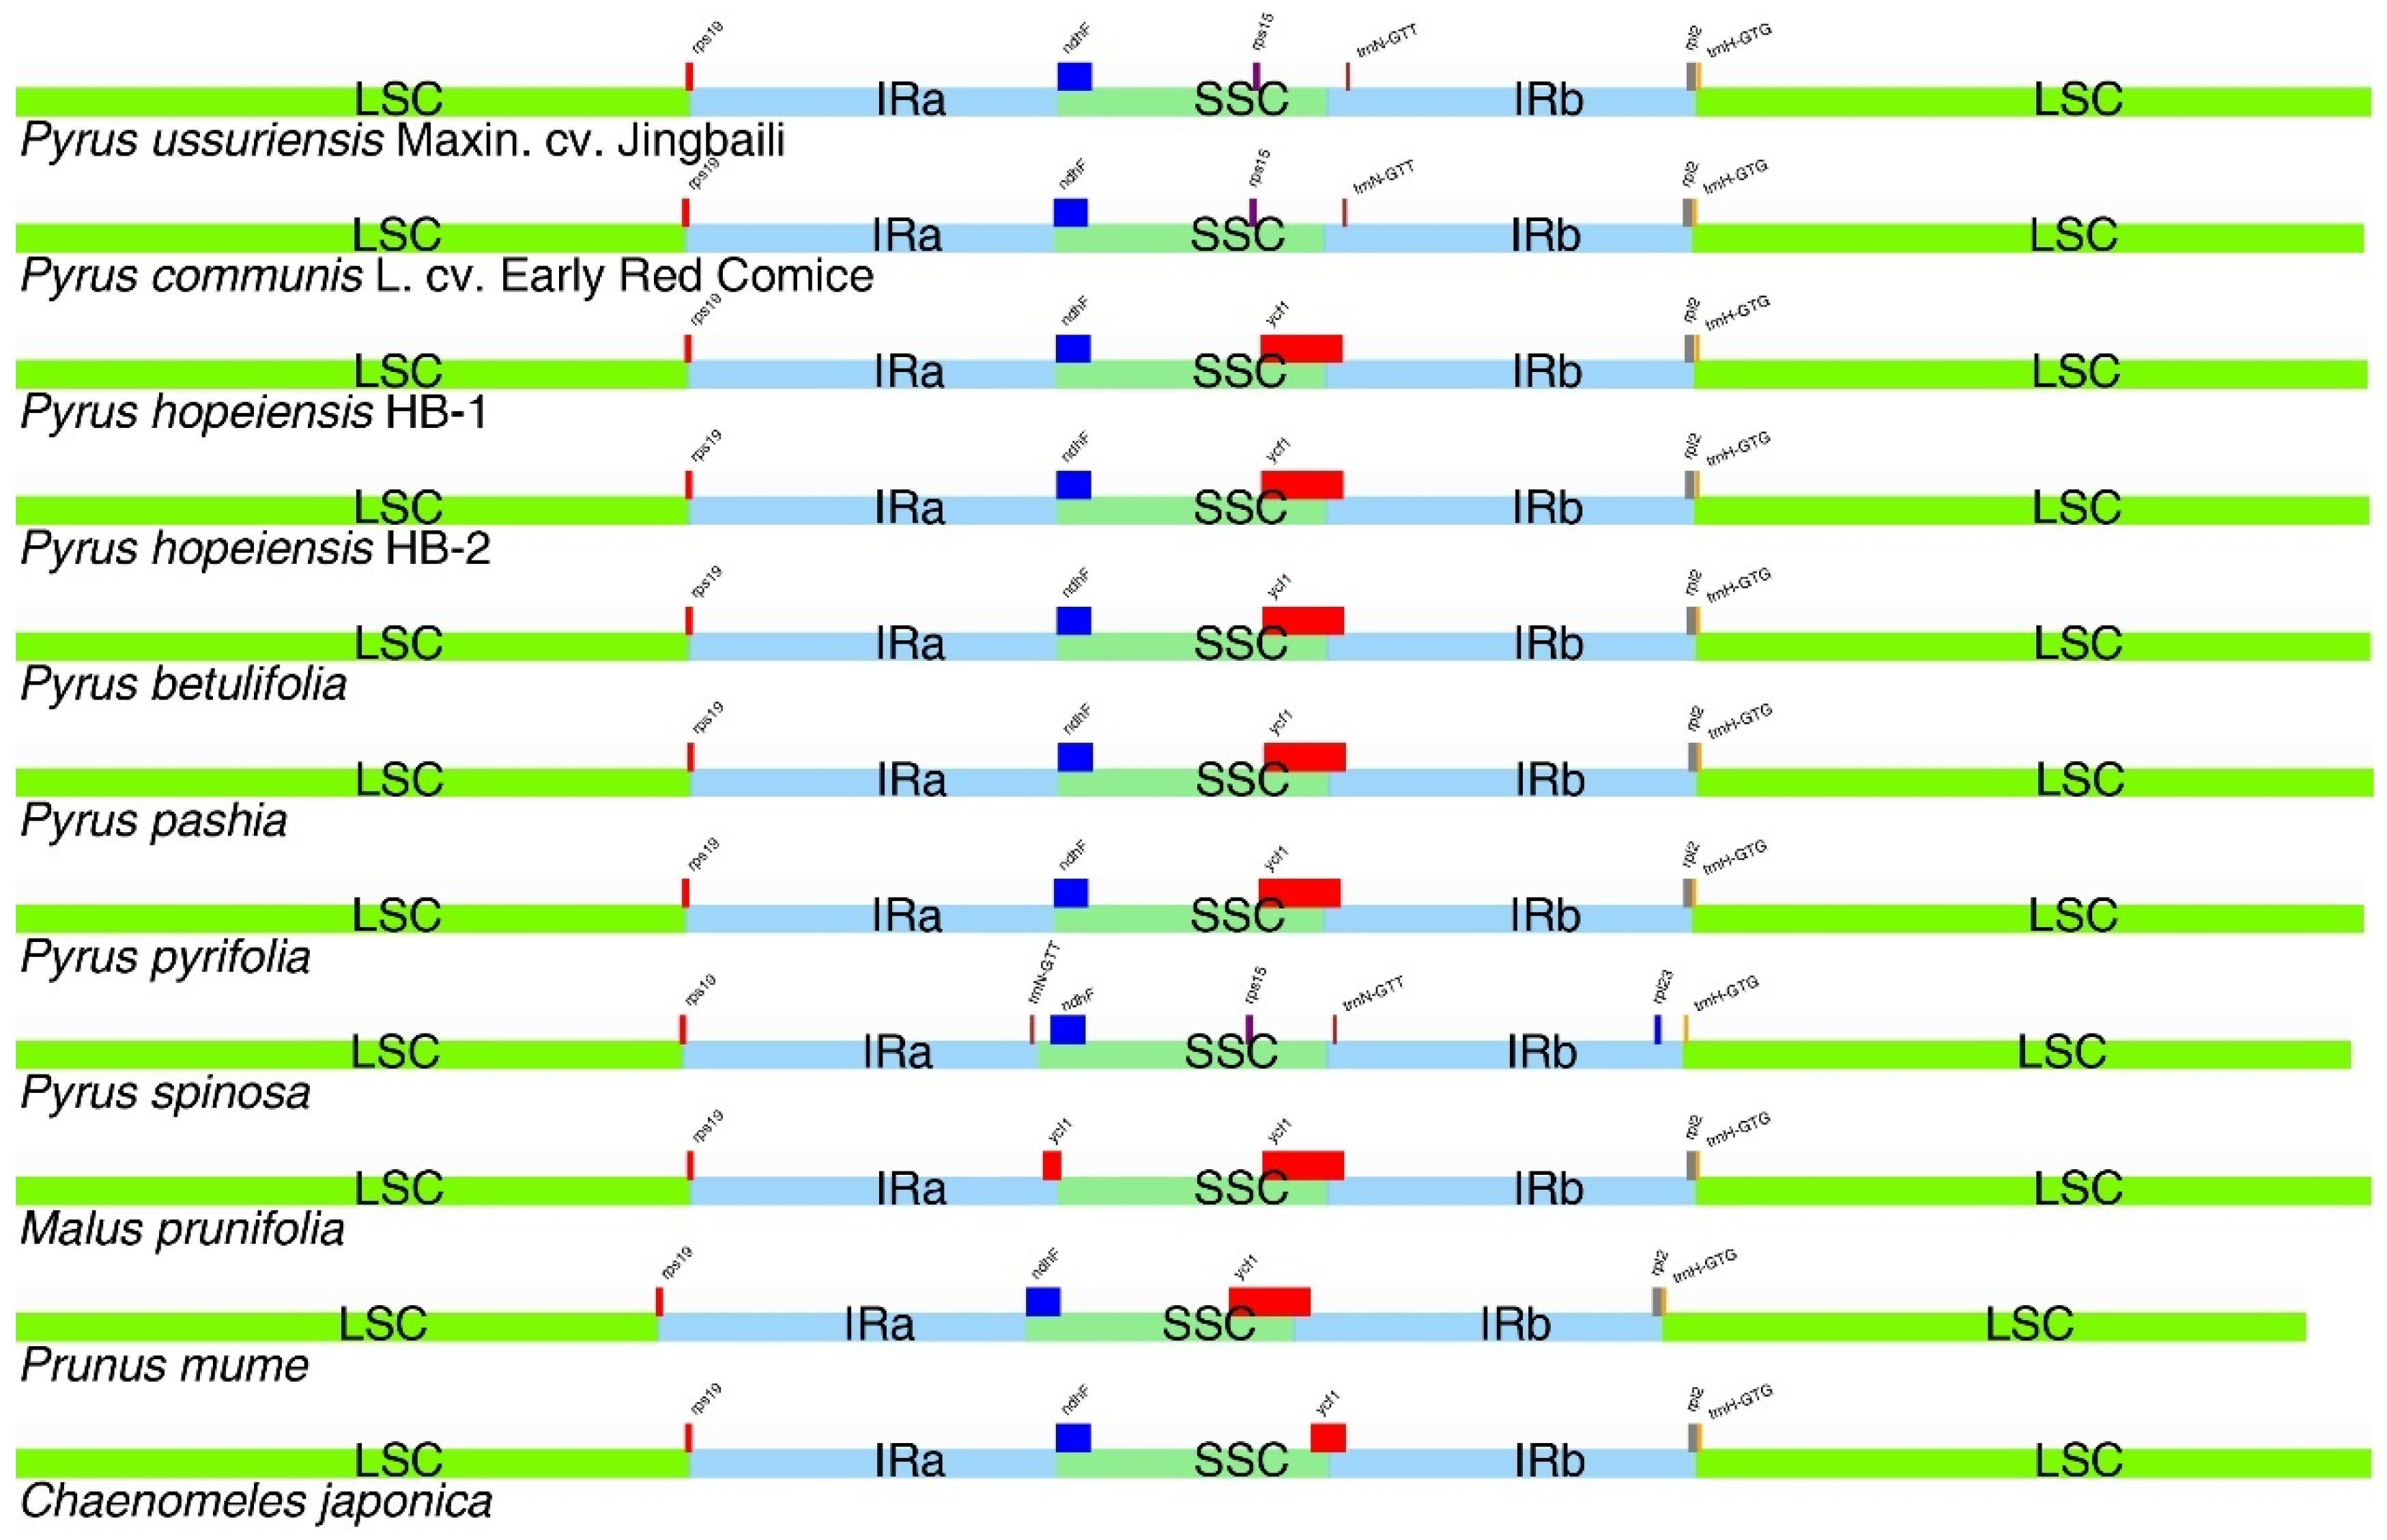
2.8. IR Contraction Analysis

The IR region is considered to be consistent and stable in the chloroplast genome. However, in the evolution of species, border region contraction and expansion are common. In this study, the IR boundaries of both genotypes of P. hopeiensis were compared. The IRa/LSC boundary extended into the rps19 gene, and 120 bp of rps19 extended into the IRa region. The IRa/SSC boundary extended into the ndhF gene, and 12 bp of ndhF extended into the IRa region. The IRb/SSC boundary extended into 1074 bp of ycf1 and the IRb/LSC border extended into the rpl2 gene, with the trnH-GTG gene located downstream.
The IR boundaries were compared among the Rosaceae, including the five Pyrus species sequenced, and P. pashia, P. pyrifolia, P. spinosa, M. prunifolia, P. mume, and C. japonica (Figure 6). The IRa/LSC boundary of these plants extended to the rps19 gene. The IRa/SSC boundaries were located upstream of the ndhF gene, except in M. prunifolia, whose IRa/SSC junction lost ndhF but extended to ycf1. The P. spinosa IRb/LSC boundary had no rpl2. All IRb/SSC boundaries expect those of P. ussuriensis Maxin. cv. Jingbaili, P. communis L. cv. Early Red Comice, and P. Spinosa extended to ycf1. The IRb/SSC boundary lost ycf1. These findings were similar to those in the Actinidiaceae, Theaceae, and Primulaceae, but differed markedly from those in Ericaceae. For the IRb/LSC boundary, all but that of P. spinosa extended into the rpl2 gene, and the IRb/LSC boundary of the trnH-GTG gene located downstream extended into the rpl23 gene in P. spinosa.

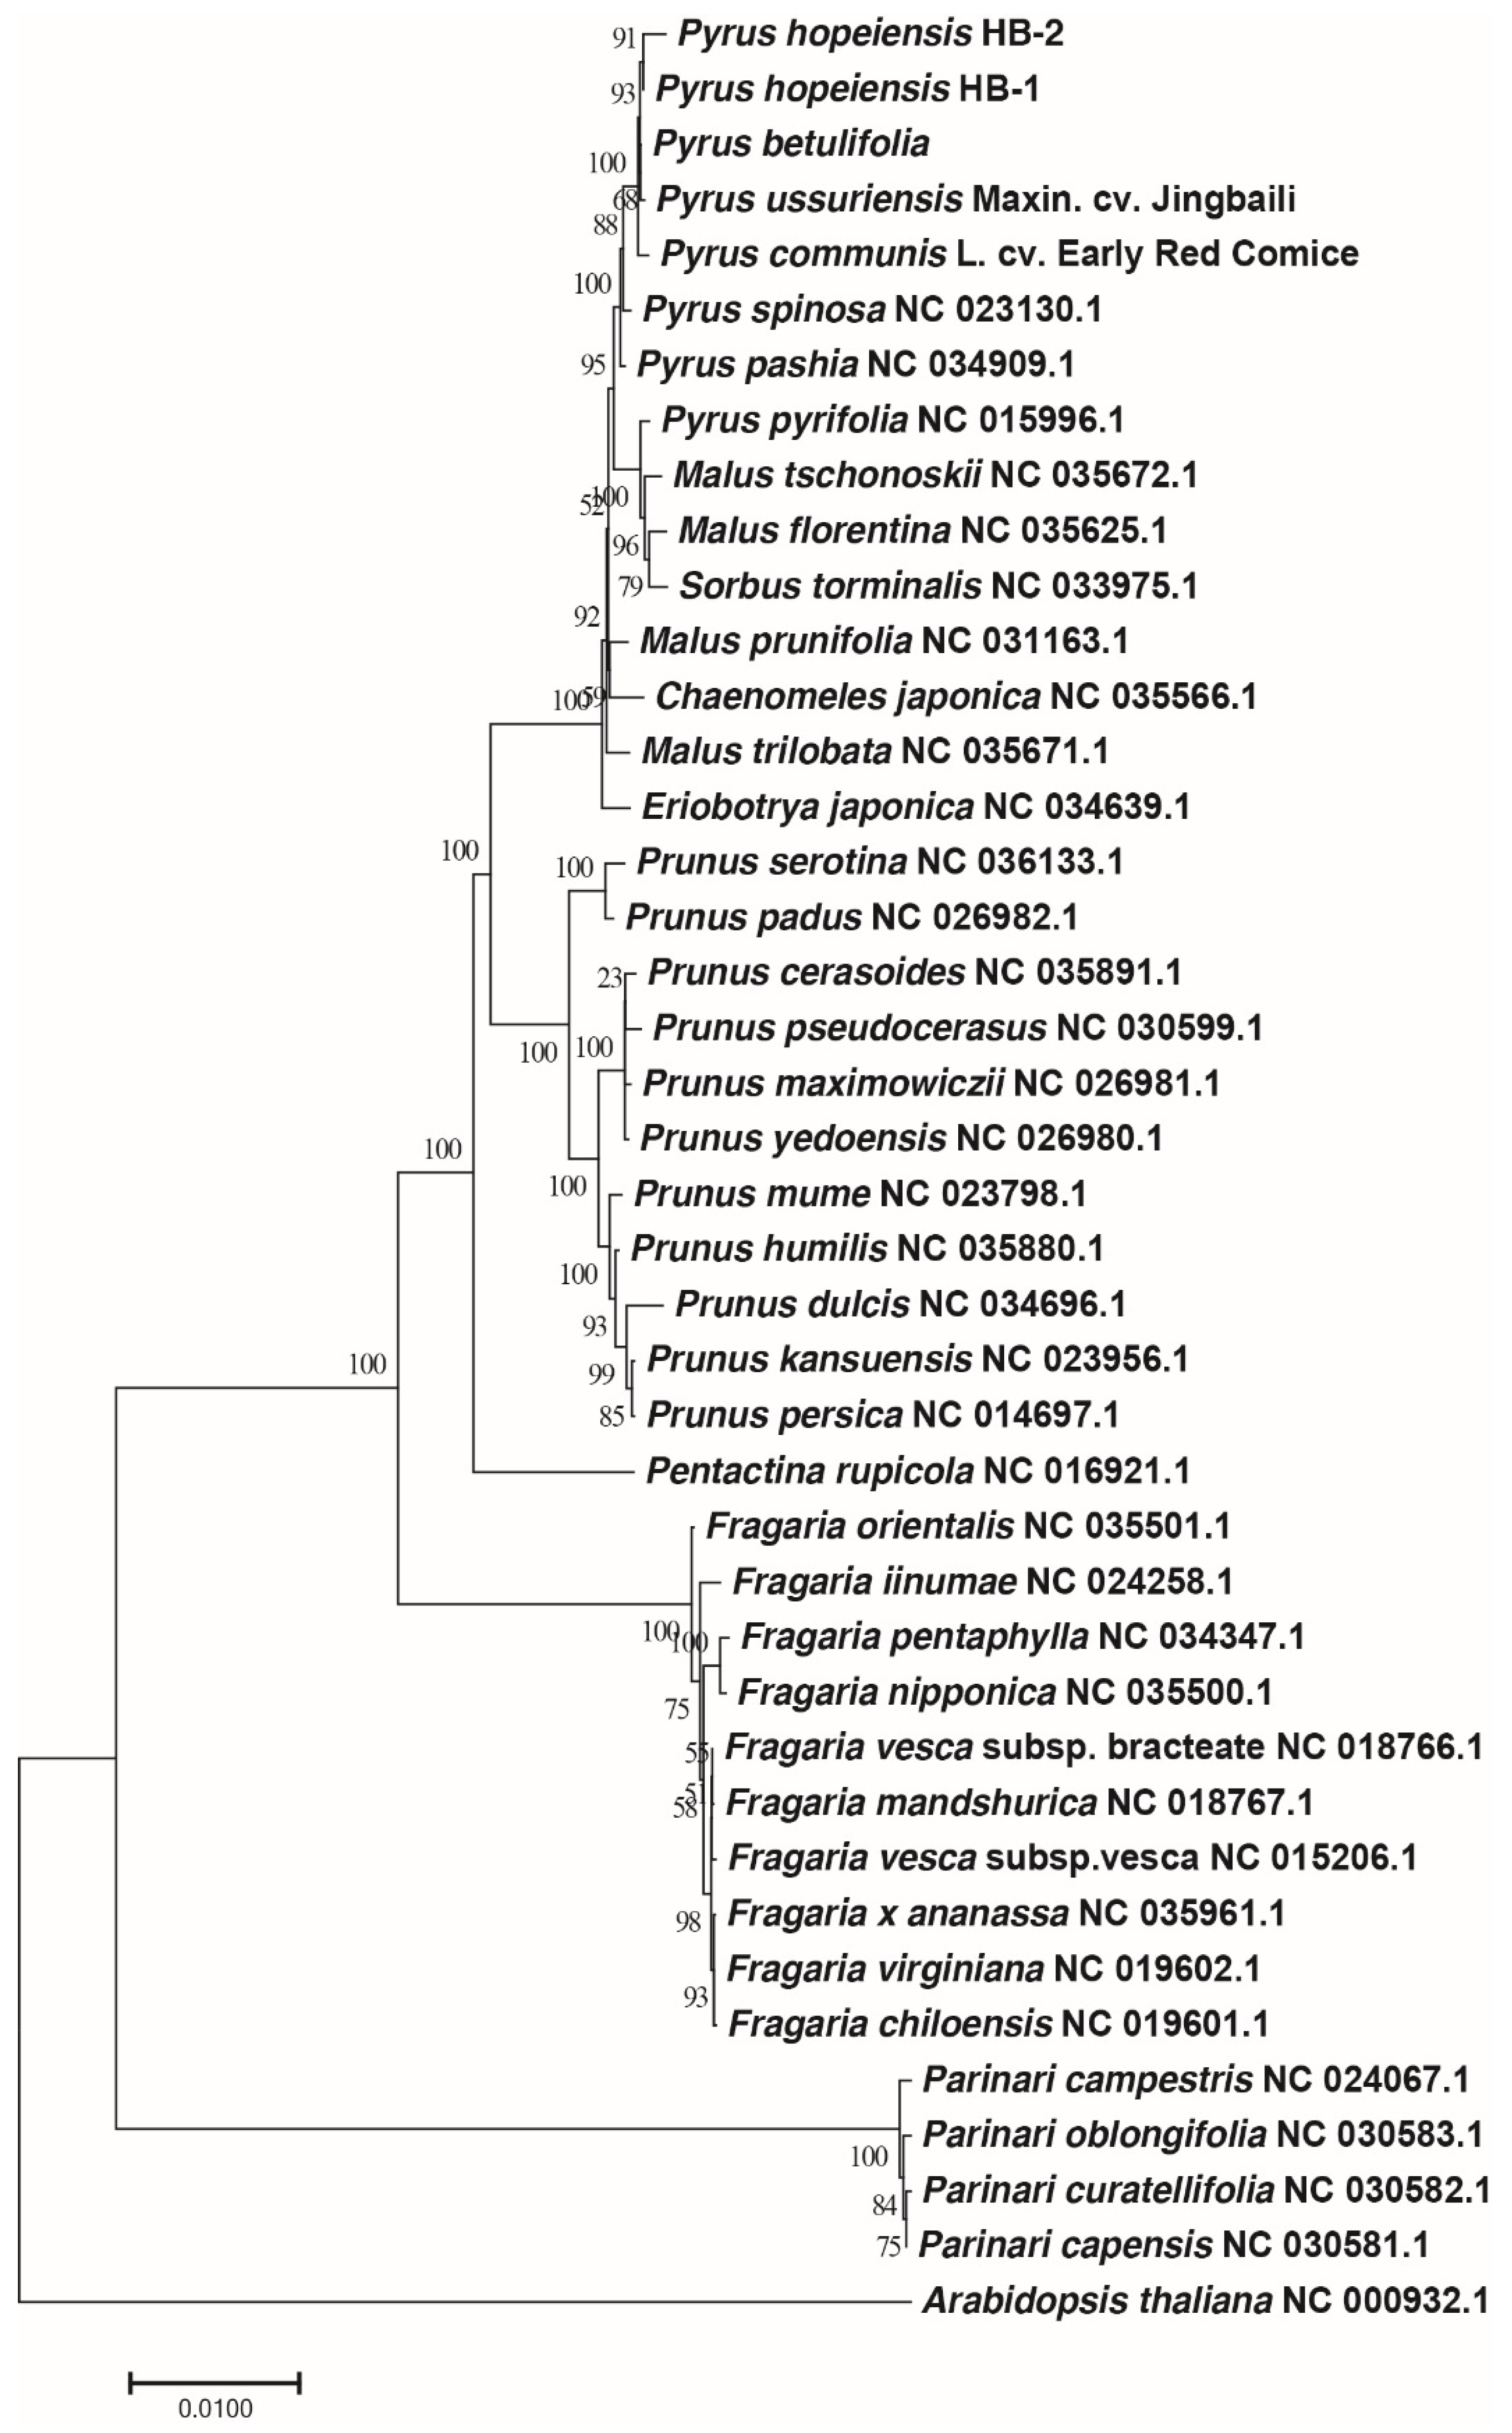
2.9. Phylogenetic Analysis

To gain an insight into the position of Pyrus within the Rosaceae, a molecular phylogenetic tree was constructed using 57 protein-coding genes (accD, atpA, atpE, atpH, atpI, csA, cemA, ndhA, ndhB, ndhC, ndhD, ndhE, ndhG, ndhH, ndhJ, ndhK, petA, petG, petL, petN, psaA, psaB, psaI, psbA, psbB, psbC, psbD, psbE, psbF, psbH, psbJ, psbM, psbN, psbT, rbcL, rpl14, rpl16, rpl2, rpl22, rpl23, rpl33, rpoA, rpoC1, rps11, rps12, rps14, rps15, rps18, rps19, rps2, rps3, rps4, rps7, rps8, ycf2, ycf3, ycf4)from the chloroplast genomes of 36 Rosaceae, which were downloaded from GenBank, and using Arabidopsis thaliana as the outgroup. The resulting phylogenetic tree was consistent with the traditional plant morphological taxonomy (Figure 7), which can be divided into three sections: Maloideae, Prunoideae, and Rosoideae. The Maloideae include Pyrus, Malus, Sorbus L., and Eriobotrya. Prunus lies within the Prunoideae, and Fragaria is included in the Rosoideae. The phylogenetic relationship of the Prunoideae was closer than that of the Rosoideae to the Maloideae, and the relationship between Malus and Pyrus was the closest. Within Pyrus, the relationship between P. hopeiensis HB-1 and P. hopeiensis HB-2 was the closest, and the relationship between P. betulifolia and P. ussuriensis Maxin. cv. Jingbaili was closer than that between other Pyrus and P. hopeiensis. In addition, it can be seen from the evolutionary tree that Rosoideae is a subfamily that split off from the evolutionary tree.

3. Discussion

Pyrus hopeiensis is a valuable wild resource of Pyrus, which belongs to the family Rosaceae. Because of its limited distribution and population decline, P. hopeiensis is listed among “the wild plants with tiny population” in China. It belongs to one of 13 species of Pyrus present in China. In this study, the chloroplast genomes of the two genotypes P. hopeiensis HB-1 and P. hopeiensis HB-2 and those of three other major pear plants, P. ussuriensis Maxin. cv. Jingbaili, P. communis L. cv. Early Red Comice, and P. betulifolia, were analyzed using high-throughput sequencing for comparative analysis. The chloroplast genome of Pyrus, like those of most higher plants, is a typical tetrad consisting of two reverse repeat IR regions and small and large single copy fragments [24]. There was a 46 bp difference in the chloroplast genome size between the two P. hopeiensis, which was located in the LSC region. Compared with the other three Pyrus species, the total genome length was <225 bp, and the gene number, gene type, gene sequence, LSC, IR, and SSC lengths and GC content were similar. This strongly suggests that chloroplast genomes are highly conserved [25]. The encoded genes of the chloroplast genome are divided into three categories based on their functions. The first is related to chloroplast gene expression, such as tRNAs, rRNAs, and three subunits encoding chloroplast RNA polymerase synthesis. The second is related to photosynthesis, and the third consists of other biosynthesis genes and some genes of unknown function, such as mat and ycf [26]. The chloroplast genes of Pyrus are similar in composition.
The genomic sequence of the P. hopeiensis HB-1 chloroplast was used as a reference sequence to detect single-nucleotide polymorphisms (SNPs) and indels in the other four Pyrus species. The results showed a significantly higher variation in the non-coding region than in the coding region and more mutation sites in the intergenic region of the psbA-trnQ_TTG, rpl18-rps20, and trnT-TGT_trnF_GAA genes, which could be used for evolutionary analysis of Pyrus. The chloroplast genomes of Pyrus show obvious codon preference and similar codon use frequency. Furthermore, the third chloroplast codon has a higher A/T preference. This phenomenon is common in the chloroplast genomes of other higher plants [27]. Although the IR region is highly conserved, the expansion and contraction of the IR region is a common characteristic of the chloroplast genome. The degree of expansion of the IR/SC boundary is similar among the five Pyrus species, the two P. hopeiensis genotypes contain few genes with different extension positions, and any differences are very small, which is useful in the classification of Pyrus, as it can be used as a basis to identify the evolution of the chloroplast genome. The classification and identification of pear species in this study can be utilized for the preservation of pear germplasm resources. The initial identification of species and varieties of Pyrus was mainly based on morphological features (leaves, petioles, floral organs, sepals, hairs, fruits, and ventricles) and geographical distribution. For example, based on an investigation of morphological characteristics and natural distribution, Chinese taxonomists believe that P. hopeiensis, P. phaeocarpa, P. sinkiangensis, and P. serrulata were all formed by natural crosses [28]. Yu [29] divided Pyrus from China into 13 species based on their serrated leaf margins, and these included P. hopeiensis, P. betulifolia, P. ussuriensis, P. phaeocarpa, P. bretschneideri, P. pyrifolia, P. pashia, P. armeniacaefolia, P. calleryana, P. pseudopashia, P. serrulata, P. sinkiangensis, and P. xerophila. Anatomical studies in Wang Yingzhong [30] revealed that the anatomical structures of P. betulifolia and P. ussuriensis, and P. bretschneideri, P. pyrifalia, and P. communis were similar. The results showed that the relationship between P. ussuriensis and P. betulifolia, P. bretschneideri, and P. pyrifalia was close. However, it is easy to cross Pyrus species and there are no obvious differences in the biological and morphological characteristics among species and varieties, which greatly increases the difficulty of establishing its phylogenetic evolution and classification.
Pollen morphological identification, cytological markers, isozymes, and other methods have also been studied with a view to classifying Pyrus. The pollen morphology of P. sinkiangensis is similar to that of the Western pear, indicating a close relationship [31]. The pollen morphology of the Western pear is obviously different from that of the Oriental pear. The pollen morphology of P. calleryana has many primitive characteristics, and it is a primitive species of Pyrus in China. The pollen morphology of P. bretschneideri, also present in China, has the characteristics of both P. pyrifalia and P. ussuriensis, and may be a natural hybrid of P. pyrifalia and P. ussuriensis. Cytological markers enabled the analysis of the number, banding, karyotype, and meiosis behavior of the chromosomes. P. phaeocarpa has a similar karyotype to that of P. betulifolia, and those of P. sinkiangensis, P. hopeiensis, and P. serrulata were also similar [32,33]. In 1983, Lin Bonian and Shen Dexu [34] proved, through the use of the peroxidase isozyme, that P. bretschneideri and P. pyrifolia were closely related. However, these methods have few characteristic sites, poor polymorphism, and low accuracy, and provide a limited amount of information. To date, the relationships among Pyrus species, their origin, evolution of cultivation systems, and the origin of some suspicious species and hybrids remain unclear.
In recent years, molecular markers based on DNA, such as restriction fragment length polymorphisms (RFLPs) and simple sequence repeats (SSRs) have been used to investigate the genetic relationships, genetic diversity, and germplasm of Pyrus. However, there remain some deficiencies in the study of the interspecific relationships and origins of hybrids. Results based on random amplification of polymorphic DNA (RAPD) showed that the origin of P. sinkiangensis involved the crossing of many Eastern and Western pear species and that the genetic relationship between P. bretschneideri and P. pyrifolia is very close [35]. RAPD, inter sequence simple repeats (ISSR), and other DNA markers showed that P. hopeiensis, P. betulifolia and P. phaeocarpa were closely related to each other. In the same way, P. phaeocarpa is considered to be a hybrid of P. betulifolia and P. ussuriensis, whereas P. hopeiensis is a hybrid of P. phaeocarpa and P. ussuriensis. In a study using RAPD, P. hopeiensis and P. phaeocarpa shared some spectral bands with P. betulifolia and P. ussuriensis [36,37,38]. Zheng et al. identified a close relationship between P. ussuriensis and P. hopeiensis using internal transcribed spacer (ITS) sequences, which is consistent with the results in our study [39].
Because the chloroplast genome is the second-largest genome after the nuclear genome, it is maternally inherited in most angiosperms; thus it reflects the maternal evolutionary history, and this helps us to understand the maternal ancestors of suspected hybrids. The coding and non-coding regions of the chloroplast genome evolve at different rates, making them suitable for systematic research at different levels. The coding region is highly conserved and is only suitable for phylogenetic studies of families, orders, and higher taxonomic levels, whereas the non-coding regions are less constrained by function and the rapid evolutionary rate is suitable for plant phylogenetic studies at interspecific and subspecies levels. At present, the successful design of a set of universal primers for the chloroplast gene non-coding regions (such as trnS-psbcc, trnL-trnF and accD-pasI) [40] has made the study of chloroplast non-coding regions a hot topic in studies of the systematic relationship of Pyrus. Phylogenetic trees based on combinations of the sequences of trnL-trnF and accD-psaI in the chloroplast non-coding regions have further confirmed the theory of an independent evolution of the Oriental pear and the Western pear from the background of matrilineal evolution, and have shown the close relationship between P. bretschneideri and P. pyrifolia [41]. A study of the trnL-trnF region of cpDNA showed that P. sinkiangensis is closely related to the Western pear and the Oriental pear; the relationship between P. betulifolia and P. ussuriensis is close; P. bretschneideri is a hybrid of P. ussuriensist, P. phaeocarpa, and P. pyrifolia; and that the Western pear and Oriental pear are related to each other [42]. The sequences of these regions are highly conserved, with only limited sites available to provide information to unravel the phylogeny of Pyrus. However, no comprehensive and systematic cpDNA sequence analysis of Pyrus exists in China. To further our understanding of the inter-species relationships of Pyrus and to reveal the origin of hybrids and explore the evolutionary model of Eastern and Western pears, a wider range of representative species and varieties of Eastern and Western pears must be selected, and the nuclear gene fragments inherited by their parents should be combined, especially the low copy nuclear gene introns.

4. Materials and Methods

4.1. Plant Materials

In early May 2017, fresh leaves were collected from P. hopeiensis HB-1, P. hopeiensis HB-2, and three local Pyrus species, P. ussuriensis Maxin. cv. Jingbaili (which belongs to the P. ussuriensis family), P. communis L. cv. Early Red Comice (a high-quality variety of Western pear native to the United Kingdom) and P. betulifolia (most widely used in northern China as pear rootstocks) in Changli, Hebei Province and were stored before being transported to ORI-GENE Ltd., a science and technology company based in Beijing, China, for chloroplast genome sequencing.

4.2. DNA Sequencing, Genome Assembly, and Validation

The total DNA of fresh young leaves was extracted using a plant DNA extraction kit (Tiangen, Beijing, China). Agarose gel electrophoresis was used to detect DNA integrity, and purity and concentration were ascertained. The Illumina HiSeq platform was used to sequence the total DNA. After sequencing, the raw data was initially screened to remove low quality regions affecting the data quality and subsequent analysis needed to obtain the expected clean data. The SOAPdenovo2.01 [43] oligonucleotide analysis package was used to assemble the contig sequence. BLAT36 [44] was used to locate the assembled long sequence on the chloroplast reference genome of the relative species and to obtain the relative position of the contig sequence to enable splicing of the contig according to its relative position, and to correct assembly errors. A full-length frame map of the chloroplast genome was obtained. GapCloser software was used to fill gaps on the frame map sequence with high-quality short sequences. Any remaining gaps and suspected regions were supplemented and confirmed by generation sequencing, and the small single copy (SSC) and inverted repeat (IR) region junctions were verified. Finally, a complete ring chloroplast genome sequence was obtained.

4.3. Gene Annotation

CpGAVAS [45] was used to annotate the gene and the final annotation results were obtained by artificial correction. First, the results of Blastx, BLASTn, protein2genome, and est2genome [46] were integrated to predict the protein coding gene and the rRNA gene. Then, tRNA was identified using tRNAscan [47] and ARAGORN [48]. Finally, the reverse repeat region IR was identified using Vmatch [49]. Chloroplast genome mapping was performed using OrganellarGenomeDRAW [50] (http://ogdraw.mpimp-golm.mpg.de/index.shtml) based on the annotated results.
The protein and coding sequences (CDS) of each sample were extracted from the annotated files of each sample and the pairwise protein sequences aligned using MUSCLE software. The aligned protein sequences were converted to DNA sequences using PAL2NAL. KaKs_Calculator2.0 [51] software (https://sourceforge.net/projects/kakscalculator2) was then used to calculate Ka/Ks, which was used to analyze the selection pressure on different Pyrus species during the evolutionary process. Chloroplast genome sequences of 36 Rosaceae species were selected from NCBI and 57 common protein coding genes were used to explore the evolution of the Pyrus chloroplast genome, using Arabidopsis thaliana as the outgroup. The taxonomic status was confirmed. The annotated files of all of the genomes were downloaded from NCBI and the protein sequences of any genes shared among the chloroplast genomes of all of the species were extracted. Each gene was placed in a file in which each genome contained only one protein sequence. MUSCLE was used to make multiple sequence alignments for each file. The first and last sequences were aligned according to the genome source to obtain a growing alignment sequence: final.fa. MEGA7.0 software was then used to construct a neighbor-joining tree and the CGView Server was used to analyze the genetic variation among the chloroplast genomes of the five Pyrus species.

5. Conclusions

In this study, we reported the de novo sequencing results of P. hopeiensis chloroplast genomes. The length of the chloroplast genome of P. hopeiensis HB-1 is 159,935 bp, which is 46 bp longer than that of P. hopeiensis HB-2. The SSC and IR regions of the two Pyrus genotypes were the same length, with the only difference present in the LSC region. A total of 118 genes were identified in P. hopeiensis HB-1, and it only lacked the MATK protein-coding gene that was associated with biosynthesis in P. hopeiensis HB-2. The GC content of P. hopeiensis HB-1 was only 0.02% higher than that of P. hopeiensis HB-2. A total of 11 genes in the chloroplast genome of P. hopeiensis HB-1 contained introns, and an additional trnI-TAT gene not present in P. hopeiensis HB-2. ycf3 is the only gene that contained two introns. The chloroplast genome structure and size, gene species, gene number, and GC content of P. hopeiensis were similar to those of the other three Pyrus species investigated. Almost all of the protein coding sequences and amino acid codons showed an obvious codon preference. Selection pressure analysis revealed that the chloroplast genomes of different pears were affected by different environmental pressures during the evolutionary process, which may account for the differences in gene numbers among the five Pyrus species. Phylogenetic analysis strongly supports the status of Pyrus in the Rosaceae. This study adds to our knowledge of the molecular evolution of Pyrus, and will be of use for the genetic breeding and chloroplast engineering of Pyrus.

Supplementary Materials

Supplementary materials can be found at https://www.mdpi.com/1422-0067/19/10/3262/s1.

Author Contributions

M.Y. designed the research; Y.L., J.Z. and J.X. collected the samples; Y.L., L.L. and L.G. performed the experiments and analysis; Y.L. and J.Z. wrote the manuscript; all authors revised the manuscript.

Funding

This research received no external funding.

Acknowledgments

This research was supported by the National Key Research and Development Plan “Research on protection and restoration of typical small populations of wild plants” (Grant No. 2016YFC0503106).

Conflicts of Interest

The authors declare no conflict of interest.

References

  1. Chai, M.L.; Shen, D.X. Status and Prospects of Pear Breeding in China. J. Fruit Sci. 2003, 5, 379–383. [Google Scholar]
  2. Yu, D.J. Taxonomy of the Fruit Tree in China; China Agriculture Press: Beijing, China, 1979; p. 122. [Google Scholar]
  3. Jiang, X.F.; Chu, Q.G.; Zhang, C.S. Studies on the classification and evolution of the genus pyrus in China. J. Laiyang Agric. Coll. 1992, 9, 18–21. [Google Scholar]
  4. Pu, F.S.; Huang, L.S.; Sun, B.J.; Li, S.L. Study on the chromosome number of wild and cultivated pears (Pyrus sp.) in China. Acta Hortic. Sin. 1985, 12, 155–158. [Google Scholar]
  5. Neuhaus, H.E.; Ernes, M.J. Nonphotosyntiietic Metabolism in Plastids. Annu. Rev. Plant Physiol. Plant Mol. Biol. 2000, 51, 111–140. [Google Scholar] [CrossRef] [PubMed]
  6. Dumolin, S.; Demesure, B.; Etit, R.J. Inheritance of chloroplast and mitochondrial genomes in pedunculate oak investigated with an efficient PCR method. Theor. Appl. Genet. 1995, 91, 1253–1256. [Google Scholar] [CrossRef] [PubMed]
  7. Xing, S.C. Progress in Chloroplast Genome Analysis. Prog. Biochem. Biophys. 2008, 35, 21–28. [Google Scholar]
  8. Bausher, M.G.; Singh, N.D.; Lee, S.B.; Jansen, R.K.; Daniell, H. The complete chloroplast genome sequence of Citrus sinensis (L.) Osbeck var ‘Ridge Pineapple’: Organization and phylogenetic relationships to other angiosperms. BMC Plant Biol. 2006, 6, 21. [Google Scholar] [CrossRef] [PubMed]
  9. Guisinger, M.M.; Chumley, T.W.; Kuehl, J.V.; Boore, J.L.; Jansen, R.K. Implications of the plastid genome sequence of Typha (Typhaceae, Poales) for understanding genome evolution in Poaceae. J. Mol. Evol. 2010, 70, 149–166. [Google Scholar] [CrossRef] [PubMed]
  10. Tao, X.L.; Ma, L.C.; Nie, B.; Wang, Y.R.; Liu, Z.P. The draft and characterization of the complete chloroplast genome of Vicia sativa cv. Lanjian No. 3. Pratacult. Sci. 2017, 34, 321–330. [Google Scholar]
  11. Jansen, R.K.; Saski, C.; Lee, S.B.; Hansen, A.K.; Daniell, H. Complete plastid genome sequences of three Rosids (Castanea, Prunus, Theobroma): Evidence for at least two independent transfers of rpl22 to the nucleus. Mol. Biol. Evol. 2011, 28, 835–847. [Google Scholar] [CrossRef] [PubMed]
  12. Ueda, M.; Fujimoto, M.; Arimura, S.I.; Murata, J.; Tsutsumi, N.; Kadowaki, K.I. Loss of the rp132 gene from the chloroplast genome and subsequent acquisition of a preexisting transit peptide within the nuclear gene in populus. Gene 2007, 402, 51–56. [Google Scholar] [CrossRef] [PubMed]
  13. Cheng, H.; Ge, C.F.; Zhang, H.; Qiao, Y. Advances on Chloroplast Genome Sequencing and Phylogenetic Analysis in Fruit Trees. J. Nucl. Agric. Sci. 2018, 32, 58–69. [Google Scholar]
  14. Clegg, M.T.; Gaut, B.S.; Learn, G.H.; Morton, B.R. Rates and patterns of chloroplast DNA evolution. Proc. Natl. Acad. Sci. USA 1994, 91, 6795–6801. [Google Scholar] [CrossRef] [PubMed]
  15. Jiang, W.; Lyu, B.B.; He, J.H.; Wang, J.B.; Wu, X.; Wu, G.G.; Bao, D.P.; Chen, M.J.; Zhang, J.S.; Tan, Q.; et al. Codon usage bias in the straw mushroom Volvariella volvacea. Chin. J. Biotechnol. 2014, 30, 1424–1435. (In Chinese) [Google Scholar]
  16. Li, Y.; Kuang, X.J.; Zhu, X.X.; Zhu, Y.J.; Sun, C. Codon usage bias of Catharanthus roseus. China J. Chin. Mater. Med. 2016, 41, 4165–4168. [Google Scholar]
  17. Zuo, L.H.; Shang, A.Q.; Zhang, S.; Yu, X.Y.; Ren, Y.C.; Yang, M.S.; Wang, J.M. The first complete chloroplast genome sequences of Ulmus species by de novo sequencing: Genome comparative and taxonomic position analysis. PLoS ONE 2017, 12, e0171264. [Google Scholar] [CrossRef] [PubMed]
  18. Yang, M.; Zhang, X.; Liu, G.; Yin, Y.; Chen, K.; Yun, Q.; Zhao, D.; Al-Mssallem, I.S.; Yu, J. The complete chloroplast genome sequence of date palm (Phoenix dactylifera L.). PLoS ONE 2010, 5, el2762. [Google Scholar] [CrossRef] [PubMed]
  19. Nie, X.; Lv, S.; Zhang, Y.; Du, X.; Wang, L.; Biradar, S.S.; Tan, X.; Wan, F.; Weining, S. Complete chloroplast genome sequence of a major invasive species, crofton weed (Ageratina adenophord). PLoS ONE 2012, 7, e36869. [Google Scholar] [CrossRef] [PubMed]
  20. Tangphatsornruang, S.; Sangsrakru, D.; Chanprasert, J.; Uthaipaisanwong, P.; Yoocha, T.; Jomchai, N.; Tragoonrung, S. The chloroplast genome sequence of mung bean (Vigna radiatd) determined by high-throughput pyrosequencing: Structural organization and phylogenetic relationships. DNA Res. 2010, 17, 11–22. [Google Scholar] [CrossRef] [PubMed]
  21. Yi, D.K.; Kim, K.J. Complete chloroplast genome sequences of important oil seed crop Sesamum indicum L. PLoS ONE 2012, 7, e35872. [Google Scholar] [CrossRef] [PubMed]
  22. Quan, X.; Zhou, S.L. Molecular identification of species in Prunus sect. Persica (Rosaceae), with emphasis barcodes for plants. J. Syst. Evol. 2011, 49, 138–145. [Google Scholar] [CrossRef]
  23. Wand, L.; Dong, W.P.; Zhou, S.L. Structural Mutations and Reorganizations in Chloroplast Genomes of Flowering Plants. Acta Bot. Boreal. Occident. Sin. 2012, 32, 1282–1288. [Google Scholar]
  24. Yu, D.J.; Gu, C.Z. Flora Reipublicae Popularis Sinicae; Bejing Science Press: Beijing, China, 1974; Volume 36. (In Chinese) [Google Scholar]
  25. Jansen, R.K.; Raubeson, L.A.; Boore, J.L.; Pamphilis, C.W.; Chumley, T.W.; Haberle, R.C.; Wyman, S.K.; Alverson, A.J.; Peery, R.; Herman, S.J.; et al. Methods for obtaining and analyzing whole chloroplast genome sequences. Methods Enzymol. 2005, 395, 348–384. [Google Scholar] [PubMed]
  26. Wu, Y.; Zhou, H. Research progress of sugarcane chloroplast genome. J. South. Agric. 2013, 44, 17–22. [Google Scholar]
  27. Luo, R.; Liu, B.; Xie, Y.; Li, Z.; Huang, W.; Yuan, J.; He, G.; Chen, Y.; Pan, Q.; Liu, Y.; et al. SOAPdenovo2: An empirically improved memory-ecient short-read de novo assembler. Gigascience 2012, 1, 18. [Google Scholar] [CrossRef] [PubMed]
  28. Mardis, E.R. The impact of next-generation sequencing technology on genetics. Trends Genet. 2008, 24, 133–141. [Google Scholar] [CrossRef] [PubMed]
  29. Szmidt, A.E.; Aldén, T.; Hällgren, J.E. Paternal inheritance of chloroplast DNA in larix. Plant Mol. Biol. 1987, 9, 59–64. [Google Scholar] [CrossRef] [PubMed]
  30. Palmer, J.D. Comparative organization of chloroplast genomes. Annu. Rev. Genet. 1985, 19, 325–354. [Google Scholar] [CrossRef] [PubMed]
  31. Nock, C.J.; Waters, D.L.; Edwards, M.A.; Bowen, S.G.; Rice, N.; Cordeiro, G.M.; Henry, R.J. Chloroplast genome sequences from total DNA for plant identification. Plant Biotechnol. J. 2010, 9, 328–333. [Google Scholar] [CrossRef] [PubMed] [Green Version]
  32. Pu, F.S.; Lin, S.H.; Chen, R.Y.; Song, W.Q.; Li, X.L. Studies on karyotype of pyrus in China(II). Acta Horticult. Sin. 1986, 13, 87–90. [Google Scholar]
  33. Pu, F.S.; Lin, S.H.; Song, W.Q.; Chen, R.Y.; Li, X.L. Studies on karyotype of pyrus in China(I). J. Wuhan Bot. Res. 1985, 3, 381–387. [Google Scholar]
  34. Lin, B.N.; Shen, D.X. Studies on the germplasmic characteristics of Pyrus by use of isozymic patterns. Acta Agric. Univ. Zhejiang Gensis 1983, 9, 235–242. [Google Scholar]
  35. Teng, Y.W.; Tanabe, K.; Tamura, F.; Itai, A. Genetic relationships of pear cultivars in Xin Jiang, China, as measured by RAPD markers. J. Horticult. Sci. Biotechnol. 2001, 76, 771–779. [Google Scholar] [CrossRef]
  36. Teng, Y.; Tanabe, K.; Tamura, F.; Itai, A. Genetic relationships of Pyrus species and cultivars native to East Asia revealed by randomly amplified polymorphic DNA markers. J. Am. Soc. Hortic. Sci. Biotech. 2002, 127, 262–270. [Google Scholar]
  37. Teng, Y.W.; Tanabe, K. Reconsideration on the origin of cultivated pears native to East Asia. 4thInternational Symposium of Taxonomy and Nomenclature of Cultivated Plants. Acta Hortic. 2004, 634, 175–182. [Google Scholar] [CrossRef]
  38. Teng, Y.W. Advances in the research on phylogeny of the genus Pyrus and the origin of pear cultivars native to East Asia. J. Fruit Sci. 2017, 34, 370–378. [Google Scholar]
  39. Zheng, X.Y.; Cai, D.Y.; Yao, L.H.; Teng, Y.W. Non-concerted ITS evolution, early origin and phylogenetic utility of ITS pseudogenes in Pyrus. Mol. Phylogenet. Evol. 2008, 48, 892–903. [Google Scholar] [CrossRef] [PubMed]
  40. Taberlet, P.; Gielly, L.; Pautou, G.; Bouvet, J. Universal primers for amplification of three non-coding regions of chloroplast DNA. Plant Mol. Biol. 1991, 17, 1105–1109. [Google Scholar] [CrossRef] [PubMed]
  41. Hu, C.Y.; Zheng, X.Y.; Teng, Y.W. Characterization and Phylogenetic Utility of Non-coding Chloroplast Regions trnL-trnF and accD-psaI in Pyrus. Acta Hortic. Sin. 2011, 38, 2261–2272. [Google Scholar]
  42. Liu, Y. Studies on Chloroplast DNA Diversity of Chinese Pear; Capital Normal University: Beijing, China, 2006. [Google Scholar]
  43. Raghvendra, A.S. Photosynhcsis: A Comprehensive Treatise; Cambridge University Press: Cambridge, UK, 1998; pp. 72–86. [Google Scholar]
  44. Kent, W.J. BLAT-the BLAST-like alignment tool. Genome Res. 2002, 12, 656–664. [Google Scholar] [CrossRef] [PubMed]
  45. Liu, C.; Shi, L.; Zhu, Y.; Chen, H.; Zhang, J.; Lin, X.; Guan, X. CpGAVAS, an integrated web server for the annotation, visualization, analysis, and GenBank submission of completely sequenced chloroplast genome sequences. BMC Genom. 2012, 13, 715. [Google Scholar] [CrossRef] [PubMed]
  46. Mott, R. EST_GENOME: A program to align spliced DNA sequences to unspliced genomic DNA. Comput. Appl. Biosci. 1997, 13, 477–478. [Google Scholar] [CrossRef] [PubMed]
  47. Lowe, T.M.; Eddy, S.R. tRNAscan-SE: A program for improved detection of transfer RNA genes in genomic sequence. Nucleic Acids Res. 1997, 25, 955–964. [Google Scholar] [CrossRef] [PubMed]
  48. Laslett, D.; Canback, B. ARAGORN, a program to detect tRNA genes and tmRNA genes in nucleotide sequences. Nucleic Acids Res. 2004, 32, 11–16. [Google Scholar] [CrossRef] [PubMed] [Green Version]
  49. Abouelhoda, M.I.; Kurtz, S.; Ohlebusch, E. Replacing suffix trees with enhanced suffix arrays. J. Disc. Algo. 2004, 2, 53–86. [Google Scholar] [CrossRef]
  50. Lohse, M.; Drechsel, O.; Kahlau, S.; Bock, R. OrganellarGenomeDRAW—A suite of tools for generating physical maps of plastid and mitochondrial genomes visualizing expression data sets. Nucleic Acids Res. 2013, 41, W575–W581. [Google Scholar] [CrossRef] [PubMed]
  51. Wang, D.P.; Zhang, Y.B.; Zhang, Z.; Zhu, J.; Yu, J. KaKs_Calculator 2.0: A toolkit incorporating gamma-series methods and sliding window strategies. Genom. Proteom. Bioinform. 2010, 8, 77–80. [Google Scholar] [CrossRef]
Figure 1. Gene maps of Pyrus hopeiensis HB-1chloroplast genomes.
Ijms 19 03262 g001
Figure 2. Ka/Ks value of five Pyrus species. (a)–(d) represent the Ka/Ks values of Pyrus betulifolia, Pyrus communis L. cv. Early Red Comice, Pyrus ussuriensis Maxin. cv. Jingbaili, and Pyrus hopeiensis HB-2, respectively, with respect to Pyrus hopeiensis HB-1.
Ijms 19 03262 g002
Figure 3. Indels (≥5 bp) identified based on multiple sequence alignment of five Pyrus cp genomes. Insertions are shown above and deletions below the horizontal axis. Indel distribution was positioned using Pyrus hopeiensis HB-1 as a reference.
Ijms 19 03262 g003
Figure 4. Codon distribution of all merged protein-coding genes. Red indicates a higher frequency and blue indicates a lower frequency.
Ijms 19 03262 g004
Figure 5. Co-linear analysis of various plant chloroplast genomes.
Ijms 19 03262 g005
Figure 6. IR contraction analysis of Rosaceae.
Ijms 19 03262 g006
Figure 7. The ML phylogenetic tree of the Rosaceae clade based on same protein-coding genes. Numbers above or below the nodes are bootstrap support values.
Ijms 19 03262 g007
Table 1. Genes of the cp genome of P. hopeiensis HB-1.
FunctionsFamily NameCodeList of Genes
Self-replicationSmall subunit of ribosomerpsrps2, rps3, rps4, rps7a, rps8, rps11, rps12abe, rps14, rps15, rps18, rps19
rRNA Genesrrnrrn4.5Sa, rrn5Sa, rrn16Sa, rrn23Sa
Large subunit of ribosomerplrpl2ab, rpl14, rpl16, rpl20, rpl22b, rpl23a, rpl32, rpl33, rpl36
DNA dependent RNA polymeraserporpoA, rpoB, rpoC1b, rpoC2
tRNA GenestrntrnC-GCA, trnD-GTC, trnE-TTC, trnF-GAA, trnfM-CAT, trnG-GCC, trnH-GTG, trnI-TATb, trnI-CATa, trnI-AATb, trnL-CAAa, trnL-TAG, trnM-CAT, trnN-GTTa, trnQ-TTG, trnP-TGG, trnR-TCT, trnR-ACGa, trnS-GCT, trnS-TGA, trnS-GGA, trnT-GGT, trnT-TGT, trnV-GACa, trnW-CCA, trnY-GTA
Genes for photosynthesisSubunits of ATP synthaseatpatpA, atpB, atpE, atpFd, atpH, atpI
Subunits of protochlorophyllide reductasechl
Subunits of NADH-dehydrogenasendhndhAb, ndhBb, ndhC, ndhD, ndhE, ndhF, ndhG, ndhH, ndhI, ndhJ, ndhK
Subunits of cytochrome b/f complexpetpetA, petG, petL, petN
Subunits of photosystem ⅠpsapsaA, psaB, psaC, psaJ, psaI
Subunits of photosystem ⅡpsbpsbA, psbB, psbC, psbD, psbE, psbF, psbH, psbI, psbJ, psbK, psbM, psbN, psbT, psbZ
Subunit of rubiscorbcrbcL
Other genesSubunit of Acetyl-CoA-carboxylaseaccaccD
Envelop membrane proteincemcemA
c-type cytochrome synthesis geneccsccsA
ProteaseclpclpPd
Translational initiation factorinf
MaturasematmatK
Elongation factortuf
Genes of unknown functionConserved open reading framesycfycf1, ycf2a, ycf3c, ycf4
a—Two gene copies in IRs; b—Gene containing a single intron; c—Gene containing two introns; d—Pseudogene; e—Gene divided into two independent transcription units.
Table 2. Comparison of the basic characteristics of chloroplast Genome in five Pyrus species.
Pyrus hopeiensis HB-1Pyrus hopeiensis HB-2Pyrus ussuriensis Maxin. cv. JingbailiPyrus communis L. cv. Early Red ComicePyrus betulifolia
Length (bp)159,935159,981160,059159,834160,058
GC content (%)36.5936.5736.5736.5836.57
AT content (%)63.4163.4363.4363.4263.43
LSC length (bp)87,96288,00888,07587,79488,025
SSC length (bp)19,20119,20119,21219,26019,261
IR length (bp)26,38626,38626,38626,39026,386
Gene number118119117114120
Pseudogene number22222
Gene number in IR regions3232313132
Protein-coding gene number7778757477
Protein-coding gene (%)64.2565.5564.1064.9164.17
rRNA gene number88888
rRNA (%)6.786.726.847.026.67
tRNA gene number3131323033
tRNA (%)26.2726.0527.3526.3226.50
Table 3. Statistics of gene introns in the chloroplast genome of five Pyrus species.
GeneStrandPyrus hopeiensis HB-1Pyrus hopeiensis HB-2Pyrus ussuriensis Maxin. cv. JingbailiPyrus communis L. cv. Early Red ComicePyrus betulifolia
trnI-TAT××
trnI-TAT+×××
trnN-ATT+×××
rpoC1
ycf3
rpl22
rpl2
ndhA
ndhB+
rpl2+
rps12
rps12+
trnI-AAT+×××
trnL-TAG××××
trnY-ATA+××××
Total151110121013
Table 4. Genes from the chloroplast genomes of Pyrus.
SpecieatpBmatKpetBpetDpsaCpsbIpsbLpsblRpl20Rpl36rps16ycf1trnI-GAUtrnA
Pyrus ussuriensis Maxin. cv. Jingbaili01001100110000
Pyrus communis L. cv. Early Red Comice01001100010000
Pyrus hopeiensis HB-110001100110100
Pyrus hopeiensis HB-211001100110100
Pyrus betulifolia11001100110100
Pyrus pyrifolia11110001101111
Pyrus spinosa11111100111100
Pyrus pashia11111110101200
Total number of missing genes21551177125277
Table 5. Genes from the chloroplast genomes of Pyrus.
SpecietrnA-UGCtrnG-GCCtrnG-UCCtrnI-AAUtrnI-GAUtrnI-UAUtrnK-UUUtrnLtrnL-UAAtrnN-AUUtrnV-UACtrnY-AUA
Pyrus ussuriensis Maxin. cv. Jingbaili010002000100
Pyrus communis L. cv. Early Red Comice010000000100
Pyrus hopeiensis HB-1010101000000
Pyrus hopeiensis HB-2010101000000
Pyrus betulifolia010002000001
Pyrus pyrifolia110010111010
Pyrus spinosa001000001000
Pyrus pashia211020101010
Total number of missing genes616664675667

