Dietary Sodium Restriction Reduces Arterial Stiffness, Vascular TGF-β-Dependent Fibrosis and Marinobufagenin in Young Normotensive Rats

 , ,
, , 
Abstract

1. Introduction
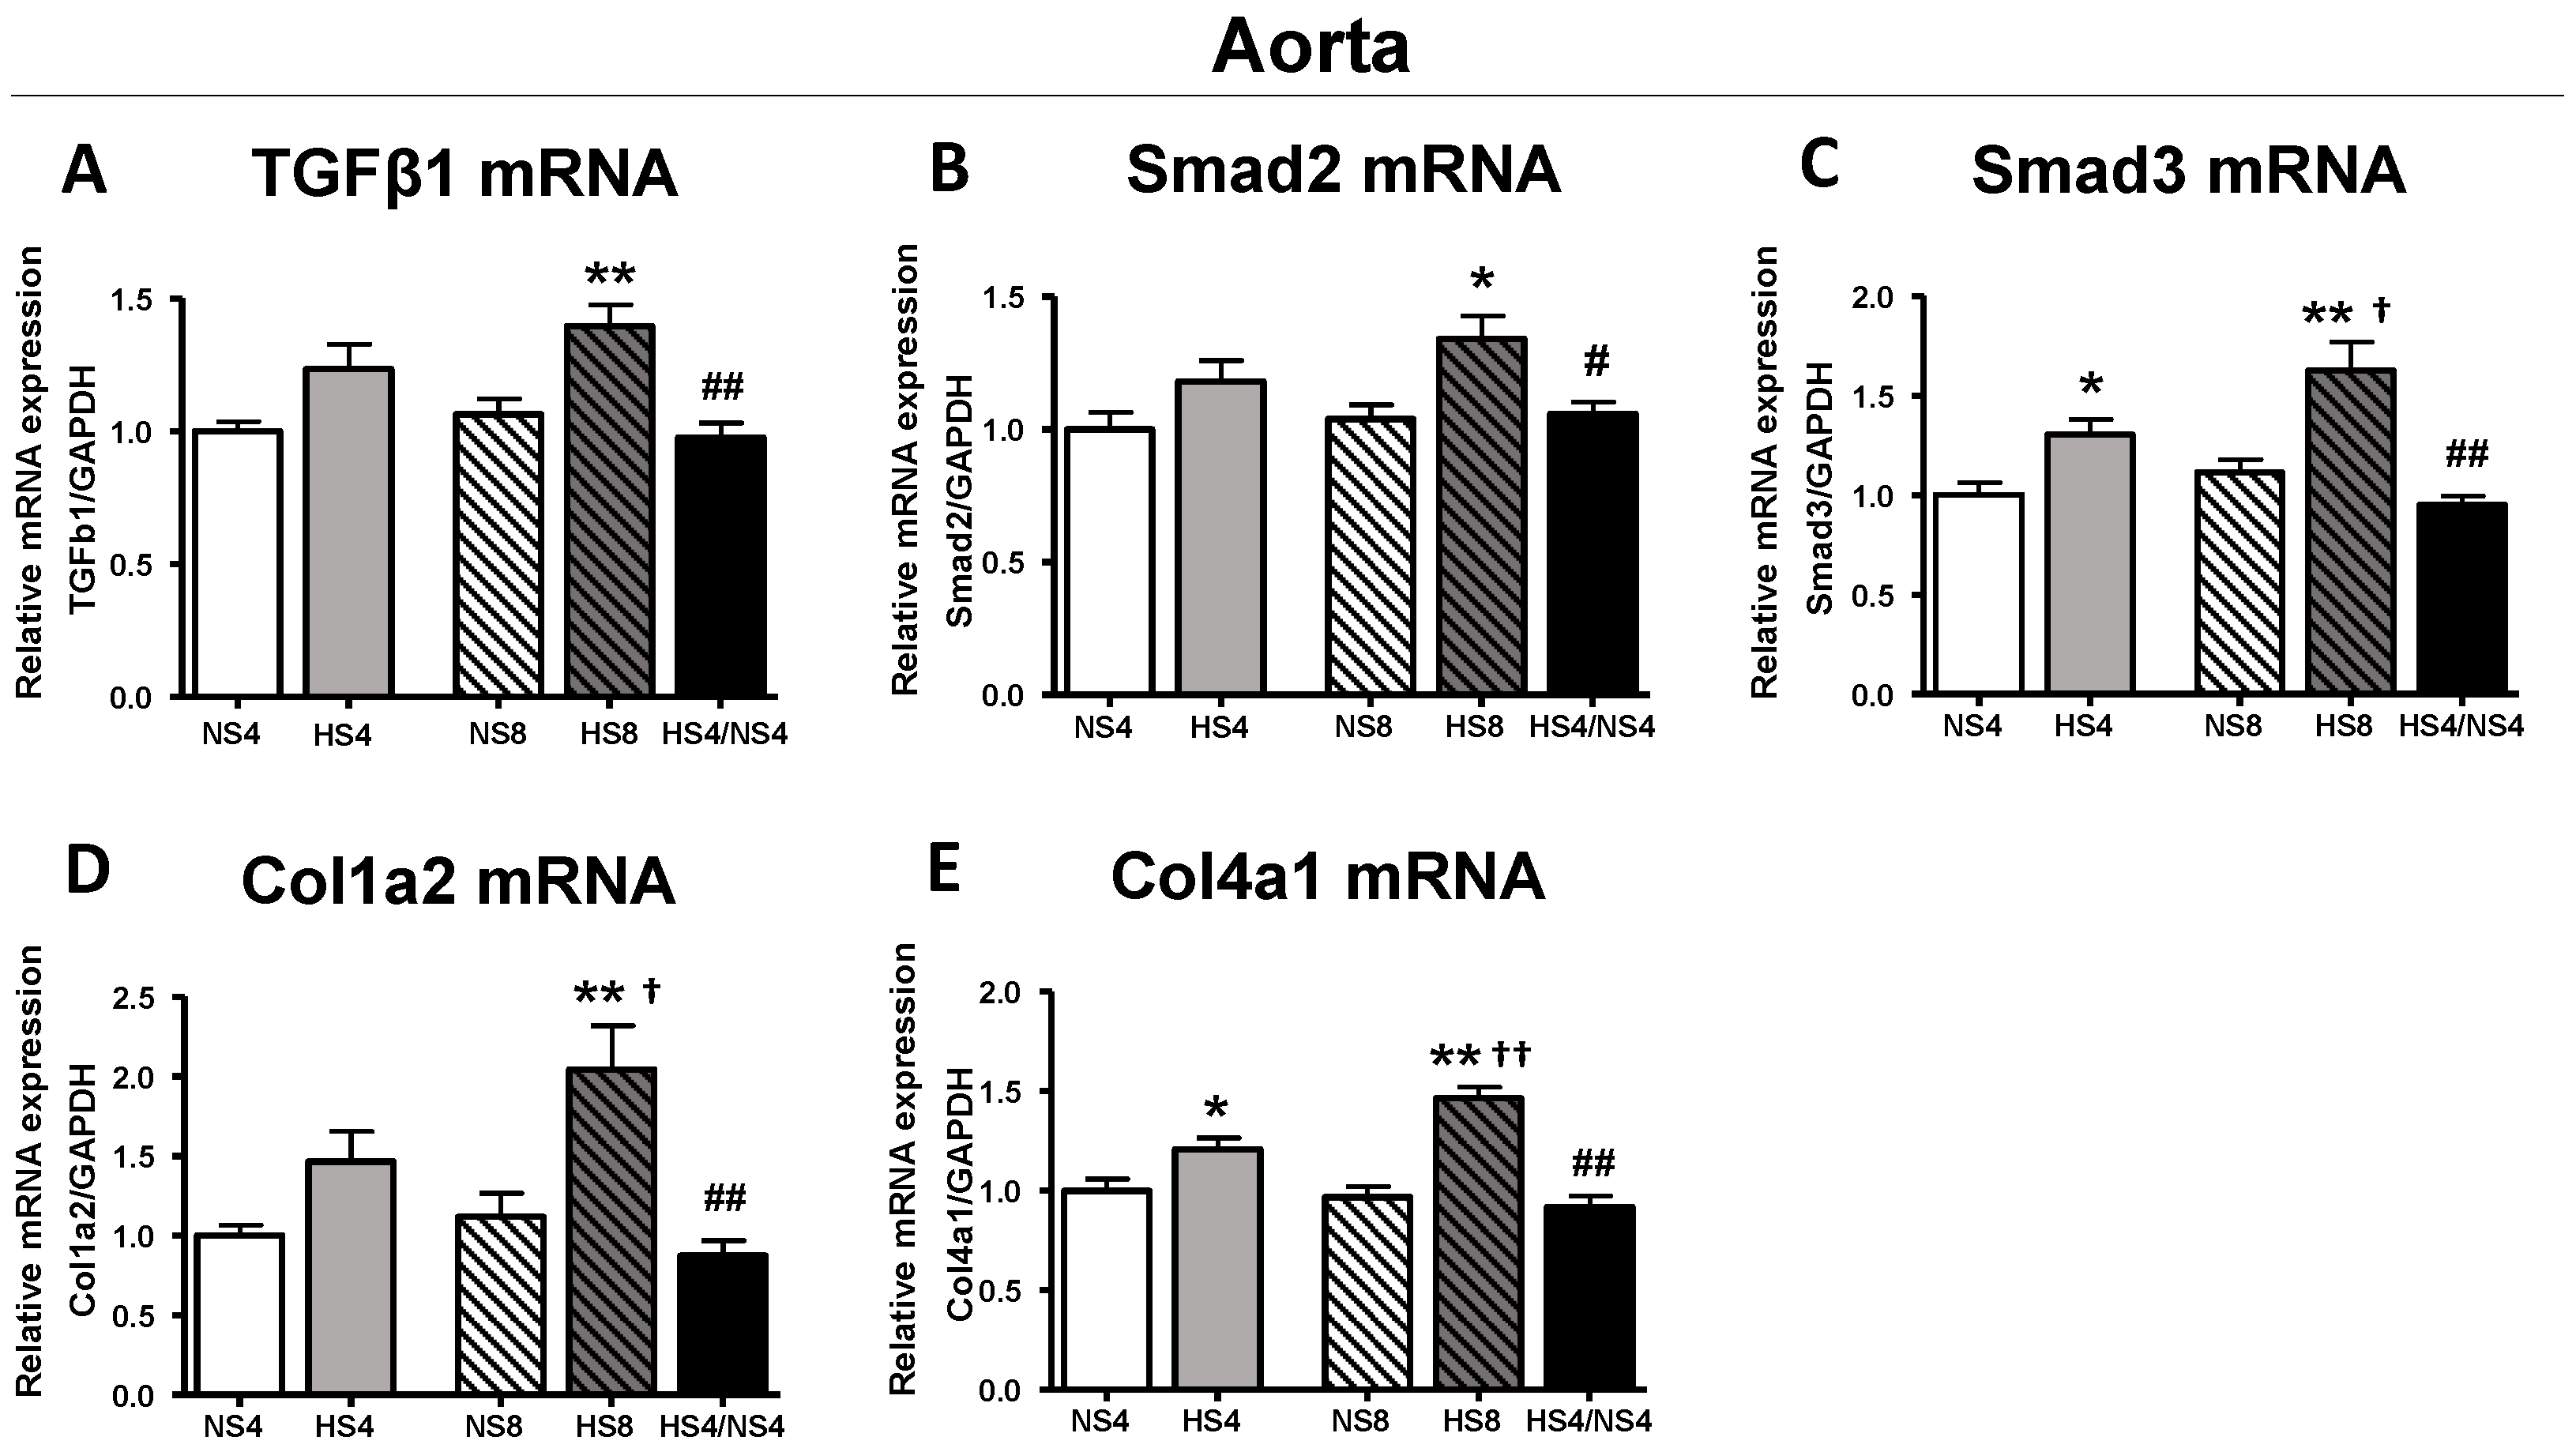
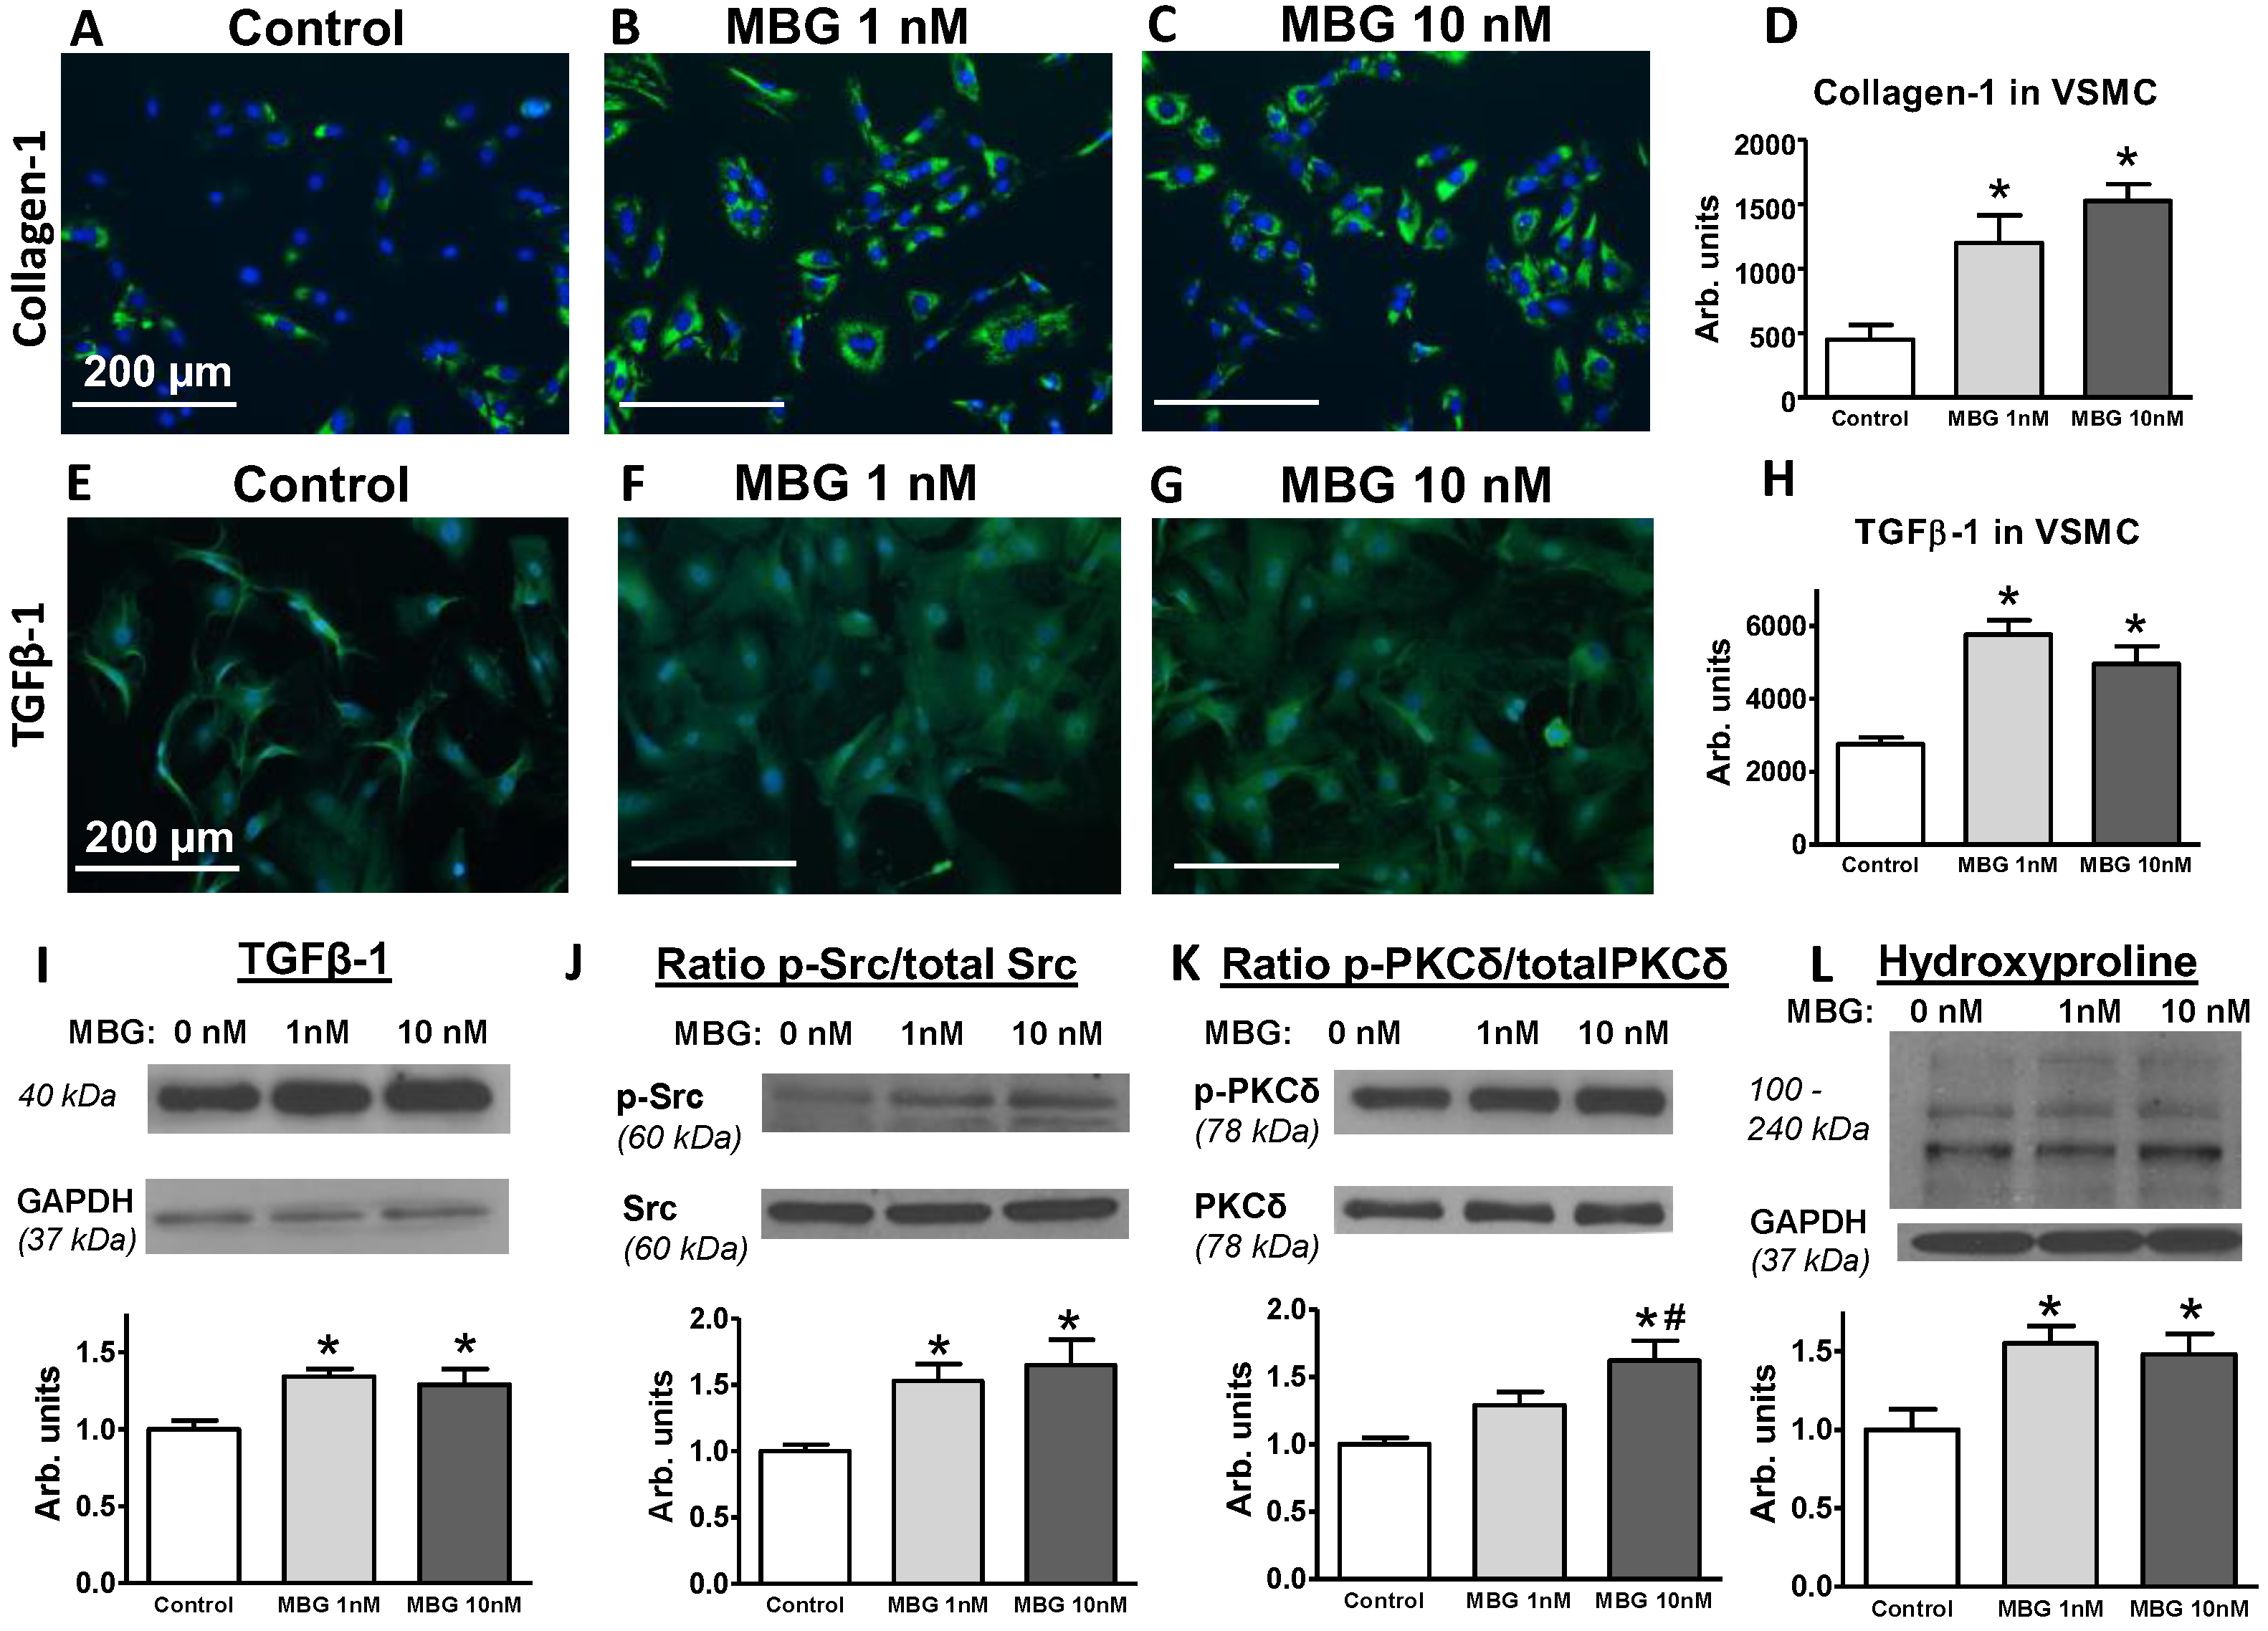
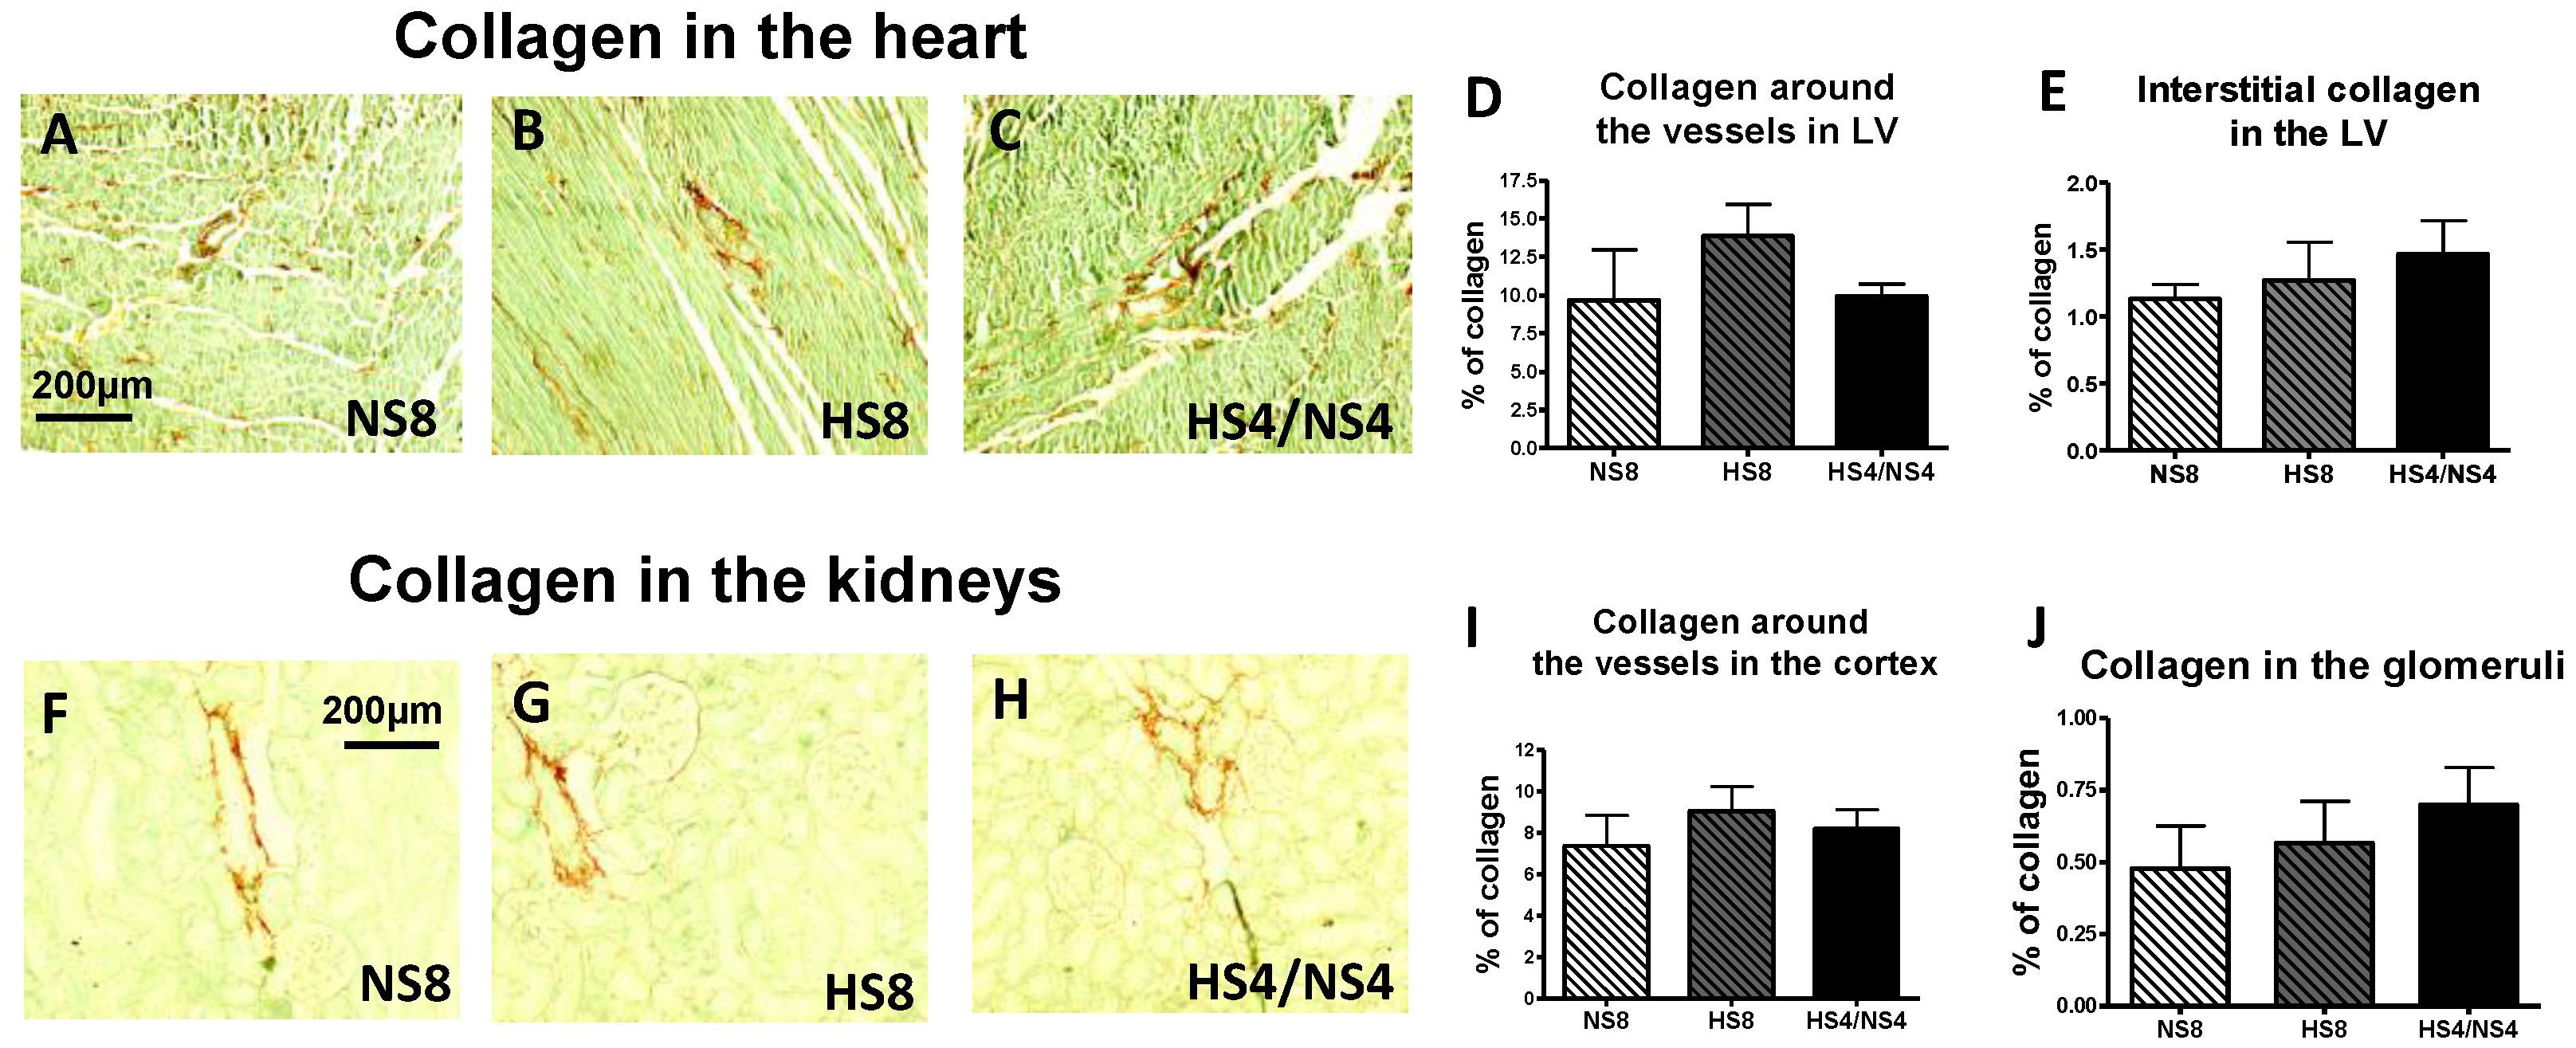
2. Results
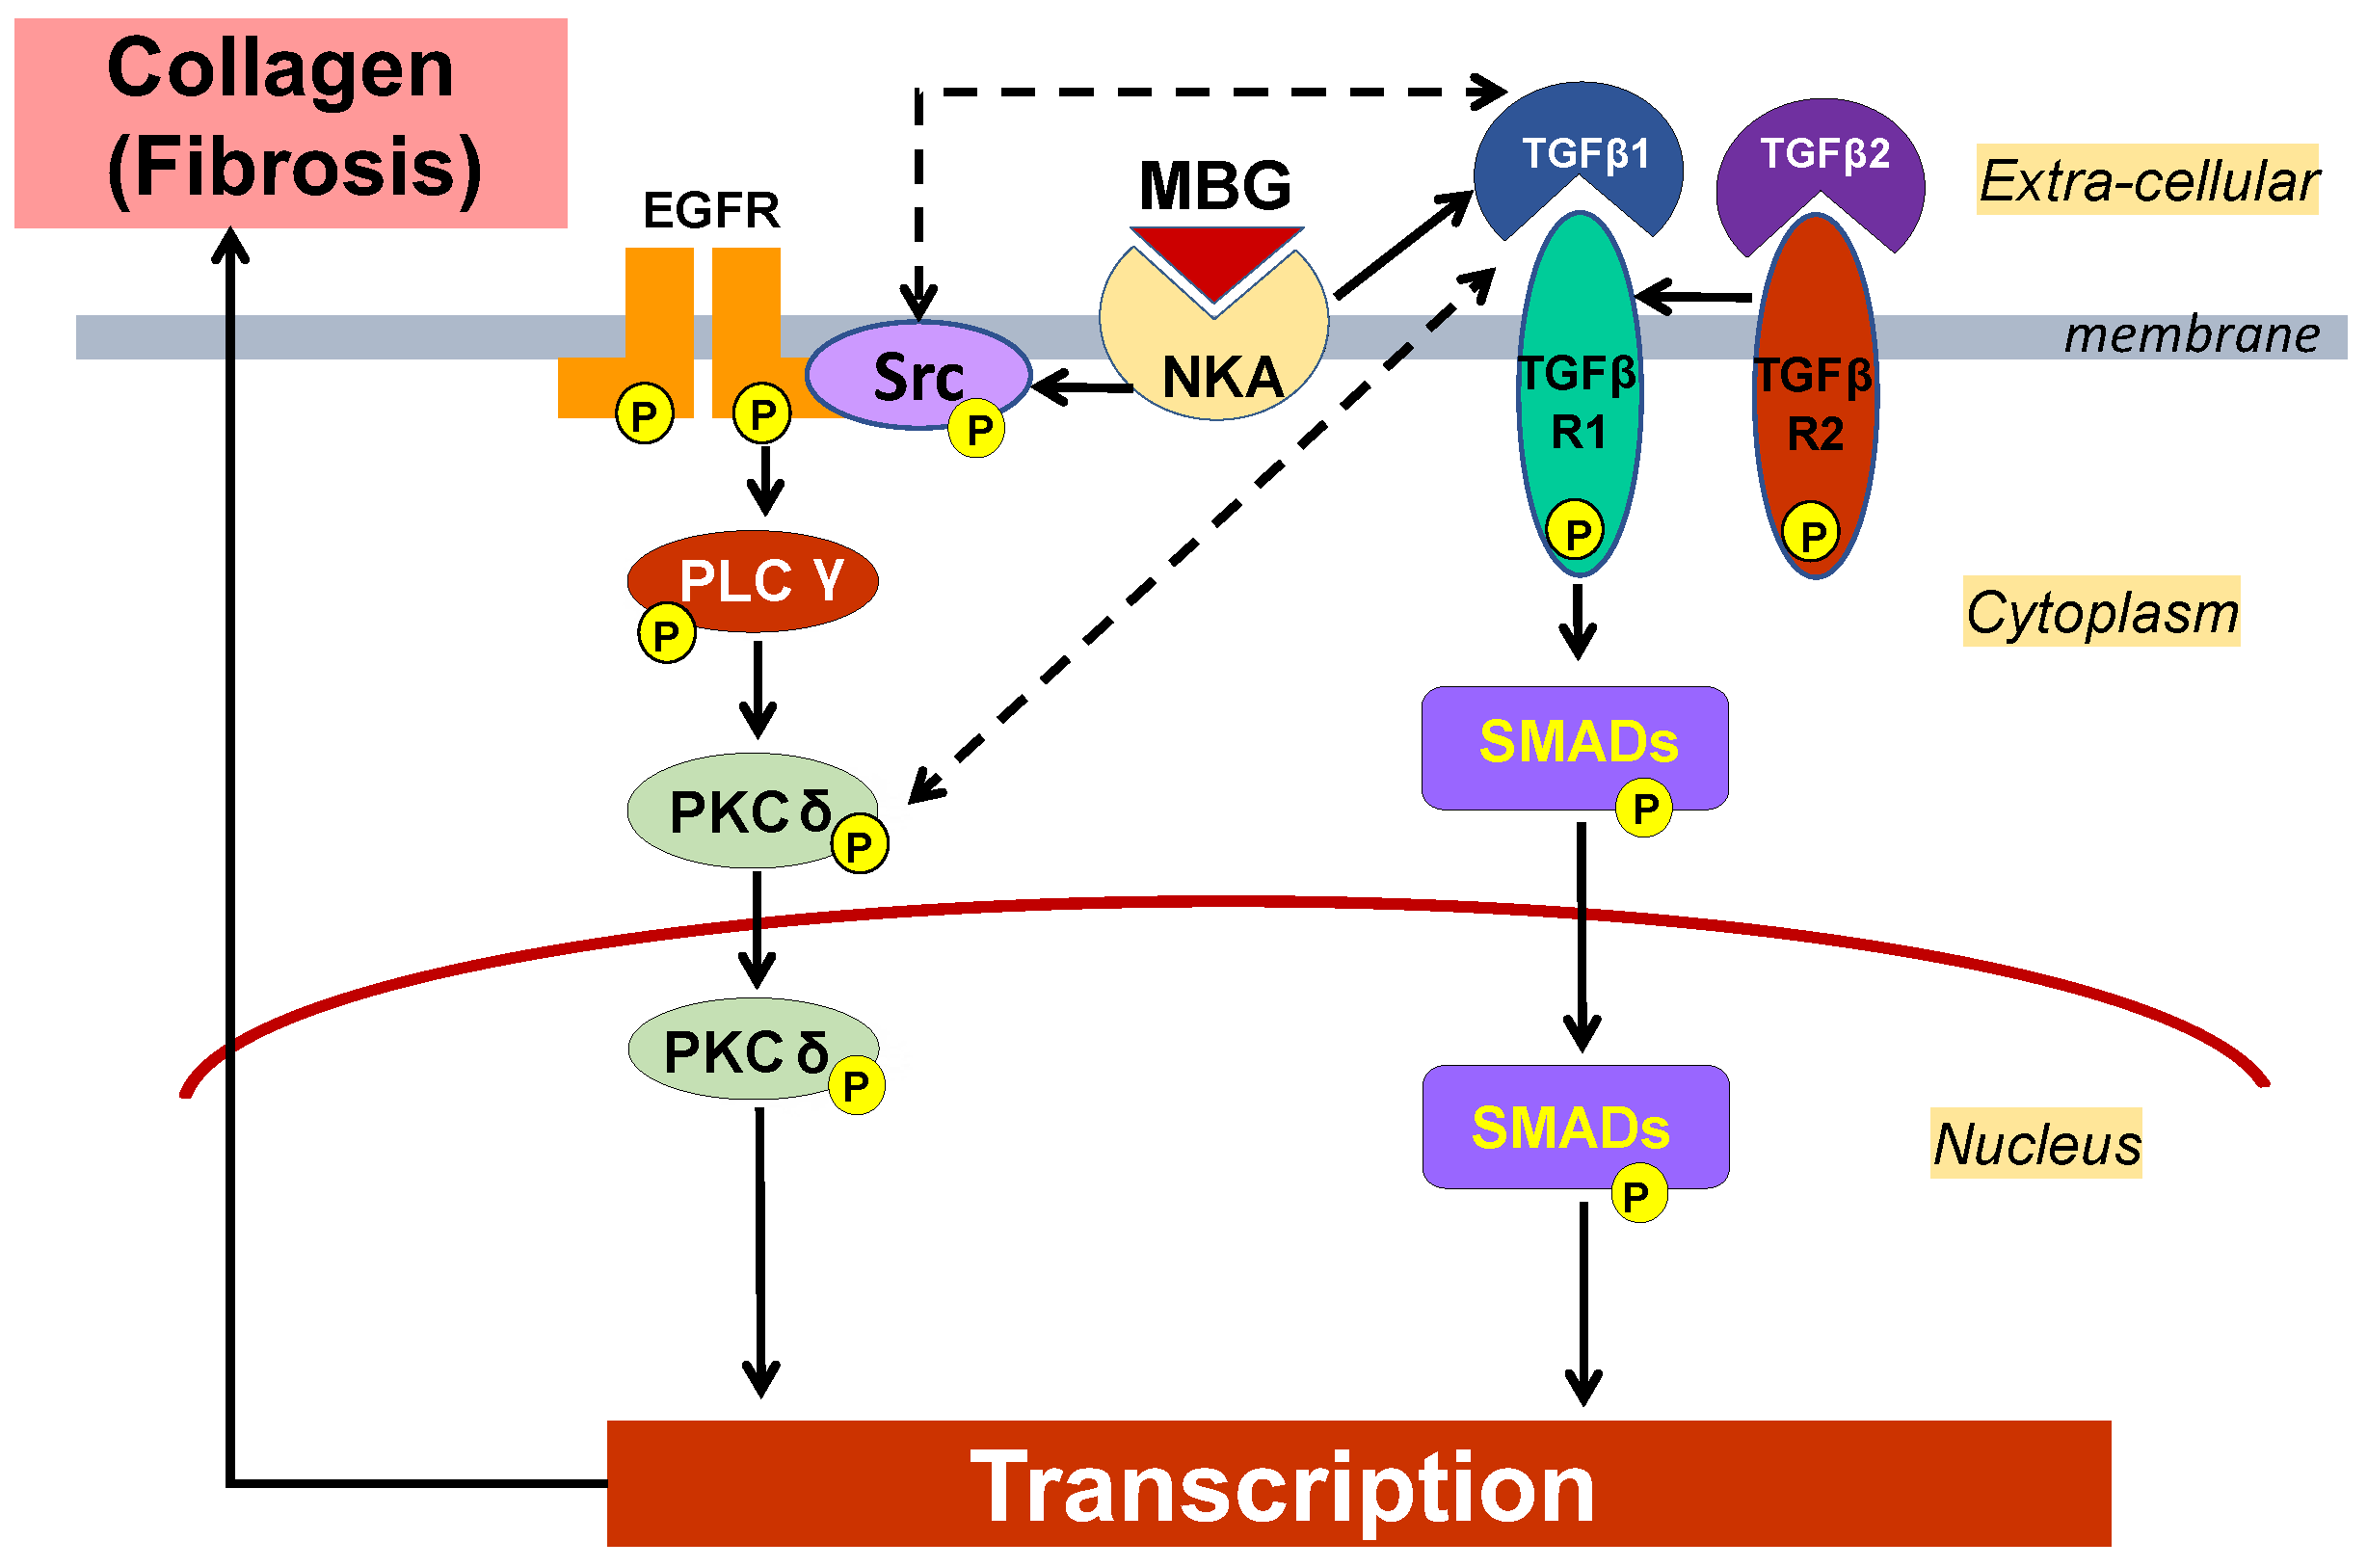
3. Discussion
4. Methods
4.1. Animal Study
4.2. Pulse Wave Velocity Measurement
4.3. Blood Pressure Measurement
4.4. Immunoassay
4.5. Electrolytes in Plasma and Urine
4.6. Creatinine and FENa
4.7. Histochemistry
4.8. Real-Time Quantitative PCR
4.9. Vascular Smooth Muscle Cell Culture
4.10. Western Blotting Analysis
4.11. Statistical Analysis
Author Contributions
Funding
Acknowledgments
Conflicts of Interest
References
- Weinberger, M.H.; Miller, J.Z.; Luft, F.C.; Grim, C.E.; Fineberg, N.S. Definitions and characteristics of sodium sensitivity and blood pressure resistance. Hypertension 1986, 8, 127–134. [Google Scholar] [CrossRef]
- Blanco, G.; Mercer, R.W. Isozymes of the Na-K-ATPase: Heterogeneity in structure, diversity in function. Am. J. Physiol. 1998, 275, F633–F650. [Google Scholar] [CrossRef] [PubMed]
- Gu, J.W.; Anand, V.; Shek, E.W.; Moore, M.C.; Brady, A.L.; Kelly, W.C.; Adair, T.H. Sodium induces hypertrophy of cultured myocardial myoblasts and vascular smooth muscle cells. Hypertension 1998, 31, 1083–1087. [Google Scholar] [CrossRef] [PubMed]
- De Wardener, H.E.; MacGregor, G.A. Sodium and blood pressure. Curr. Opin. Cardiol. 2002, 17, 360–367. [Google Scholar] [CrossRef] [PubMed]
- De Wardener, H.E.; MacGregor, G.A. Harmful effects of dietary salt in addition to hypertension. J. Hum. Hypertens. 2002, 16, 213–223. [Google Scholar] [CrossRef] [PubMed]
- Bagrov, A.Y.; Lakatta, E.G. The dietary sodium-blood pressure plot “ stiffens”. Hypertension 2004, 44, 22–24. [Google Scholar] [CrossRef] [PubMed]
- Sutton-Tyrrell, K.; Najjar, S.S.; Boudreau, R.M.; Venkitachalam, L.; Kupelian, V.; Simonsick, E.M.; Havlik, R.; Lakatta, E.G.; Spurgeon, H.; Kritchevsky, S.; et al. Elevated aortic pulse wave velocity, a marker of arterial stiffness, predicts cardiovascular events in well-functioning older adults. Circulation 2005, 111, 3384–3390. [Google Scholar] [CrossRef] [PubMed]
- Kaess, B.M.; Rong, J.; Larson, M.G.; Hamburg, N.M.; Vita, J.A.; Levy, D.; Benjamin, E.J.; Vasan, R.S.; Mitchell, G.F. Aortic stiffness, blood pressure progression, and incident hypertension. JAMA 2012, 308, 875–881. [Google Scholar] [CrossRef] [PubMed]
- Han, W.; Han, X.; Sun, N.; Chen, Y.; Jiang, S.; Li, M. Relationships between urinary electrolytes excretion and central hemodynamics, and arterial stiffness in hypertensive patients. Hypertens. Res. 2017, 40, 746–751. [Google Scholar] [CrossRef] [PubMed]
- Jablonski, K.L.; Fedorova, O.V.; Racine, M.L.; Geolfos, C.J.; Gates, P.E.; Chonchol, M.; Fleenor, B.S.; Lakatta, E.G.; Bagrov, A.Y.; Seals, D.R. Dietary sodium restriction and association with urinary marinobufagenin, blood pressure, and aortic stiffness. Clin. J. Am. Soc. Nephrol. 2013, 8, 1952–1959. [Google Scholar] [CrossRef] [PubMed]
- De Wardener, H.E.; Clarkson, E.M. Concept of natriuretic hormone. Physiol. Rev. 1985, 65, 658–759. [Google Scholar] [CrossRef] [PubMed]
- Hamlyn, J.M.; Hamilton, B.P.; Manunta, P. Endogenous ouabain, sodium balance and blood pressure: A review and a hypothesis. J. Hypertens. 1996, 14, 151–167. [Google Scholar] [CrossRef] [PubMed]
- Wasserstrom, J.A.; Aistrup, G.L. Digitalis: New actions for an old drug. Am. J. Physiol. Heart Circ. Physiol. 2005, 289, H1781–H1793. [Google Scholar] [CrossRef] [PubMed]
- Fedorova, O.V.; Agalakova, N.I.; Talan, M.I.; Lakatta, E.G.; Bagrov, A.Y. Brain ouabain stimulates peripheral marinobufagenin via angiotensin II signalling in NaCl-loaded Dahl-S rats. J. Hypertens. 2005, 23, 1515–1523. [Google Scholar] [CrossRef] [PubMed]
- Bagrov, A.Y.; Shapiro, J.I.; Fedorova, O.V. Endogenous cardiotonic steroids: Physiology, pharmacology, and novel therapeutic targets. Pharmacol. Rev. 2009, 61, 9–38. [Google Scholar] [CrossRef] [PubMed]
- Fedorova, O.V.; Zernetkina, V.I.; Shilova, V.Y.; Grigorova, Y.N.; Juhasz, O.; Wei, W.; Marshall, C.A.; Lakatta, E.G.; Bagrov, A.Y. Synthesis of an Endogenous Steroidal Na Pump Inhibitor Marinobufagenin, Implicated in Human Cardiovascular Diseases, Is Initiated by CYP27A1 via Bile Acid Pathway. Circ. Cardiovasc. Genet. 2015, 8, 736–745. [Google Scholar] [CrossRef] [PubMed]
- Fedorova, O.V.; Lakatta, E.G.; Bagrov, A.Y. Endogenous Na, K pump ligands are differentially regulated during acute NaCl loading of Dahl rats. Circulation 2000, 102, 3009–3014. [Google Scholar] [CrossRef] [PubMed]
- Fedorova, O.V.; Talan, M.I.; Agalakova, N.I.; Lakatta, E.G.; Bagrov, A.Y. Endogenous ligand of alpha(1) sodium pump, marinobufagenin, is a novel mediator of sodium chloride—Dependent hypertension. Circulation 2002, 105, 1122–1127. [Google Scholar] [CrossRef] [PubMed]
- Fedorova, O.V.; Shapiro, J.I.; Bagrov, A.Y. Endogenous cardiotonic steroids and salt-sensitive hypertension. Biochim. Biophys. Acta 2010, 1802, 1230–1236. [Google Scholar] [CrossRef] [PubMed]
- Nikitina, E.R.; Mikhailov, A.V.; Nikandrova, E.S.; Frolova, E.V.; Fadeev, A.V.; Shman, V.V.; Shilova, V.Y.; Tapilskaya, N.I.; Shapiro, J.I.; Fedorova, O.V.; et al. In preeclampsia endogenous cardiotonic steroids induce vascular fibrosis and impair relaxation of umbilical arteries. J. Hypertens. 2011, 29, 769–776. [Google Scholar] [CrossRef] [PubMed]
- Haller, S.T.; Drummond, C.A.; Yan, Y.; Liu, J.; Tian, J.; Malhotra, D.; Shapiro, J.I. Passive immunization against marinobufagenin attenuates renal fibrosis and improves renal function in experimental renal disease. Am. J. Hypertens. 2014, 27, 603–609. [Google Scholar] [CrossRef] [PubMed]
- Fedorova, O.V.; Emelianov, I.V.; Bagrov, K.A.; Grigorova, Y.N.; Wei, W.; Juhasz, O.; Frolova, E.V.; Marshall, C.A.; Lakatta, E.G.; Konradi, A.O.; et al. Marinobufagenin-induced vascular fibrosis is a likely target for mineralocorticoid antagonists. J. Hypertens. 2015, 33, 1602–1610. [Google Scholar] [CrossRef] [PubMed]
- Haas, M.; Askari, A.; Xie, Z. Involvement of Src and epidermal growth factor receptor in the signal-transducing function of Na+/K+-ATPase. J. Biol. Chem. 2000, 275, 27832–27837. [Google Scholar] [CrossRef] [PubMed]
- Liu, J.; Tian, J.; Haas, M.; Shapiro, J.I.; Askari, A.; Xie, Z. Ouabain interaction with cardiac Na+/K+-ATPase initiates signal cascades independent of changes in intracellular Na+ and Ca2+ concentrations. J. Biol. Chem. 2000, 275, 27838–27844. [Google Scholar] [PubMed]
- Xie, Z.; Askari, A. Na+/K+-ATPase as a signal transducer. Eur. J. Biochem. 2002, 269, 2434–2439. [Google Scholar] [CrossRef] [PubMed]
- Haas, M.; Wang, H.; Tian, J.; Xie, Z. Src-mediated inter-receptor cross-talk between the Na+/K+-ATPase and the epidermal growth factor receptor relays the signal from ouabain to mitogen-activated protein kinases. J. Biol. Chem. 2002, 277, 18694–18702. [Google Scholar] [CrossRef] [PubMed]
- Elkareh, J.; Periyasamy, S.M.; Shidyak, A.; Vetteth, S.; Schroeder, J.; Raju, V.; Hariri, I.M.; El-Okdi, N.; Gupta, S.; Fedorova, L.; et al. Marinobufagenin induces increases in procollagen expression in a process involving protein kinase C and Fli-1: Implications for uremic cardiomyopathy. Am. J. Physiol. Ren. Physiol. 2009, 296, F1219–F1226. [Google Scholar] [CrossRef] [PubMed]
- Ying, W.Z.; Sanders, P.W. Dietary salt intake activates MAP kinases in the rat kidney. FASEB J. 2002, 16, 1683–1684. [Google Scholar] [CrossRef] [PubMed]
- Ying, W.Z.; Aaron, K.; Wang, P.X.; Sanders, P.W. Potassium inhibits dietary salt-induced transforming growth factor-beta production. Hypertension 2009, 54, 1159–1163. [Google Scholar] [CrossRef] [PubMed]
- Ying, W.Z.; Aaron, K.; Sanders, P.W. Mechanism of dietary salt-mediated increase in intravascular production of TGF-beta1. Am. J. Physiol. Renal Physiol. 2008, 295, F406–F414. [Google Scholar] [CrossRef] [PubMed]
- Tobian, L.; Hanlon, S. High sodium chloride diets injure arteries and raise mortality without changing blood pressure. Hypertension 1990, 15, 900–903. [Google Scholar] [CrossRef] [PubMed]
- Grigorova, Y.N.; Juhasz, O.; Zernetkina, V.; Fishbein, K.W.; Lakatta, E.G.; Fedorova, O.V.; Bagrov, A.Y. Aortic Fibrosis, Induced by High Salt Intake in the Absence of Hypertensive Response, is Reduced by a Monoclonal Antibody to Marinobufagenin. Am. J. Hypertens. 2016, 29, 641–646. [Google Scholar] [CrossRef] [PubMed]
- Fedorova, O.V.; Anderson, D.E.; Lakatta, E.G.; Bagrov, A.Y. Interaction of NaCl and behavioral stress on endogenous sodium pump ligands in rats. Am. J. Physiol. Regul. Integr. Comp. Physiol. 2001, 281, R352–R358. [Google Scholar] [CrossRef] [PubMed]
- Bagrov, A.Y.; Agalakova, N.I.; Kashkin, V.A.; Fedorova, O.V. Endogenous cardiotonic steroids and differential patterns of sodium pump inhibition in NaCl-loaded salt-sensitive and normotensive rats. Am. J. Hypertens. 2009, 22, 559–563. [Google Scholar] [CrossRef] [PubMed]
- Frohlich, E.D.; Chien, Y.; Sesoko, S.; Pegram, B.L. Relationship between dietary sodium intake, hemodynamics, and cardiac mass in SHR and WKY rats. Am. J. Physiol. 1993, 264, R30–R34. [Google Scholar] [CrossRef] [PubMed]
- Washino, S.; Hosohata, K.; Jin, D.; Takai, S.; Miyagawa, T. Early urinary biomarkers of renal tubular damage by a high-salt intake independent of blood pressure in normotensive rats. Clin. Exp. Pharmacol. Physiol. 2018, 45, 261–268. [Google Scholar] [CrossRef] [PubMed]
- Strauss, M.; Smith, W.; Wei, W.; Fedorova, O.V.; Schutte, A.E. Marinobufagenin is related to elevated central and 24-h systolic blood pressures in young black women: The African-PREDICT study. Hypertens. Res. 2018, 41, 183–192. [Google Scholar] [CrossRef] [PubMed]
- Schoner, W.; Scheiner-Bobis, G. Role of endogenous cardiotonic steroids in sodium homeostasis. Nephrol. Dial. Transplantat. 2008, 23, 2723–2729. [Google Scholar] [CrossRef] [PubMed]
- Hamlyn, J.M.; Blaustein, M.P. Sodium chloride, extracellular fluid volume, and blood pressure regulation. Am. J. Physiol. 1986, 251, F563–F575. [Google Scholar] [CrossRef] [PubMed]
- Blaustein, M.P.; Ashida, T.; Goldman, W.F.; Wier, W.G.; Hamlyn, J.M. Sodium/calcium exchange in vascular smooth muscle: A link between sodium metabolism and hypertension. Ann. N. Y. Acad. Sci. 1986, 488, 199–216. [Google Scholar] [CrossRef] [PubMed]
- Feng, W.; Ying, W.Z.; Aaron, K.J.; Sanders, P.W. Transforming growth factor-beta mediates endothelial dysfunction in rats during high salt intake. Am. J. Physiol. Ren. Physiol. 2015, 309, F1018–F1025. [Google Scholar] [CrossRef] [PubMed]
- Habibi, J.; Hayden, M.R.; Ferrario, C.M.; Sowers, J.R.; Whaley-Connell, A.T. Salt Loading Promotes Kidney Injury via Fibrosis in Young Female Ren2 Rats. Cardiorenal Med. 2014, 4, 43–52. [Google Scholar] [CrossRef] [PubMed]
- Elkareh, J.; Kennedy, D.J.; Yashaswi, B.; Vetteth, S.; Shidyak, A.; Kim, E.G.; Smaili, S.; Periyasamy, S.M.; Hariri, I.M.; Fedorova, L.; et al. Marinobufagenin stimulates fibroblast collagen production and causes fibrosis in experimental uremic cardiomyopathy. Hypertension 2007, 49, 215–224. [Google Scholar] [CrossRef] [PubMed]
- Atfi, A.; Drobetsky, E.; Boissonneault, M.; Chapdelaine, A.; Chevalier, S. Transforming growth factor beta down-regulates Src family protein tyrosine kinase signaling pathways. J. Biol. Chem. 1994, 269, 30688–30693. [Google Scholar] [PubMed]
- Yakymovych, I.; Ten Dijke, P.; Heldin, C.H.; Souchelnytskyi, S. Regulation of Smad signaling by protein kinase C. FASEB J. 2001, 15, 553–555. [Google Scholar] [CrossRef] [PubMed]
- Runyan, C.E.; Schnaper, H.W.; Poncelet, A.C. Smad3 and PKCdelta mediate TGF-beta1-induced collagen I expression in human mesangial cells. Am. J. Physiol. Ren. Physiol. 2003, 285, F413–F422. [Google Scholar] [CrossRef] [PubMed]
- Ryer, E.J.; Hom, R.P.; Sakakibara, K.; Nakayama, K.I.; Nakayama, K.; Faries, P.L.; Liu, B.; Kent, K.C. PKCdelta is necessary for Smad3 expression and transforming growth factor beta-induced fibronectin synthesis in vascular smooth muscle cells. Arterioscler. Thromb. Vasc. Biol. 2006, 26, 780–786. [Google Scholar] [CrossRef] [PubMed]
- Galliher, A.J.; Schiemann, W.P. Src phosphorylates Tyr284 in TGF-beta type II receptor and regulates TGF-beta stimulation of p38 MAPK during breast cancer cell proliferation and invasion. Cancer Res. 2007, 67, 3752–3758. [Google Scholar] [CrossRef] [PubMed]
- Zhang, H.; Davies, K.J.; Forman, H.J. TGFbeta1 rapidly activates Src through a non-canonical redox signaling mechanism. Arch. Biochem. Biophys. 2015, 568, 1–7. [Google Scholar] [CrossRef] [PubMed]
- Fedorova, O.V.; Simbirtsev, A.S.; Kolodkin, N.I.; Kotov, A.Y.; Agalakova, N.I.; Kashkin, V.A.; Tapilskaya, N.I.; Bzhelyansky, A.; Reznik, V.A.; Frolova, E.V.; et al. Monoclonal antibody to an endogenous bufadienolide, marinobufagenin, reverses preeclampsia-induced Na/K-ATPase inhibition and lowers blood pressure in NaCl-sensitive hypertension. J. Hypertens. 2008, 26, 2414–2425. [Google Scholar] [CrossRef] [PubMed]


| NS4 (n = 8) | NS8 (n = 8) | HS4 (n = 8) | HS8 (n = 8) | HS4/NS4 (n = 8) | |
|---|---|---|---|---|---|
| Body weight (g) | 472 ± 7 | 519 ± 13 | 514 ± 30 | 547 ± 17 | 553 ± 18 |
| SBP (mmHg) | 126 ± 4 | 128 ± 7 | 125 ± 5 | 126 ± 6 | 121 ± 4 |
| Heart rate (beats/min) | 336 ± 37 | 366 ± 8 | 342 ± 6 | 343 ± 9 | 345 ± 11 |
| Urine volume (mL/kg BW) | 23.8 ± 0.9 | 44.9 ± 5.1 | 62.8 ± 5.3 * | 64.2 ± 11.6 | 27.6 ± 3.9 † |
| Urinary Na (mmol/24 h/kg BW) | 2.9 ± 0.4 | 2.3 ± 0.4 | 30.6 ± 6.6 * | 33.4 ± 3.3 # | 2.8 ± 0.5 † |
| Plasma Na (mmol/L) | 141.0 ± 0.7 | 140.0 ± 0.2 | 141.0 ± 0.5 | 141.1 ± 0.5 | 140.2 ± 0.3 |
| Plasma K (mmol/L) | 4.5 ± 0.1 | 4.7 ± 0.1 | 4.4 ± 0.1 | 4.8 ± 0.2 | 4.5 ± 0.1 |
| Aortic weights (g/mm/kg BW) | 2.44 ± 0.08 | 2.58 ± 0.05 | 2.68 ± 0.12 | 2.86 ± 0.2 | 2.63 ± 0.1 |
| NS4 (n = 8) | NS8 (n = 8) | HS4 (n = 8) | HS8 (n = 8) | HS4/NS4 (n = 8) | |
|---|---|---|---|---|---|
| Urinary Na, mmol/24 h | 1.48 ± 0.21 | 1.29 ± 0.25 | 15.3 ± 3.2 ** | 18.4 ± 2.0 ## | 1.57 ± 0.31 †† |
| Plasma Na, mmol/L | 141.0 ± 0.7 | 140.0 ± 0.2 | 141.0 ± 0.5 | 141.1 ± 0.5 | 140.2 ± 0.3 |
| Urine creatinine, mg/dL | 196 ± 12 | 100 ± 17 | 76 ± 15 ** | 64 ± 11 | 217 ± 29 †† |
| Plasma Creatinine, mg/dL | 0.33 ± 0.02 | 0.38 ± 0.03 | 0.35 ± 0.03 | 0.37 ± 0.02 | 0.37 ± 0.02 |
| Urine volume, mL | 11.3 ± 0.4 | 23.0 ± 2.6 | 31.8 ± 2.3 ** | 35.5 ± 6.9 ## | 15 ± 1.9 †† |
| Creatinine clearance, mL/min | 4.7 ± 0.4 | 4.1 ± 0.5 | 4.0 ± 0.9 | 4.22 ± 1.1 | 5.2 ± 0.4 |
| FeNa, % | 0.08 ± 0.03 | 0.15 ± 0.03 | 2.5 ± 0.51 * | 3.16 ± 1.34 ## | 0.15 ± 0.02 †† |
© 2018 by the authors. Licensee MDPI, Basel, Switzerland. This article is an open access article distributed under the terms and conditions of the Creative Commons Attribution (CC BY) license (http://creativecommons.org/licenses/by/4.0/).
Share and Cite
Grigorova, Y.N.; Wei, W.; Petrashevskaya, N.; Zernetkina, V.; Juhasz, O.; Fenner, R.; Gilbert, C.; Lakatta, E.G.; Shapiro, J.I.; Bagrov, A.Y.; et al. Dietary Sodium Restriction Reduces Arterial Stiffness, Vascular TGF-β-Dependent Fibrosis and Marinobufagenin in Young Normotensive Rats. Int. J. Mol. Sci. 2018, 19, 3168. https://doi.org/10.3390/ijms19103168
Grigorova YN, Wei W, Petrashevskaya N, Zernetkina V, Juhasz O, Fenner R, Gilbert C, Lakatta EG, Shapiro JI, Bagrov AY, et al. Dietary Sodium Restriction Reduces Arterial Stiffness, Vascular TGF-β-Dependent Fibrosis and Marinobufagenin in Young Normotensive Rats. International Journal of Molecular Sciences. 2018; 19(10):3168. https://doi.org/10.3390/ijms19103168
Chicago/Turabian StyleGrigorova, Yulia N., Wen Wei, Natalia Petrashevskaya, Valentina Zernetkina, Ondrej Juhasz, Rachel Fenner, Christian Gilbert, Edward G. Lakatta, Joseph I. Shapiro, Alexei Y. Bagrov, and et al. 2018. "Dietary Sodium Restriction Reduces Arterial Stiffness, Vascular TGF-β-Dependent Fibrosis and Marinobufagenin in Young Normotensive Rats" International Journal of Molecular Sciences 19, no. 10: 3168. https://doi.org/10.3390/ijms19103168
APA StyleGrigorova, Y. N., Wei, W., Petrashevskaya, N., Zernetkina, V., Juhasz, O., Fenner, R., Gilbert, C., Lakatta, E. G., Shapiro, J. I., Bagrov, A. Y., & Fedorova, O. V. (2018). Dietary Sodium Restriction Reduces Arterial Stiffness, Vascular TGF-β-Dependent Fibrosis and Marinobufagenin in Young Normotensive Rats. International Journal of Molecular Sciences, 19(10), 3168. https://doi.org/10.3390/ijms19103168